April 2024 Market Report

Q2 May See the Hottest Market Since the Peak of the Pandemic Boom
Ever since the beginning of the year, and now moving into the spring selling season, striking shifts in supply and demand have occurred and continued to accelerate, resulting in a dramatic leap in the heat and competitiveness of market conditions. Based on current indicators, and what is being experienced on the ground as new listings arrive on the market, deals are negotiated, and homes go into contract, it appears almost certain that significant home price increases will continue in Q2 2024.
Macroeconomic Conditions
In the 8 weeks through early April, the weekly average, 30-year conforming-loan interest rate has oscillated between 6.74% and 6.94%: Up from January, but still well down from last fall. In the last month, the S&P 500 & Nasdaq stock market indices continued to hit new all-time highs, with substantial effects on household wealth. After the big jump in December-January, consumer confidence is at its highest point in almost 3 years. Monthly inflation rates have remained stable since October, ranging from 3.1% to 3.3%: Higher than the Fed’s 2% goal, but reductions in its benchmark rate later this year are still commonly expected. Both the latest national and San Francisco unemployment readings, at 3.8%, remain close to historic lows.
Listings Accepting Offers (Going into Contract)

Residential activity reported to MLS, per Broker Metrics. Data from sources deemed reliable, but may contain errors and subject to revision. All numbers approximate, and may change with late-reported activity.
The # of listings going into contract measures buyer demand, but is also deeply impacted by the supply of new listings available to buy.
The March 2024 number of listings going into contract (pending sale) was the highest since mid-2022, an illustration of the rapid heating of the market this spring. This statistic is the most up-to-date indicator of buyer demand.
Percentage of Listings Accepting Offers
San Francisco: Absorption Rate by Month

*SFARMLS reported data, per Broker Metrics. Not all new-condo project activity is reported to MLS. Last month’s data estimated using available data, may change with late reported activity. Data from sources deemed reliable but may contain errors and subject to revision. All numbers approximate.
Absorption rate measures buyer demand vs. the supply of listings for sale: The higher the percentage, the more heated and competitive the market.
Absorption rates for both houses (yellow columns) and condos (brown line) have recently seen huge jumps, and are now at their highest points in years.
San Francisco House Price Trends
Median House Sales Prices, 2012 – Present, by Quarter

As reported to NORCAL MLS® ALLIANCE, per Broker Metrics or Infosparks. All numbers are approximate and subject to revision. Last quarter may change with late reported sales.
Median sales price is that price where half the homes sold for more and half for less. It is a very general statistic that disguises a wide range of prices in the underlying sales.
Year over year, the Q1 2024 SF median house sales price was up 7.5%.
Seasonal fluctuations are common, and it’s not unusual for median sales prices to peak for the year in Q2. Sales prices lag changes in market conditions by 3 to 6 weeks.
San Francisco Condo Price Appreciation
Median Condo Sales Prices, 2012 – Present, by Quarter

As reported to NORCAL MLS® ALLIANCE, per Broker Metrics/Infosparks. All numbers are approximate and subject to revision. Last quarter may change with late reported activity. Does not include new-project condo sales unreported to MLS.
Year over year, the Q1 2024 median condo sales price was up 3.5%.
Seasonal fluctuations are common. It is not unusual for median sales prices to peak for the calendar year in Q2. Sales prices lag changes in market conditions by 3 to 6 weeks. Different city districts have seen varying median price trends.
San Francisco CONDO Prices: Downtown vs. Non-Downtown
3-Month-Rolling, Median Condo Sales Prices since 2005*

*6-month rolling median condo sales values reported to NorCal MLS Alliance, per Infosparks. Analysis may contain errors and subject to revision. Does not include new-project sales unreported to MLS. All numbers approximate, and may change with late-reported sales.
Comparing median condo sales prices in the greater Downtown/South of Market/Civic Center area (the center of large-project, new-condo construction, office buildings and high-tech employment) – delineated by the orange line – with the rest of San Francisco (mostly smaller, older buildings, in less urban environments) – delineated by the white line.
Median condo sales prices in San Francisco have rebounded dramatically in 2024, and are now running higher year over year. Interestingly, the downtown condo market has rebounded more aggressively than the rest of the city. Perhaps most notably, the Mira Tower, that twisty building at 280 Spear Street, is nearly sold out.
San Francisco Value Trends since 2005
3-Month Rolling, Median Dollar per Square Foot Values*

*3-month rolling median house sales values reported to NorCal MLS Alliance, per Infosparks. Analysis may contain errors and subject to revision. All numbers approximate, and may change with late-reported sales.
Median $/sq.ft. value is a general statistic, disguising an enormous range of values in the underlying sales. It is often affected by other factors besides changes in fair market value. Monthly and seasonal fluctuations are common, which explain many of the regular ups and downs in this chart. SF is the only Bay Area market in which $/sq.ft. values are often higher for condos than for houses.
Bay Area Median House Values by County
Early Spring 2024 Update: By Bedroom/Bath Count*
| 4 Bedroom, 3 Bath Houses | 5+ Bedroom, 4+ Bath Houses, 3000+ sq.ft. | ||||||
|---|---|---|---|---|---|---|---|
| County In alphabetical order |
Median Sales Price | Median Square Footage | Median Dollar per Square Foot | Median Sales Price | Median Sq.Ft./ Median Lot Size | Median Dollar per Square Foot | |
| Alameda County | $1,582,500 | 2211 sq.ft. | $701/sq.ft. | $2,555,000 | 3859 sq.ft. .25 acre lot |
$667/sq.ft. | |
| Contra Costa | $955,000 | 2311 sq.ft. | $441/sq.ft. | $2,100,000 | 3708 sq.ft. .24 acre lot |
$561/sq.ft. | |
| Marin County | $1,872,500 | 2417 sq.ft. | $772/sq.ft. | $4,025,000 | 4452 sq.ft. .6 acre lot |
$874/sq.ft. | |
| Monterey County | $950,000 | 2320 sq.ft. | $428/sq.ft. | $3,200,000 | 4500 sq.ft. 1.8 acre lot |
$711/sq.ft. | |
| Napa County | $1,250,000 | 2350 sq.ft. | $539/sq.ft. | $3,730,000 | 5359 sq.ft. 1.6 acre lot |
$715/sq.ft. | |
| San Francisco | $1,905,000 | 2272 sq.ft. | $878/sq.ft. | $4,550,000 | 4256 sq.ft. .08 acre lot |
$1079/sq.ft. | |
| San Mateo County | $2,400,000 | 2380 sq.ft. | $1012/sq.ft. | $5,722,500 | 4314 sq.ft. .45 acre lot |
$1361/sq.ft. | |
| Santa Clara County | $1,910,000 | 2166 sq.ft. | $934/sq.ft. | $4,000,000 | 3837 sq.ft. .4 acre lot |
$963/sq.ft. | |
| Santa Cruz County | $1,645,000 | 2418 sq.ft. | $645/sq.ft. | $2,237,500 | 3899 sq.ft. 2.4 acre lot |
$583/sq.ft. | |
| Solano County | $689,500 | 2168 sq.ft. | $315/sq.ft. | $940,000 | 3507 sq.ft. .2 acre lot |
$275/sq.ft. | |
| Sonoma County | $950,000 | 2250 sq.ft. | $439/sq.ft. | $2,200,000 | 3985 sq.ft. .5 acre lot |
$478/sq.ft. |
| 2 Bedroom, 1-2 Bath Houses | 3 Bedroom, 2- 2½ Bath Houses | ||||||
|---|---|---|---|---|---|---|---|
| County In alphabetical order |
Median Sales Price | Median Square Footage | Median Dollar per Square Foot | Median Sales Price | Median Sq.Ft. | Median Dollar per Square Foot | |
| Alameda County | $825,000 | 1050 sq.ft. | $788/sq.ft. | $1,200,000 | 1474 sq.ft. | $785/sq.ft. | |
| Contra Costa | $618,500 | 1041 sq.ft. | $559/sq.ft. | $744,000 | 1530 sq.ft. | $506/sq.ft. | |
| Marin County | $1,495,000 | 1190 sq.ft. | $1103/sq.ft. | $1,486,000 | 1701 sq.ft. | $887/sq.ft. | |
| Monterey County | $858,000 | 1088 sq.ft. | $754/sq.ft. | $850,000 | 1572 sq.ft. | $535/sq.ft. | |
| Napa County | $700,000 | 1149 sq.ft. | $697/sq.ft. | $850,000 | 1510 sq.ft. | $607/sq.ft. | |
| San Francisco | $1,250,000 | 1200 sq.ft. | $1073/sq.ft. | $1,575,000 | 1700 sq.ft. | $956/sq.ft. | |
| San Mateo County | $1,312,500 | 1080 sq.ft. | $1212/sq.ft. | $1,678,000 | 1547 sq.ft. | $1098/sq.ft. | |
| Santa Clara County | $1,175,000 | 1035 sq.ft. | $1099/sq.ft. | $1,635,000 | 1471 sq.ft. | $1130/sq.ft. | |
| Santa Cruz County | $907,500 | 1009 sq.ft. | $814/sq.ft. | $1,205,000 | 1584 sq.ft. | $719/sq.ft. | |
| Solano County | $440,000 | 1208 sq.ft. | $356/sq.ft. | $560,000 | 1524 sq.ft. | $373/sq.ft. | |
| Sonoma County | $700,000 | 1210 sq.ft. | $578/sq.ft. | $800,000 | 1626 sq.ft. | $514/sq.ft. |
*Sales reported to NorCal MLS Alliance during the 6 months through late March 2024. Counties contain submarkets of widely varying values. Median values fluctuate for reasons besides changes in fair market value. Data from sources deemed reliable, but may contain errors and subject to revision. “Fixer-uppers” excluded. Numbers approximate, and may change with late reported sales. Not all sales are reported to MLS.
Active & Coming-Soon Listings on 1st of Month*
San Francisco Homes Market

* Houses, condos, co-ops, TICs, townhouses: Active/Coming-Soon listings posted to NorCal MLS Alliance. Does not include new-project condos not listed on MLS. Data from sources deemed reliable, but may contain errors and subject to revision. All numbers approximate. The # of active listings changes constantly.
Of the listings for sale on April 1, 2024, 27% were houses, and 73% were condos, co-ops, TICs & townhouses.*
The # of active listings on a given day is affected by 1) the # of new listings coming on market, 2) how quickly buyers put them into contract, 3) the sustained heat of the market over time, and 4) sellers pulling their homes off the market without selling.
Market Dynamics by Price Segment/Property Type
San Francisco Residential Market
| Price/ Prop. Type | # Listings for Sale* | # Listings in Contract* | Monthly Rate of Sales*** | Supply of Inventory*** | Avg. Days on Market** | Sales Over List Price** | Avg. Sales Price to LP %** |
|---|---|---|---|---|---|---|---|
| Under $1,000,000 | 429 | 162 | 120 sales/mo. | 3.6 months | 55 days | 31% | 97.5% |
| $1,000,000-$1,999,999 | 386 | 186 | 180 sales/mo. | 2.1 months | 34 days | 55% | 104% |
| $2,000,000-$2,999,999 | 121 | 38 | 46 sales/mo. | 2.6 months | 32 days | 60% | 104.5% |
| $3,000,000-$4,999,999 | 101 | 16 | 35 sales/mo. | 2.9 months | 36 days | 38% | 99% |
| $5,000,000-$7,499,999 | 23 | 7 | 6 sales/mo. | 3.8 months | 48 days | 28% | 95% |
| $7,500,000-$9,999,999 | 20 | 2 | 2 sales/mo. | 10 months | 56 days | 14% | 92% |
| $10 Million+ | 21 | 0 | 1.5 sales/mo. | 13 months | 90 days | 0% | 85% |
| Houses | 299 | 161 | 174 sales/mo. | 1.7 months | 29 days | 64% | 106% |
| Condos | 682 | 201 | 172 sales/mo. | 3.9 months | 50 days | 33% | 97.5% |
| TICs | 82 | 31 | 22 sales/mo. | 3.7 months | 46 days | 35% | 98.5% |
| Co-ops | 32 | 8 | 4 sales/mo. | 8 months | 83 days | 13% | 91.5% |
*Active/Coming-Soon Listings & Listings in Contract posted to MLS as of 3/31/24. **Statistics per last 12 months of sales: Statistics often rise and fall according to seasonal trends. ***Rate of sales estimated using 1-month and 12-month data. Months Supply of Inventory measures approx. time required to sell listings for sale at estimated rate of sale. Lower readings signify higher demand as compared to supply.
Data reported to NorCal MLS Alliance and Infosparks, may contain errors and subject to revision. Not all activity is reported to MLS. All numbers approximate. Statistics based on past activity may not apply to future trends and can be distorted by outlier data (especially in low sales volume segments). Numbers change constantly.
The 2nd quarter often sees the most heated market conditions of the year, which changes many statistics.
Monthly Home Sales Volume
San Francisco Market Dynamics & Seasonality

Sales of houses, condos, townhouses reported to NorCal MLS Alliance, per Infosparks. Data from sources deemed reliable but may contain errors and subject to revision. Last month estimated based on available information and may change with late reported sales. All numbers approximate.
Sales in one month mostly reflect accepted offers in the previous month. March 2024 sales were down year over year, but based on pending-sale activity, should jump substantially in April.
San Francisco Higher-Price Home Sales*
Homes Selling for $3 Million+

*Houses, condos, co-ops, townhouses, TICs: Sales reported to NorCal MLS Alliance, per Infosparks. Does not include sales unreported to MLS. Data from sources deemed reliable but may contain errors and subject to revision. All numbers approximate, and may change with late-reported activity.
Home sales of $3 million+ in Q1 2024 were up 49% year over year.
The number of higher-price sales typically ebbs and flows dramatically by season, with spring usually the biggest selling season.
Average Days on Market – Speed of Sale
San Francisco Market Dynamics & Seasonality

Sales reported to NorCal MLS Alliance, per Infosparks. Data derived from sources deemed reliable, but may contain errors and subject to revision. All numbers approximate, and may change with late-reported sales.
Homes continue to sell much faster moving into spring, but houses (green line) sell significantly faster than condos (blue line).
Overbidding List Prices in San Francisco
Percentage of Home Sales Closing over List Price

Sales data reported to NORCAL MLS® ALLIANCE, per Infosparks. Reflecting the percentage of sales closing at sales prices over the final list prices. Data from sources deemed reliable, but may contain errors and subject to revision. All numbers are approximate, and may change with late-reported sales.
The % of homes selling over list price continues to rise moving into spring. For houses, the % was 69% and for condos, 36%, illustrating the different supply and demand dynamics between the 2 markets – even as both are heating up quickly.
This statistic fluctuates according to seasonal demand trends, and is a lagging indicator of market activity 3-6 weeks earlier.
Average Sales Price to Original List Price Percentage
San Francisco Over/Under Bidding: Market Dynamics & Seasonality

Sales reported to NorCal MLS Alliance, per Infosparks. Data derived from sources deemed reliable, but may contain errors and subject to revision. All numbers approximate, and may change with late-reported sales.
House sales (yellow line) averaged a sales price 9% over asking price in March 2024, while condos (orange line) averaged 1% below.
Overbidding has been much more common in house sales than condo sales.
Price Reductions on Active Listings
San Francisco Market Dynamics & Seasonality
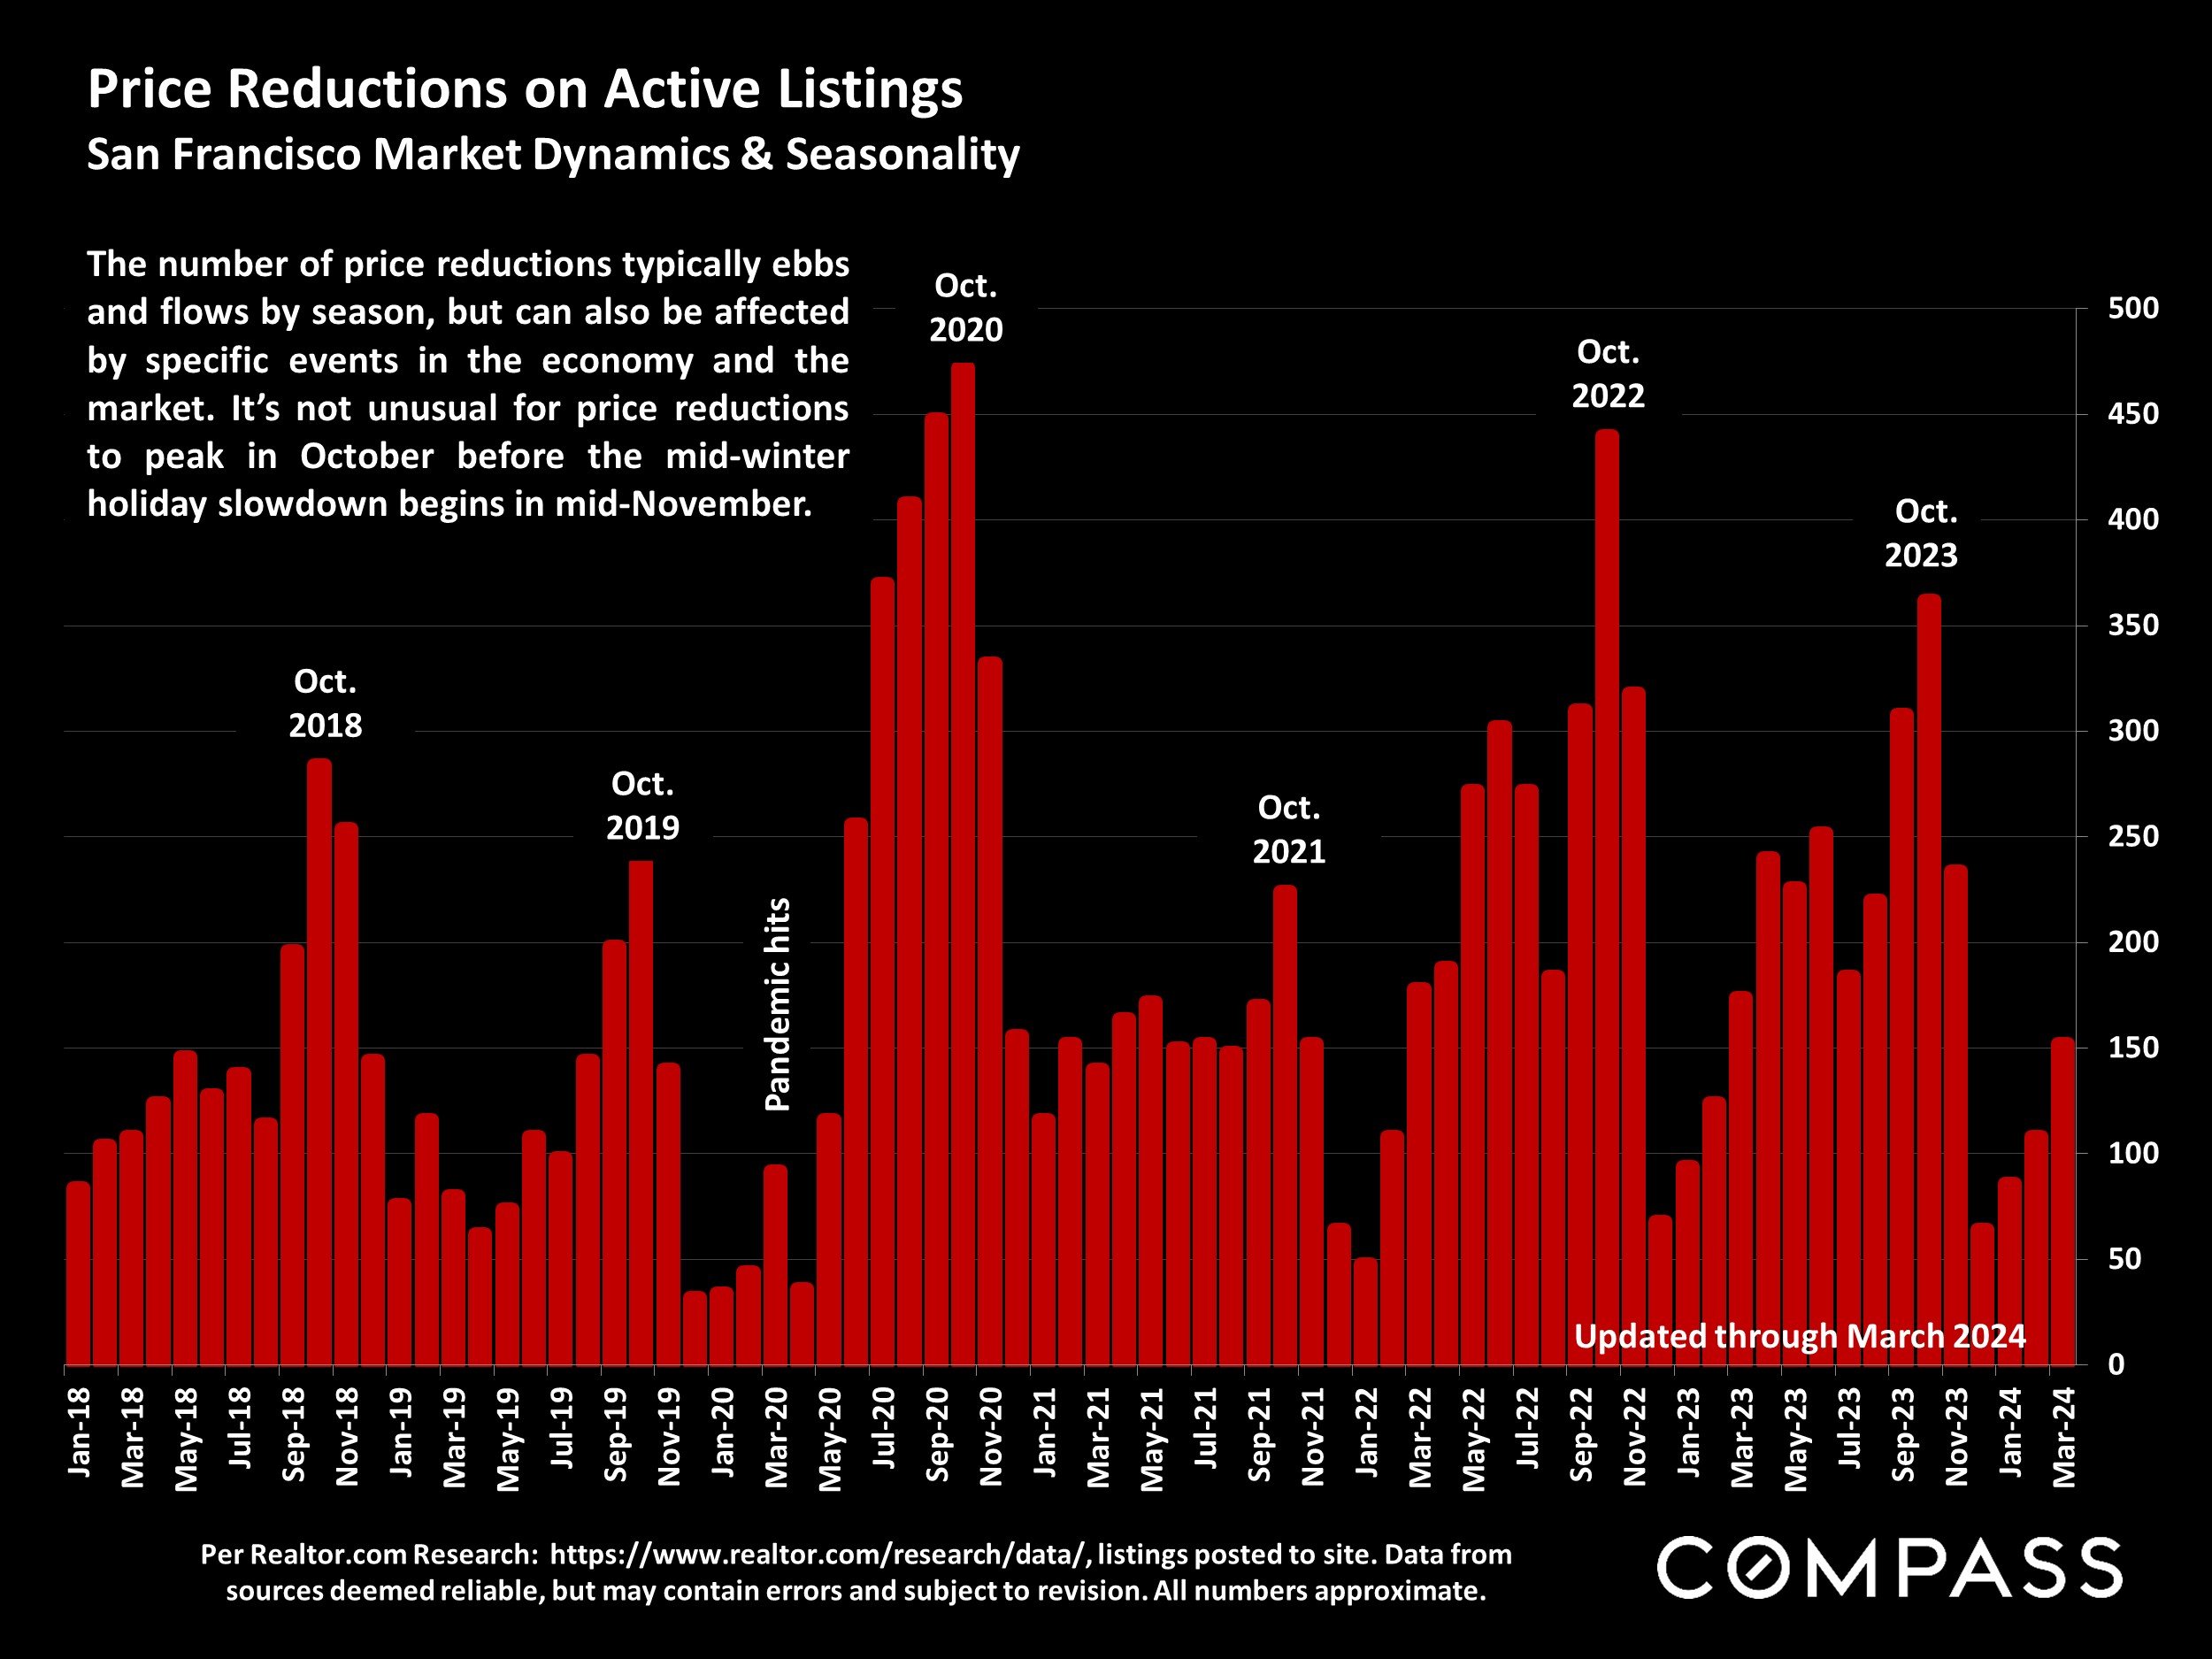
Per Realtor.com Research: https://www.realtor.com/research/data/, listings posted to site. Data from sources deemed reliable, but may contain errors and subject to revision. All numbers approximate.
The number of price reductions typically ebbs and flows by season, but can also be affected by specific events in the economy and the market. It’s not unusual for price reductions to peak in October before the mid-winter holiday slowdown begins in mid-November.
Median Household Income
San Francisco County since 2000*

*Updated 12/14/23. U.S. Census estimates, per Federal Reserve Bank of St. Louis. Not seasonally adjusted. Inflation data from BLS calculator. Median sales price data per CA Association of Realtors. Data from sources deemed reliable but may contain errors and subject to revision. All numbers are approximate.
Household income includes the income of all members of the household 15+ years of age. Median HH income is that point at which half the households earn more and half less, including households of 1, and those with no income.
2000 to 2022, county median household income increased by 143%; inflation over the period was 72%; the median house sales price, 2000 – 2023 (after declining from the 2022 peak), appreciated by 192%. (All numbers approximate.)*
2023 income figures not yet available.
San Francisco Population Trends since 2010
U.S. Census Estimates, July 1st to July 1st

Estimates as of July 1 of each year. 2020-2023 data published March 14, 2024 by U.S. Census. The Census often revises numbers in subsequent estimates. All numbers to be considered approximate.
Population changes are driven by domestic and foreign migration into and out of the county, and by natural causes, i.e. births less deaths.
Data pertaining to changes in rent rates, rental vacancy rates, and median household income indicate that the greatest loss of residents since the pandemic has been of tenants.
Changes measured from July 1st of previous year to July 1st of labeled year.
San Francisco Year-over-Year Population Change
U.S. Census Annual Estimates, Percentage Change, July 1st to July 1st

Estimates as of July 1 of each year. 2020-2023 data published March 14, 2024 by U.S. Census. The Census often revises numbers in subsequent estimates. All numbers to be considered approximate.
Population changes are driven by domestic and foreign migration into and out of the county, and by natural causes, i.e. births less deaths.
After the large drop right after the pandemic hit, the population declined slightly in 2022 and then turned slightly positive in 2023.
Data pertaining to changes in rent rates, rental vacancy rates, and median household income indicate that the greatest loss of residents since the pandemic has been of tenants.
San Francisco Employment Trends
Number of Employed Residents since 2000

Per California Employment Development Dept. (EDD) . Last month’s data is labeled “preliminary” by EDD. EDD often goes back to revise past data releases. Data from sources deemed reliable but may contain errors and subject to revision. All numbers should be considered approximate.
According to EDD, SF employment numbers remain down by about 7.5% from early 2020 before the pandemic struck.
San Francisco Residential Rents
Approximate, Good Faith Estimates*
Average Asking Rent, 1994 – Present, Q1 Data Points (except as noted)
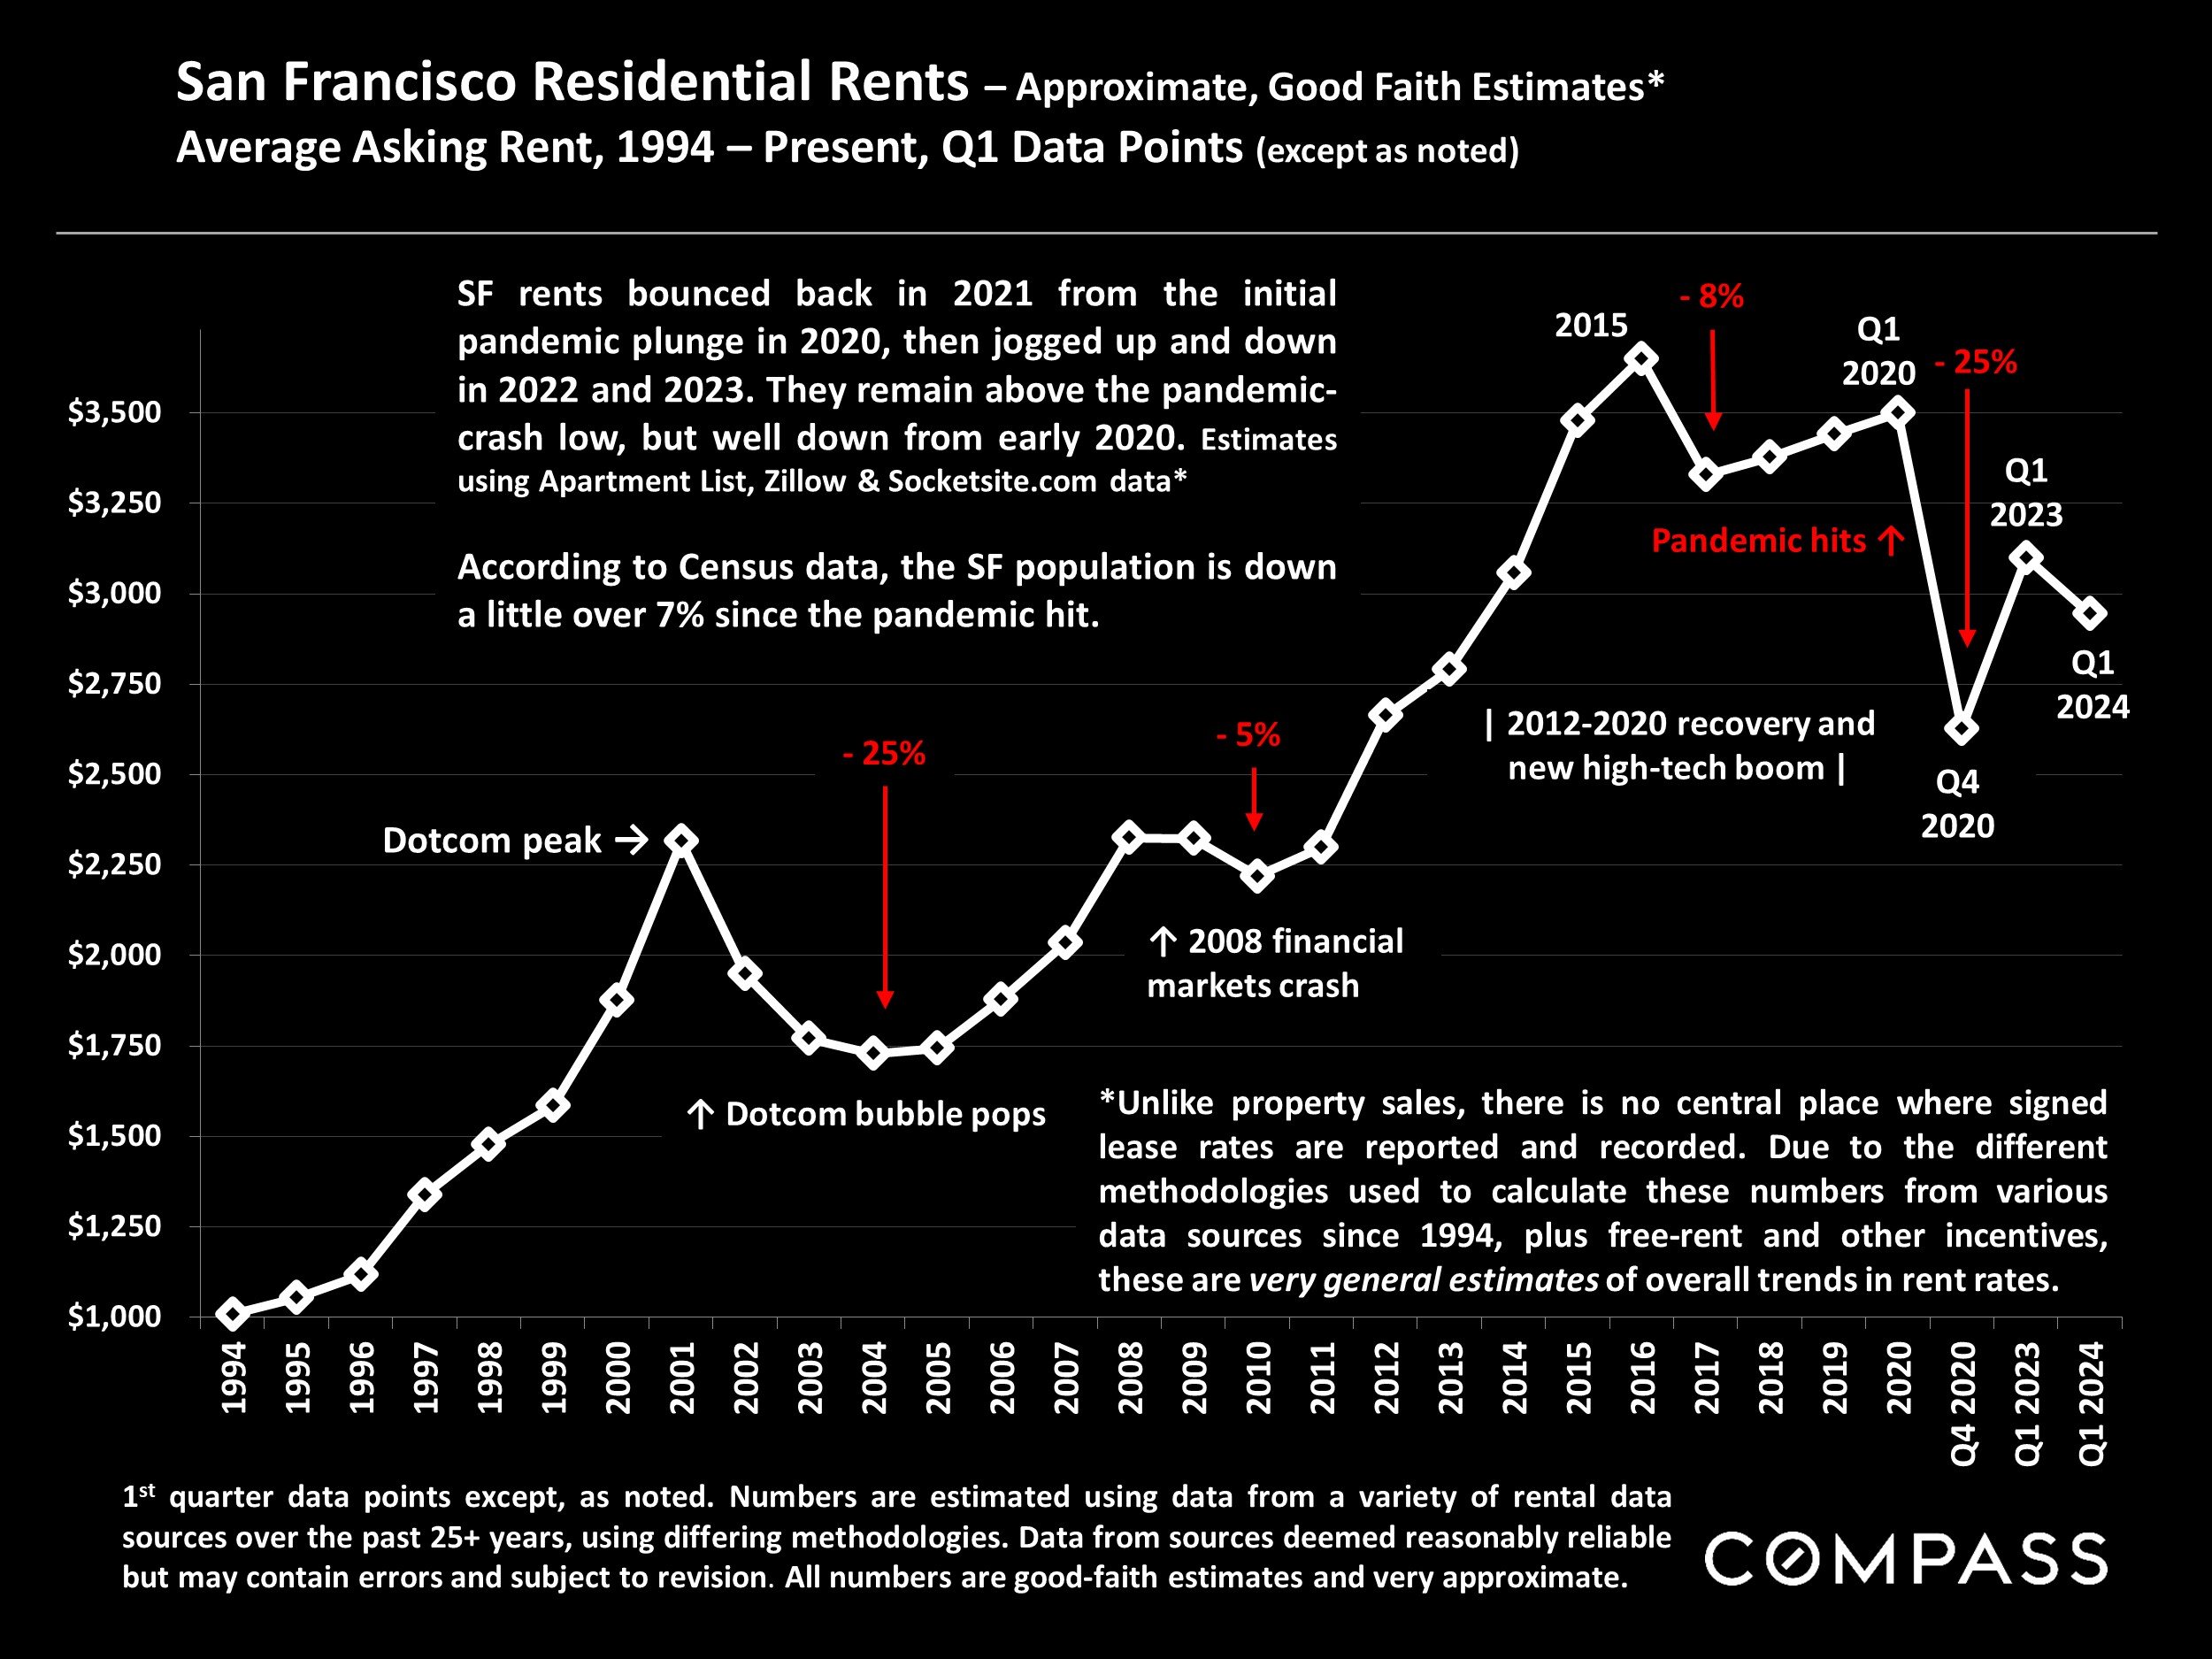
1st quarter data points except, as noted. Numbers are estimated using data from a variety of rental data sources over the past 25+ years, using differing methodologies. Data from sources deemed reasonably reliable but may contain errors and subject to revision. All numbers are good-faith estimates and very approximate.
SF rents bounced back in 2021 from the initial pandemic plunge in 2020, then jogged up and down in 2022 and 2023. They remain above the pandemic-crash low, but well down from early 2020. Estimates using Apartment List, Zillow & Socketsite.com data*
According to Census data, the SF population is down a little over 7% since the pandemic hit.
*Unlike property sales, there is no central place where signed lease rates are reported and recorded. Due to the different methodologies used to calculate these numbers from various data sources since 1994, plus free-rent and other incentives, these are very general estimates of overall trends in rent rates.
Statistics are generalities, essentially summaries of widely disparate data generated by dozens, hundreds or thousands of unique, individual sales occurring within different time periods. They are best seen not as precise measurements, but as broad, comparative indicators, with reasonable margins of error. Anomalous fluctuations in statistics are not uncommon, especially in smaller, expensive market segments. Last period data should be considered estimates that may change with late-reported data. Different analytics programs sometimes define statistics – such as “active listings,” “days on market,” and “months supply of inventory” – differently: what is most meaningful are not specific calculations but the trends they illustrate. Most listing and sales data derives from the local or regional multi-listing service (MLS) of the area specified in the analysis, but not all listings or sales are reported to MLS and these won’t be reflected in the data. “Homes” signifies real-property, single-household housing units: houses, condos, co-ops, townhouses, duets and TICs (but not mobile homes), as applicable to each market. City/town names refer specifically to the named cities and towns, unless otherwise delineated. Multi-county metro areas will be specified as such. Data from sources deemed reliable, but may contain errors and subject to revision. All numbers to be considered approximate.
Many aspects of value cannot be adequately reflected in median and average statistics: curb appeal, age, condition, amenities, views, lot size, quality of outdoor space, “bonus” rooms, additional parking, quality of location within the neighborhood, and so on. How any of these statistics apply to any particular home is unknown without a specific comparative market analysis.
Median Sales Price is that price at which half the properties sold for more and half for less. It may be affected by seasonality, “unusual” events, or changes in inventory and buying trends, as well as by changes in fair market value. The median sales price for an area will often conceal an enormous variety of sales prices in the underlying individual sales.
Dollar per Square Foot is based upon the home’s interior living space and does not include garages, unfinished attics and basements, rooms built without permit, patios, decks or yards (though all those can add value to a home). These figures are usually derived from appraisals or tax records, but are sometimes unreliable (especially for older homes) or unreported altogether. The calculation can only be made on those home sales that reported square footage.
Photo use under the Creative Commons License: https://creativecommons.org/licenses/by-sa/2.0/
Compass is a real estate broker licensed by the State of California, DRE 01527235. Equal Housing Opportunity. This report has been prepared solely for information purposes. The information herein is based on or derived from information generally available to the public and/or from sources believed to be reliable. No representation or warranty can be given with respect to the accuracy or completeness of the information. Compass disclaims any and all liability relating to this report, including without limitation any express or implied representations or warranties for statements contained in, and omissions from, the report. Nothing contained herein is intended to be or should be read as any regulatory, legal, tax, accounting or other advice and Compass does not provide such advice. All opinions are subject to change without notice. Compass makes no representation regarding the accuracy of any statements regarding any references to the laws, statutes or regulations of any state are those of the author(s). Past performance is no guarantee of future results.