August 2023 Market Report

Photo by Kace Rodriguez on Unsplash
Generally speaking, the market slowed in July, a common seasonal trend, and August is usually one of the quietest months of the year — though last year, a sudden, but short-lived drop in interest rates kindled buyer demand in August. Underlying economic dynamics – interest rates, inflation, financial markets, employment – remain on the same general tracks as in recent months. The Consumer Confidence Index jumped in July, hitting its best reading since October 2021: The Index is now about halfway between its historic low in June 2022 and the pre-pandemic reading in February 2020.*
Across Bay Area counties, the year-over-year (YOY), 3-month-rolling, median home sales price declines that commonly began in the second half of 2022 and peaked in spring have begun to drop. Based on current trends, they will probably continue to dwindle, and perhaps disappear, in the second half of the year.
The number of homes coming on market in the seven counties of the San Francisco and San Jose Metro Areas during the past 12 months dropped 32% from the previous 12-month period: 22,000 fewer properties were put up for sale.** Along with the recovery in buyer demand and improvements in the general economy, this has been a defining factor in 2023’s market conditions.
It is not unusual to see a substantial autumn spike in SF listing and sales activity after Labor Day, lasting through late October or early November, before the market subsides for the big, mid-winter holiday slowdown, which typically lasts until early in the new year.
Included are charts reviewing both annual home prices for a broad review of appreciation trends, and then 3-month-rolling prices for insight into shorter-term changes. This report also includes a review of home prices and market dynamics of districts within the city.
*University of Michigan Consumer Sentiment Index
**Per Realtor.com research data library for U.S. metro areas.
San Francisco Median House Prices
Median House Sales Price by Year, 1993 – Present*

*Per CA. Association of Realtors annual survey for existing single family dwellings. 2023 data per MLS. Data from sources deemed reliable but may contain errors and subject to revision. All numbers approximate, and may change with late-reported sales. Various programs may calculate median sales prices slightly differently.
Median prices are generalities, most useful to discern broad market trends. They can be affected by other factors besides changes in fair market value. San Francisco contains neighborhoods of widely varying values.
Partial year data should be considered preliminary until full year data is in.
San Francisco HOUSE Price Trends since 1990
Monthly Median House Sales Prices, 3-Month Rolling

3-month rolling average of monthly median sales prices for “existing” houses, per CA Association of Realtors or 3-month rolling median per NorCal MLS Alliance. 2-period moving trend line. Analysis may contain errors and subject to revision. All numbers approximate, and may change with late-reported sales.
Year over year, the 3-month rolling, median house sales price in July 2023, $1,550,000 (same as the 2023 YTD price), was down about 16%.
Median sales price is that price at which half the sales occurred for more and half for less. It is a very general statistic, disguising an enormous range of sales prices in the underlying sales. It is often affected by other factors besides changes in fair market value. Monthly and seasonal fluctuations are common, which explain many of the regular ups and downs in this chart.
Bay Area Median House Sales Price Declines by County
Year-over-Year Comparisons, 3-Month-Rolling Median Sales Prices*

* House sales reported to NorCal MLS Alliance. Percentages rounded. Numbers approximate, may contain errors and subject to revision. Late-reported sales may change calculations.
Comparing 3-month-rolling, median house sales prices in March, May & July 2023 with the same months in 2022 to calculate the year-over-year percentage changes. Since peaking in spring, year-over-year declines in median house prices have been dropping across the Bay Area.
San Francisco HOUSE Sales Statistics By San Francisco Realtor District
Spring-Summer 2023 Market, 4 Months Sales*
Realtor districts often include additional neighborhoods besides those listed for general identification. These Realtor Districts contain neighborhoods and houses of varying values, sizes and characteristics: The statistics below review very broad, general trends. How they apply to any particular home is unknown without a specific comparative market analysis. In real estate, the devil is always in the details.
| San Francisco Districts with substantial house sales | # of Sales | Median Sales Price | Median $ per Sq. Ft. | Median House Size | Avg. Days on Market | Sales Price to List Price % | Highest Sale in Period |
|---|---|---|---|---|---|---|---|
| Pacific & Presidio Heights, Cow Hollow, Marina (D7) |
42 | $4,987,500 | $1508/sq.ft. | 3500 sq.ft. | 39 days | 7% under LP | $18,500,000 |
| Forest Hill, St. Francis Wood, W. Portal, Sherwood Forest (D4 W.) |
45 | $2,500,000 | $964/sq.ft. | 2487 sq.ft. | 22 days | 11% over LP | $4,250,000 |
| Noe, Eureka & Cole Valleys; Ashbury & Corona Heights (D5) |
92 | $2,400,000 | $1240/sq.ft. | 2054 sq.ft. | 23 days | 3.5% over LP | $7,500,000 |
| Sea Cliff, Lake St., Jordan Park, Richmond District (D1) |
64 | $2,390,000 | $1113/sq.ft. | 2266 sq.ft. | 30 days | 2.5% over LP | $20,000,000 |
| Potrero Hill, Bernal Heights, Inner Mission (D9) |
73 | $1,650,000 | $1114/sq.ft. | 1572 sq.ft. | 30 days | 3.5% over LP | $4,600,000 |
| Sunset & Parkside Districts, Golden Gate Heights (D2) |
128 | $1,550,000 | $975/sq.ft. | 1587 sq.ft. | 17 days | 16% over LP | $3,405,000 |
| Miraloma Park, Forest Knolls, Midtown Ter., Sunnyside (D4 E.) |
59 | $1,500,000 | $976/sq.ft. | 1545 sq.ft. | 26 days | 8% over LP | $2,850,000 |
| Lakeside, Lake Shore, Ingleside, Oceanview, Merced Heights (D3) |
48 | $1,295,000 | $932/sq.ft. | 1495 sq.ft. | 23 days | 9% over LP | $2,650,000 |
| Bayview, Excelsior, Portola, Crocker Amz., Visitacion Vly (D10) |
162 | $1,127,500 | $803/sq.ft. | 1428 sq.ft. | 29 days | 5.5% over LP | $2,155,000 |
* 4 months house sales reported to NorCal MLS Alliance through Mid-July 2023. The Sales Price to List Price %reflects Q2 2023 averages based on original list prices. Data derived from sources deemed reliable, but may contain errors and subject to revision. All numbers approximate, and change constantly as new sales occur.
San Francisco Median Condo Prices
Sales Price by Year, 1993 – Present

Per sales reported to NorCal MLS Alliance. Median sales price is that price at which half the sales occurred for more and half for less. Data from sources deemed reliable but may contain errors and subject to revision. All numbers approximate, and may change with late-reported sales.
Median prices are generalities, most useful to discern broad market trends. They can be affected by other factors besides changes in fair market value. The city contains condo projects and neighborhoods of widely varying values. Annual data can disguise significant changes that occur within the calendar year. Partial year data should be considered preliminary until full year data is in.
San Francisco CONDO Price Trends since 2005
Median Condo Sales Price, 3-Month Rolling
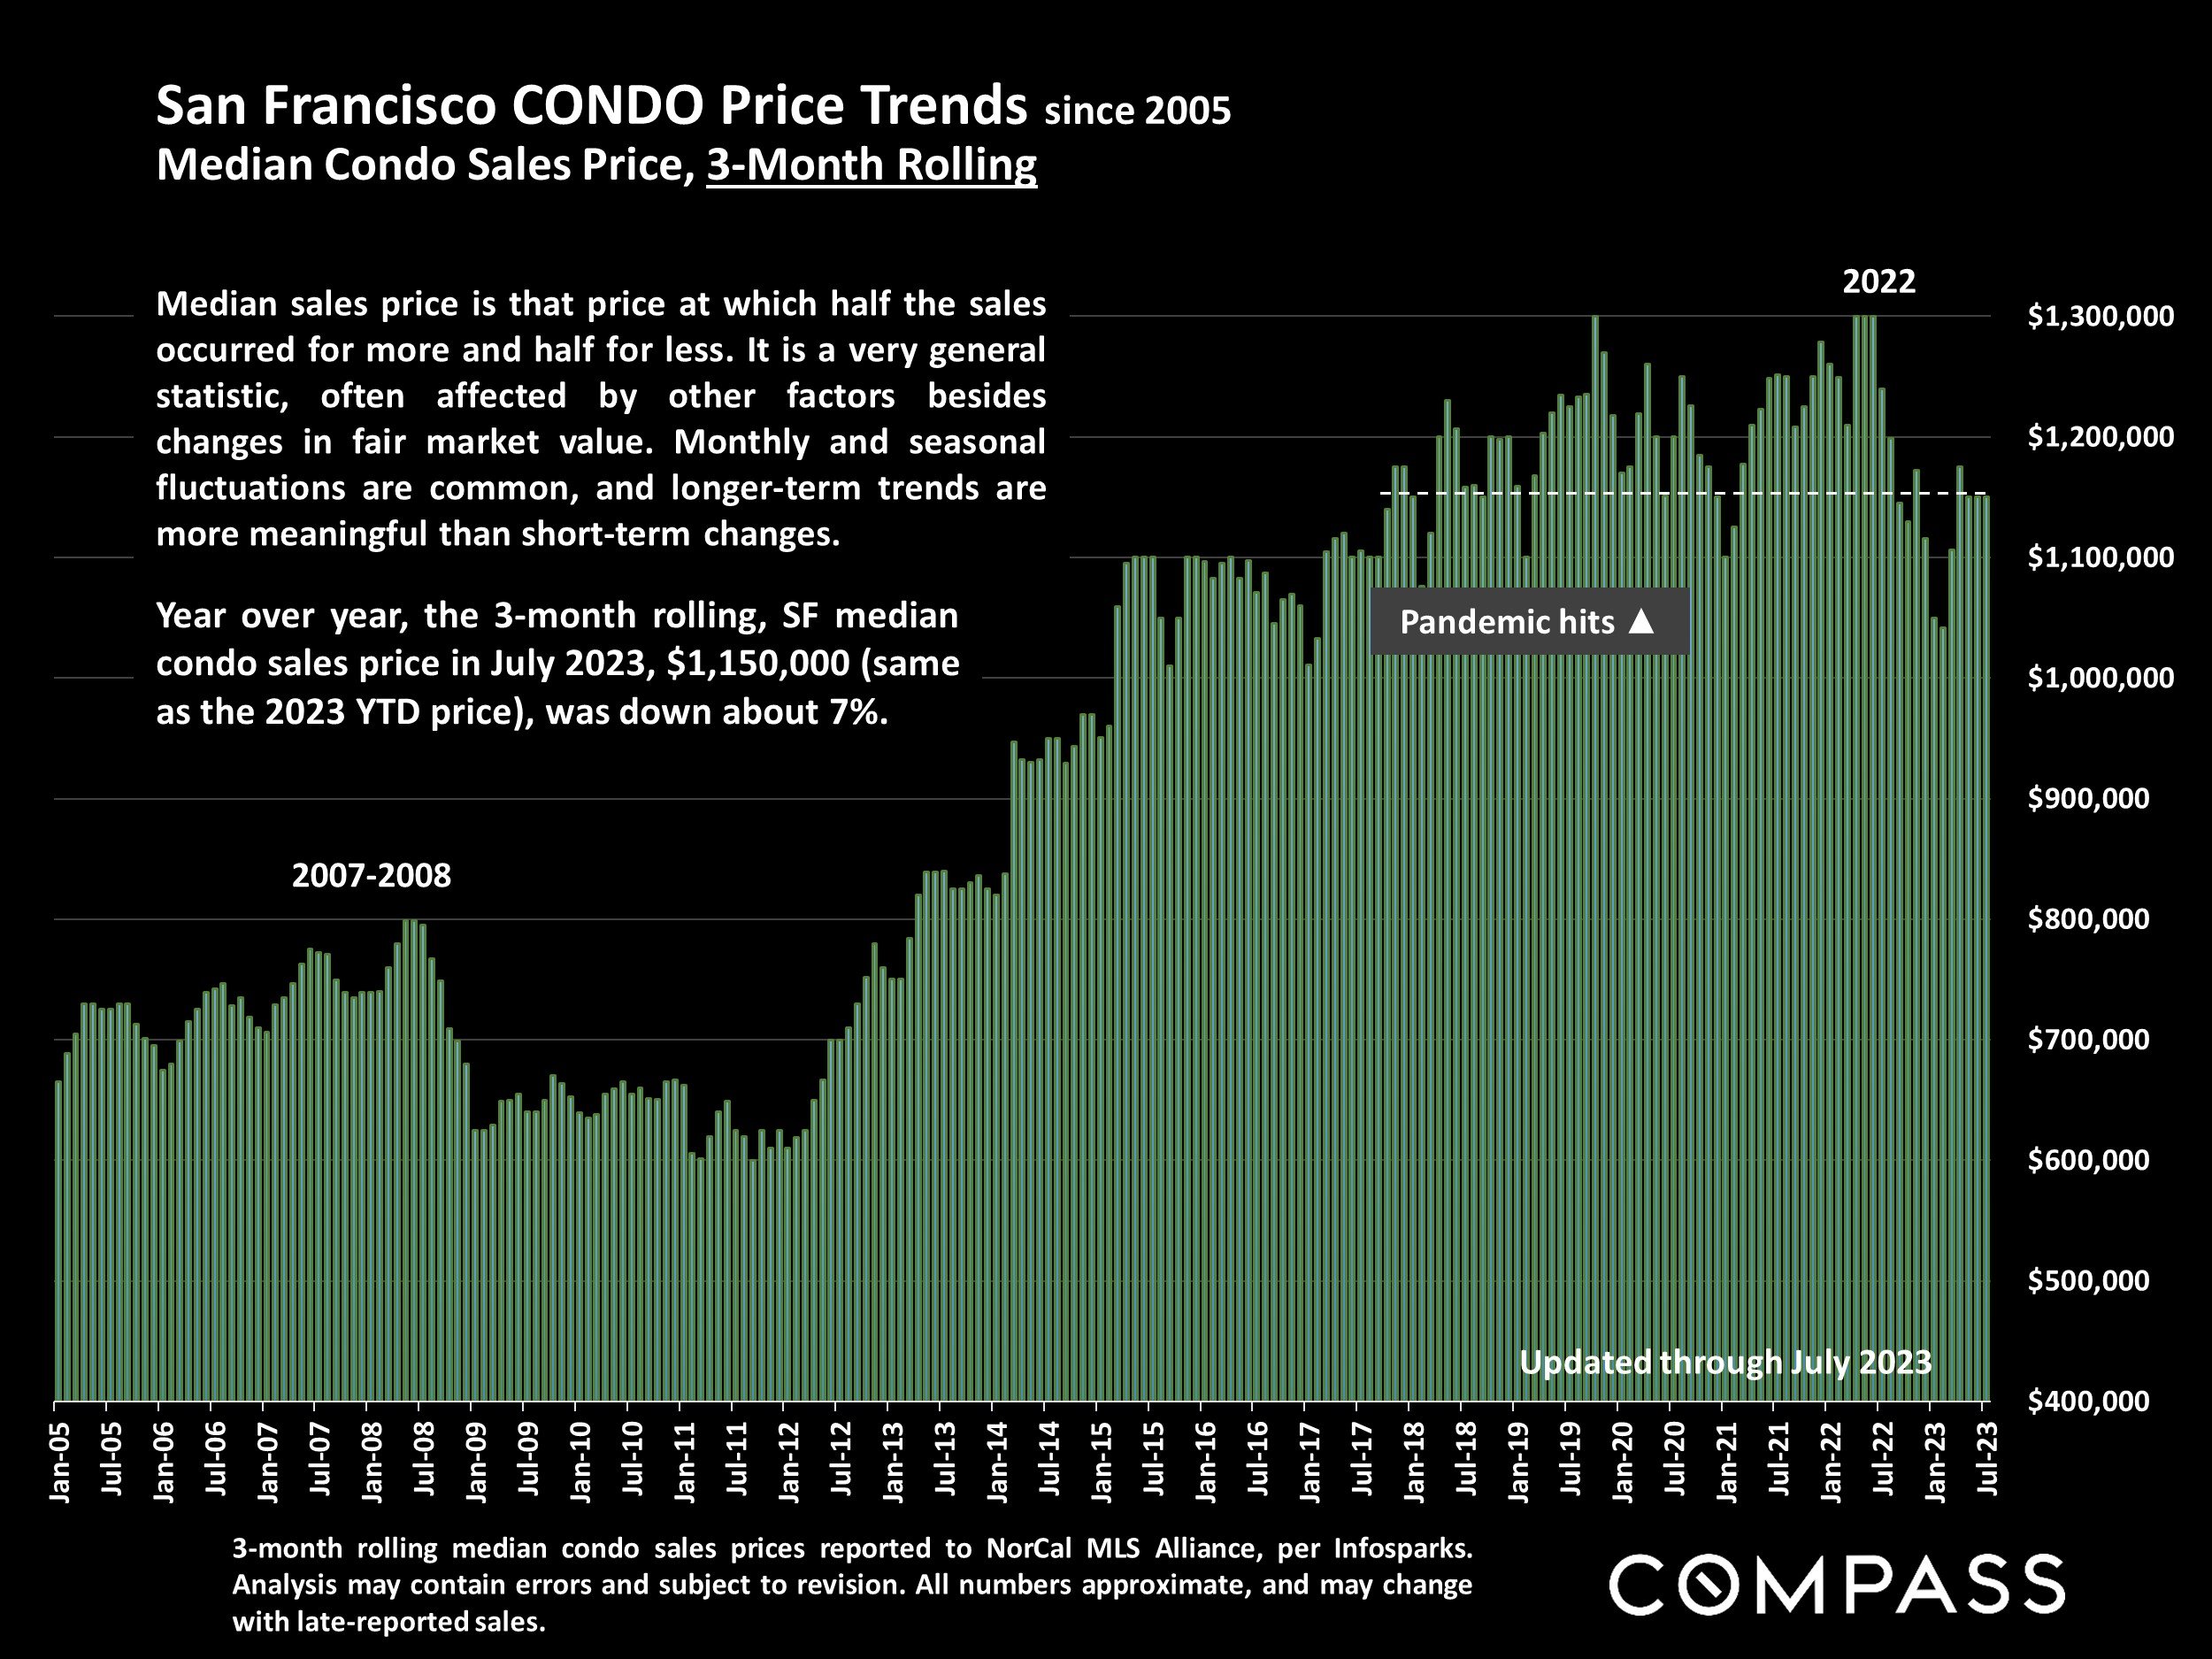
3-month rolling median condo sales prices reported to NorCal MLS Alliance, per Infosparks. Analysis may contain errors and subject to revision. All numbers approximate, and may change with late-reported sales.
Median sales price is that price at which half the sales occurred for more and half for less. It is a very general statistic, often affected by other factors besides changes in fair market value. Monthly and seasonal fluctuations are common, and longer-term trends are more meaningful than short-term changes.
Year over year, the 3-month rolling, SF median condo sales price in July 2023, $1,150,000 (same as the 2023 YTD price), was down about 7%.
San Francisco CONDO Sales Statistics
Spring-Summer 2023 Market, 4 Months Sales*
| San Francisco Districts with substantial condo sales | # of Sales | Median Sales Price | Median $ per Sq. Ft. | Median House Size | Avg. Days on Market | Sales Price to List Price % | |
|---|---|---|---|---|---|---|---|
| Pacific & Presidio Heights, Cow Hollow, Marina (D7) |
78 | $1,585,000 | $1176/sq.ft. | 1325 sq.ft. | 35 days | At List Price | |
| Noe, Eureka & Cole Valleys; Ashbury & Corona Heights (D5) |
118 | $1,430,000 | $1089/sq.ft. | 1287 sq.ft. | 37 days | .5% over LP | |
| Lake Street, Jordan Park, Richmond District (D1) |
39 | $1,325,000 | $1027/sq.ft. | 1344 sq.ft. | 26 days | 2% over LP | |
| Hayes Valley, Lower Pacific Heights, NoPa, Alamo Sq. (D6) |
73 | $1,250,000 | $993/sq.ft. | 1163 sq.ft. | 40 days | 1% over LP | |
| Russian, Nob & Telegraph Hills; North Beach (D8 N.) |
70 | $1,245,000 | $1107/sq.ft. | 1244 sq.ft. | 45 days | 3.5% under LP | |
| Potrero Hill, Bernal Heights, Inner Mission, Dogpatch (D9 S.) |
63 | $1,015,000 | $1031/sq.ft. | 1041 sq.ft. | 40 days | 1.5% under LP | |
| South Beach, Mission Bay, Yerba Buena, SoMa (D9 N.) |
170 | $997,500 | $978/sq.ft. | 1150 sq.ft. | 66 days | 3.5% below LP | |
| Van Ness/Civic Center, Lower Nob Hill (D8 S.) | 59 | $615,000 | $796/sq.ft. | 775 sq.ft. | 73 days | 3% below LP |
* 4 months CONDO sales reported to NorCal MLS Alliance through Mid-July 2023. Will not include new-project condo sales unreported to MLS. The Sales Price to List Price % reflects Q2 2023 averages based on original list prices. Data derived from sources deemed reliable, but may contain errors and subject to revision. All numbers approximate, and change constantly as new sales are reported.
These Realtor Districts contain neighborhoods and condos of widely varying values, sizes and characteristics: The statistics below review very broad, general trends. How they apply to any particular home is unknown without a specific comparative market analysis. In real estate, the devil is always in the details.
Average Days on Market – Speed of Sale
San Francisco Market Dynamics & Seasonality
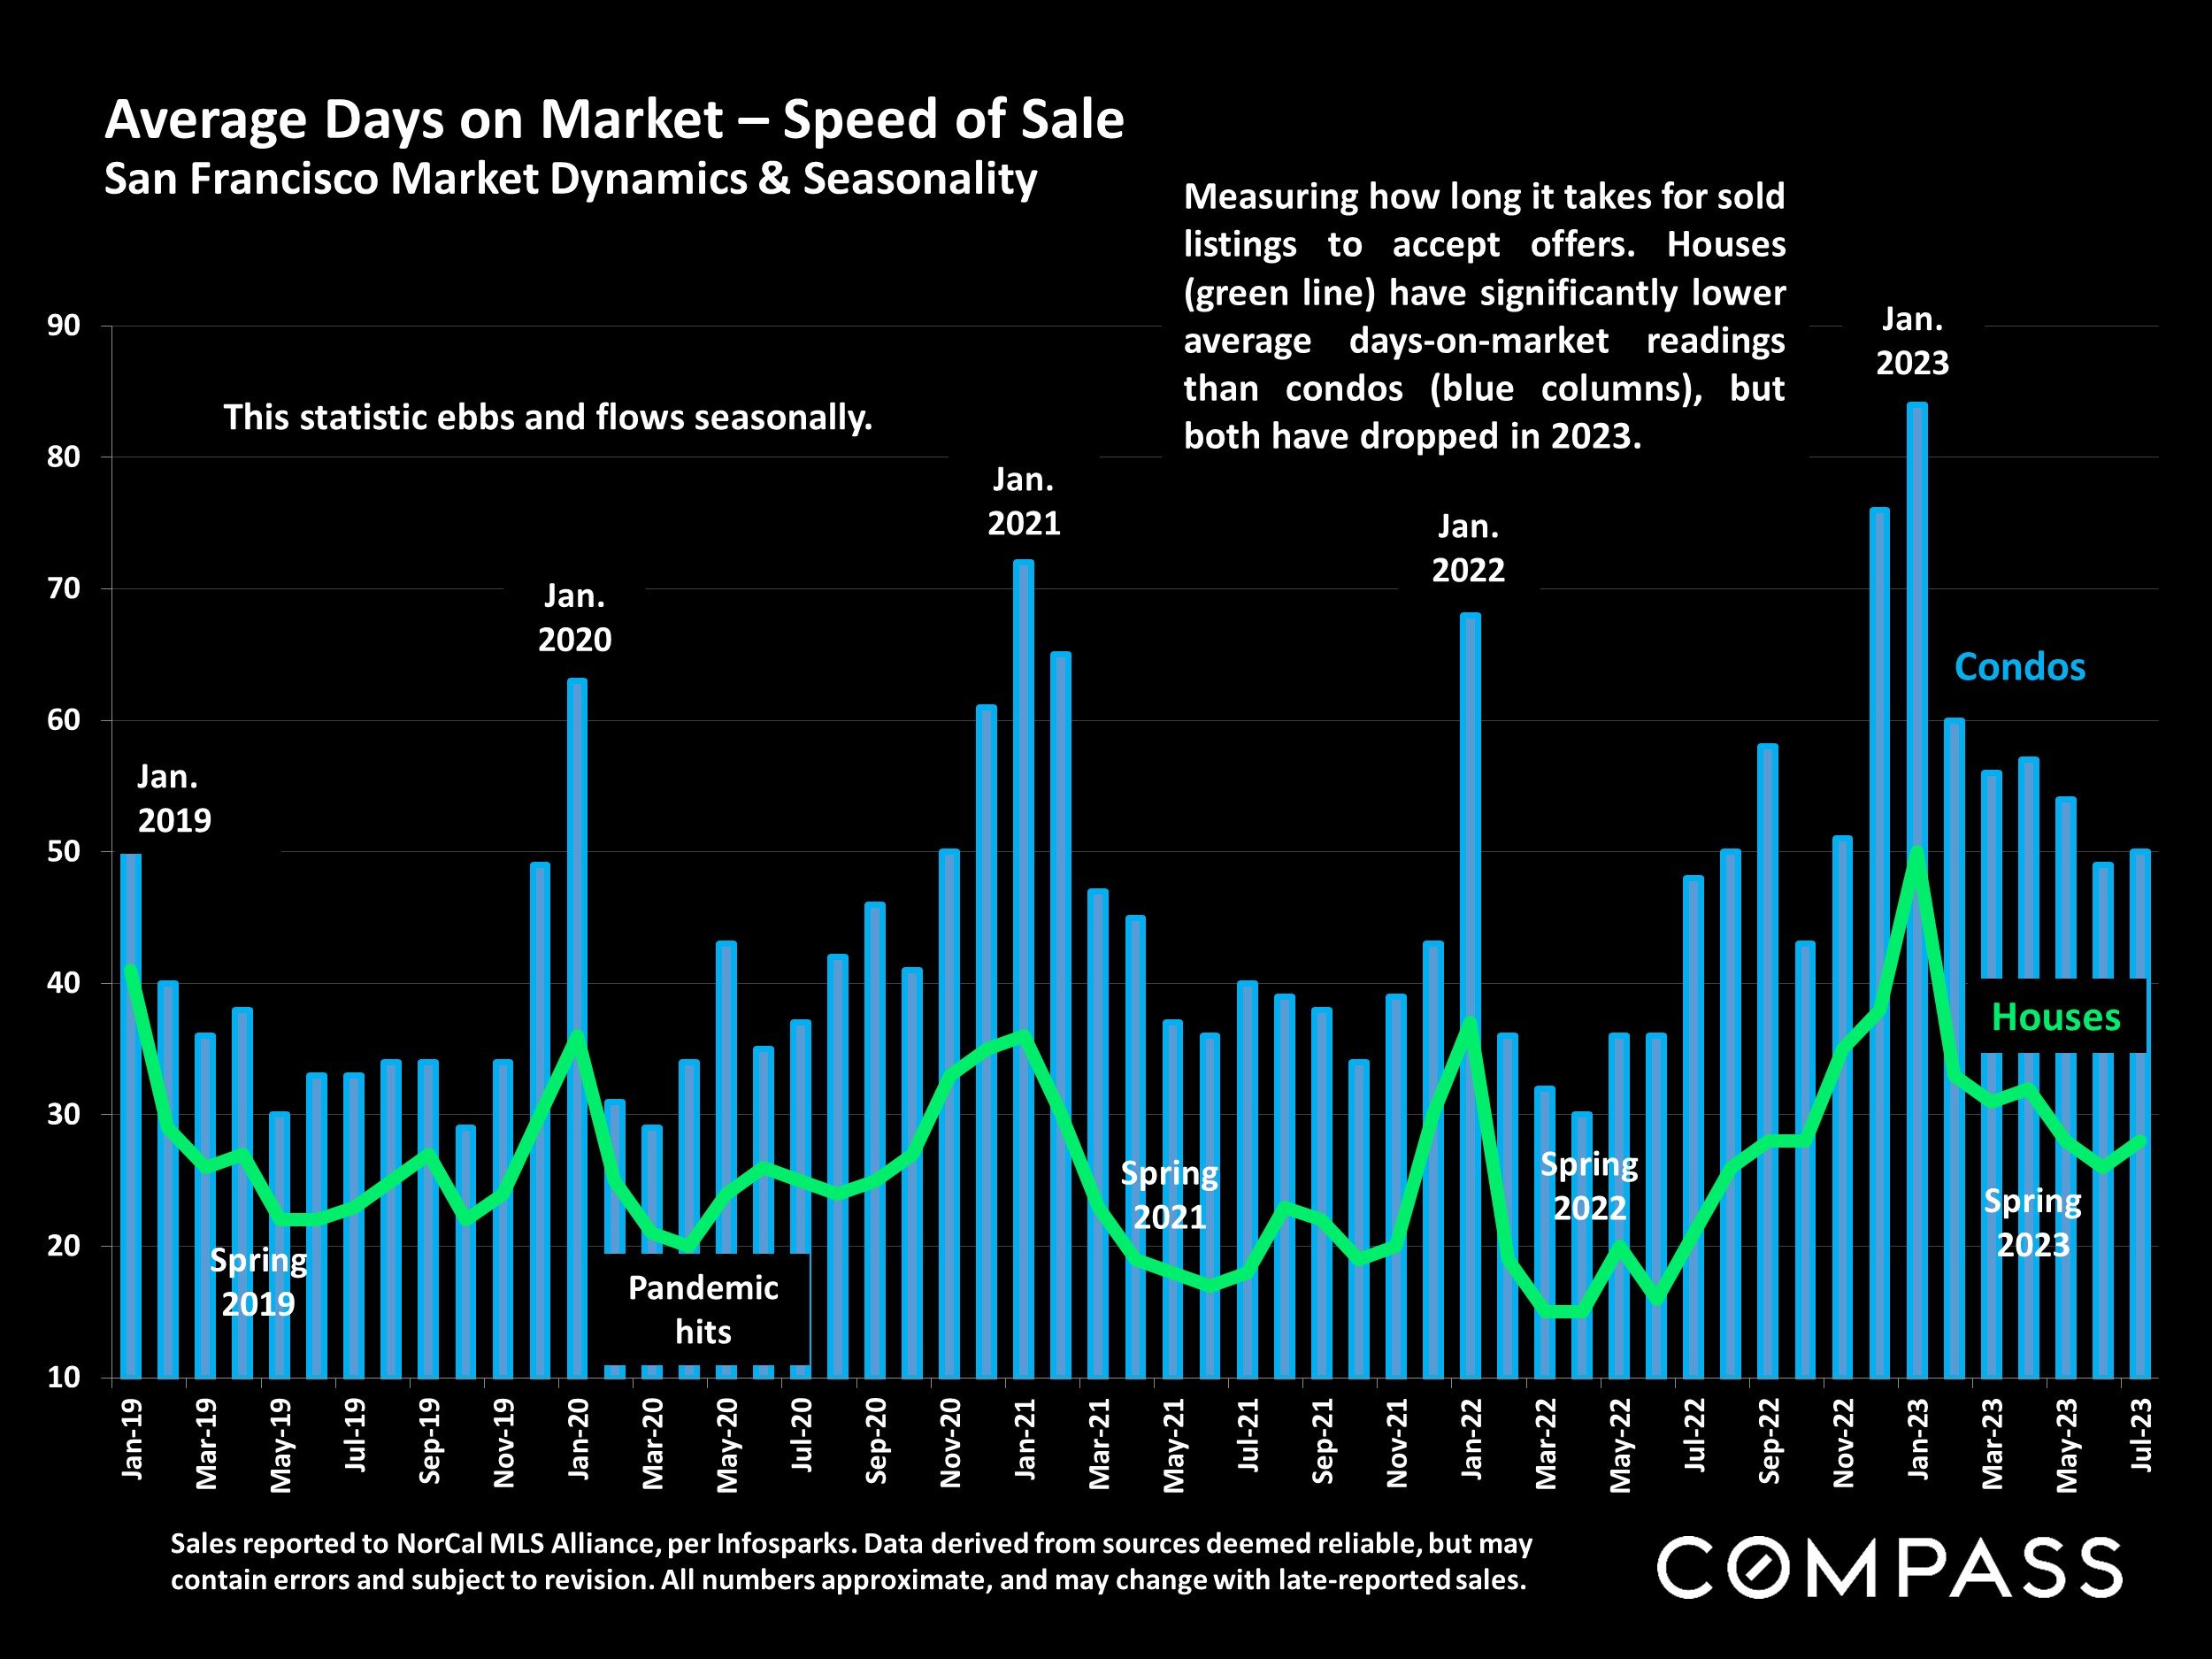
Sales reported to NorCal MLS Alliance, per Infosparks. Data derived from sources deemed reliable, but may contain errors and subject to revision. All numbers approximate, and may change with late-reported sales.
Measuring how long it takes for sold listings to accept offers. Houses (green line) have significantly lower average days-on-market readings than condos (blue columns), but both have dropped in 2023.
Overbidding List Prices in San Francisco
Percentage of Home Sales Closing over List Price, since 2018

Sales data reported to NORCAL MLS® ALLIANCE, per Infosparks. Reflecting the percentage of sales closing at sales prices over the final list prices. Data from sources deemed reliable, but may contain errors and subject to revision. All numbers are approximate, and may change with late-reported sales.
By property type, the % selling over list price in July 2023 for houses was 69%, and for condos, co-ops and TICs, 36%.
Average Sales Price to Original List Price Percentage
San Francisco Over/Under Bidding: Market Dynamics & Seasonality

Sales reported to NorCal MLS Alliance, per Infosparks. Data derived from sources deemed reliable, but may contain errors and subject to revision. All numbers approximate, and may change with late-reported sales.
On average, SF houses (yellow columns) are selling well above asking price, and condos (orange line) slightly below. This statistic fluctuates by season, and is a lagging indicator of market activity 3-6 weeks earlier.
Bay Area Home Sales
12 Months, Number of Sales by County*

*House, condo, co-op, TIC & townhouse sales reported to NorCal MLS Alliance in the 12 months through 7/15/23. Data from sources deemed reliable, but may contain errors and subject to revision. All numbers approximate. Not all sales are reported to MLS.
Driven by economic changes and a large decline in new listings coming on market, the number of Bay Area home sales in the 12 months ending 7/15/23 dropped 35% from the previous 12-month period.
San Francisco is the only Bay Area County in which houses do not make up a majority of home sales.
Bay Area Median Statistics: Large, Luxury Houses
Spring-Summer 2023 Update: 5+ Bedroom/4+ Bath/3000+ Sq.Ft.*
| County | Median Sales Price | Median Sq. Ft. | Median $/Sq.Ft. | Median Lot Size (Acres) | Median Year Built | Highest Sale 2023 YTD** |
|---|---|---|---|---|---|---|
| San Mateo County | $6,000,000 | 4295 sq.ft. | $1408/sq.ft. | .52 acre | 1980 | $44,500,000 |
| San Francisco | $5,475,000 | 4687 sq.ft. | $1236/sq.ft. | .08 acre | 1917 | $34,500,000 |
| Marin County | $4,555,000 | 4035 sq.ft. | $1117/sq.ft. | .66 acre | 1967 | $14,250,000 |
| Napa County | $4,425,000 | 4248 sq.ft. | $1027/sq.ft. | 5.2 acres | 2002 | $17,950,000 |
| Santa Clara County | $4,115,000 | 3813 sq.ft. | $1079/sq.ft. | .32 acre | 2000 | $18,000,000 |
| Contra Costa | $3,050,000 | 4266 sq.ft. | $698/sq.ft. | .51 acre | 1998 | $12,450,000 |
| Monterey County | $3,025,000 | 5310 sq.ft. | N/A | 2.2 acres | 1995 | $29,000,000 |
| Alameda County | $2,950,000 | 4063 sq.ft. | $694/sq.ft. | .25 acre | 1999 | $7,500,000 |
| Santa Cruz County | $2,750,000 | 4224 sq.ft. | $651/sq.ft. | 1.05 acres | 1987 | $6,943,000 |
| Sonoma County | $2,299,000 | 4003 sq.ft. | $636/sq.ft. | 1 acre | 2018 | $12,250,000 |
*Sales reported to NorCal MLS Alliance during the 4 months through mid-late July 2023. Minimum “luxury” sales price of $1.5 to $2 million depending on county. Some counties had relatively few sales of this size. Counties contain submarkets of widely varying values. Data from sources deemed reliable, but may contain errors and subject to revision. Numbers approximate, and may change with late reported sales.
**“Highest Sale YTD” as reported by July 30, 2023, all property types, configurations.
Generally speaking, the largest homes are most likely to be found in more expensive neighborhoods.
Bay Area Median House Values by County
Spring-Summer 2023 Update: By Bedroom/Bath Count*
| 3 Bedroom, 2 Bath Houses | 4 Bedroom, 3 Bath Houses | ||||||||
| County | Median Sales Price | Median Sq. Ft. | Median &/Sq. Ft. | Median Sales Price | Median Sq. Ft. | Median &/Sq. Ft. | |||
| San Mateo County | $1,670,000 | 1482 sq.ft. | $1134/sq.ft. | $2,448,000 | 2342 sq.ft. | $1004/sq.ft. | |||
| Santa Clara County | $1,567,500 | 1375 sq.ft. | $1139/sq.ft. | $2,010,000 | 2210 sq.ft. | $901/sq.ft. | |||
| San Francisco | $1,545,000 | 1555 sq.ft. | $1004/sq.ft. | $2,113,500 | 2126 sq.ft. | $894/sq.ft. | |||
| Marin County | $1,475,000 | 1651 sq.ft. | $895/sq.ft. | $2,050,000 | 2393 sq.ft. | $774/sq.ft. | |||
| Santa Cruz County | $1,218,000 | 1519 sq.ft. | $809/sq.ft. | $1,555,000 | 2308 sq.ft. | $655/sq.ft. | |||
| Alameda County | $1,100,000 | 1382 sq.ft. | $776/sq.ft. | $1,635,000 | 2248 sq.ft. | $714/sq.ft. | |||
| Napa County | $850,000 | 1506 sq.ft. | $580/sq.ft. | $1,035,000 | 2159 sq.ft. | $482/sq.ft. | |||
| Sonoma County | $797,000 | 1505 sq.ft. | $525/sq.ft. | $965,000 | 2336 sq.ft. | $427/sq.ft. | |||
| Contra Costa | $756,000 | 1477 sq.ft. | $539/sq.ft. | $1,212,500 | 2354 sq.ft. | $534/sq.ft. | |||
| Monterey County | $750,000 | 1458 sq.ft. | $536/sq.ft. | $964,000 | 2177 sq.ft. | $422/sq.ft. | |||
| Solano County | $536,000 | 1435 sq.ft. | $382/sq.ft. | $695,000 | 2264 sq.ft. | $310/sq.ft. | |||
*Sales reported to NorCal MLS Alliance during the 4 months through mid-late July 2023. Counties contain submarkets of widely varying values. Median values fluctuate for reasons besides changes in fair market value. Data from sources deemed reliable, but may contain errors and subject to revision. Numbers approximate, and may change with late reported sales. Not all sales are reported to MLS.
Bay Area Median Home Values by County
Spring-Summer 2023 Update: By Property Type & Bedroom/Bath Count*
| 2 Bedroom, 2 Bath Condos | 2 Bedroom, 1-2 Bath Houses | ||||||||
| County | Median Sales Price | Median Sq. Ft. | Median &/Sq. Ft. | Median Sales Price | Median Sq. Ft. | Median &/Sq. Ft. | |||
| San Francisco | $1,280,000 | 1208 sq.ft. | $1048/sq.ft. | $1,222,500 | 1206 sq.ft. | $1011/sq.ft. | |||
| San Mateo County | $900,500 | 1116 sq.ft. | $790/sq.ft. | $1,291,000 | 1060 sq.ft. | $1179/sq.ft. | |||
| Santa Cruz County | $845,000 | 1199 sq.ft. | $693/sq.ft. | $850,000 | 995 sq.ft. | $823/sq.ft. | |||
| Santa Clara County | $810,000 | 1104 sq.ft. | $725/sq.ft. | $1,050,000 | 1047 sq.ft. | $1046/sq.ft. | |||
| Marin County | $772,500 | 1211 sq.ft. | $619/sq.ft. | $1,249,000 | 1109 sq.ft. | $1126/sq.ft. | |||
| Monterey County | $725,000 | 1065 sq.ft. | $667/sq.ft. | $715,000 | 1002 sq.ft. | $716/sq.ft. | |||
| Alameda County | $665,000 | 1078 sq.ft. | $601/sq.ft. | $825,000 | 1060 sq.ft. | $795/sq.ft. | |||
| Napa County | $650,000 | 1156 sq.ft. | $560/sq.ft. | $693,250 | 1074 sq.ft. | $667/sq.ft. | |||
| Contra Costa | $622,500 | 1138 sq.ft. | $550/sq.ft. | $607,500 | 1044 sq.ft. | $546/sq.ft. | |||
| Sonoma County | $463,000 | 1034 sq.ft. | $421/sq.ft. | $728,000 | 1209 sq.ft. | $607/sq.ft. | |||
| Solano County | $355,000 | 968 sq.ft. | $373/sq.ft. | $450,000 | 1211 sq.ft. | $356/sq.ft. | |||
*Sales reported to NorCal MLS Alliance during the 4 months through mid-late July 2023. Excluding “below market rate” condo sales. Counties contain submarkets of widely varying values. Median values fluctuate for reasons besides changes in fair market value. Data from sources deemed reliable, but may contain errors and subject to revision. Numbers approximate, and may change with late reported sales.
New Listings Coming on Market
San Francisco Market Dynamics & Seasonality

Per Realtor.com Research: https://www.realtor.com/research/data/, listings posted on site. Data from sources deemed reliable, but may contain errors and subject to revision. May not include “coming-soon” listings. All numbers should be considered approximate.
Year over year, the new-listing volume in July 2023 was down 17%. New listing activity typically drops in mid-summer before spiking up in September for the fall selling season. The number of new listings coming on market ebbs and seasonal trends, though it can be affected by specific market dynamics.
San Francisco Homes Market
Active & Coming-Soon Listings on 1st of Month*

* Houses, condos, co-ops, TICs, townhouses: Active/Coming-Soon listings posted to NorCal MLS Alliance. Does not include new-project condos not listed on MLS. Data from sources deemed reliable, but may contain errors and subject to revision. All numbers approximate. The # of active listings changes constantly.
Of the listings for sale on August 1, 28.5% were houses, and 71.5% were condos, co-ops, TICs & townhouses.*
Active Listings on Market – Longer-Term Trends
San Francisco Market Dynamics & Seasonality

Per Realtor.com Research: https://www.realtor.com/research/data/, house and condo listings posted on site. May not include coming-soon listings. Data from sources deemed reliable, but may contain errors and subject to revision. All numbers approximate.
This is a snapshot measure of how many active listings can be expected on any given day of the specified month.
The number of active listings on a given day is affected by 1) how many new listings come on market, 2) how quickly buyers snap them up, 3) the sustained heat of the market over time, and 4) how many sellers pull their homes off the market without selling. The number typically ebbs and flows by season.
Listings Pending Sale (in Contract, Offer Accepted)
San Francisco Market Dynamics & Seasonality

Per Realtor.com Research: https://www.realtor.com/research/data/, house and condo listings posted on site. Data from sources deemed reliable, but may contain errors and subject to revision. All numbers are approximate.
This is a snapshot measure of how many pending listings can be expected on any given day of the specified month.
The # of listings going into contract measures buyer demand, but is also deeply impacted by the supply of new listings available to buy.
Monthly Home Sales Volume
San Francisco Market Dynamics & Seasonality

Sales of houses, condos, townhouses reported to NorCal MLS Alliance, per Infosparks. Data from sources deemed reliable but may contain errors and subject to revision. Last month estimated based on available information and may change with late reported sales. All numbers approximate.
Sales in one month mostly reflect accepted-offer activity in the previous month. Year over year, July 2023 sales volume was down about 22%.
San Francisco Higher-Price Home Sales*
Homes Selling for $3 Million+ & $5 Million+

*Houses, condos, co-ops, townhouses, TICs: Sales reported to NorCal MLS Alliance, per Infosparks. Does not include sales unreported to MLS. Data from sources deemed reliable but may contain errors and subject to revision. All numbers approximate, and may change with late-reported activity.
The number of higher-price sales typically ebbs and flows dramatically by season, with spring usually the biggest selling season, and mid-winter the slowest. Sales usually follow the time of offers being accepted by 3 to 5 weeks.
Price Reductions on Active Listings
San Francisco Market Dynamics & Seasonality

Per Realtor.com Research: https://www.realtor.com/research/data/, listings posted to site. Data from sources deemed reliable, but may contain errors and subject to revision. All numbers approximate.
The number of price reductions typically ebbs and flows by season, but can also be affected by specific events in the economy and the market. It’s not unusual for price reductions to peak in October before the mid-winter holiday slowdown begins in mid-November.
Mortgage Interest Rates, Long-Term Trends since 1976
30-Year Conforming Fixed-Rate Loans, Weekly Average Readings

Freddie Mac, 30-Year Fixed Rate Mortgage Average in the United States from FRED, Federal Reserve Bank of St. Louis; https://fred.stlouisfed.org/series/MORTGAGEOUS. Data from sources deemed reliable but not guaranteed. All numbers approximate.
August 3, 2023 Weekly Average Rates
30-Year Fixed: 6.9%
15-Year Fixed: 6.25%
Affected by a number of often volatile economic factors, it can be very difficult to accurately predict short-term interest rate changes.
Inflation: Consumer Price Index, 1982 - 2023*
3-Month-Rolling Average, Year-over-Year% Change, Long-Term Trends

*3-month rolling average of Consumer Price Index for All Urban Consumers: All Items in U.S. City Average [CPIAUCSL], Federal Reserve Bank of St. Louis; https://fred.stlouisfed.org/graph/?g=8dGq. Data from U.S. Bureau of Labor Statistics. CPIAUCSL is a price index of a basket of goods and services paid by urban consumers. This particular index includes roughly 88 percent of the total population. Data from sources deemed reliable, but may contain errors and subject to revision.
The monthly inflation reading for June 2023 fell to 3.1%, continuing the decline from its June 2022 peak of 8.9%, and the lowest reading since March 2021.
S&P 500 Stock Index, since 1994*
January Opening Values except as specified

*An approximate illustration only. January opening value data points except as noted in horizontal axis. Data from sources deemed reliable but may contain errors and subject to revision. Financial markets are prone to significant volatility even on a short-term basis.
January opening values, except as specified. Market fluctuations between illustrated data points were common and sometimes very dramatic.
San Francisco Bay Area Unemployment Rates
Selected Bay Area Counties, 2019 - 2023 YTD

Estimates per CA Employment Development Dept. (EDD). Data from sources deemed reliable, but may contain errors and subiect to revision. All numbers approximate. EDD often revises estimates in later reports.
Federal Funds Interest Rate since 1981
& Economic Interventions by Federal Reserve Bank*

* Per Federal Reserve Bank of St. Louis and New York; https://fred.stlouisfed.org/series/FEDFUNDS; Last reading per https://www.newyorkfed.org/markets/reference-rates/effr. Other data referenced from sources deemed reliable, but may contain errors and subject to revision. Commentary subject to disagreement.
Lowering interest rates – via the federal funds target rate and, since 2008, through “quantitative easing” (QE), buying trillions of dollars in securities – is the major tool of the Federal Reserve Bank (Fed) to stimulate stronger economic conditions. But too-low rates over too long a period can also fuel the economy into overheating, causing irrational exuberance in markets, asset bubbles, high debt levels, inflation, and, in 2023, bank crises. The July 2023 Fed rate is the highest since 2001. This chart illustrates how the Fed’s interventions have influenced the market.
Early 1980’s: Fed aggressively raises fed funds target rate to lower inflation rate
Early 1990’s recession: Fed drops target interest rate 18 times, 1990-92
Dotcom crash, 9/11 attack: Fed drops fed fund rate 12 times, 2001-02
Subprime crash: Fed drops rate 10 times to effectively zero in 2007-08; QE 1-3 buys approx. $4 trillion in securities through 2012
2019, 2020, 2021: Fed drops rate to effectively zero; QE-4 buys $6 trillion in securities to keep interest rates depressed; $5 trillion in govt. stimulus
2022/23: To counter inflation, Fed begins multiple increases of target rate; QE-4 program ends
Statistics are generalities, essentially summaries of widely disparate data generated by dozens, hundreds or thousands of unique, individual sales occurring within different time periods. They are best seen not as precise measurements, but as broad, comparative indicators, with reasonable margins of error. Anomalous fluctuations in statistics are not uncommon, especially in smaller, expensive market segments. Last period data should be considered estimates that may change with late-reported data. Different analytics programs sometimes define statistics – such as “active listings,” “days on market,” and “months supply of inventory” – differently: what is most meaningful are not specific calculations but the trends they illustrate. Most listing and sales data derives from the local or regional multi-listing service (MLS) of the area specified in the analysis, but not all listings or sales are reported to MLS and these won’t be reflected in the data. “Homes” signifies real-property, single-household housing units: houses, condos, co-ops, townhouses, duets and TICs (but not mobile homes), as applicable to each market. City/town names refer specifically to the named cities and towns, unless otherwise delineated. Multi-county metro areas will be specified as such. Data from sources deemed reliable, but may contain errors and subject to revision. All numbers to be considered approximate.
Many aspects of value cannot be adequately reflected in median and average statistics: curb appeal, age, condition, amenities, views, lot size, quality of outdoor space, “bonus” rooms, additional parking, quality of location within the neighborhood, and so on. How any of these statistics apply to any particular home is unknown without a specific comparative market analysis.
Median Sales Price is that price at which half the properties sold for more and half for less. It may be affected by seasonality, “unusual” events, or changes in inventory and buying trends, as well as by changes in fair market value. The median sales price for an area will often conceal an enormous variety of sales prices in the underlying individual sales.
Dollar per Square Foot is based upon the home’s interior living space and does not include garages, unfinished attics and basements, rooms built without permit, patios, decks or yards (though all those can add value to a home). These figures are usually derived from appraisals or tax records, but are sometimes unreliable (especially for older homes) or unreported altogether. The calculation can only be made on those home sales that reported square footage.
Compass is a real estate broker licensed by the State of California, DRE 01527235. Equal Housing Opportunity. This report has been prepared solely for information purposes. The information herein is based on or derived from information generally available to the public and/or from sources believed to be reliable. No representation or warranty can be given with respect to the accuracy or completeness of the information. Compass disclaims any and all liability relating to this report, including without limitation any express or implied representations or warranties for statements contained in, and omissions from, the report. Nothing contained herein is intended to be or should be read as any regulatory, legal, tax, accounting or other advice and Compass does not provide such advice. All opinions are subject to change without notice. Compass makes no representation regarding the accuracy of any statements regarding any references to the laws, statutes or regulations of any state are those of the author(s). Past performance is no guarantee of future results.