August 2025 Market Report

“San Francisco has had its share of tech companies since the dot-com boom, but the money pouring into artificial intelligence has lately supercharged the city’s tech profile…Last year, [SF companies] raised nearly $35 billion [in venture capital funding]…The change is visible. Rents are climbing again. City buses are filling back up. And the face of San Francisco is starting to look younger…The city is the tech industry’s hub for artificial intelligence.” “What if San Francisco is the new Silicon Valley?” The New York Times, 8/4/25
Over the past couple years, the AI boom has most dramatically affected the housing markets in Silicon Valley, with their established players like Nvidia. San Francisco, though home to major AI firms like OpenAI and Anthropic, has been affected, but much more modestly – but that is now rapidly changing. The AI industry is exploding in the city, with dozens of new startups making San Francisco their home, and the city has become a powerful magnet for those eager to participate in perhaps the biggest technological/economic revolution of our times. Just as in the dotcom and recent high-tech booms, they are doing so due to the network effect, i.e. the tremendously dynamic synergies of being within a half mile - or even a hundred yards - of each other. That is a huge plus for the best and the brightest flocking to AI, for companies growing fast, and for the intense cross-fertilization of ideas characterizing the industry.
This has shifted the SF housing market into one of the strongest in the Bay Area, diverging from the cooling trends seen in most other counties and the country at large. Unlike most other markets, the supply of listings is dropping, price reductions are declining, and home prices are starting to climb year-over-year. And these are very early days for the AI boom in the city: If trends continue on course, hiring accelerates, startups grow, and privately held companies eventually move toward IPOs, the explosion of new wealth will likely be astounding.
Report created in good faith using data from sources deemed reliable but may contain errors and subject to revision. Last period figures are preliminary estimates based on data available early in the following month. All numbers approximate, and may change with late-reported activity.
Mortgage Interest Rates since Early 2023
30-Year Fixed-Rate Loans, Daily Average Readings*

*Per https://www.mortgagenewsdaily.com/: “Rate offerings vary—sometimes substantially—from lender to lender... The index is expressed as an average.” Daily rates can change quickly. Data from sources deemed reliable, but not guaranteed. All numbers approximate.
In early August, rates hit their lowest point of 2025.
Rates vary according to the property, price, borrower and lender.
Financial Markets, 2024 – 2025 YTD
Percentage Increases in S&P 500 & Nasdaq since 1/2/24

Data per MarketWatch.com. Data from source deemed reliable but may contain errors and subject to revision. Financial market values change constantly and all numbers to be considered approximate. Financial markets have been prone to significant volatility.
Stock markets have shrugged off concerns regarding tariff policies and inflation to hit new highs in recent weeks.
Large changes in stock markets can dramatically affect household wealth, consumer confidence and housing markets, especially more affluent markets.
San Francisco HOUSE Price Trends since 1990
Monthly Median House Sales Prices, 3-Month Rolling
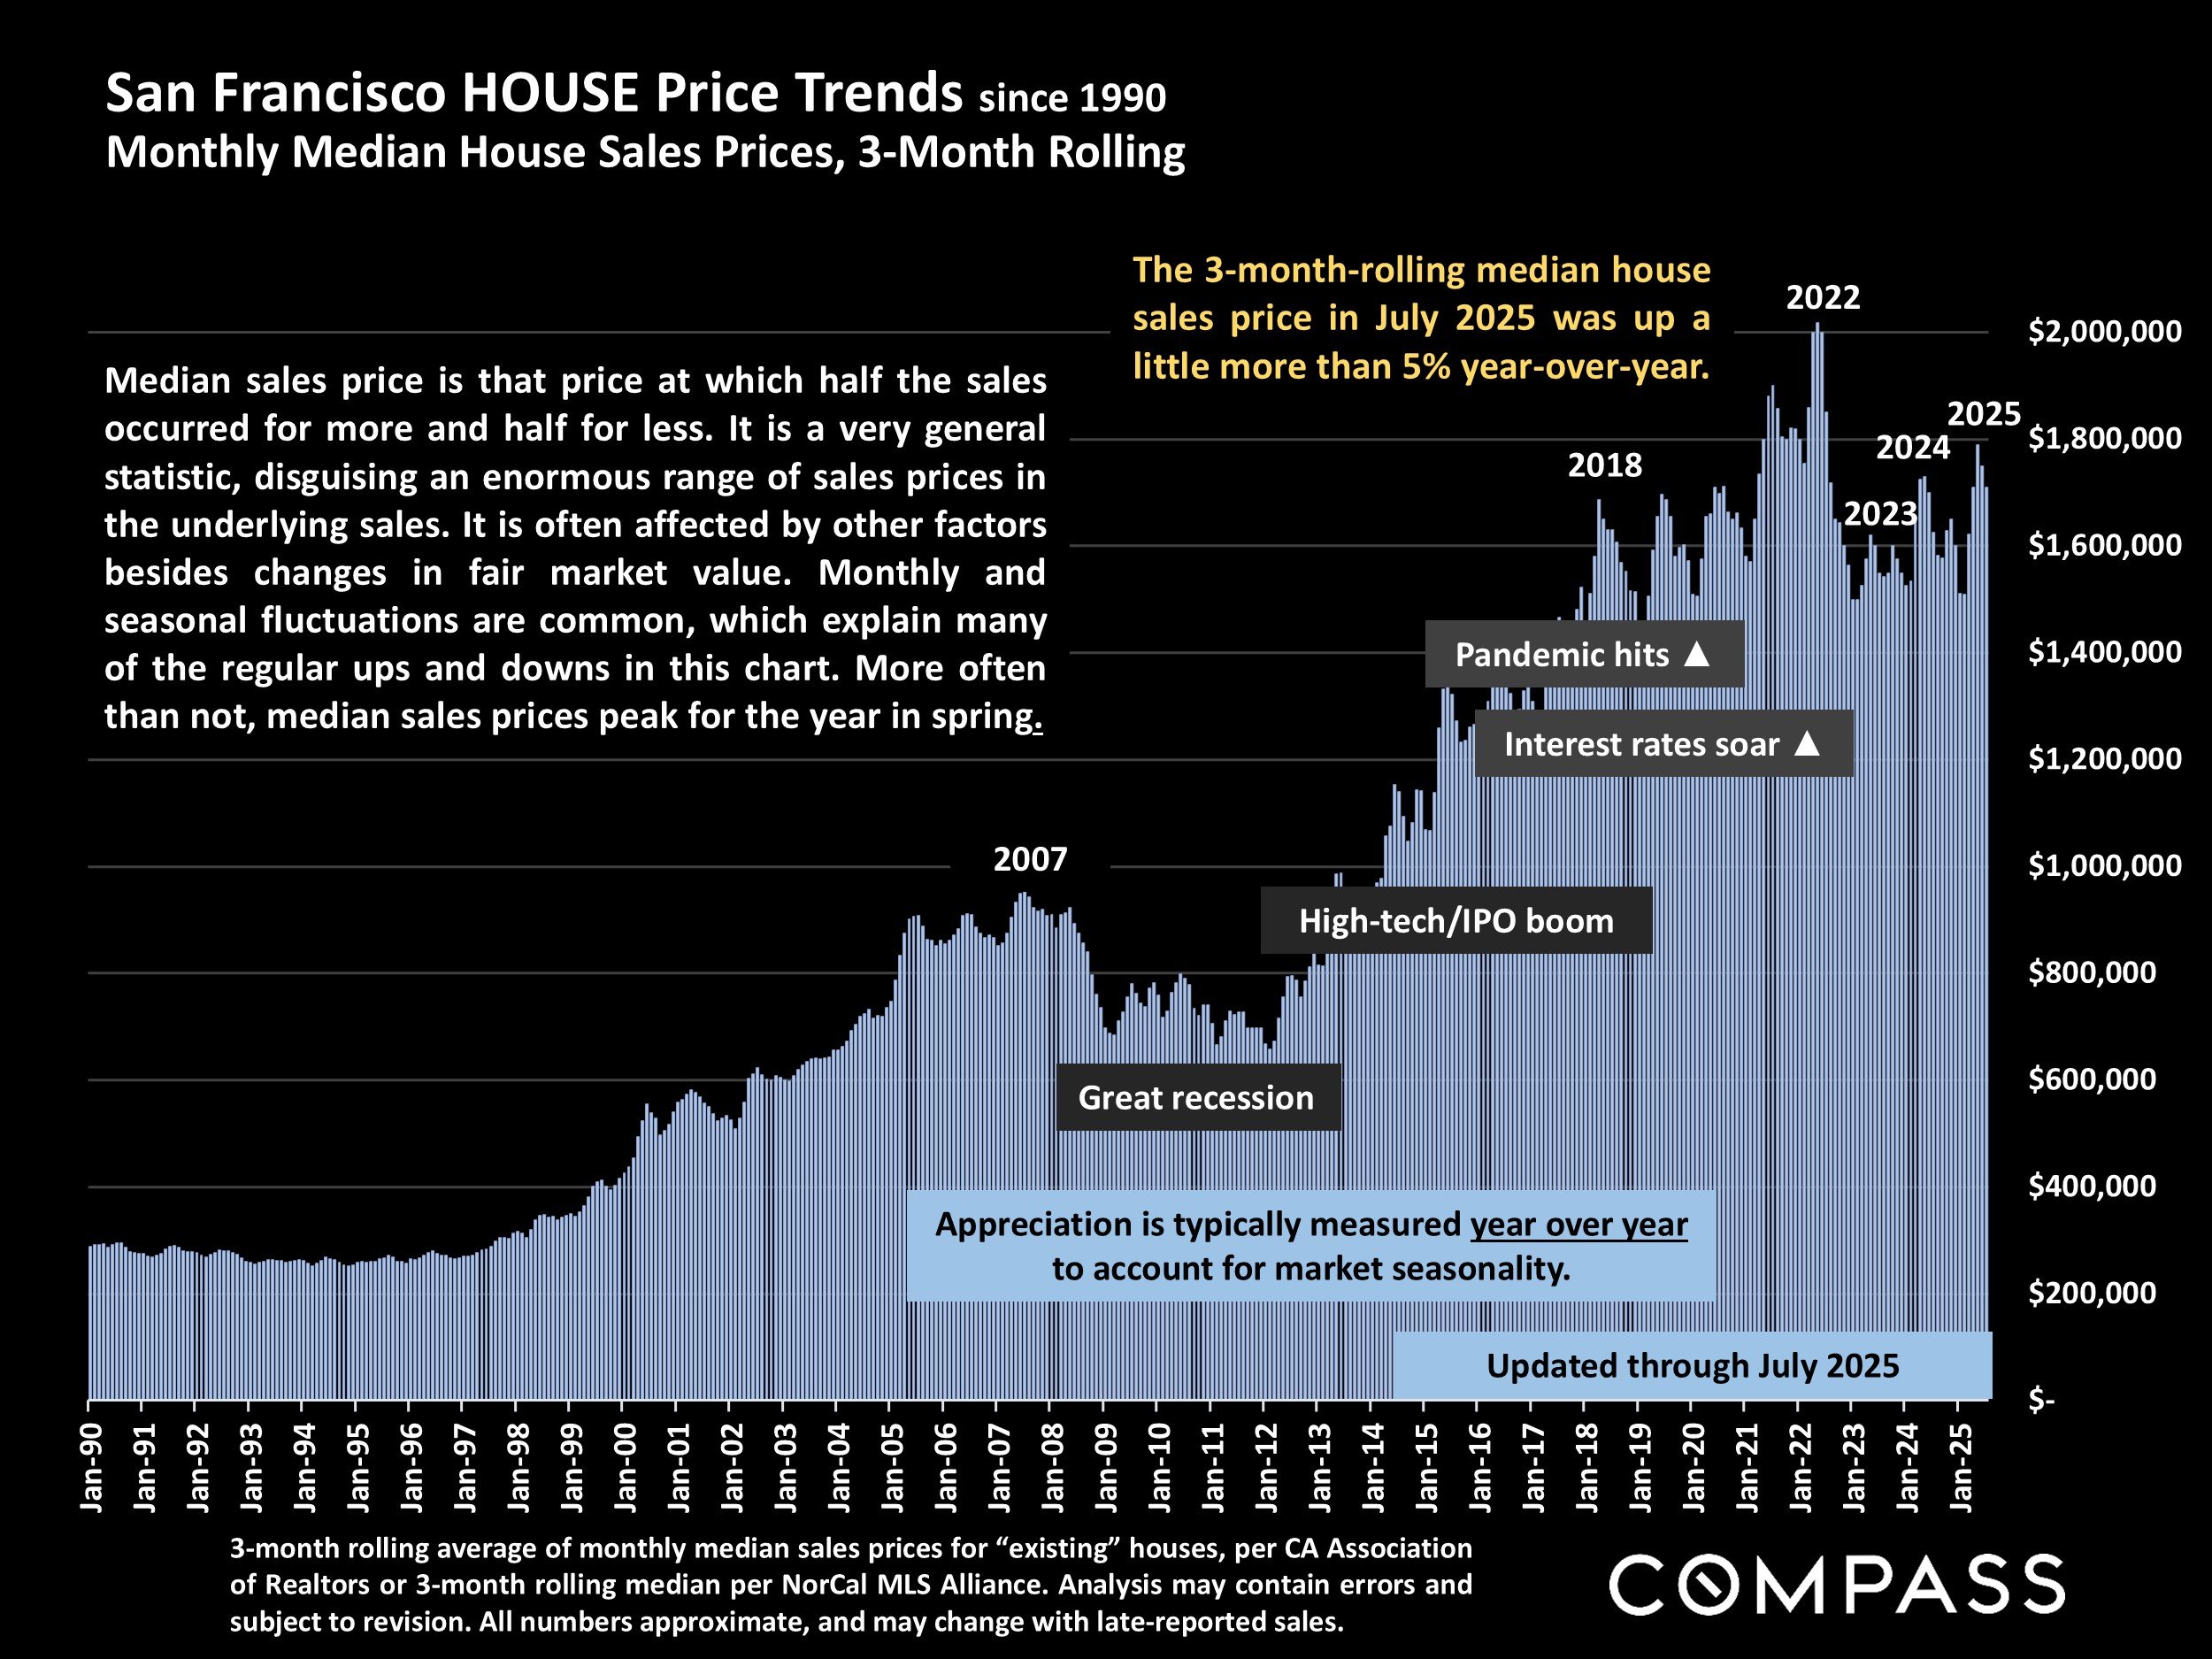
3-month rolling average of monthly median sales prices for “existing” houses, per CA Association of Realtors or 3-month rolling median per NorCal MLS Alliance. Analysis may contain errors and subject to revision. All numbers approximate, and may change with late-reported sales.
The 3-month-rolling median house sales price in July 2025 was up a little more than 5% year-over-year.
Median sales price is that price at which half the sales occurred for more and half for less. It is a very general statistic, disguising an enormous range of sales prices in the underlying sales. It is often affected by other factors besides changes in fair market value. Monthly and seasonal fluctuations are common, which explain many of the regular ups and downs in this chart. More often than not, median sales prices peak for the year in spring.
July 2025 Median House Sales Prices & Appreciation Rates
Month-Rolling Sales, Greater Bay Area + Sacramento, by County*

*3-month-rolling sales reported to NorCal MLS Alliance by August 5, 2025, per Infosparks. Data from sources deemed reliable, but may contain errors and subject to revision. All numbers are approximate and late-reported sales may change prices and appreciation rates.
While most of the Bay Area house prices declined or were flat, San Francisco grew by 5.2%, the highest y-o-y appreciation rate in the region.
Median sales price is that price at which half the sales occurred for more and half for less. It is a very general statistic that can be affected by other factors besides changes in fair market value.
Though there are significant variances between counties, a median house in the Bay Area typically is a 3 bedroom, 2 bath home of approximately 1600 to 1900 square feet.
San Francisco CONDO Price Trends since 2005
Median Condo Sales Price, 3-Month Rolling
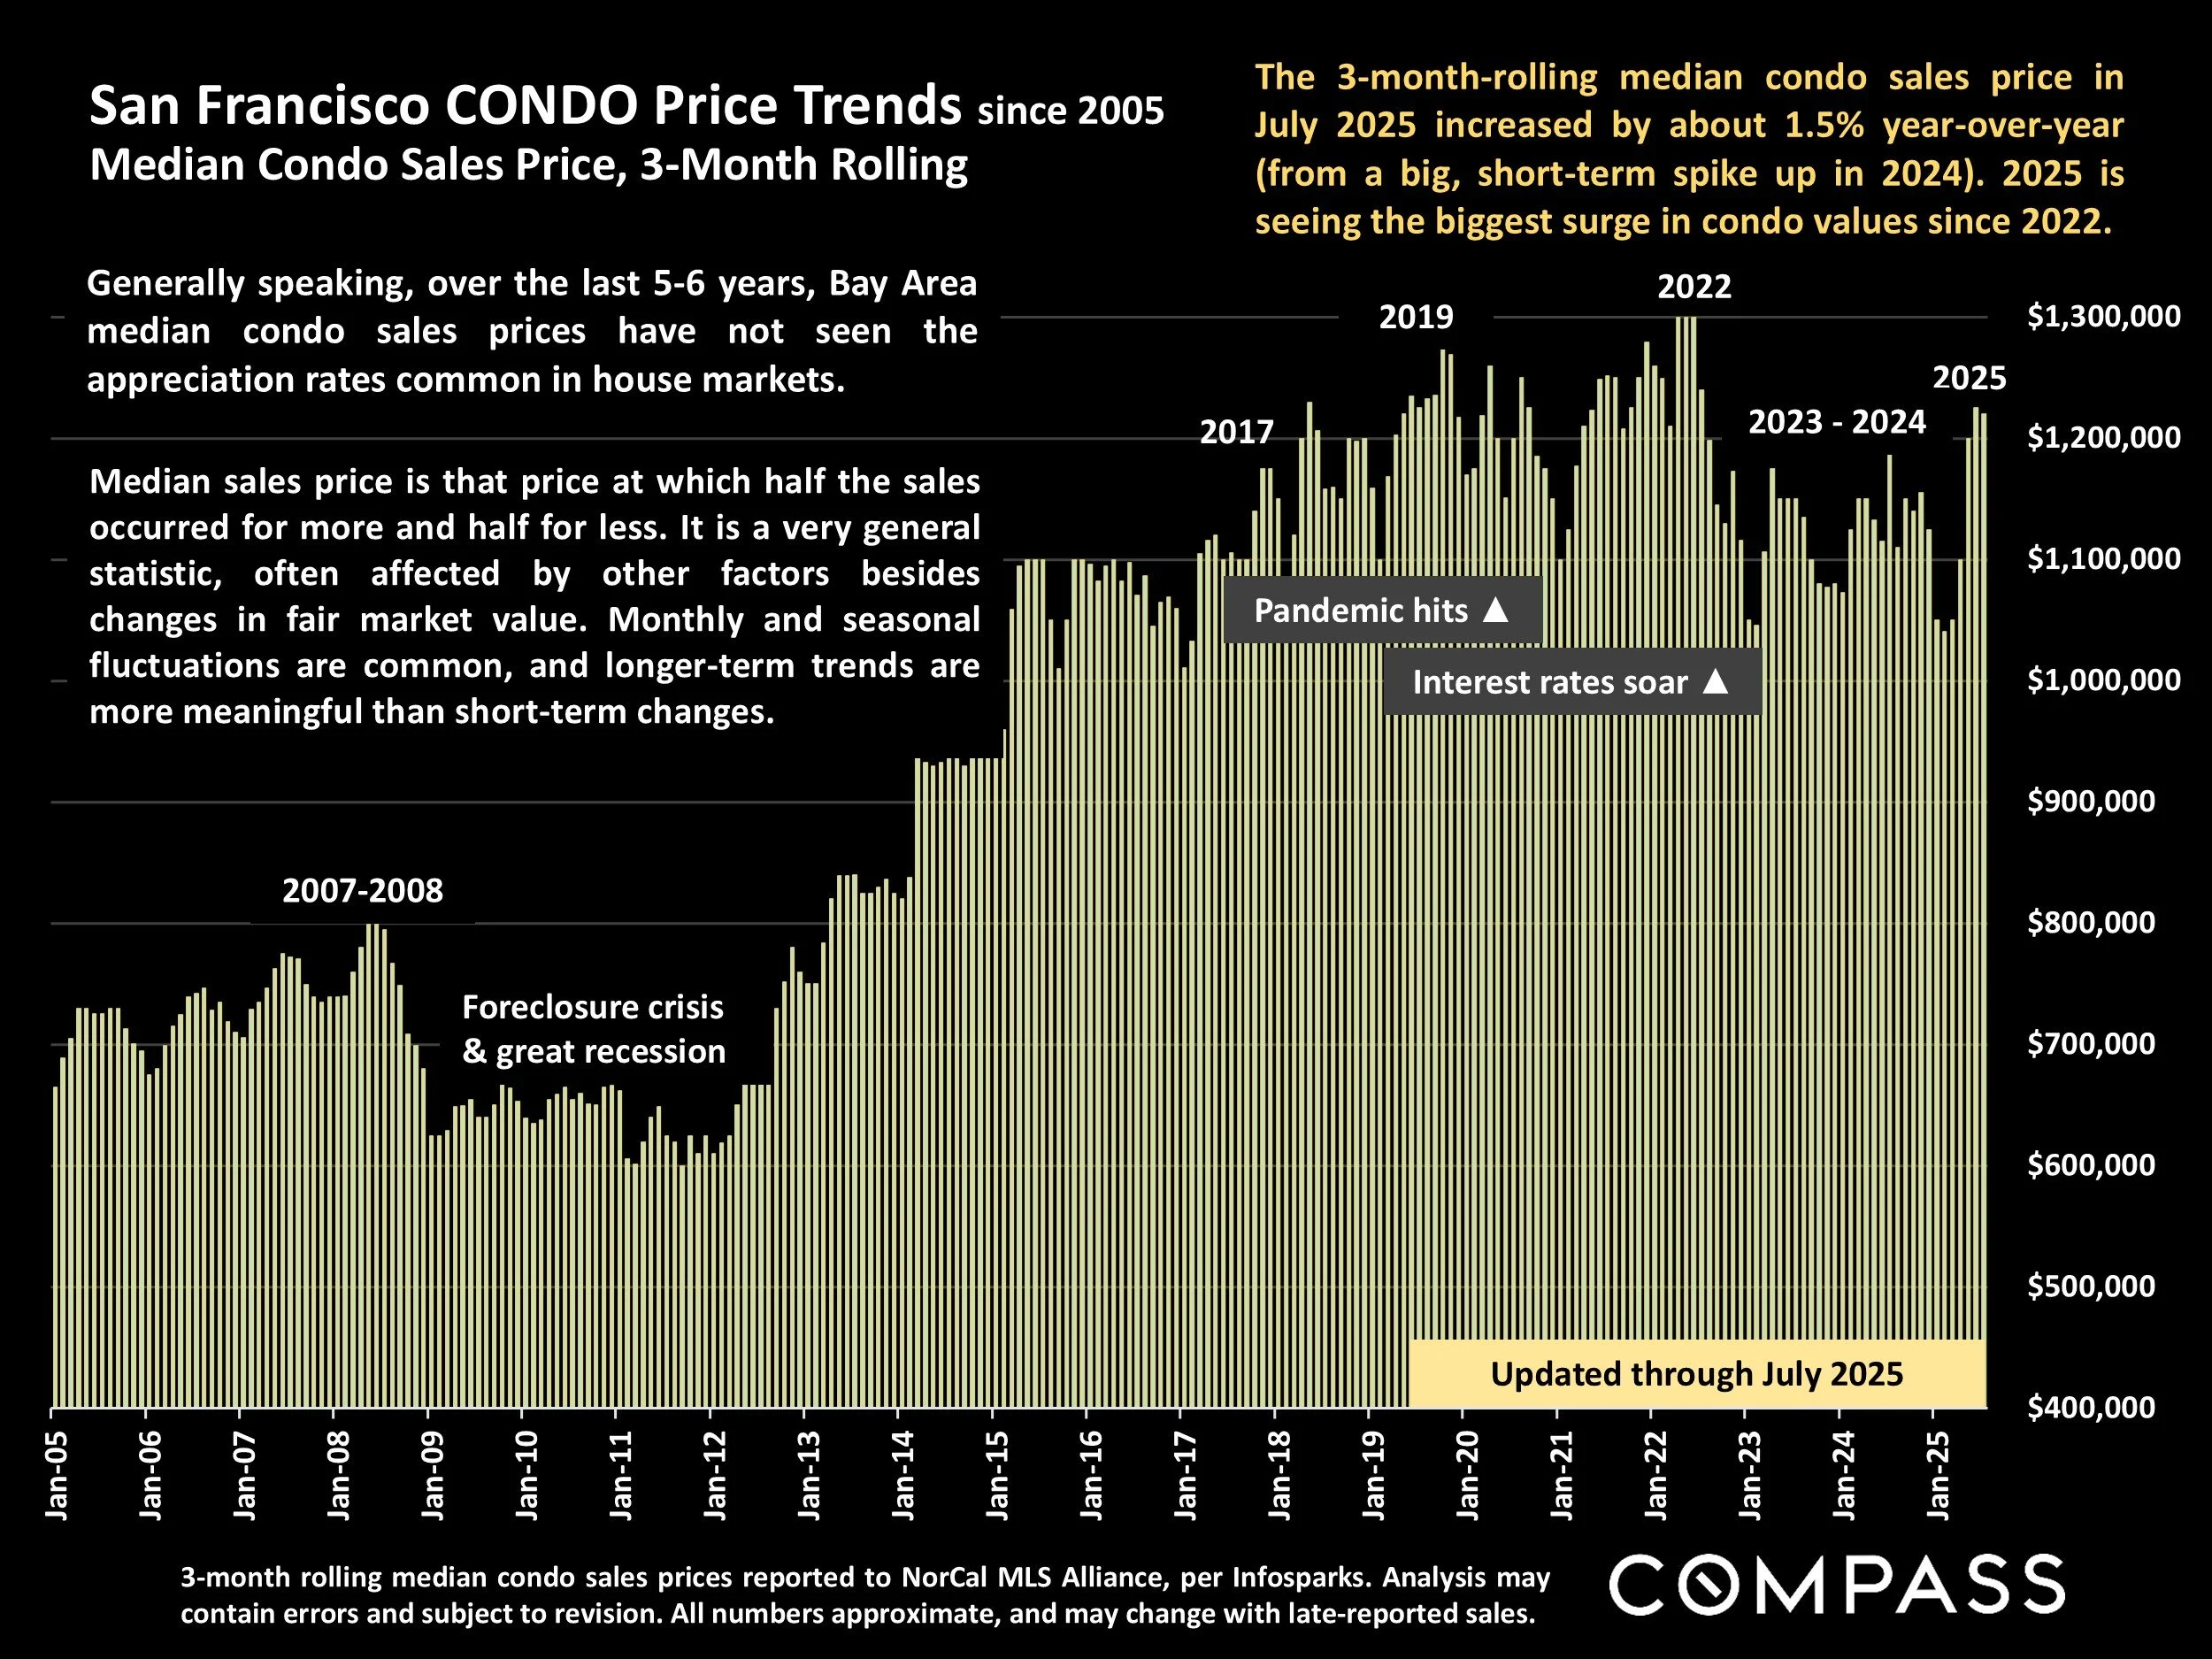
3-month rolling median condo sales prices reported to NorCal MLS Alliance, per Infosparks. Analysis may contain errors and subject to revision. All numbers approximate, and may change with late-reported sales.
The 3-month-rolling median condo sales price in July 2025 increased by about 1.5% year-over-year (from a big, short-term spike up in 2024). 2025 is seeing the biggest surge in condo values since 2022.
Generally speaking, over the last 5-6 years, Bay Area median condo sales prices have not seen the appreciation rates common in house markets.
Median sales price is that price at which half the sales occurred for more and half for less. It is a very general statistic, often affected by other factors besides changes in fair market value. Monthly and seasonal fluctuations are common, and longer-term trends are more meaningful than short-term changes.
San Francisco Value Trends since 2005
3-Month-Rolling, Median Dollar per Square Foot Values*
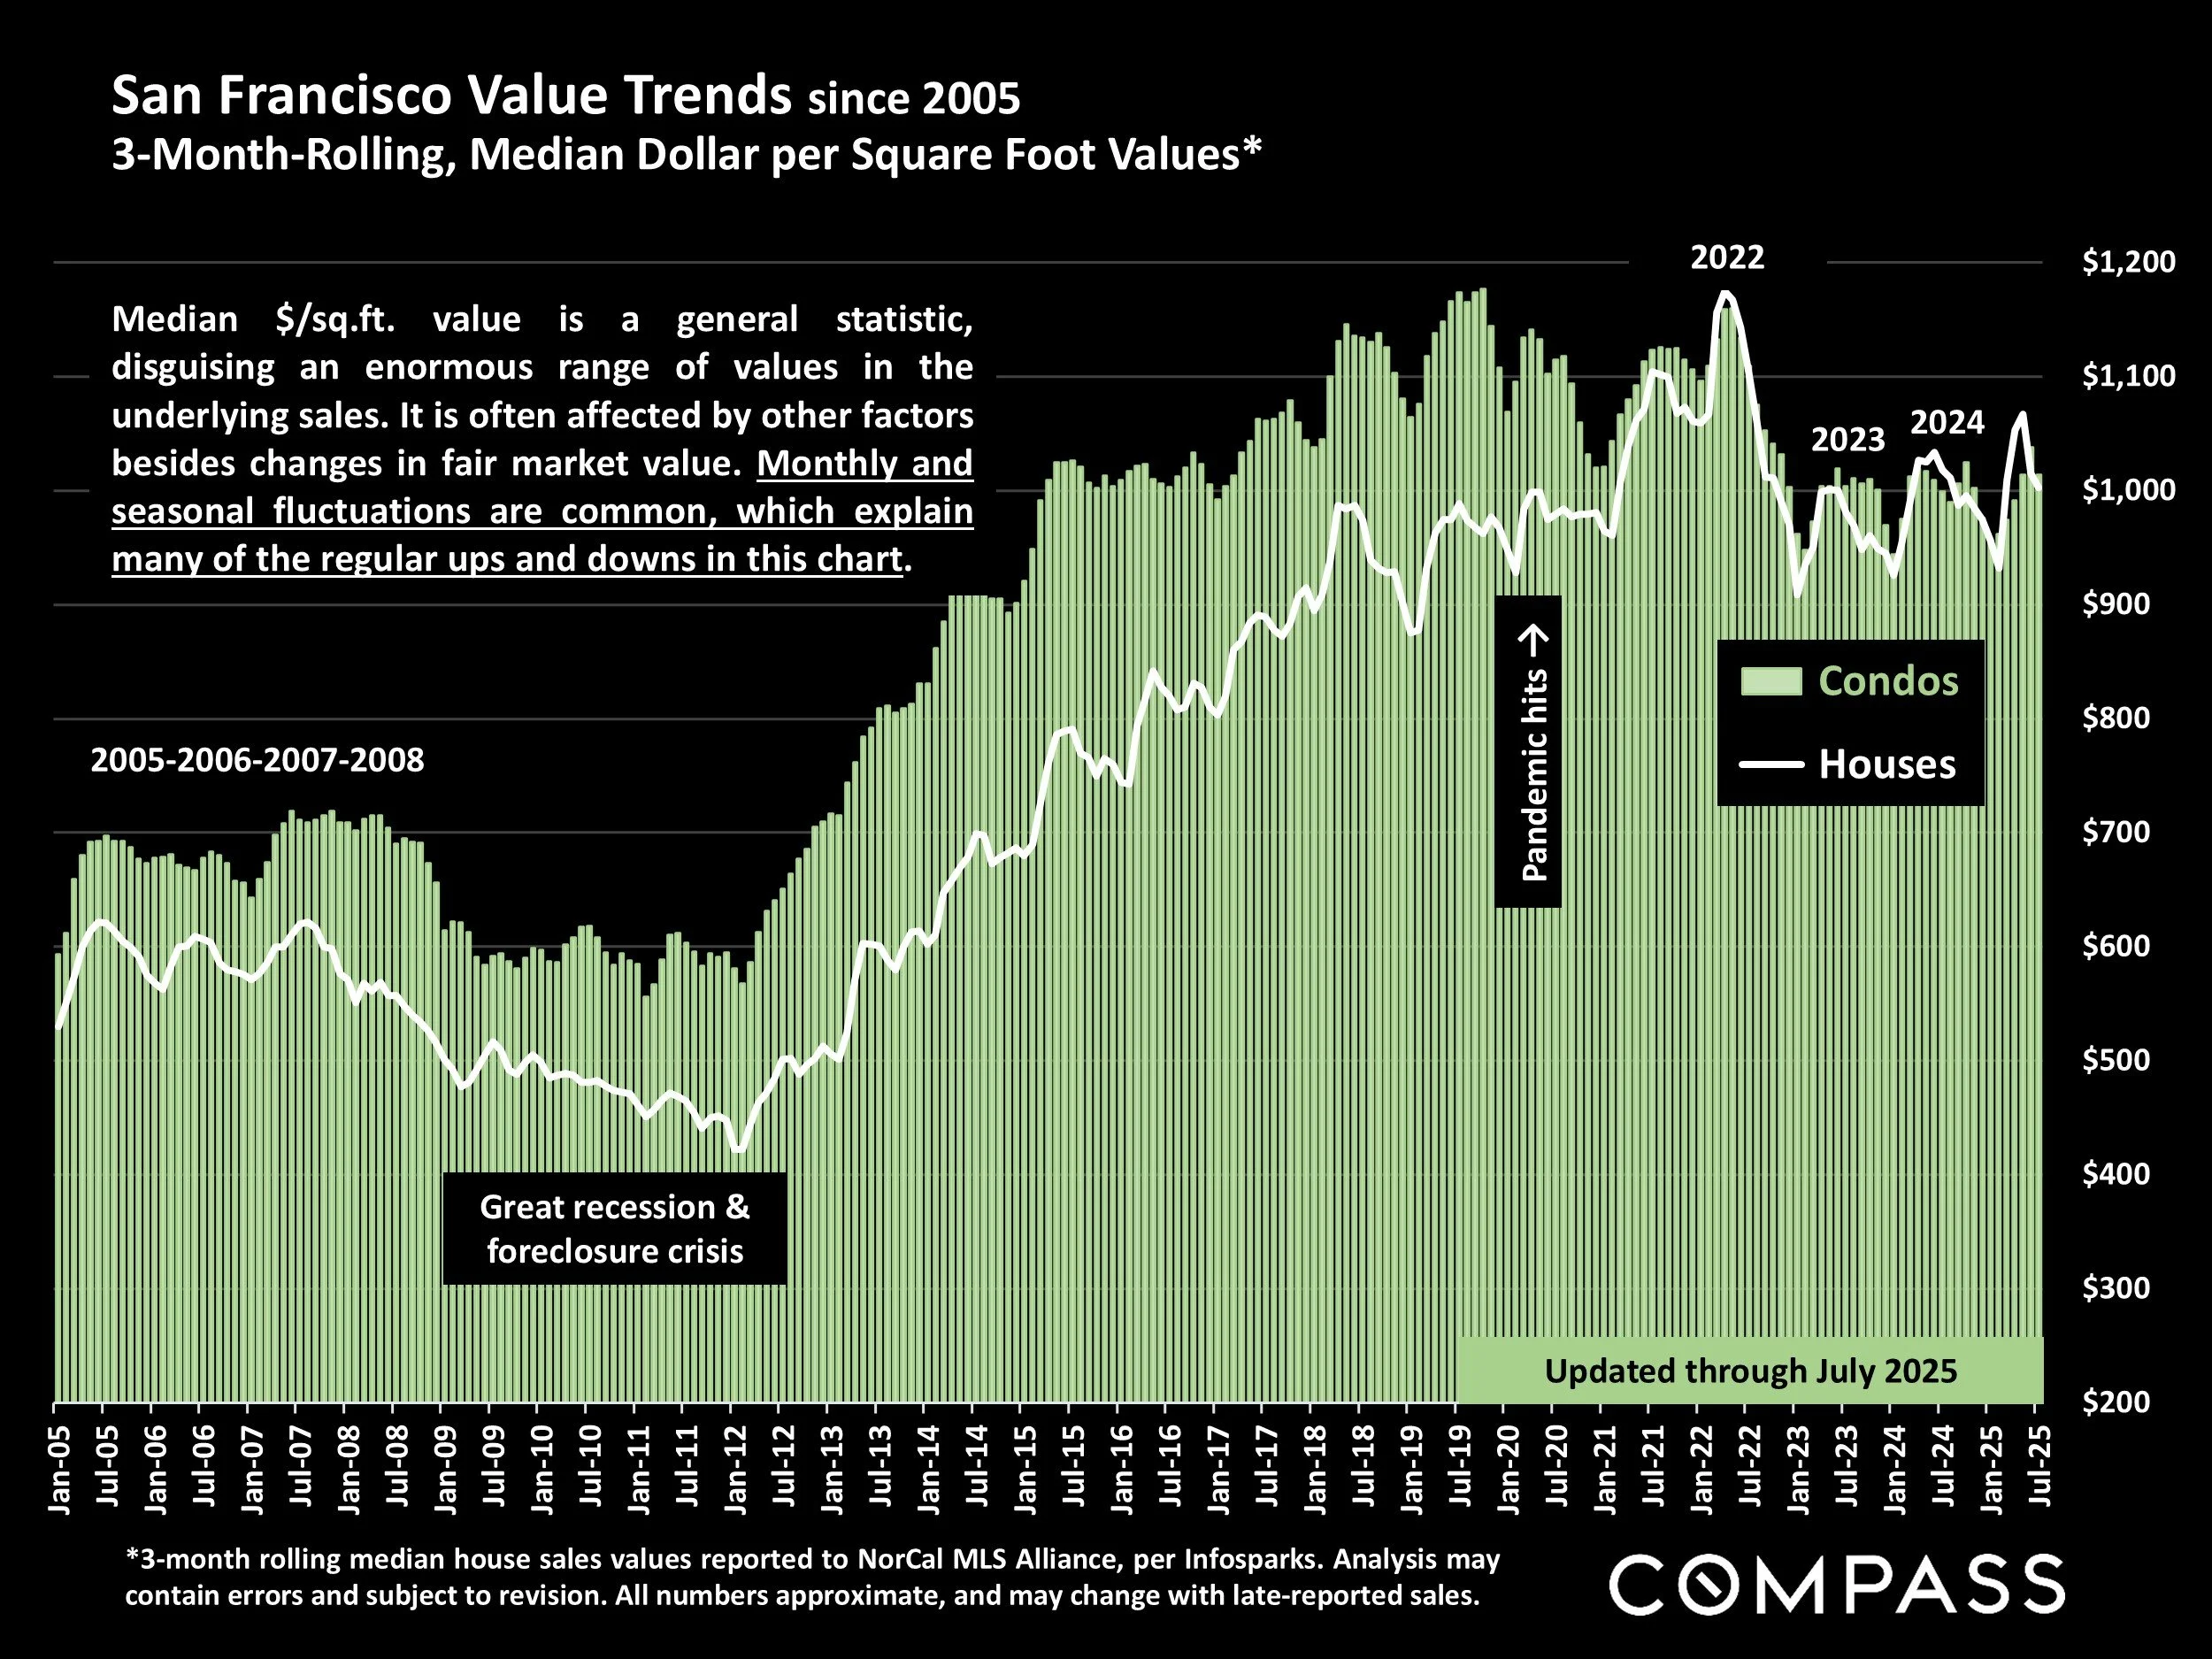
*3-month rolling median house sales values reported to NorCal MLS Alliance, per Infosparks. Analysis may contain errors and subject to revision. All numbers approximate, and may change with late-reported sales.
Median $/sq.ft. value is a general statistic, disguising an enormous range of values in the underlying sales. It is often affected by other factors besides changes in fair market value. Monthly and seasonal fluctuations are common, which explain many of the regular ups and downs in this chart.
San Francisco CONDO Prices: Downtown vs. Non-Downtown
12-Month-Rolling, Median 2-Bedroom Condo Sales Prices since 2005*

*12-month rolling median condo sales values reported to NorCal MLS Alliance, per Infosparks. Analysis may contain errors and subject to revision. Does not include new-project sales unreported to MLS. All numbers approximate, and may change with late-reported sales.
Comparing median 2-bedroom condo sales prices in the greater Downtown/South of Market/Civic Center area (the center of large-project, new-condo construction, office buildings and high-tech employment) – the blue line – with the rest of San Francisco (mostly smaller, older buildings, in less urban environments) – the green line.
Median sales prices also vary widely within these two broad regions.
NOTE: 12-month-rolling sales data smooths the median sales price trend lines and removes seasonality from the analysis, but it can lag short-term changes in 2025.
San Francisco Residential Market
Comparative Market Dynamics by Price Segment/Property Type
| 4 Bedroom, 3 Bath Houses | 5+ Bedroom, 4+ Bath Houses, 3000+ sq.ft. |
||||||
|---|---|---|---|---|---|---|---|
| County In alphabetical order |
Median Sales Price | Median Sq. Ft. | Median $/Sq. Ft. | Median Sales Price | Median Sq.Ft./ Median Lot Size |
Median $/Sq. Ft. | |
| Alameda County | $1,650,000 | 2196 sq.ft. | $740/sq.ft. | $2,772,500 | 3910 sq.ft./ .25 acre |
$693/sq.ft. | |
| Contra Costa | $1,050,000 | 2339 sq.ft. | $469/sq.ft. | $2,535,500 | 3939 sq.ft./ .35 acre |
$619/sq.ft. | |
| Marin County | $1,912,500 | 2516 sq.ft. | $773/sq.ft. | $3,772,500 | 4049 sq.ft./ .42 acre |
$947/sq.ft. | |
| Monterey County | $1,130,000 | 2336 sq.ft. | $464/sq.ft. | $3,800,000 | 4285 sq.ft./ 1.25 acres |
$815/sq.ft. | |
| Napa County | $1,155,000 | 2329 sq.ft. | $510/sq.ft. | $2,650,000 | 4171 sq.ft./ .45 acre |
$596/sq.ft. | |
| San Francisco | $2,160,000 | 2236 sq.ft. | $935/sq.ft. | $4,900,000 | 4270 sq.ft./ .07 acre |
$1202/sq.ft. | |
| San Mateo County | $2,600,000 | 2300 sq.ft. | $1107/sq.ft. | $5,625,000 | 4624 sq.ft./ .53 acre |
$1281/sq.ft. | |
| Santa Clara County | $2,260,000 | 2192 sq.ft. | $1035/sq.ft. | $4,545,000 | 4007 sq.ft./ .30 acre |
$1086/sq.ft. | |
| Santa Cruz County | $1,635,000 | 2275 sq.ft. | $709/sq.ft. | $2,287,500 | 3823 sq.ft./ .87 acre |
$601/sq.ft. | |
| Solano County | $700,000 | 2198 sq.ft. | $319/sq.ft. | $906,000 | 3680 sq.ft./ .20 acre |
$262/sq.ft. | |
| Sonoma County | $920,000 | 2248 sq.ft. | $423/sq.ft. | $2,050,000 | 3809 sq.ft./ .69 acre |
$490/sq.ft. |
| 2 Bedroom, 1-2 Bath Houses | 3 Bedroom, 2 Bath Houses | ||||||
|---|---|---|---|---|---|---|---|
| County In alphabetical order |
Median Sales Price | Median Sq. Ft. | Median $/Sq. Ft. | Median Sales Price | Median Sq.Ft. | Median $/Sq. Ft. | |
| Alameda County | $790,000 | 1066 sq.ft. | $735/sq.ft. | $1,160,000 | 1435 sq.ft. | $796/sq.ft. | |
| Contra Costa | $600,000 | 1012 sq.ft. | $571/sq.ft. | $730,000 | 1440 sq.ft. | $537/sq.ft. | |
| Marin County | $1,300,000 | 1204 sq.ft. | $1023/sq.ft. | $1,390,000 | 1600 sq.ft. | $864/sq.ft. | |
| Monterey County | $790,000 | 1030 sq.ft. | $764/sq.ft. | $835,000 | 1485 sq.ft. | $570/sq.ft. | |
| Napa County | $800,000 | 1050 sq.ft. | $793/sq.ft. | $830,000 | 1455 sq.ft. | $600/sq.ft. | |
| San Francisco | $1,300,500 | 1177 sq.ft. | $1086/sq.ft. | $1,562,500 | 1598 sq.ft. | $978/sq.ft. | |
| San Mateo County | $1,375,000 | 1090 sq.ft. | $1273/sq.ft. | $1,718,000 | 1496 sq.ft. | $1167/sq.ft. | |
| Santa Clara County | $1,295,000 | 1059 sq.ft. | $1200/sq.ft. | $1,715,000 | 1380 sq.ft. | $1237/sq.ft. | |
| Santa Cruz County | $850,000 | 1076 sq.ft. | $780/sq.ft. | $1,255,000 | 1592 sq.ft. | $762/sq.ft. | |
| Solano County | $449,000 | 1252 sq.ft. | $357/sq.ft. | $550,000 | 1420 sq.ft. | $391/sq.ft. | |
| Sonoma County | $695,000 | 1193 sq.ft. | $588/sq.ft. | $810,000 | 1532 sq.ft. | $540/sq.ft. |
Bay Area Median Condo & Townhouse Values
12 Months Sales By Property Type & Bedroom/Bath Count*
| 2 Bedroom, 2 Bath Condos | 3 Bedroom, 2-3 Bath Townhouses | ||||||
|---|---|---|---|---|---|---|---|
| County In alphabetical order | Median Sales Price | Median Sq. Ft. | Median $/Sq. Ft. | Median Sales Price | Median Sq. Ft. | Median $/Sq. Ft. | |
| Alameda County | $630,000 | 1067 sq.ft. | $578/sq.ft. | $930,000 | 1516 sq.ft. | $624/sq.ft. | |
| Contra Costa | $565,000 | 1126 sq.ft. | $508/sq.ft. | $775,500 | 1539 sq.ft. | $517/sq.ft. | |
| Marin County | $675,000 | 1119 sq.ft. | $609/sq.ft. | $875,000 | 1598 sq.ft. | $539/sq.ft. | |
| Monterey County | $812,500 | 1216 sq.ft. | $631/sq.ft. | Too few sales | |||
| Napa County | $910,000 | 1157 sq.ft. | $832/sq.ft. | Too few sales | |||
| San Francisco | $1,250,000 | 1183 sq.ft. | $1035/sq.ft. | Too few sales | |||
| San Mateo County | $878,000 | 1184 sq.ft. | $748/sq.ft. | $1,483,000 | 1626 sq.ft. | $900/sq.ft. | |
| Santa Clara County | $800,000 | 1134 sq.ft. | $708/sq.ft. | $1,325,000 | 1570 sq.ft. | $836/sq.ft. | |
| Santa Cruz County | $832,000 | 1134 sq.ft. | $684/sq.ft. | $975,000 | 1523 sq.ft. | $630/sq.ft. | |
| Solano County | $392,500 | 1044 sq.ft. | $350/sq.ft. | $552,500 | 1499 sq.ft. | $317/sq.ft. | |
| Sonoma County | $419,000 | 1044 sq.ft. | $401/sq.ft. | $540,000 | 1333 sq.ft. | $389/sq.ft. |
How these values apply to any particular home is unknown without a specific comparative market analysis.
*Sales reported to NorCal MLS Alliance in the 12 months through late July 2025. Counties contain submarkets of widely varying values. “Fixer-uppers” excluded. Median values fluctuate for reasons besides changes in fair market value. Data from sources deemed reliable, but may contain errors and subject to revision. Numbers approximate, and data constantly changes as new sales occur. Not all sales are reported to MLS.
New Listings Coming on Market
San Francisco Market Dynamics & Seasonality*

*Per Realtor.com Research: https://www.realtor.com/research/data/, listings posted on site. Data from sources deemed reliable, but may contain errors and subject to revision. Not all listings are posted. May not include “coming-soon” listings. All numbers should be considered approximate.
The number of new listings in July 2025 declined substantially from June and year over year.
The number of new listings typically climbs through spring, declines in mid-summer, soars in September, and plunges in December.
Active & Coming-Soon Listings on 1st of Month*
San Francisco Homes Market
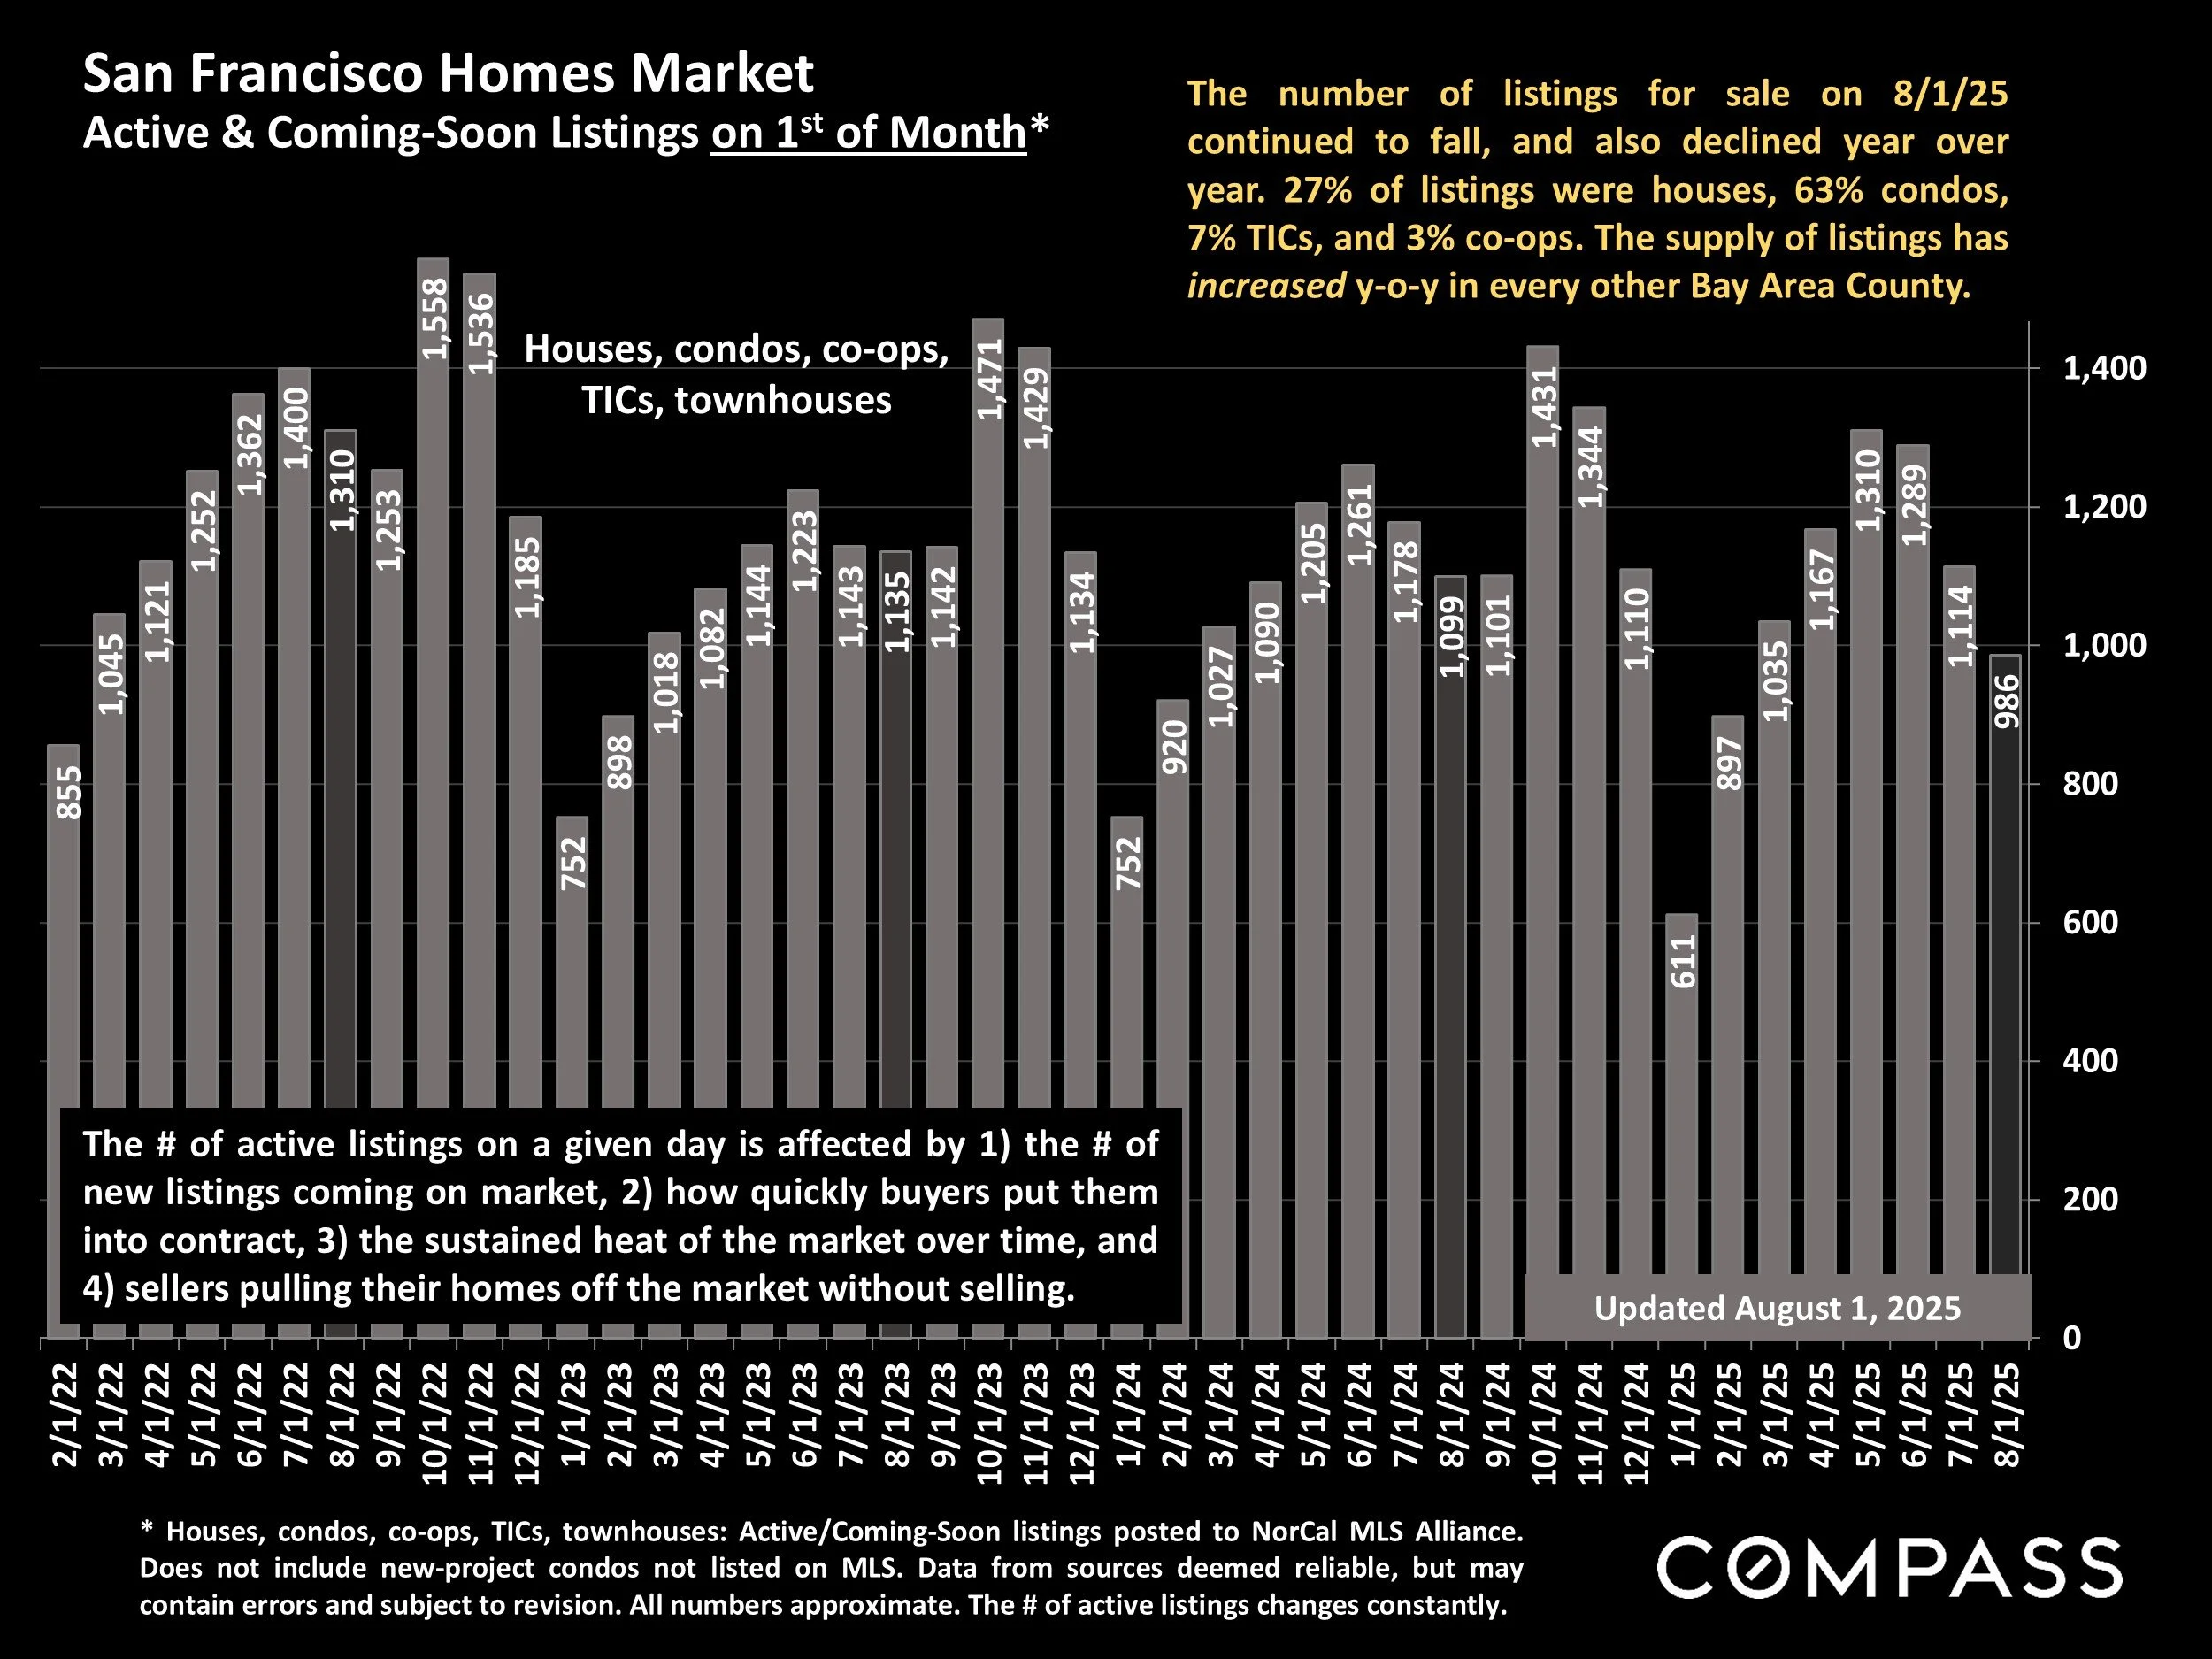
* Houses, condos, co-ops, TICs, townhouses: Active/Coming-Soon listings posted to NorCal MLS Alliance. Does not include new-project condos not listed on MLS. Data from sources deemed reliable, but may contain errors and subject to revision. All numbers approximate. The # of active listings changes constantly.
The number of listings for sale on 8/1/25 continued to fall, and also declined year over year. 27% of listings were houses, 63% condos, 7% TICs, and 3% co-ops. The supply of listings has increased y-o-y in every other Bay Area County.
The # of active listings on a given day is affected by 1) the # of new listings coming on market, 2) how quickly buyers put them into contract, 3) the sustained heat of the market over time, and 4) sellers pulling their homes off the market without selling.
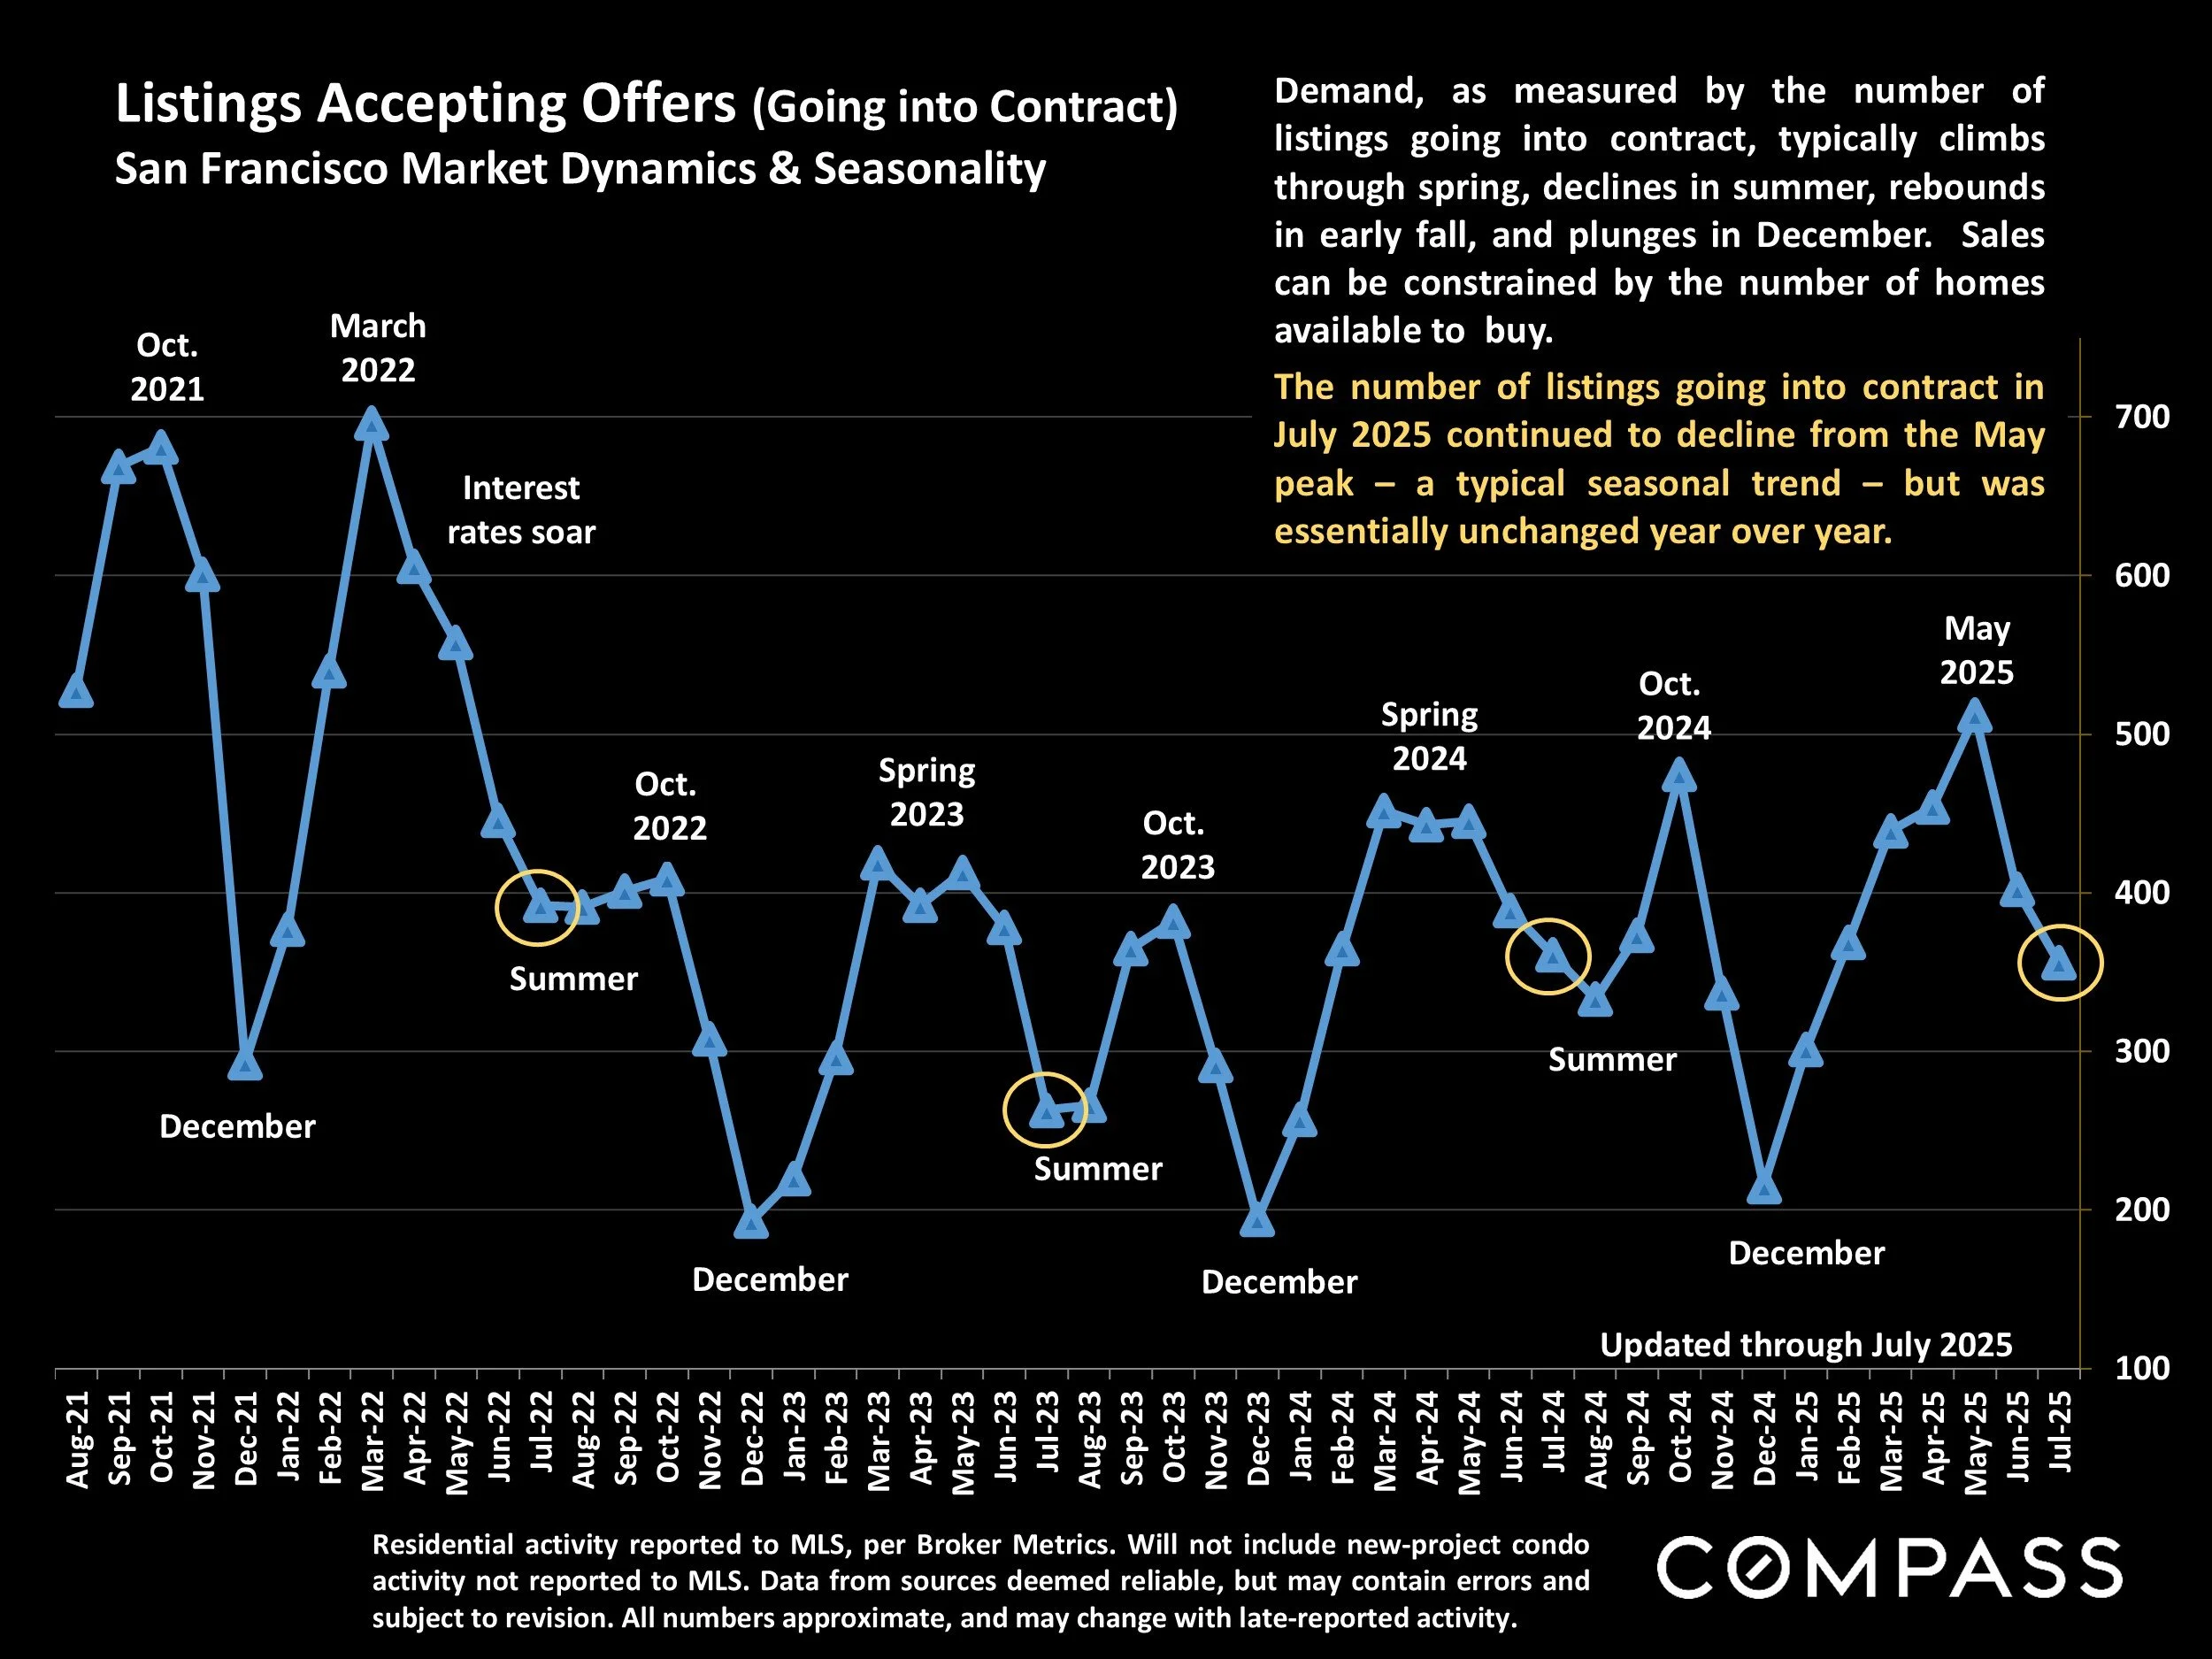
Listings Accepting Offers (Going into Contract)
San Francisco Market Dynamics & Seasonality
Residential activity reported to MLS, per Broker Metrics. Will not include new-project condo activity not reported to MLS. Data from sources deemed reliable, but may contain errors and subject to revision. All numbers approximate, and may change with late-reported activity.
The number of listings going into contract in July 2025 continued to decline from the May peak – a typical seasonal trend – but was essentially unchanged year over year.
Demand, as measured by the number of listings going into contract, typically climbs through spring, declines in summer, rebounds in early fall, and plunges in December. Sales can be constrained by the number of homes available to buy.
San Francisco Residential Market
Comparative Market Dynamics by Price Segment/Property Type
| Price/ Prop. Type | # Listings for Sale* | # Listings in Contract* | Monthly Rate of Sales** | Supply of Inventory*** | Avg. Days on Market** | Sales Over List Price** | Avg. Sales Price to LP %** |
|---|---|---|---|---|---|---|---|
| Under $1M | 453 | 149 | 106 sales/mo. | 4.3 months | 69 days | 31% | 98% |
| $1M - <2M | 334 | 127 | 192 sales/mo. | 1.7 months | 33 days | 65% | 108.5% |
| $2M - <3M | 89 | 25 | 56 sales/mo. | 1.6 months | 30 days | 67% | 107.5% |
| $3M - <5M | 68 | 9 | 30 sales/mo. | 2.3 months | 36 days | 57% | 104.5% |
| $5M - <7.5M | 25 | 4 | 6 sales/mo. | 4.2 months | 43 days | 32% | 98% |
| $7.5M - <10M | 17 | 4 | 2.25 sales/mo. | 7.6 months | 46 days | 22% | 97% |
| $10M+ | 16 | 1 | 1.6 sales/mo. | 10 months | too few sales | 16% | 91% |
| Houses | 277 | 131 | 188 sales/mo. | 1.5 months | 27 days | 75% | 111% |
| Condos | 612 | 151 | 174 sales/mo. | 3.5 months | 58 days | 36% | 99% |
| TICs | 74 | 21 | 22 sales/mo. | 3.4 months | 55 days | 42% | 100% |
| Co-ops | 29 | 6 | 5.5 sales/mo. | 5.3 months | 90 days | 18% | 96% |
Market indicators can change dramatically from period to period, due to both economic conditions and seasonal trends.
*Active/Coming-Soon Listings & Listings in Contract posted to MLS as of 7/31/25. **Sales statistics per last 12 months of sales, i.e. the annualized rate of activity. ***Months Supply of Inventory measures approx. time required to sell listings for sale at estimated annualized rate of sale: Lower readings signify higher demand compared to supply. Market activity typically ebbs and flows to seasonal trends.
Data reported to NorCal MLS Alliance and Infosparks, may contain errors and subject to revision. Not all activity is reported to MLS (including many new-project condo sales). All numbers approximate. Statistics based on past activity may not apply to future trends and can be distorted by outlier data (especially in low sales volumes).
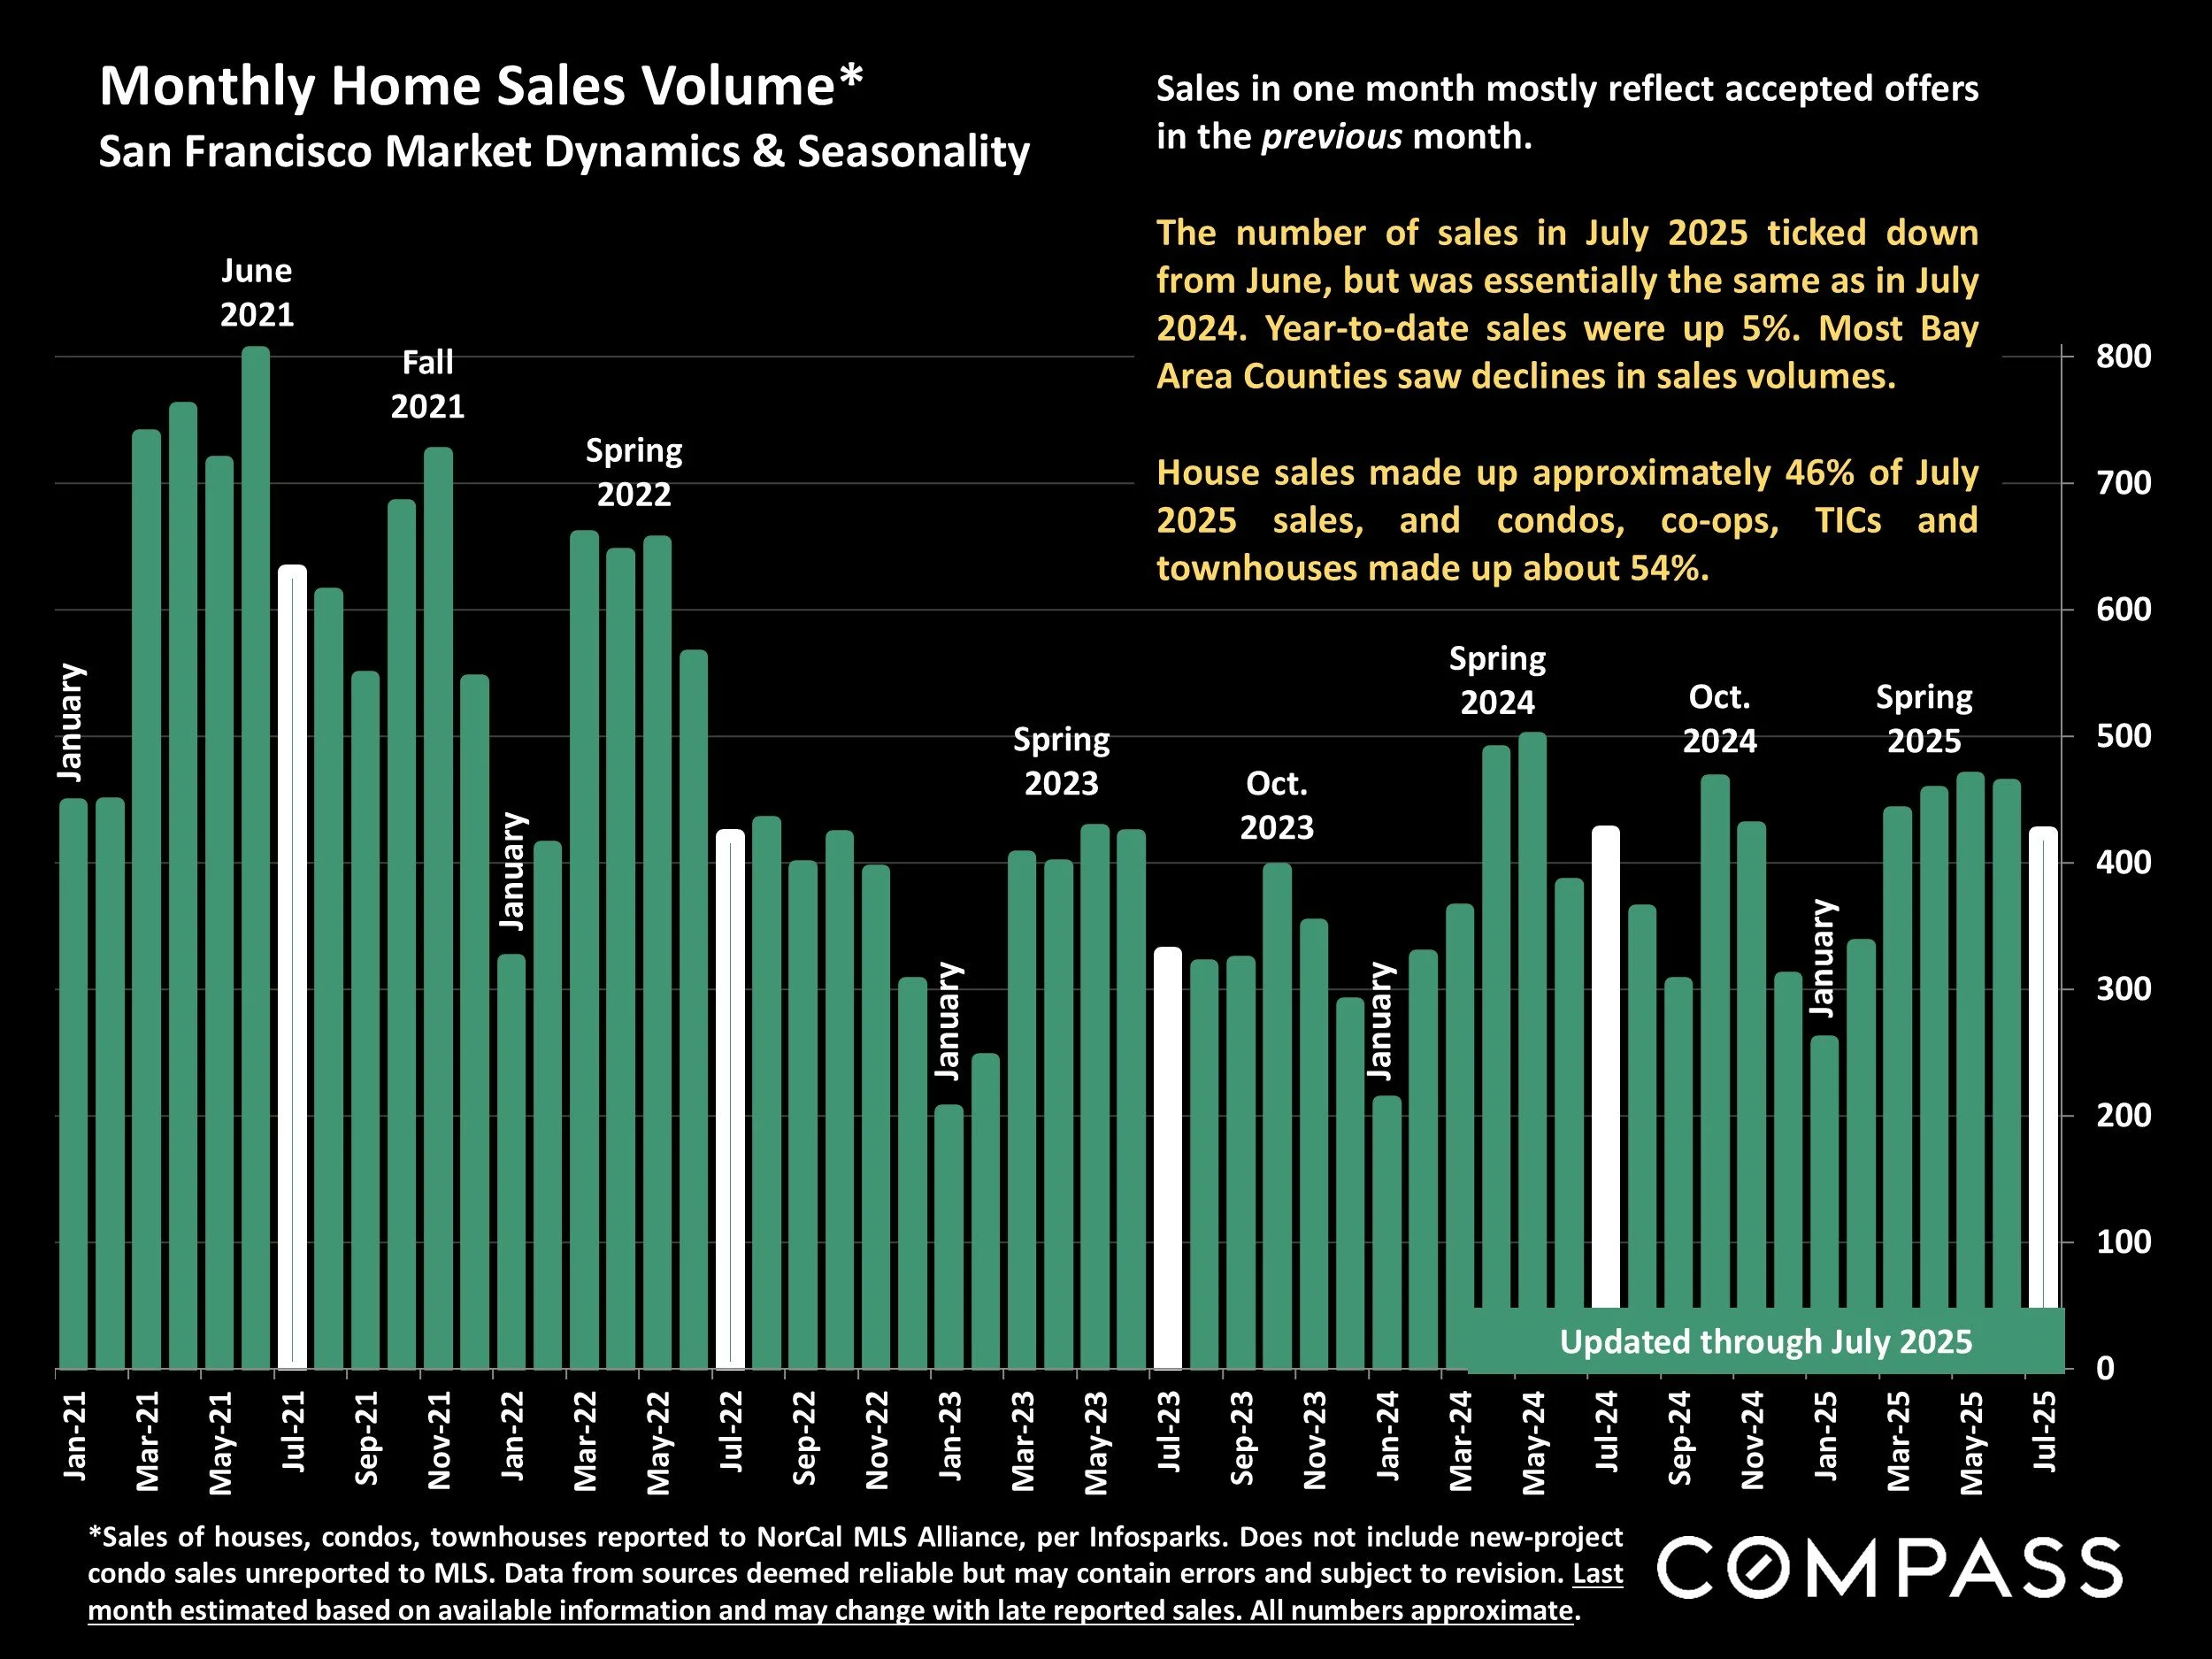
Monthly Home Sales Volume*
San Francisco Market Dynamics & Seasonality
*Sales of houses, condos, townhouses reported to NorCal MLS Alliance, per Infosparks. Does not include new-project condo sales unreported to MLS. Data from sources deemed reliable but may contain errors and subject to revision. Last month estimated based on available information and may change with late reported sales. All numbers approximate.
The number of sales in July 2025 ticked down from June, but was essentially the same as in July 2024. Year-to-date sales were up 5%. Most Bay Area Counties saw declines in sales volumes.
House sales made up approximately 46% of July 2025 sales, and condos, co-ops, TICs and townhouses made up about 54%.
Sales in one month mostly reflect accepted offers in the previous month.
San Francisco Luxury Home Sales
Houses $5,000,000+ / Condos & Co-ops $3,000,000+

Sales reported to NorCal MLS Alliance, per Infosparks. “Condo/Co-op” sales include TICs and townhouses. Not all luxury home sales are reported. Data from sources deemed reliable, but subject to error and revision. All numbers approximate and may change with late-reported sales.
Luxury home sales in July were well down from spring counts, but substantially higher year over year. Year-to-date 2025 sales were up 19% from the same period of 2024.
Sales in one month mostly reflect accepted offers in the previous month. The market for luxury homes fluctuates by season, with spring and fall typically the most active markets of the year.
San Francisco Luxury HOUSE Market
House Sales of $5,000,000+, by District, 12 Months Sales*

*12 months house sales reported to NorCal MLS Alliance by late July 2025. Not all luxury home sales are reported. Neighborhood groupings correspond to SF Realtor districts, which often include adjacent neighborhoods not listed. Data from sources deemed reliable but may contain errors and subject to revision. All numbers approximate. New sales are reported constantly.
There were 7 sales reported to MLS in the 12-month period of $15 million+: 3 in Pacific Heights, 1 in Presidio Heights, 1 in Cow Hollow, 1 in Russian Hill & 1 in Sea Cliff.*
San Francisco Luxury CONDO, CO-OP & TIC Market
Sales Prices of $3 Million+, by District, 12 Months Sales*

*12 months sales reported to NorCal MLS Alliance by late July 2025. Not all luxury home sales are reported. Neighborhood groupings correspond to SF Realtor districts, which often include adjacent neighborhoods not listed. Data from sources deemed reliable but may contain errors and subject to revision. All numbers approximate.
Some new-project luxury condo sales are not reported to MLS. These projects are mostly concentrated in the South Beach, SoMa, Yerba Buena & Treasure Island neighborhoods (D9).
90 of these sales were condos, 14 were co-ops, and 6 were TICs.*
There were 3 sales of $10 million+ reported to MLS during the period: 2 in Pacific Heights (both co-ops)
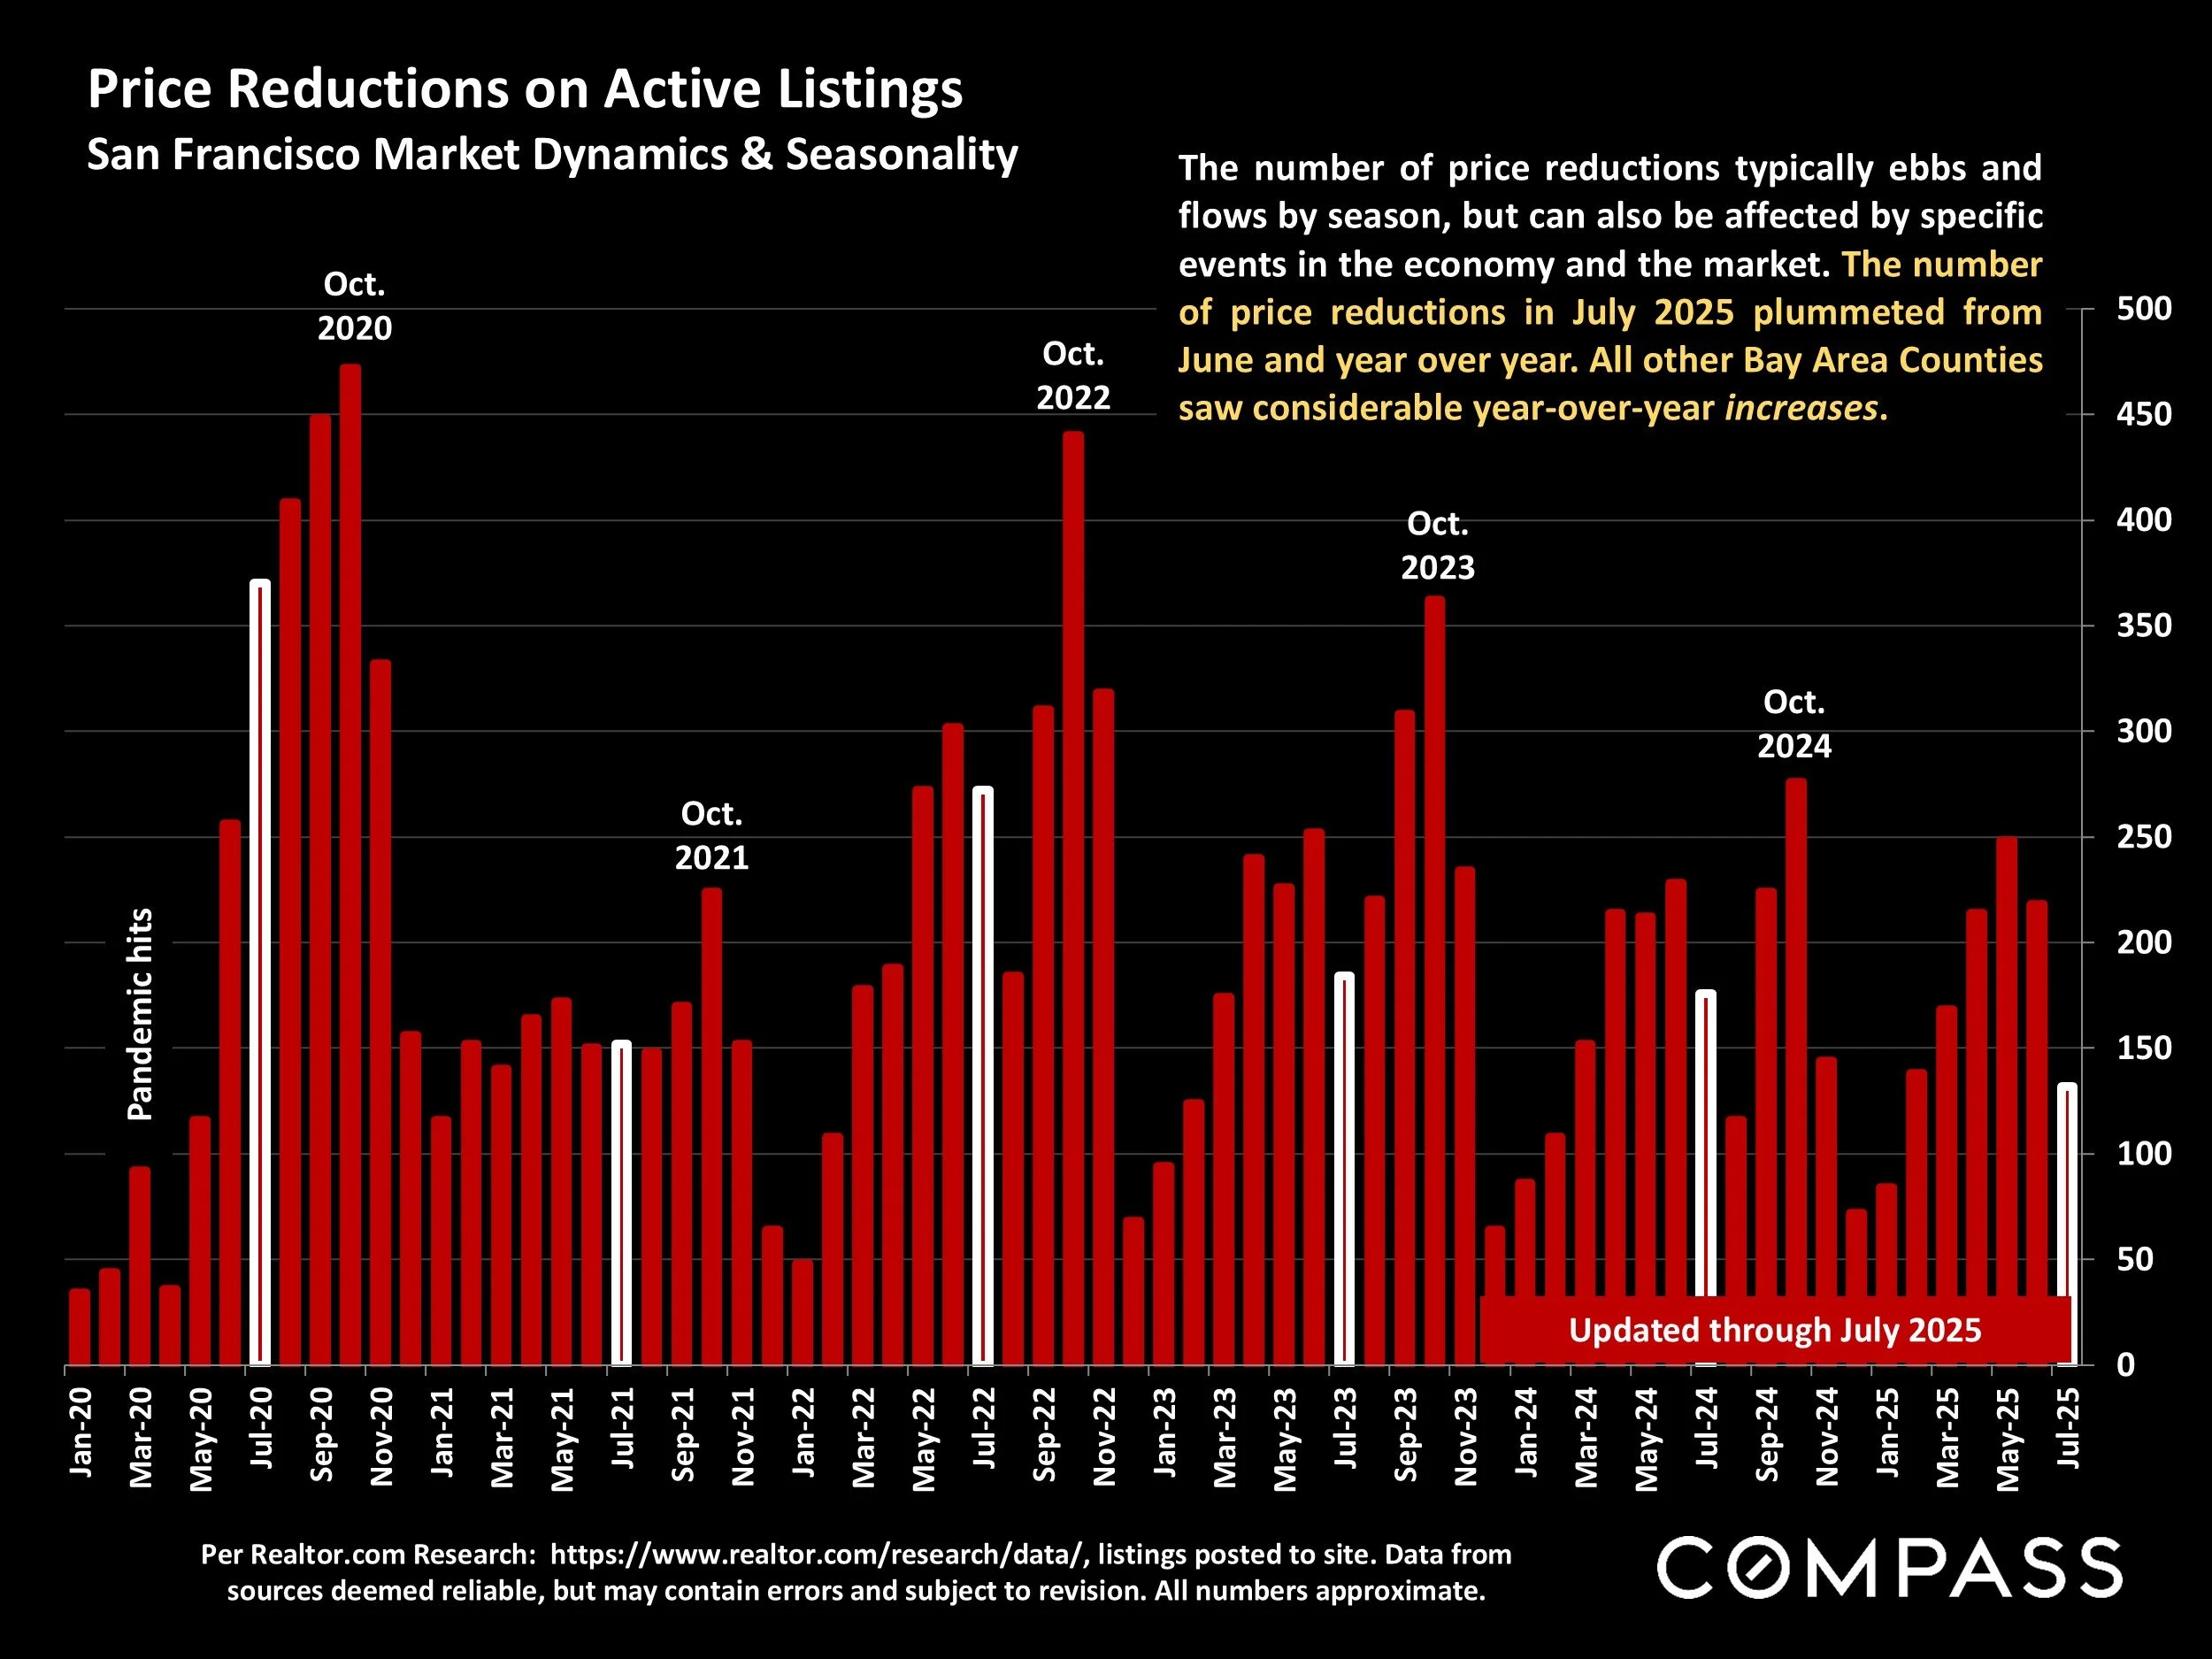
Price Reductions on Active Listings
San Francisco Market Dynamics & Seasonality
Per Realtor.com Research: https://www.realtor.com/research/data/, listings posted to site. Data from sources deemed reliable, but may contain errors and subject to revision. All numbers approximate.
The number of price reductions in July 2025 plummeted from June and year over year. All other Bay Area Counties saw considerable year-over-year increases.
The number of price reductions typically ebbs and flows by season, but can also be affected by specific events in the economy and the market.
Percentage of Listings Reducing Price within Month*
San Francisco Market Dynamics & Seasonality

Per Realtor.com Research, https://www.realtor.com/research/data/ - residential listings posted to site. Data from sources deemed reliable but may contain errors and subject to revision. All numbers approximate.
This chart illustrates the percentage of homes listed for sale which reduced their asking prices within the month specified.*
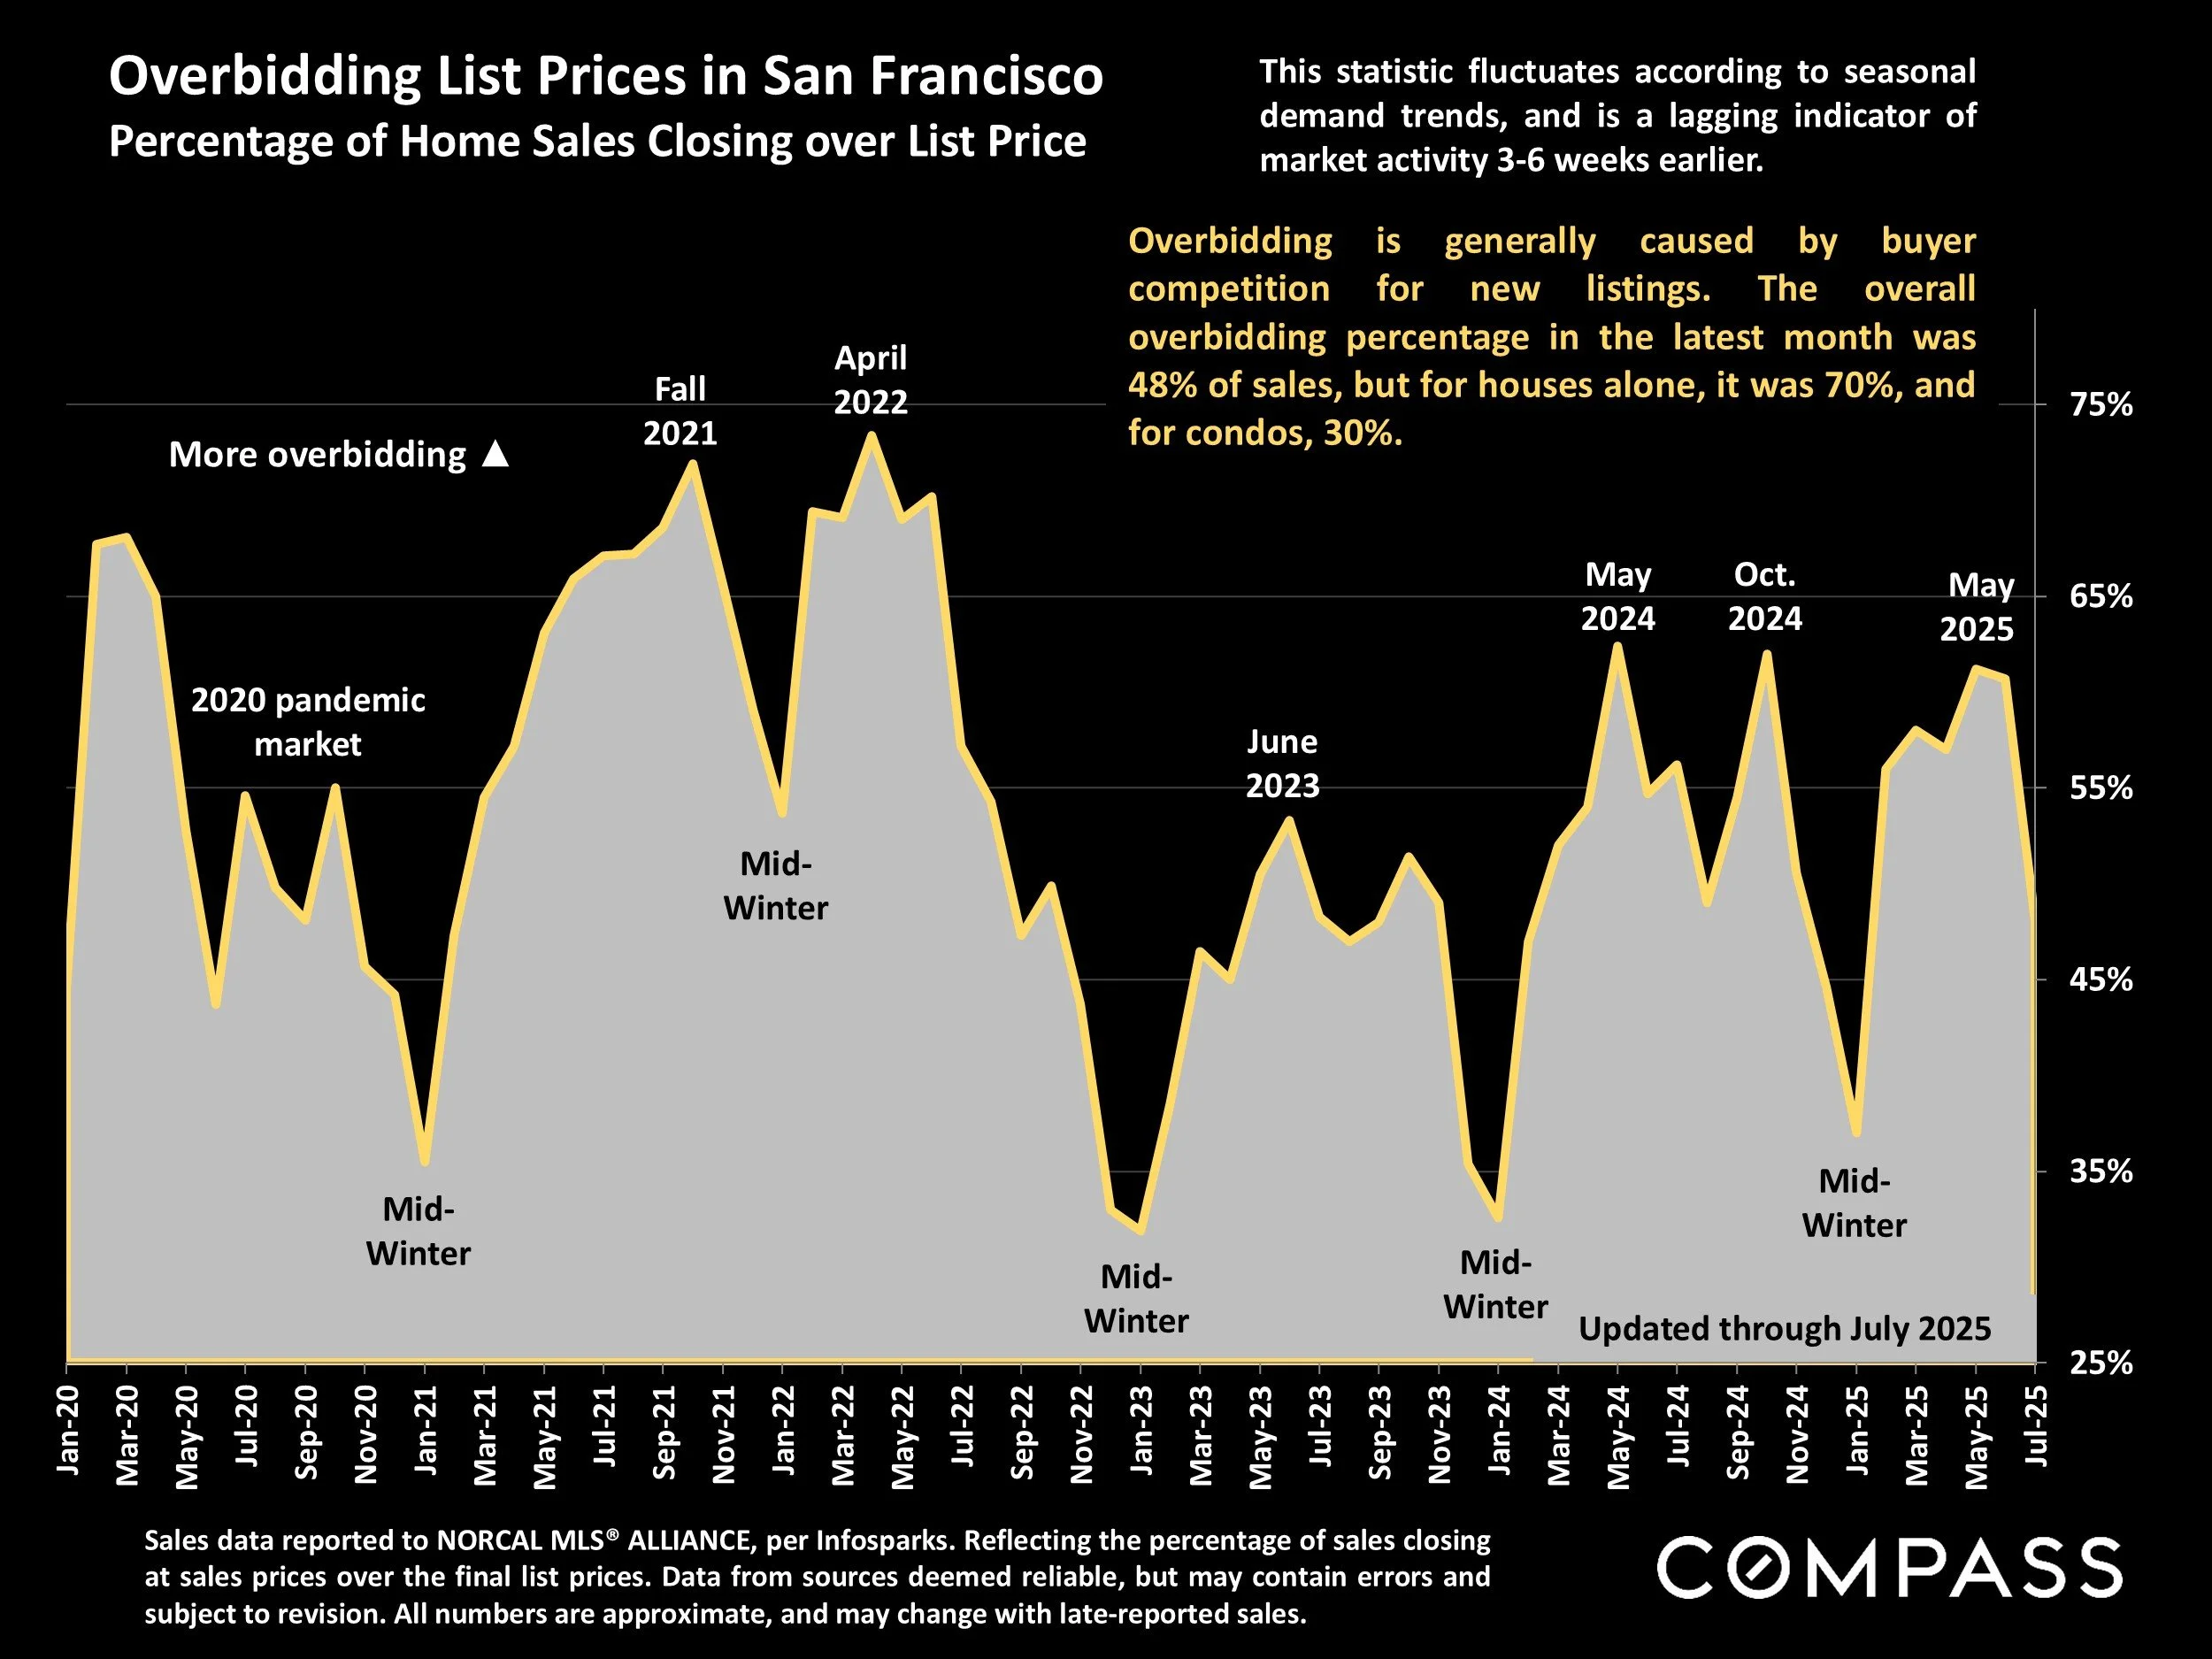
Overbidding List Prices in San Francisco
Percentage of Home Sales Closing over List Price
Sales data reported to NORCAL MLS® ALLIANCE, per Infosparks. Reflecting the percentage of sales closing at sales prices over the final list prices. Data from sources deemed reliable, but may contain errors and subject to revision. All numbers are approximate, and may change with late-reported sales.
Overbidding is generally caused by buyer competition for new listings. The overall overbidding percentage in the latest month was 48% of sales, but for houses alone, it was 70%, and for condos, 30%.
This statistic fluctuates according to seasonal demand trends, and is a lagging indicator of market activity 3-6 weeks earlier.
Average Sales Price to Original List Price Percentage
San Francisco Over/Under Bidding: Market Dynamics & Seasonality

Sales reported to NorCal MLS Alliance, per Infosparks. Data derived from sources deemed reliable, but may contain errors and subject to revision. All numbers approximate, and may change with late-reported sales.
This chart illustrates the average Sales Price to Original List Price Percentage for all residential sales. But overbidding has been much more common and dramatic for house sales than for condo sales: For houses alone, the average was 11% above list price, and for condos, almost 3% below list price.
This statistic can be distorted by strategic underpricing strategies by listing agents.
Average Days on Market – Speed of Sale
San Francisco Market Dynamics & Seasonality

Sales reported to NorCal MLS Alliance, per Infosparks. Data derived from sources deemed reliable, but may contain errors and subject to revision. All numbers approximate, and may change with late-reported sales.
This chart illustrates average days on market for all residential sales (45 days in July 2025). But for houses alone, the average was 27 days, and for condos, 62 days.
Measuring how long it takes for sold listings to accept offers. Homes usually sell fastest in spring and early autumn – with the rush of new listings – and slowest in mid-winter (when the inventory of listings is at its oldest). Houses, on average, sell much faster than condos, co-ops and TICs.
1st Half, Dollar-Volume Home Sales since 2015
11 Greater Bay Area Counties, Sales Reported to MLS*
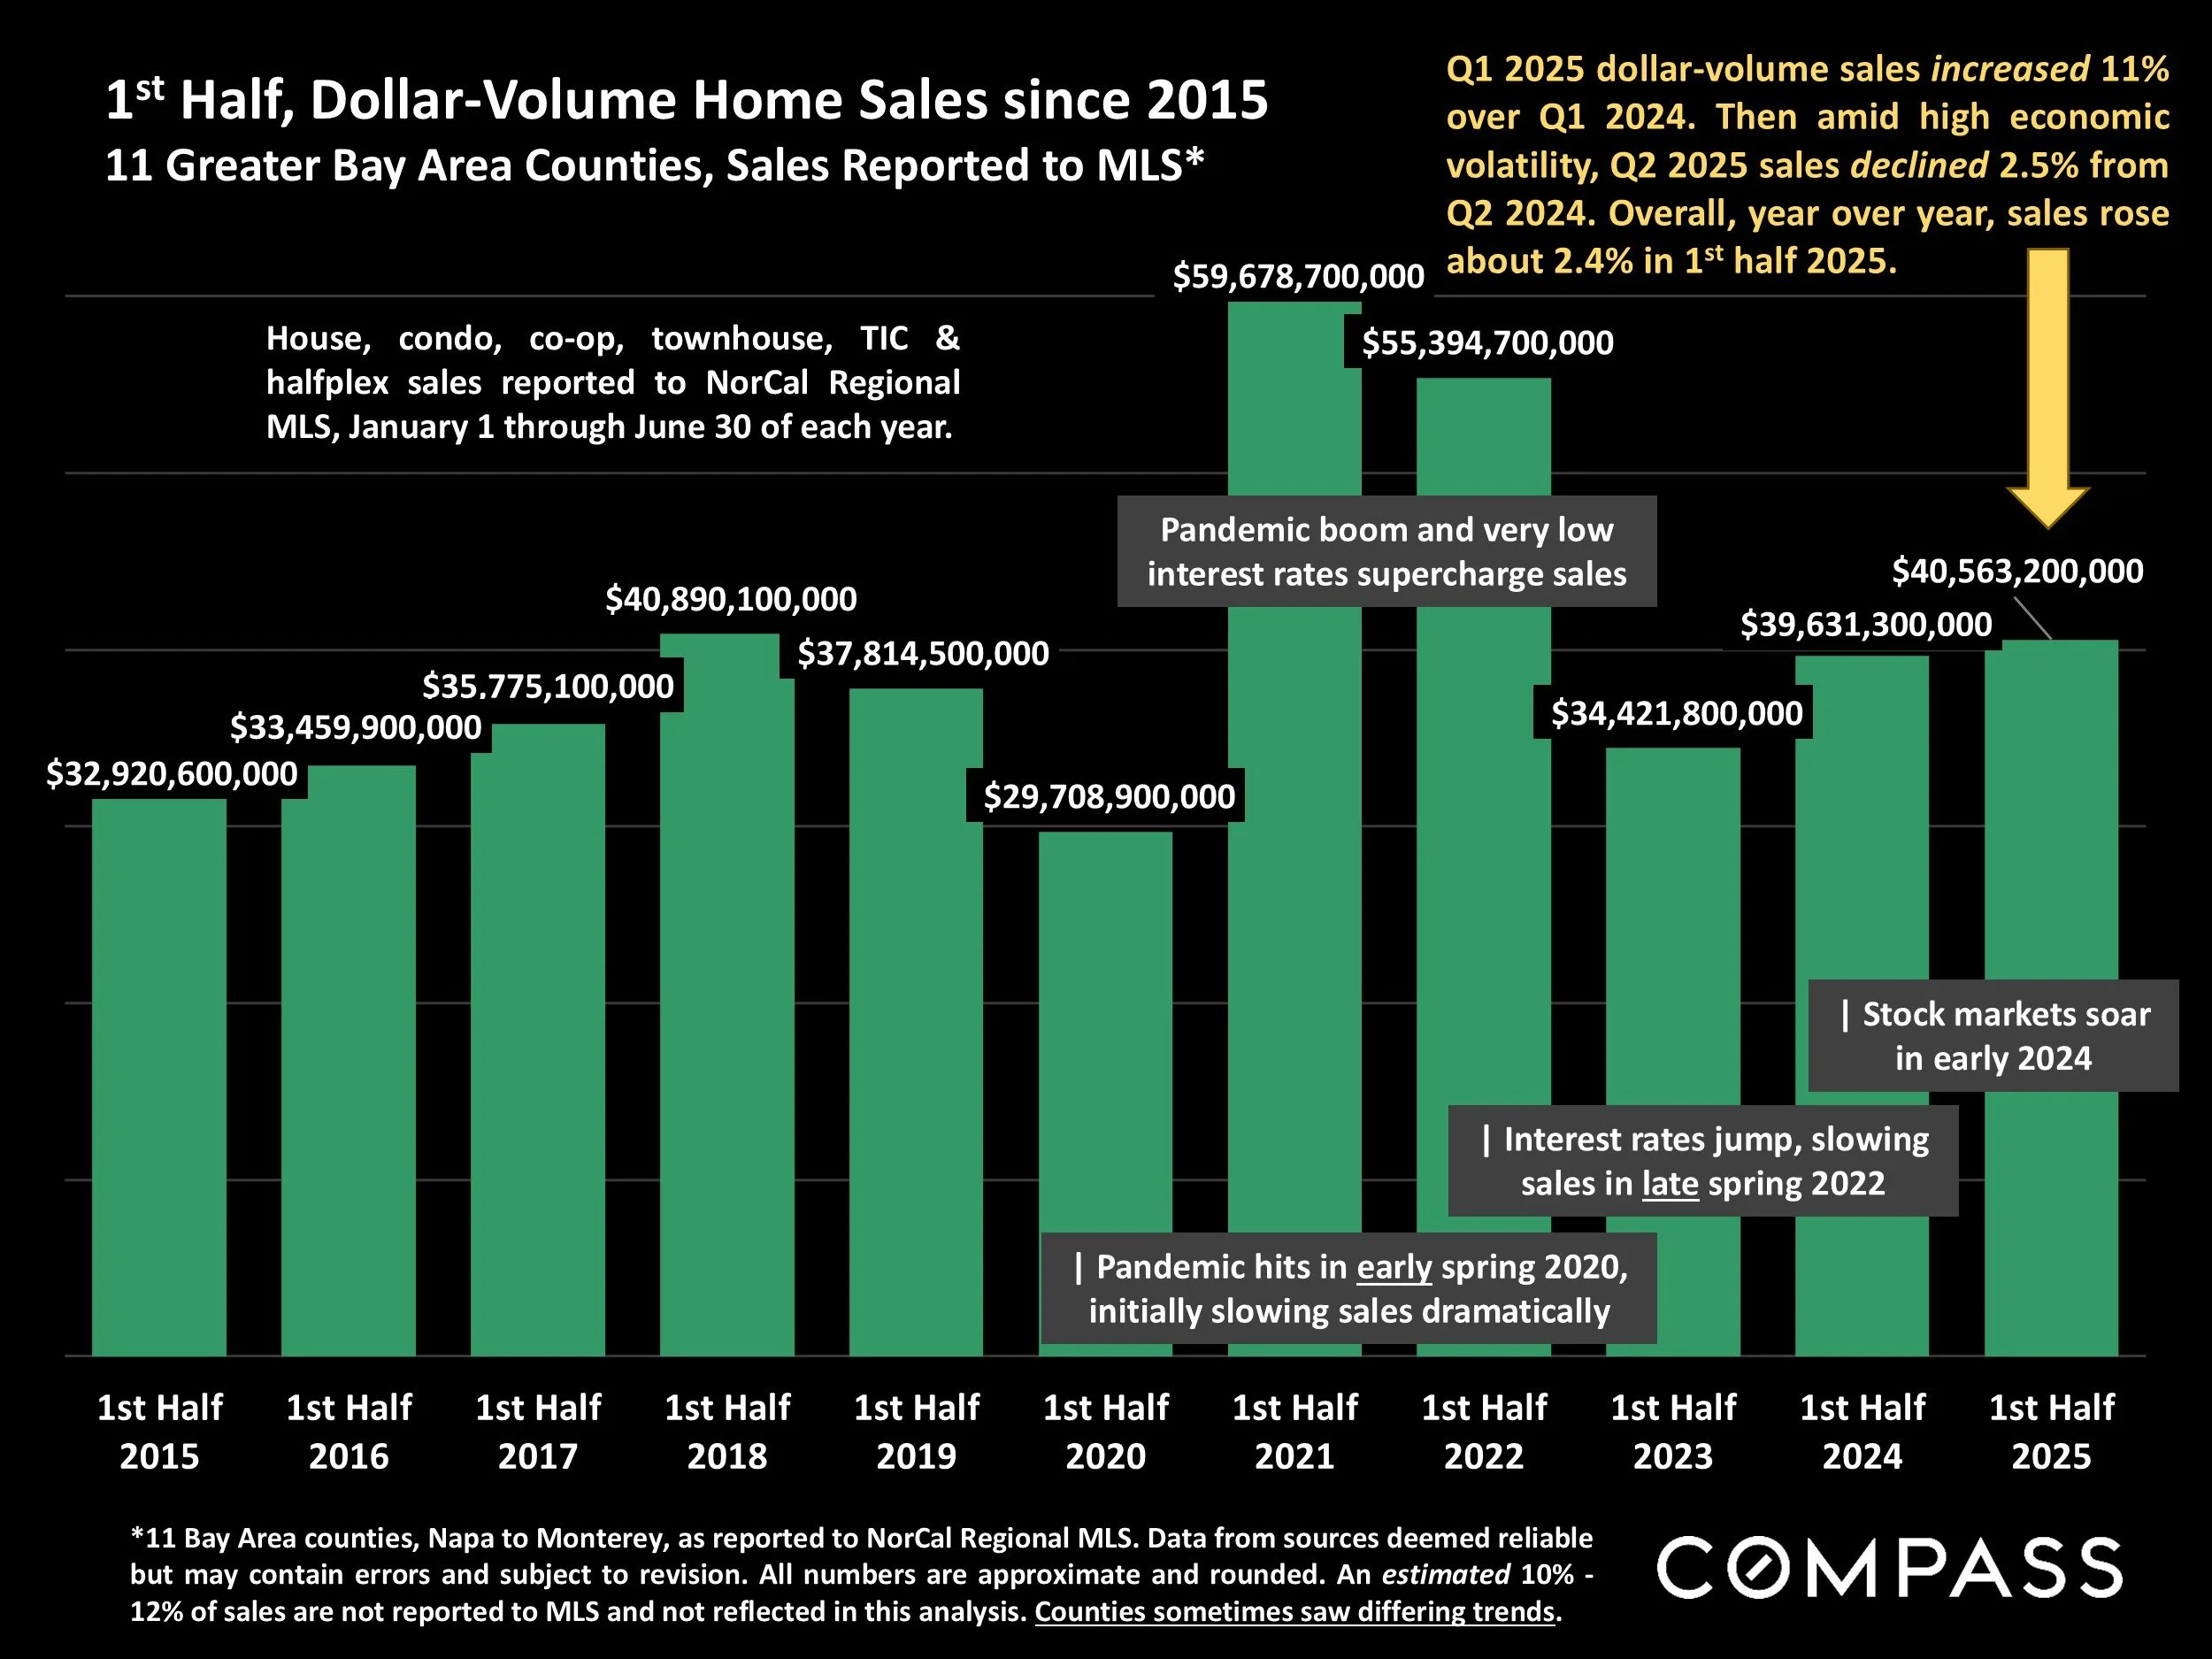
*11 Bay Area counties, Napa to Monterey, as reported to NorCal Regional MLS. Data from sources deemed reliable but may contain errors and subject to revision. All numbers are approximate and rounded. An estimated 10% -12% of sales are not reported to MLS and not reflected in this analysis. Counties sometimes saw differing trends.
Q1 2025 dollar-volume sales increased 11% over Q1 2024. Then amid high economic volatility, Q2 2025 sales declined 2.5% from Q2 2024. Overall, year over year, sales rose about 2.4% in 1st half 2025.
House, condo, co-op, townhouse, TIC & halfplex sales reported to NorCal Regional MLS, January 1 through June 30 of each year.
San Francisco Population by Age Segment
U.S. Census Estimates, 2020 – 2024, as of July 1st of Each Year
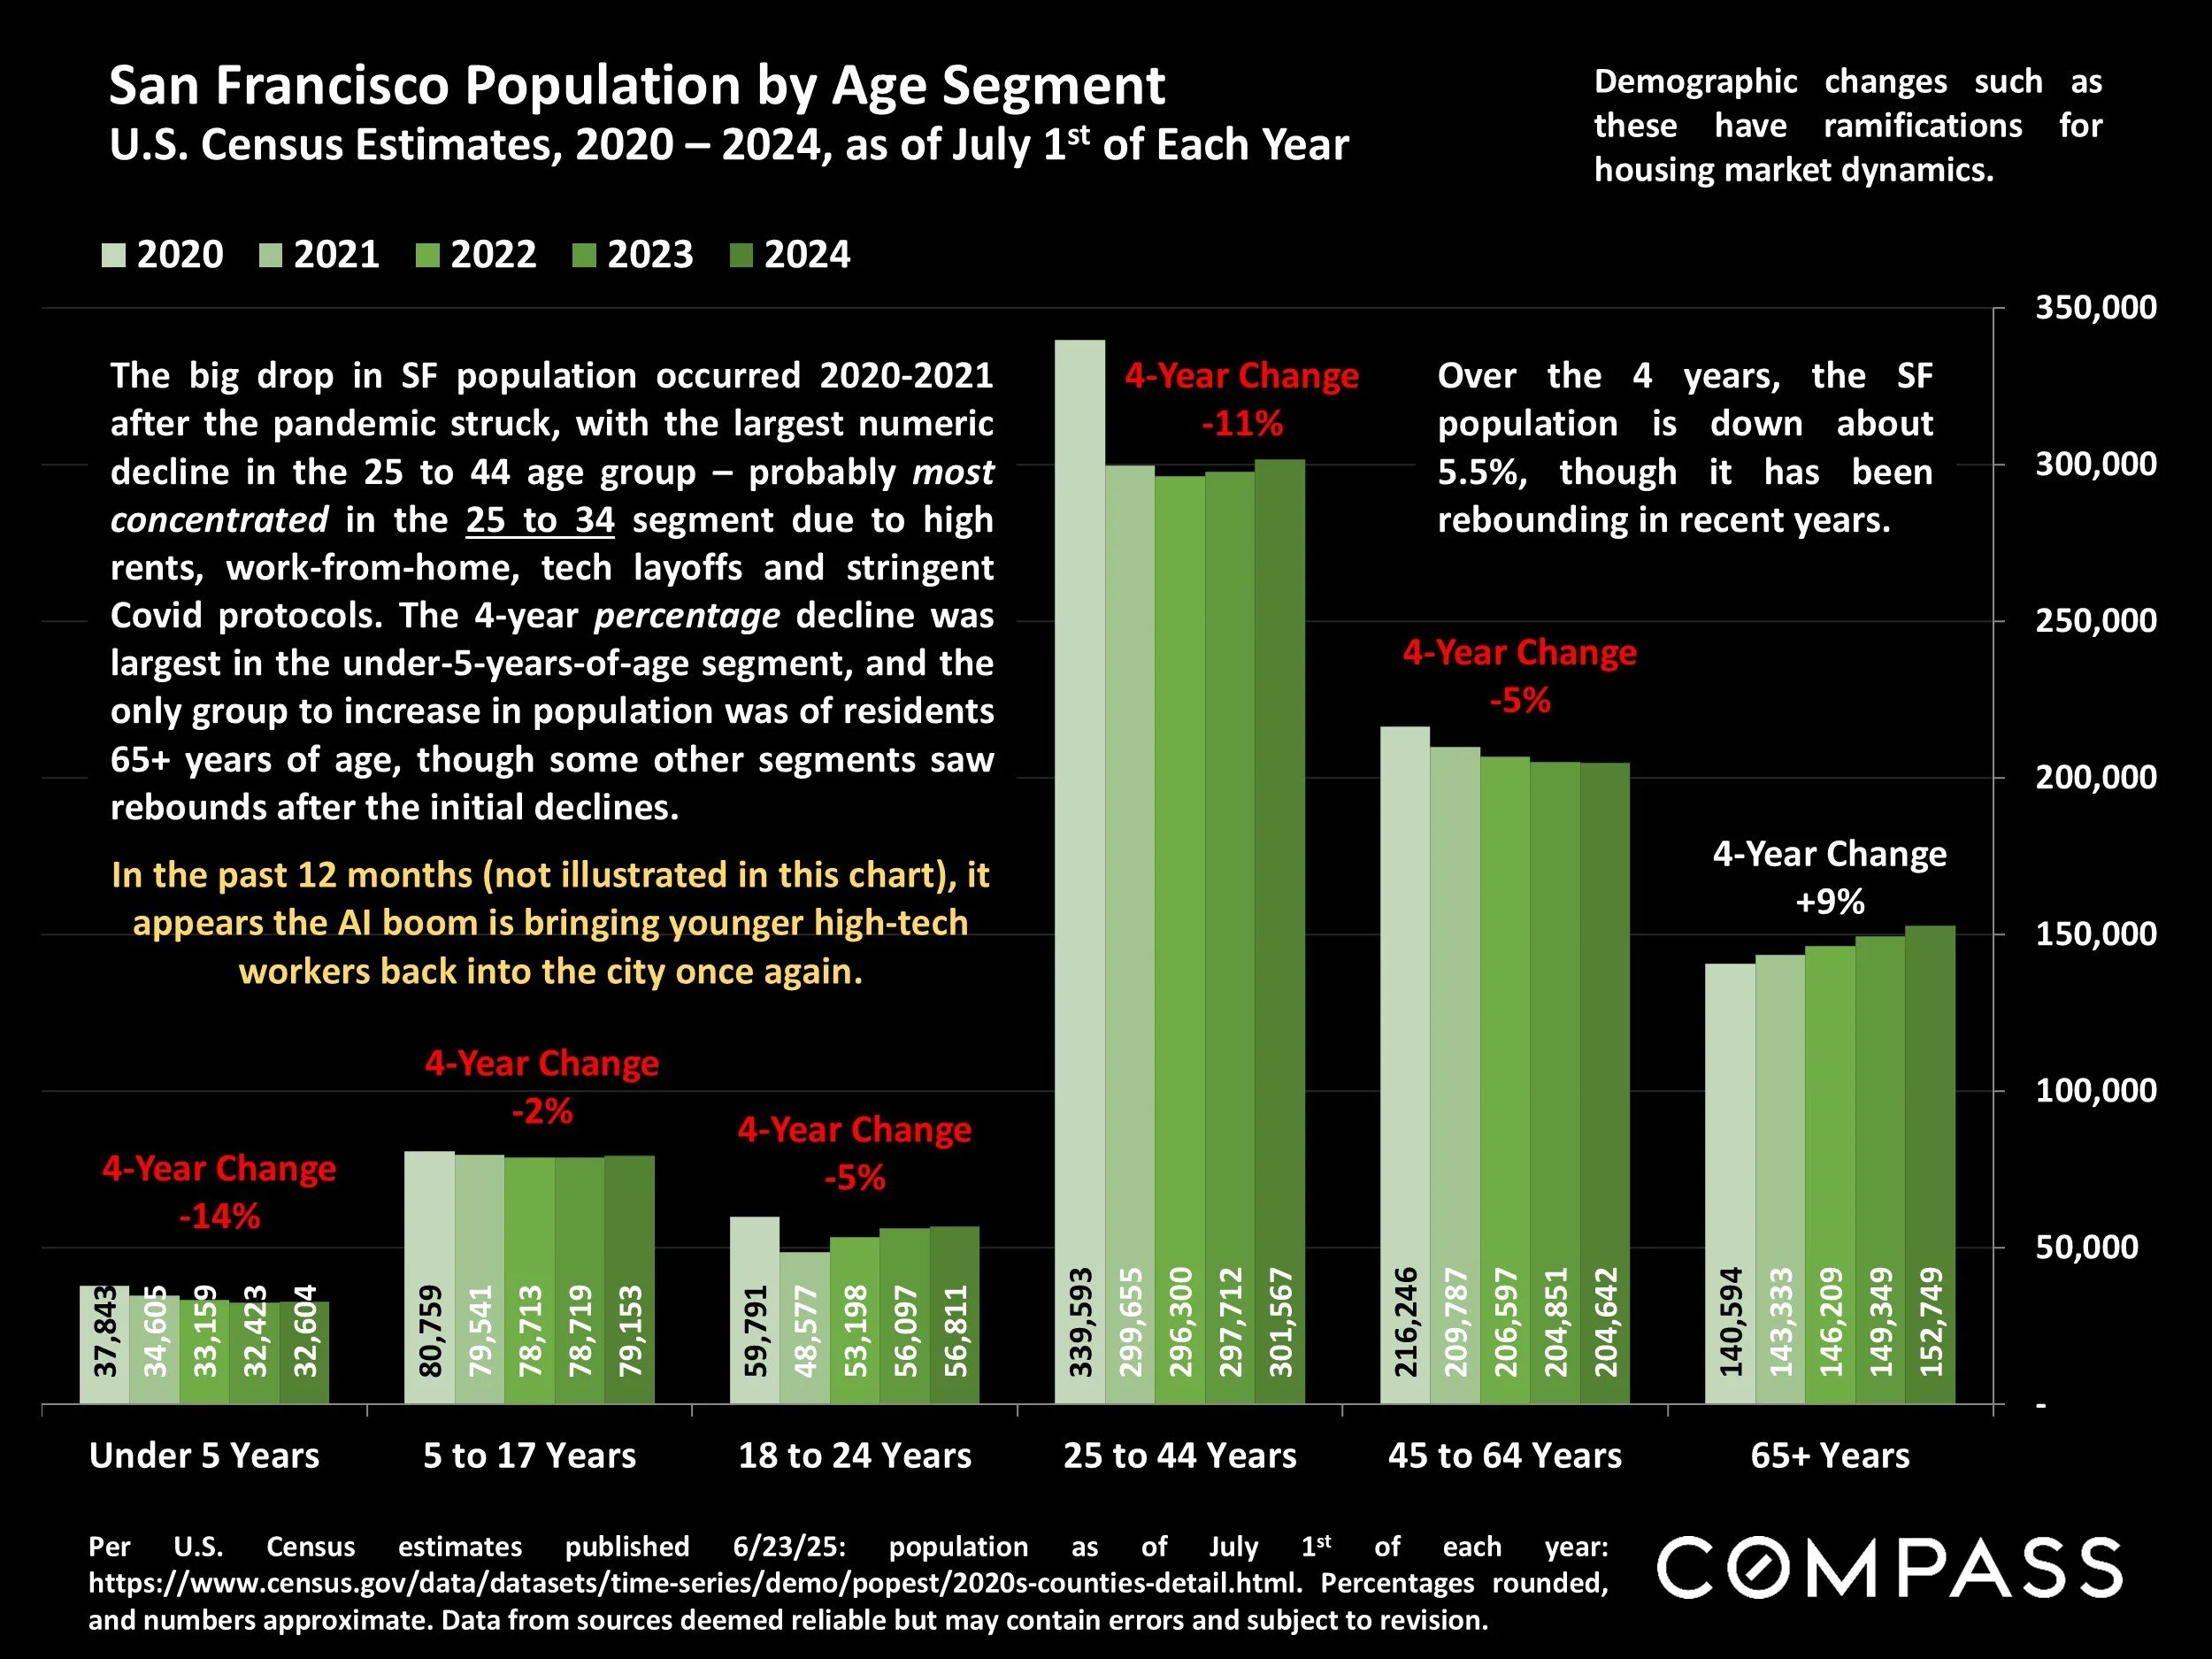
Per U.S. Census estimates published 6/23/25: population as of July 1st of each year: https://www.census.gov/data/datasets/time-series/demo/popest/2020s-counties-detail.html. Percentages rounded, and numbers approximate. Data from sources deemed reliable but may contain errors and subject to revision.
The big drop in SF population occurred 2020-2021 after the pandemic struck, with the largest numeric decline in the 25 to 44 age group – probably most concentrated in the 25 to 34 segment due to high rents, work-from-home, tech layoffs and stringent Covid protocols. The 4-year percentage decline was largest in the under-5-years-of-age segment, and the only group to increase in population was of residents 65+ years of age, though some other segments saw rebounds after the initial declines.
In the past 12 months (not illustrated in this chart), it appears the AI boom is bringing younger high-tech workers back into the city once again.
Over the 4 years, the SF population is down about 5.5%, though it has been rebounding in recent years.
Demographic changes such as these have ramifications for housing market dynamics.
Median Year of HOUSE Construction
by Bay Area County or Region (+ Sacramento County)*
Different parts of the Greater Bay Area were built out at very different times: Prior to 1950, and the postwar building boom, many local counties were relatively empty places. Though every Bay Area County includes both older houses – typically going back to the late 1800’s – and brand new houses, these median dates provide an idea of the relative age of county housing. Outside of San Francisco, home construction often followed bridge, highway, tunnel and BART construction. And different parts of counties were often built out at very different periods, usually radiating out gradually from city and town cores. Condos were typically constructed from the late 1970’s forward, though San Francisco has thousands originally built as apartments in 1900 to 1930.
1928: San Francisco: 1914 for north, NE & central districts; 1940 for south and SW districts
1936: Greater Oakland-Berkeley region (north Alameda County)
1955: San Mateo County
1960: Marin County
1966: Santa Clara County: The county with the largest population and number of housing units
1969: South Alameda County
1971: Santa Cruz & Monterey Counties
1973: Napa County: The county with the smallest population and number of housing units
1976: Contra Costa (In Lamorinda – Lafayette, Moraga, Orinda – the median year is 1961)
1979: Sonoma County
1982: Sacramento County
1986: Solano County
Median year of construction is that year at which half the houses were built earlier and half later.
*Based on analyses of houses sold in recent years, as reported to NorCal MLS Alliance. Data is from sources deemed reliable, but should be considered approximate.
San Francisco Neighborhood Home Price Map
Click on icons to pull up neighborhood median home sales prices. Click on the X to close the window for the specific neighborhood.
Statistics are generalities, essentially summaries of widely disparate data generated by dozens, hundreds or thousands of unique, individual sales occurring within different time periods. They are best seen not as precise measurements, but as broad, comparative indicators, with reasonable margins of error. Anomalous fluctuations in statistics are not uncommon, especially in smaller, expensive market segments. Last period data should be considered estimates that may change with late-reported data. Different analytics programs sometimes define statistics – such as “active listings,” “days on market,” and “months supply of inventory” – differently: what is most meaningful are not specific calculations but the trends they illustrate. Most listing and sales data derives from the local or regional multi-listing service (MLS) of the area specified in the analysis, but not all listings or sales are reported to MLS and these won’t be reflected in the data. “Homes” signifies real-property, single-household housing units: houses, condos, co-ops, townhouses, duets and TICs (but not mobile homes), as applicable to each market. City/town names refer specifically to the named cities and towns, unless otherwise delineated. Multi-county metro areas will be specified as such. Data from sources deemed reliable, but may contain errors and subject to revision. All numbers to be considered approximate.
Many aspects of value cannot be adequately reflected in median and average statistics: curb appeal, age, condition, amenities, views, lot size, quality of outdoor space, “bonus” rooms, additional parking, quality of location within the neighborhood, and so on. How any of these statistics apply to any particular home is unknown without a specific comparative market analysis.
Median Sales Price is that price at which half the properties sold for more and half for less. It may be affected by seasonality, “unusual” events, or changes in inventory and buying trends, as well as by changes in fair market value. The median sales price for an area will often conceal an enormous variety of sales prices in the underlying individual sales.
Dollar per Square Foot is based upon the home’s interior living space and does not include garages, unfinished attics and basements, rooms built without permit, patios, decks or yards (though all those can add value to a home). These figures are usually derived from appraisals or tax records, but are sometimes unreliable (especially for older homes) or unreported altogether. The calculation can only be made on those home sales that reported square footage.
Compass is a real estate broker licensed by the State of California, DRE 01527235. Equal Housing Opportunity. This report has been prepared solely for information purposes. The information herein is based on or derived from information generally available to the public and/or from sources believed to be reliable. No representation or warranty can be given with respect to the accuracy or completeness of the information. Compass disclaims any and all liability relating to this report, including without limitation any express or implied representations or warranties for statements contained in, and omissions from, the report. Nothing contained herein is intended to be or should be read as any regulatory, legal, tax, accounting or other advice and Compass does not provide such advice. All opinions are subject to change without notice. Compass makes no representation regarding the accuracy of any statements regarding any references to the laws, statutes or regulations of any state are those of the author(s). Past performance is no guarantee of future results.