December 2023 Market Report

Photo by Casey Horner on Unsplash
“For the third sixth straight week, mortgage rates trended down, as new data indicates that inflationary pressures are receding. The combination of continued economic strength, lower inflation and lower mortgage rates should likely bring more potential homebuyers into the market.” Freddie Mac (FHLMC)
Stock and bond markets – which greatly impact household wealth, consumer confidence, and interest rates – were generally characterized by deep pessimism in October, but with significant changes in economic indicators such as inflation, and a continued pause in benchmark rate increases by the Fed, financial markets abruptly shifted to enthusiastic optimism in November. That translated into a dramatic plunge in mortgage rates — down nearly a whole point since their peak in October — which has caused mortgage applications to increase over recent weeks.
Since the homebuying process usually takes 30 to 60 days, from loan qualification and making an offer to a closed sale, sales might see a bounce in December, or – since the mid-winter holiday period typically sees the annual low point in new-listing (and thus sales) activity – more likely in early 2024 (subject to these positive trends continuing).
In January 2023, buyer demand saw a substantial rebound due to a similar drop in interest rates in late 2022. In our opinion, this is a remarkable inflection point for buyers. Mortgage rates are coming down, and expected to continue to do so. Buyer demand is still somewhat deflated from the spike in rates, and property values are off as a reflection of that (see charts below). Now could be a great time to get in the market, nab a home at a relatively good price, then refinance down the road, saving even more money later.
Mortgage Interest Rates, 9/1/23 – 12/6/23
30-Year Fixed-Rate Loans, Daily Average Readings*
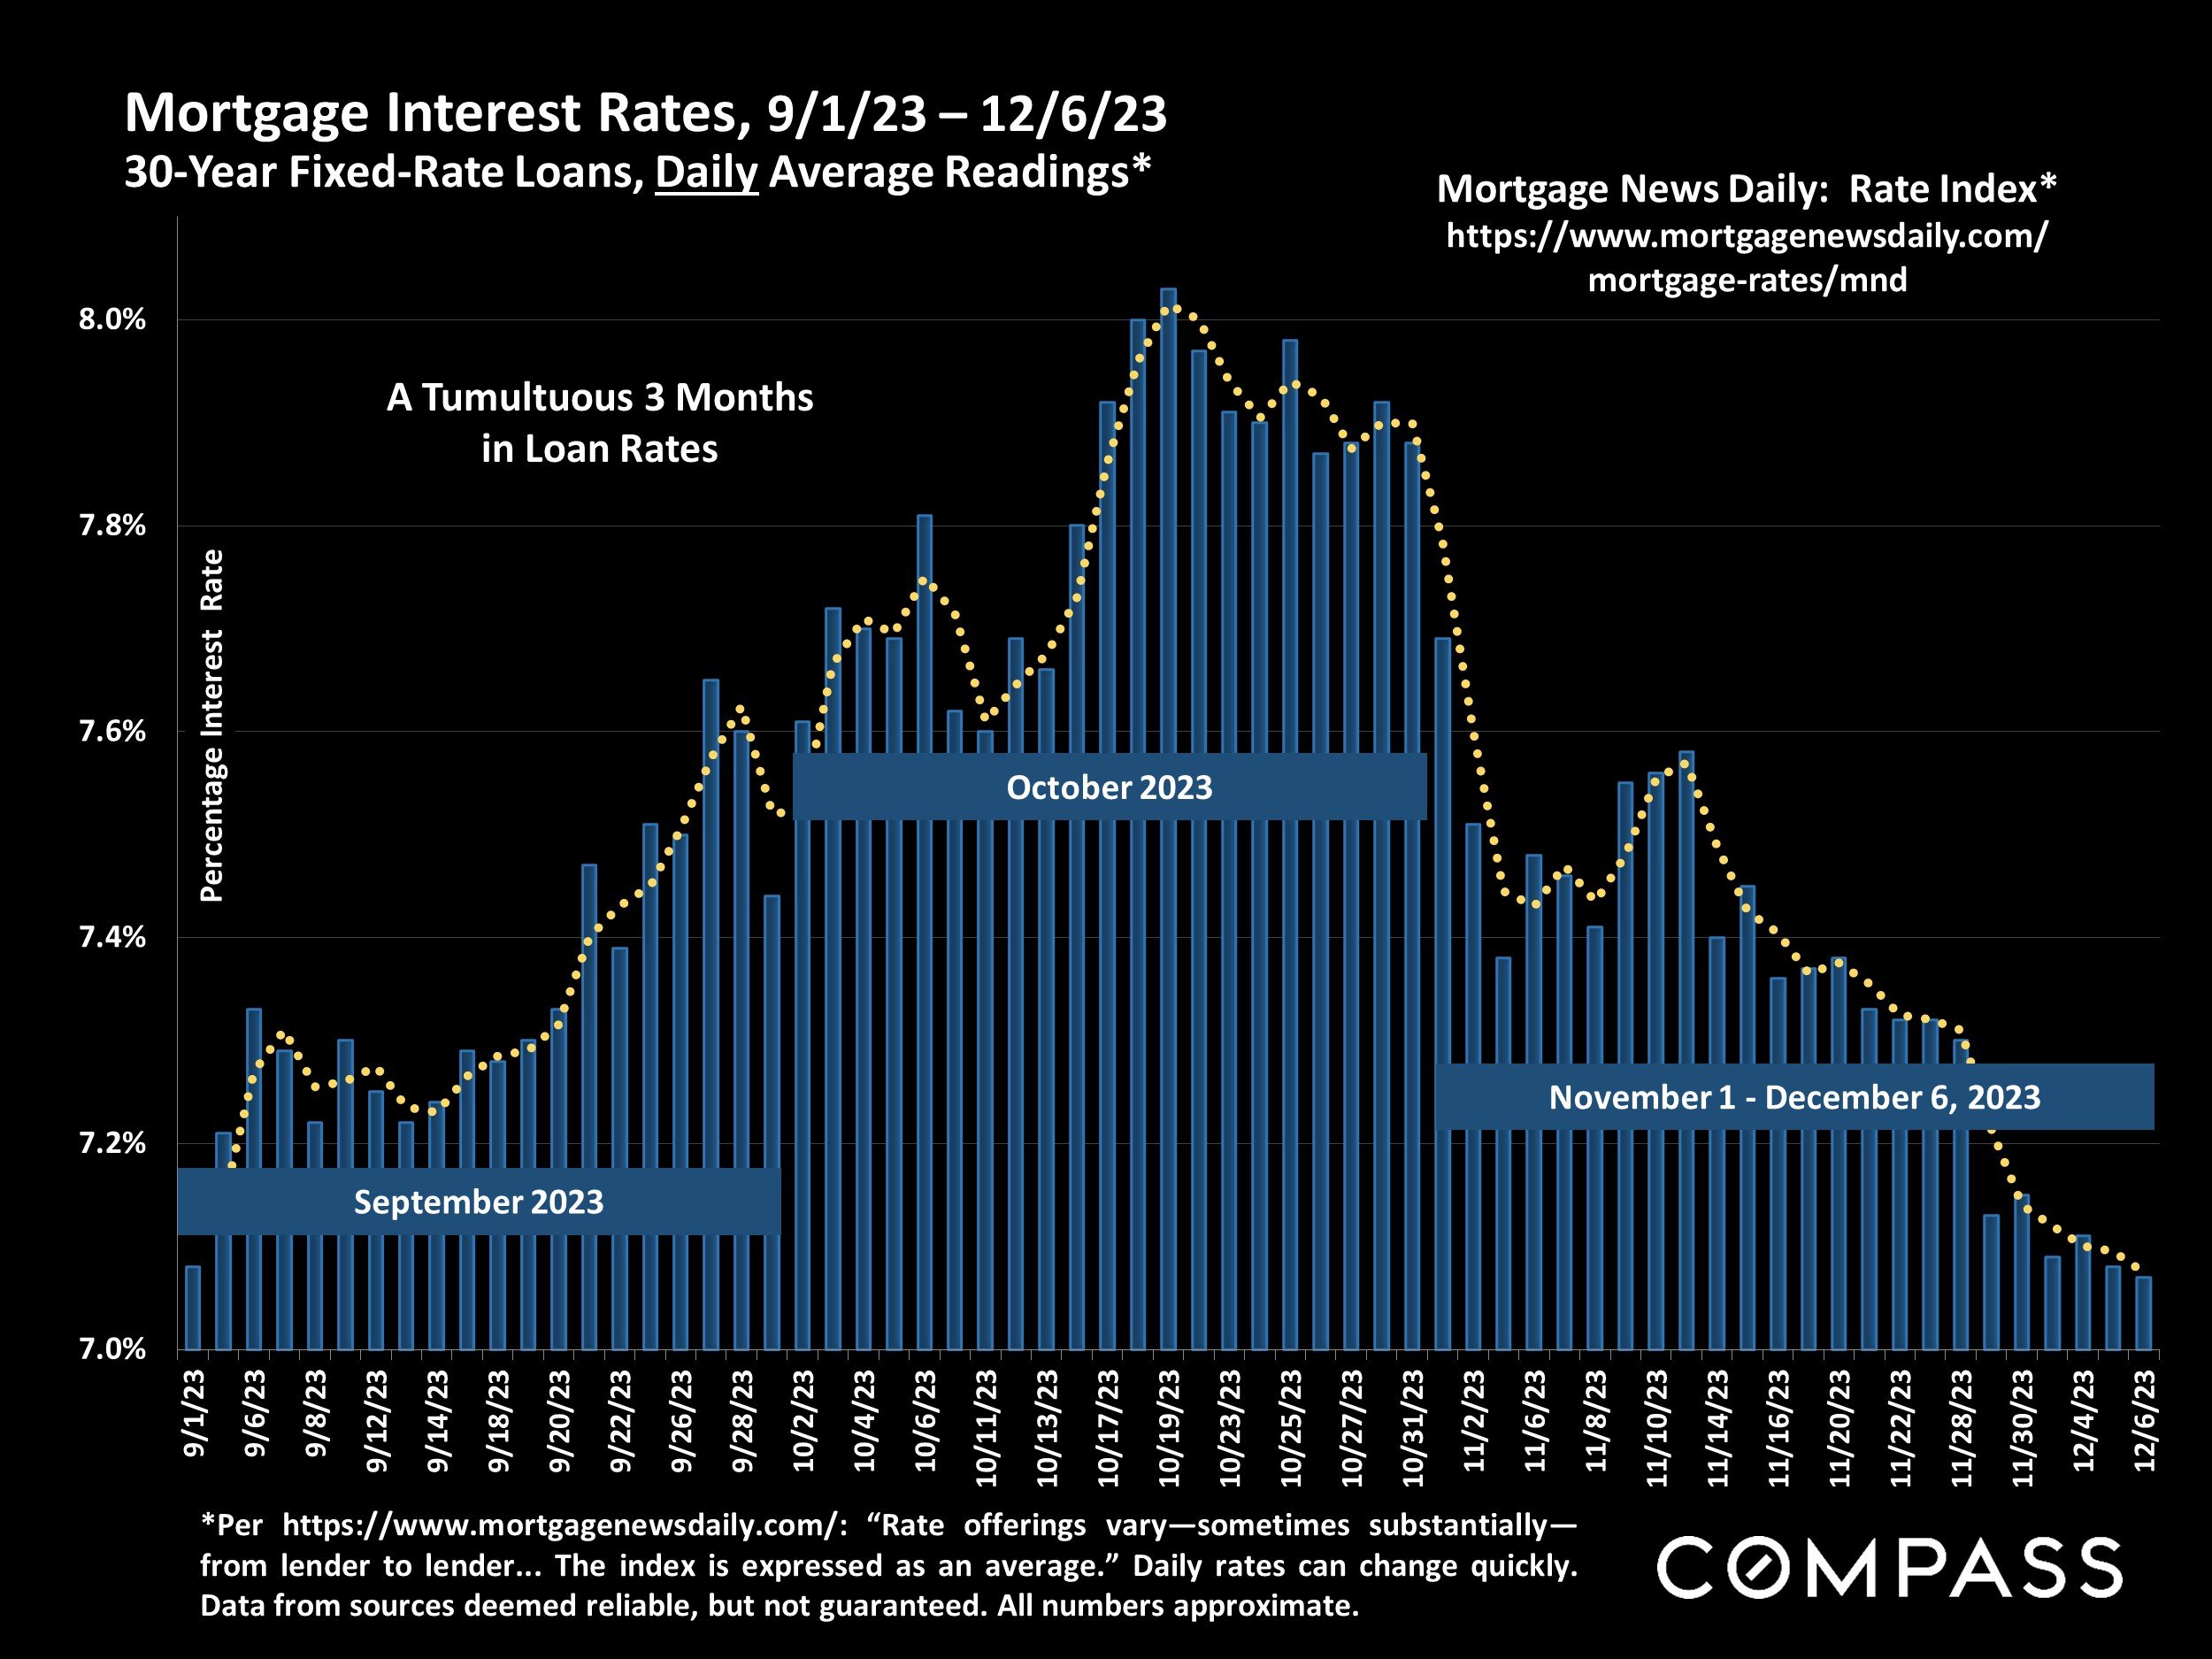
*Per https://www.mortgagenewsdaily.com/: “Rate offerings vary—sometimes substantially—from lender to lender... The index is expressed as an average.” Daily rates can change quickly. Data from sources deemed reliable, but not guaranteed. All numbers approximate.
It’s been a tumultuous three months for mortgage rates, climbing from just over 7% at the beginning of September to flirting with 8% in late October, then pretty rapidly coming back down to nearly 7%.
San Francisco HOUSE Price Trends since 1990
Monthly Median House Sales Prices, 3-Month Rolling

3-month rolling average of monthly median sales prices for “existing” houses, per CA Association of Realtors or 3-month rolling median per NorCal MLS Alliance. 2-period moving trend line. Analysis may contain errors and subject to revision. All numbers approximate, and may change with late-reported sales.
Median sales price is that price at which half the sales occurred for more and half for less. It is a very general statistic, disguising an enormous range of sales prices in the underlying sales. It is often affected by other factors besides changes in fair market value. Monthly and seasonal fluctuations are common, which explain many of the regular ups and downs in this chart.
On a year-over-year basis, the 3-month-rolling SF median house sales price in October 2023 was down about 1.5%.
San Francisco CONDO Price Trends since 2005
Median Condo Sales Price, 3-Month Rolling

3-month rolling median condo sales prices reported to NorCal MLS Alliance, per Infosparks. Analysis may contain errors and subject to revision. All numbers approximate, and may change with late-reported sales.
On a year-over-year basis, the 3-month-rolling SF median condo sales price in October 2023 was down almost 8%.
San Francisco CONDO Price Trends: Downtown vs. Non-Downtown
6-Month-Rolling Median Condo Sales Prices since 2005*

*6-month rolling median condo sales values reported to NorCal MLS Alliance, per Infosparks. Analysis may contain errors and subject to revision. Does not include new-project sales unreported to MLS. All numbers approximate, and may change with late-reported sales.
Comparing the median condo sales price in the greater Downtown/South of Market/Civic Center area (the center of large-project, new-condo construction, office buildings, and high-tech employment) – delineated by the blue line – with the median condo sales price in the rest of San Francisco (mostly smaller, older buildings, in less urban environments) – delineated by the white line.
The greater downtown/SoMa/Civic-Center condo market has been much more negatively affected by a number of economic, demographic and social factors impacting supply and demand than condo markets in other city districts.
San Francisco Home Sales Trends, 2021-2023
Year-over-Year, Year-to-Date Sales by Price Segment*

*All attached and detached home sales reported to NorCal MLS Alliance through November 30th of each year, per Infosparks. Not all sales are reported to MLS. Data from sources deemed reliable, but may contain errors and subject to revision. All numbers are approximate, and 2023 YTD numbers may change with late reported sales.
2021 reflects the heart of the pandemic boom which saw soaring sales. 2022 was characterized by very heated demand through late spring, followed by a severe market correction in the 2nd half due to rising interest rates. In 2023, interest rates deeply suppressed both new-listing and sales activity.
If prices rise, sales are pushed into higher price segments, and vice versa if prices decline. Prices can rise and fall in the same year, as they did in 2022.
Year over year, 2023 YTD sales were down by approximately 28% from 2022 (after the steep decline from 2021).
New Listings Coming on Market
San Francisco Market Dynamics & Seasonality

Per Realtor.com Research: https://www.realtor.com/research/data/, listings posted on site. Data from sources deemed reliable, but may contain errors and subject to revision. May not include “coming-soon” listings. All numbers should be considered approximate.
After the big September surge in new listings, the number plunged in October and November and will almost certainly continue to decline to its typical December low point.
New-Listing & Home Sales Volumes: Broad, Longer-Term Trends
San Francisco, 12-Month-Rolling Data since 2005*

* Each data point reflects total of 12 months of residential activity reported to NORCAL MLS® ALLIANCE, per Infosparks. 1/12 of these numbers = an average month within the 12 month period. Data from sources deemed reliable, but may contain errors and subject to revision. All numbers approximate.
On a 12-month-rolling basis, the number of new listings and the number of sales are at their lowest points since the great recession (sales) or much longer (new listings). Interest rate increases began significantly affecting the market in spring 2022. The smaller the gap between the 2 lines, the greater the pressure on prices.
Monthly readings in this chart reflect total listing and sales volumes over the 12-month period. See our 1-month-rolling charts for short-term trends.
Active & Coming-Soon Listings on 1st of Month*
San Francisco Homes Market

* Houses, condos, co-ops, TICs, townhouses: Active/Coming-Soon listings posted to NorCal MLS Alliance. Does not include new-project condos not listed on MLS. Data from sources deemed reliable, but may contain errors and subject to revision. All numbers approximate. The # of active listings changes constantly.
Of the listings for sale on December 1, 2023, 28% were houses, and 72% were condos, co-ops, TICs & townhouses.*
The # of active listings on a given day is affected by 1) the # of new listings coming on market, 2) how quickly buyers put them into contract, 3) the sustained heat of the market over time, and 4) sellers pulling their homes off the market without selling.
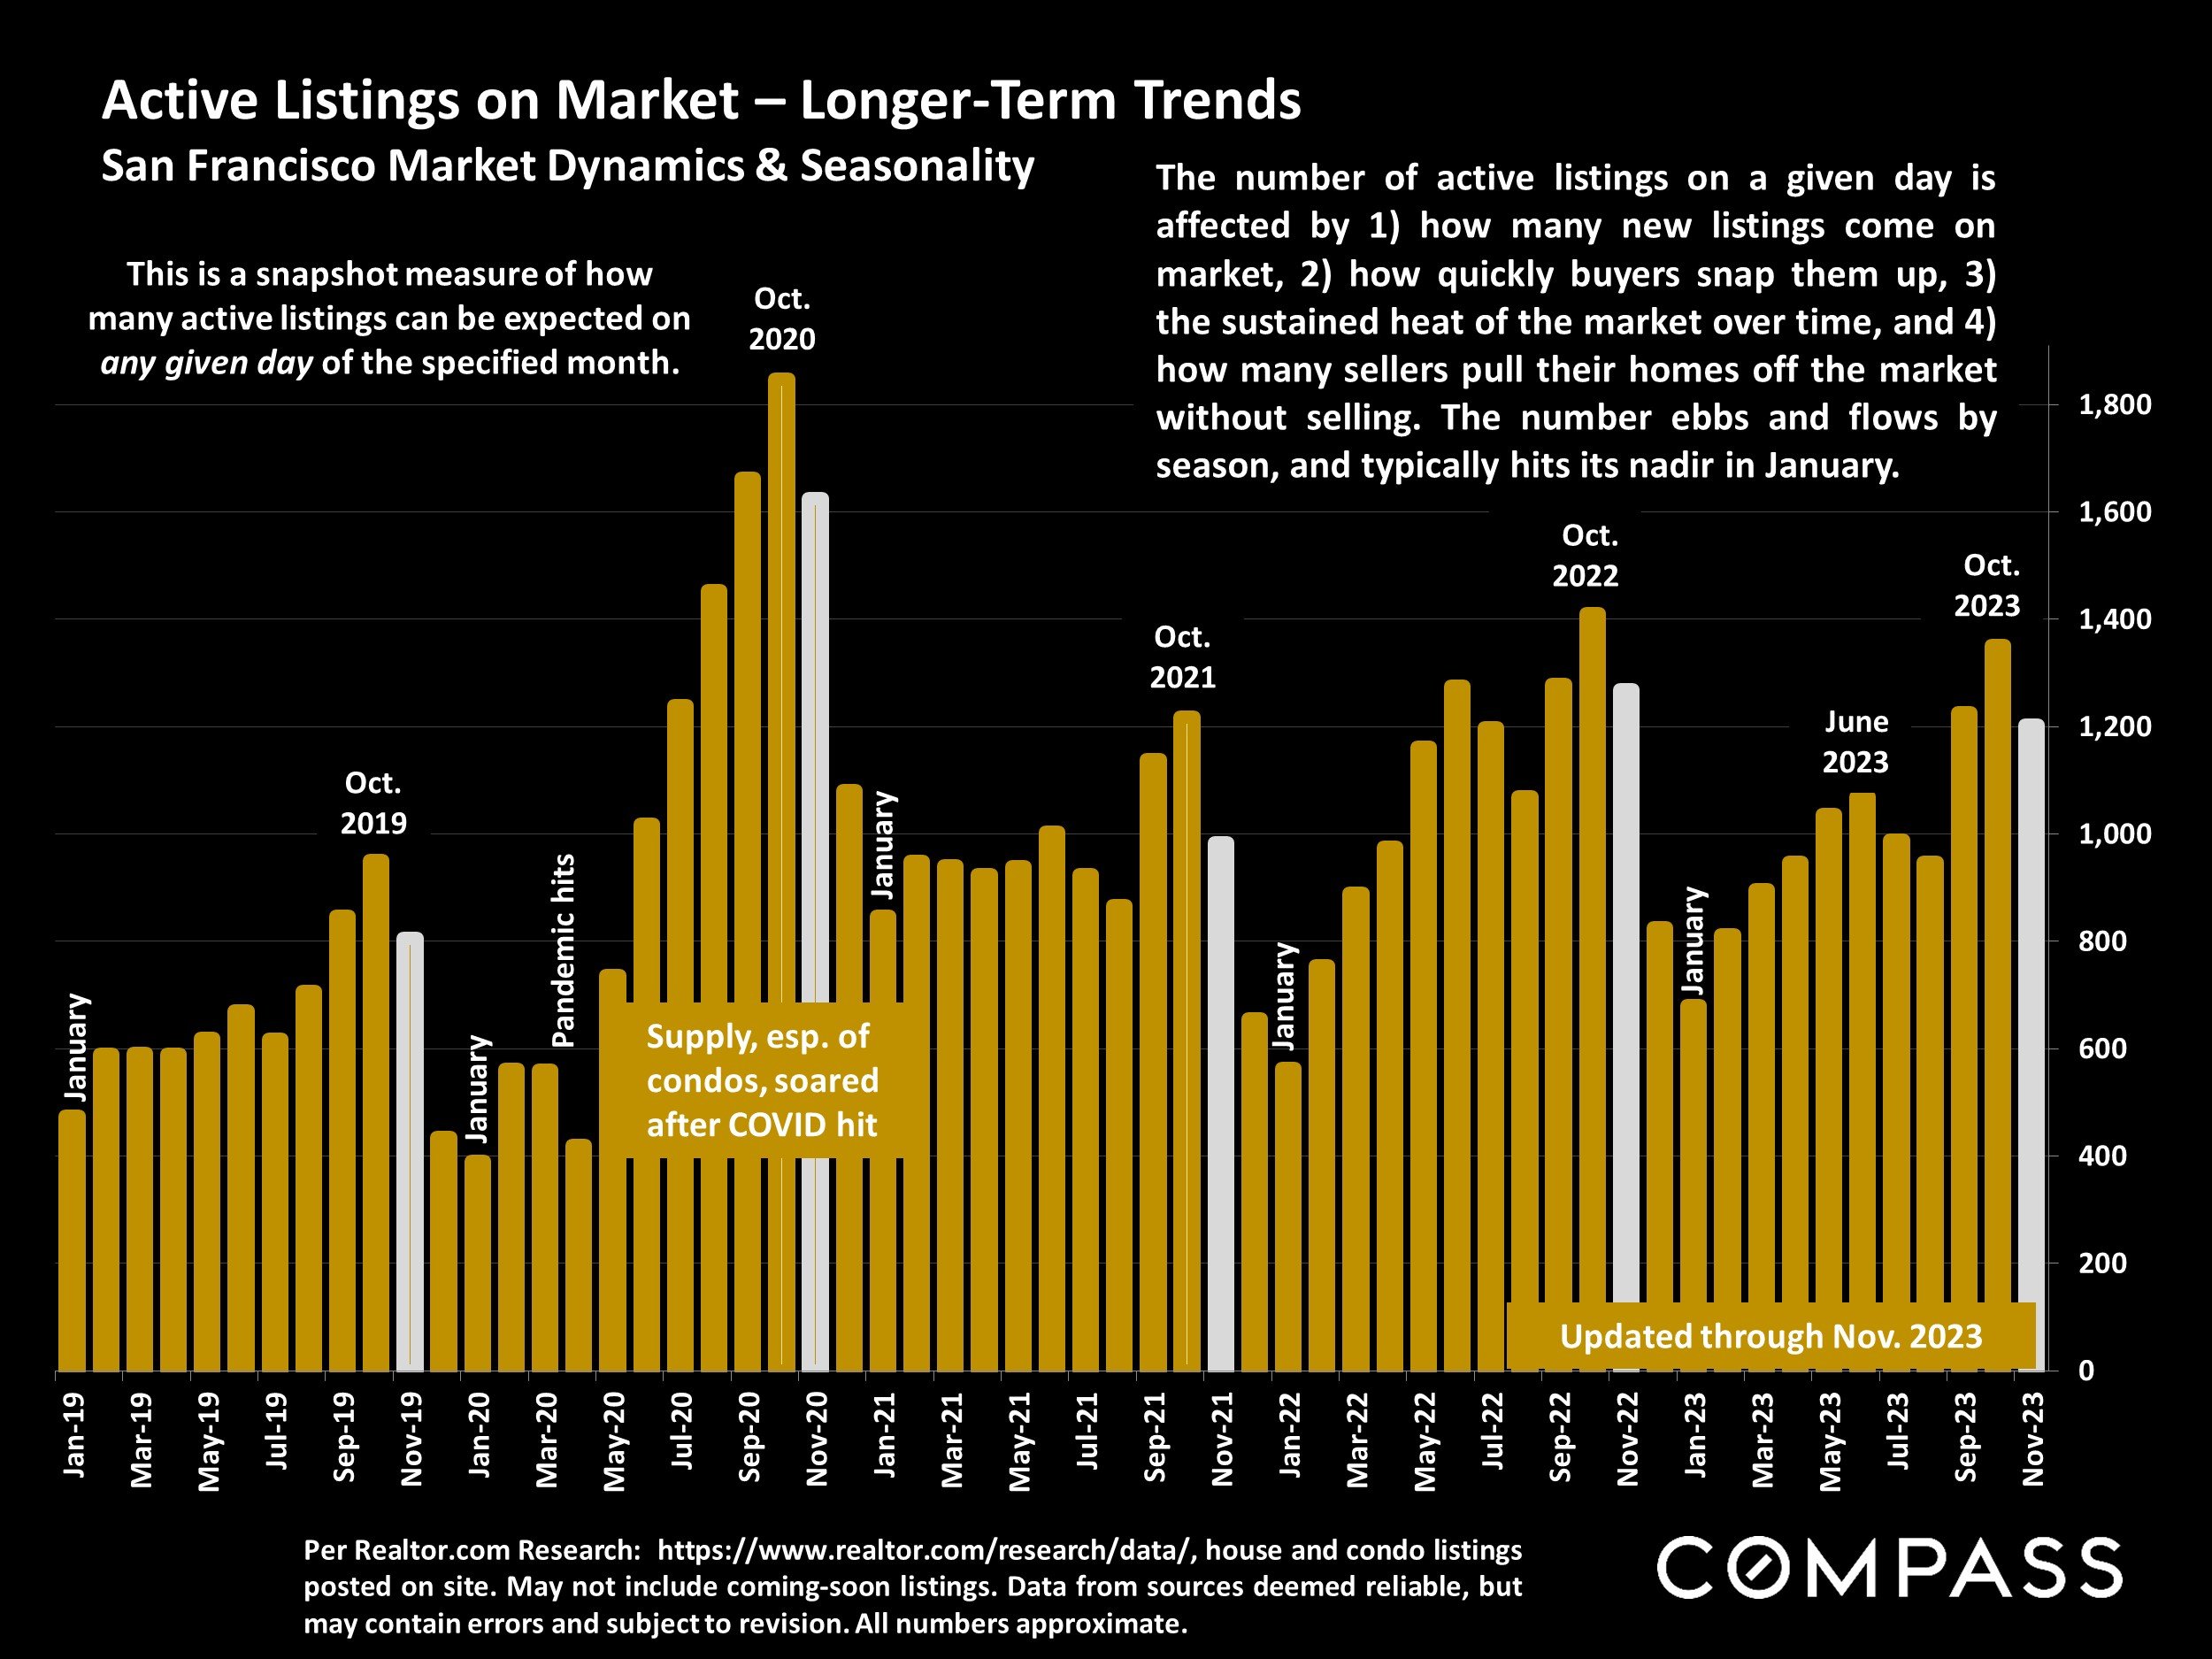
Active Listings on Market – Longer-Term Trends
San Francisco Market Dynamics & Seasonality
Per Realtor.com Research: https://www.realtor.com/research/data/, house and condo listings posted on site. May not include coming-soon listings. Data from sources deemed reliable, but may contain errors and subject to revision. All numbers approximate.
This is a snapshot measure of how many active listings can be expected on any given day of the specified month.
The number of active listings on a given day is affected by 1) how many new listings come on market, 2) how quickly buyers snap them up, 3) the sustained heat of the market over time, and 4) how many sellers pull their homes off the market without selling. The number ebbs and flows by season, and typically hits its nadir in January.
Listings Pending Sale (in Contract, Offer Accepted)
San Francisco Market Dynamics & Seasonality

Per Realtor.com Research: https://www.realtor.com/research/data/, house and condo listings posted on site. Data from sources deemed reliable, but may contain errors and subject to revision. All numbers are approximate.
This is a snapshot measure of how many pending listings can be expected on any given day of the specified month.
The # of listings going into contract measures buyer demand, but is also deeply impacted by the supply of new listings available to buy.
Market activity will almost certainly continue to decline during the mid-winter holiday period.
Monthly Home Sales Volume
San Francisco Market Dynamics & Seasonality

Sales of houses, condos, townhouses reported to NorCal MLS Alliance, per Infosparks. Data from sources deemed reliable but may contain errors and subject to revision. Last month estimated based on available information and may change with late reported sales. All numbers approximate.
Sales in one month mostly reflect accepted-offer activity in the previous month. Sales volume can be expected to decline through January before picking up again in the new year.
San Francisco Higher-Price Home Sales*
Homes Selling for $3 Million+

*Houses, condos, co-ops, townhouses, TICs: Sales reported to NorCal MLS Alliance, per Infosparks. Does not include sales unreported to MLS. Data from sources deemed reliable but may contain errors and subject to revision. All numbers approximate, and may change with late-reported activity.
The number of higher-price sales typically ebbs and flows dramatically by season, with spring usually the biggest selling season, and mid-winter the slowest. There is usually a substantial spike up in sales in fall.
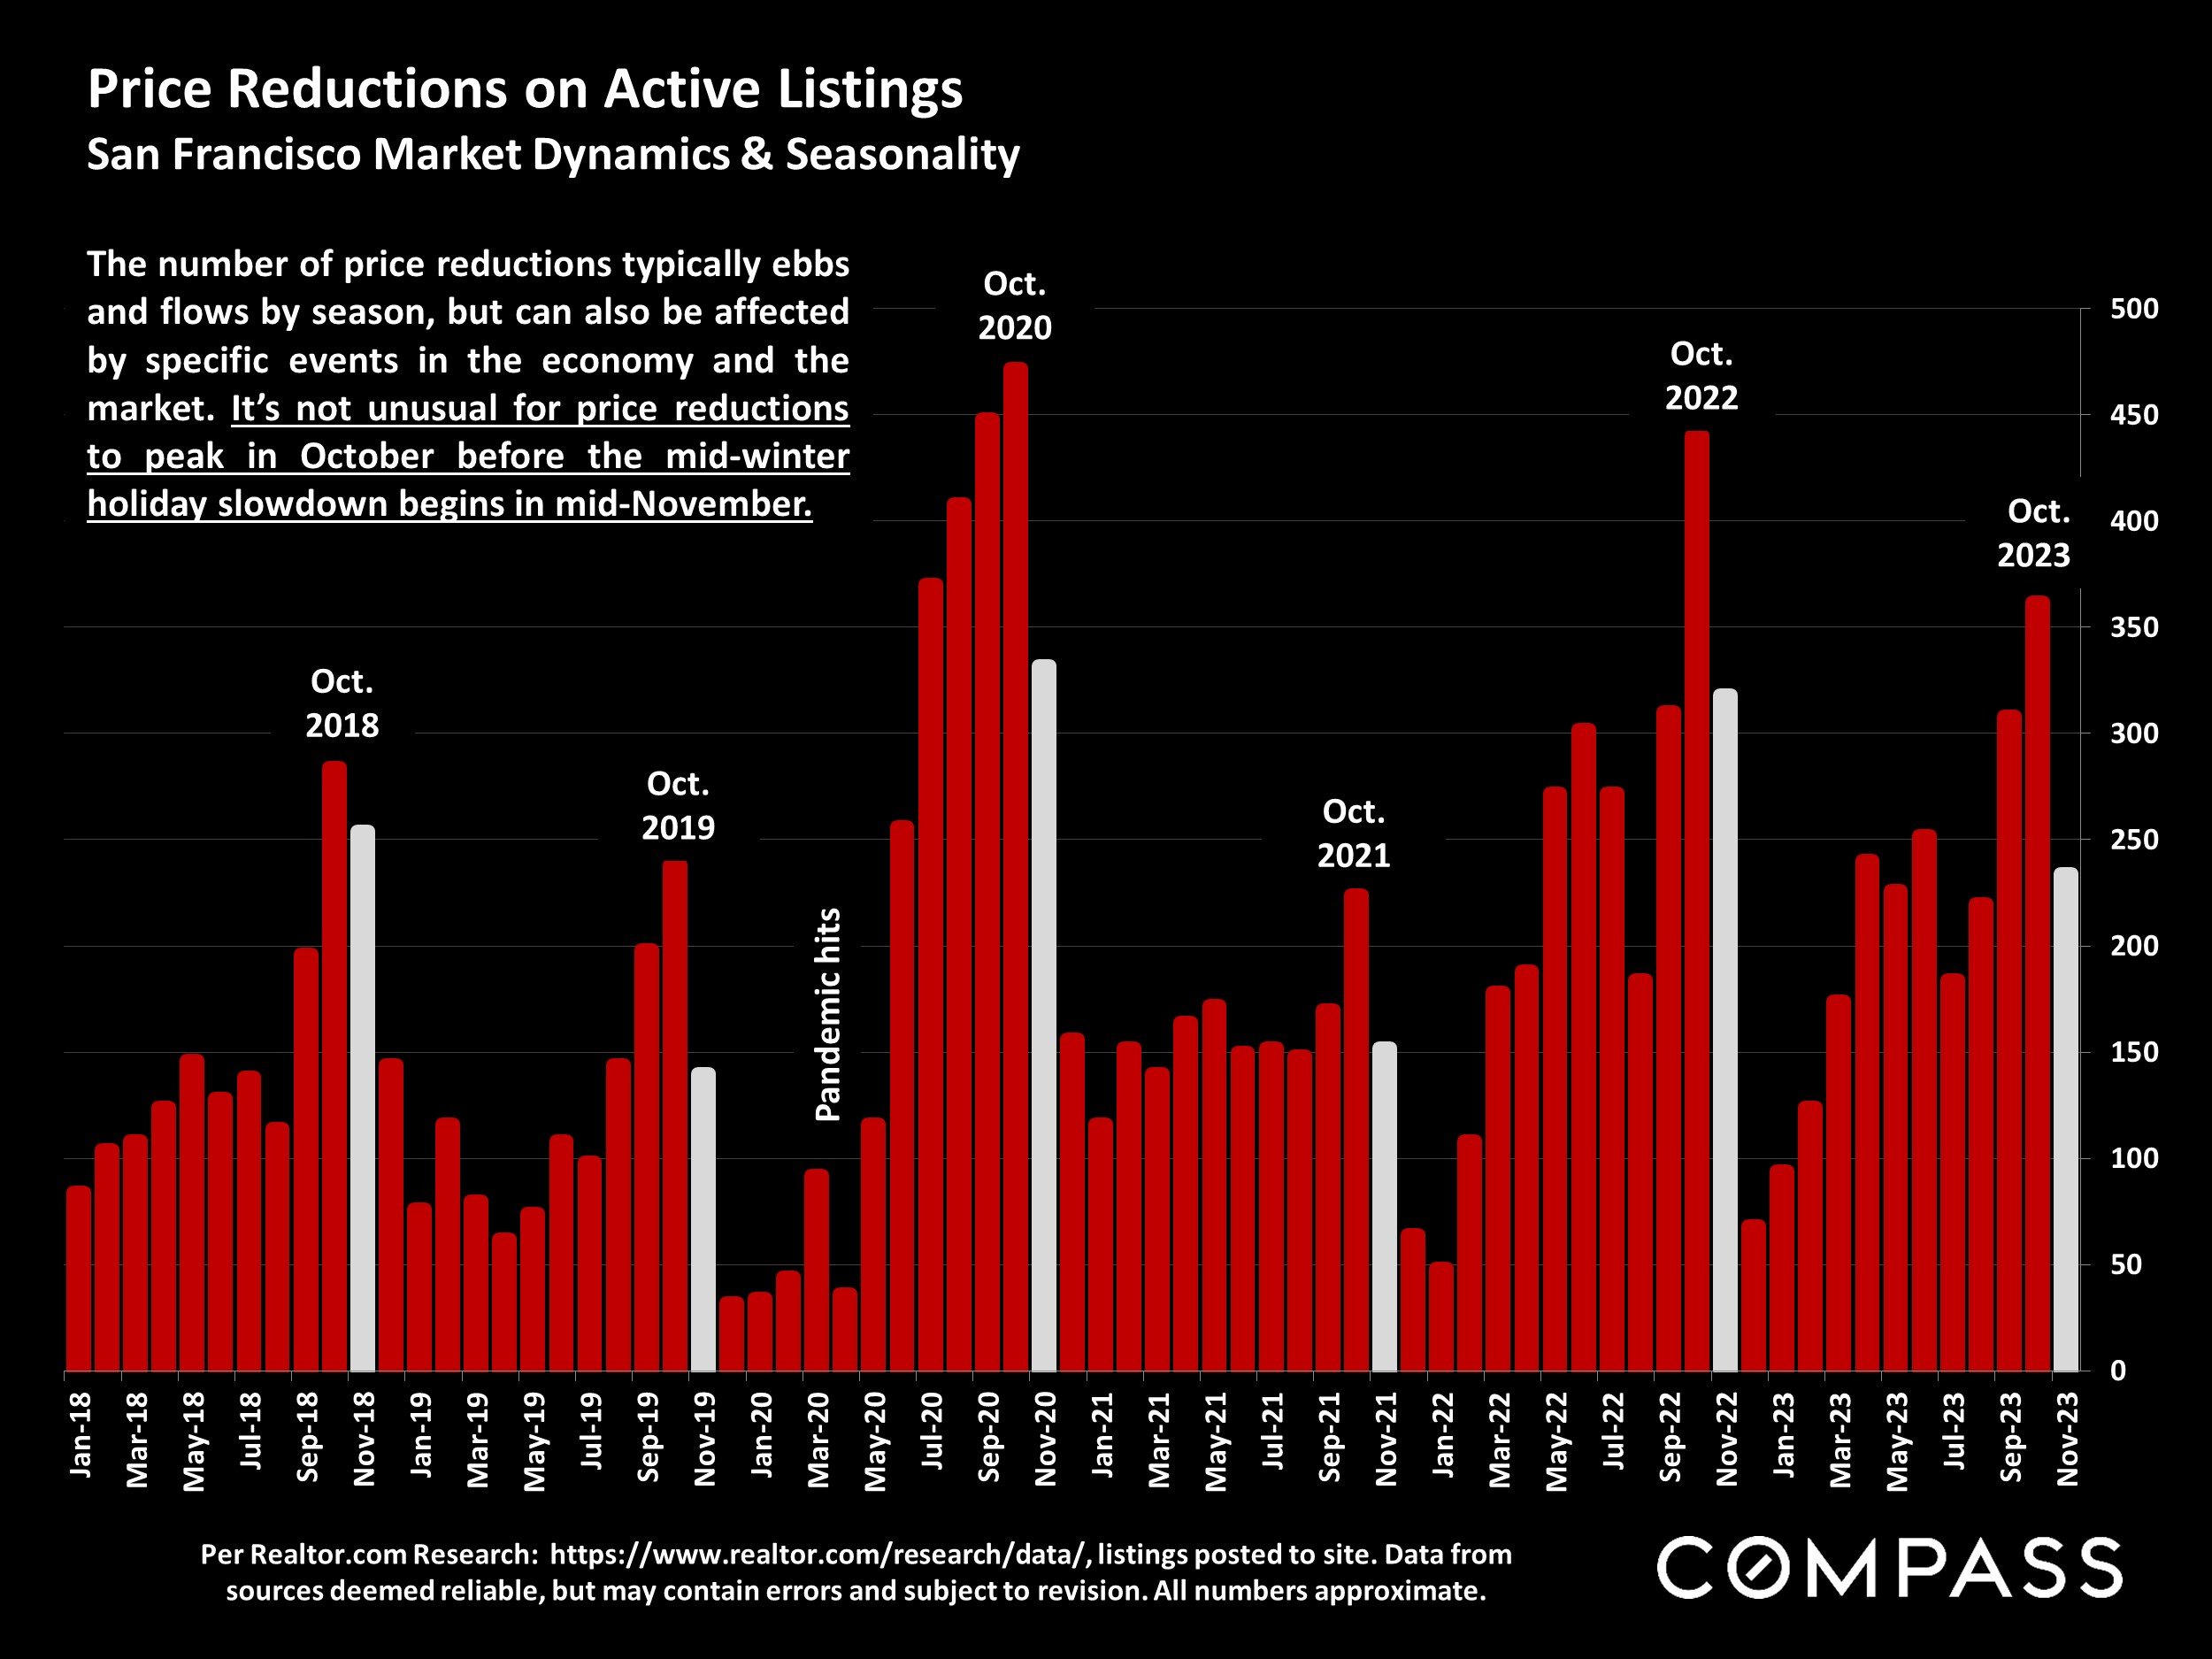
Price Reductions on Active Listings
San Francisco Market Dynamics & Seasonality
Per Realtor.com Research: https://www.realtor.com/research/data/, listings posted to site. Data from sources deemed reliable, but may contain errors and subject to revision. All numbers approximate.
The number of price reductions typically ebbs and flows by season, but can also be affected by specific events in the economy and the market. It’s not unusual for price reductions to peak in October before the mid-winter holiday slowdown begins in mid-November.
Average Days on Market – Speed of Sale
San Francisco Market Dynamics & Seasonality

Sales reported to NorCal MLS Alliance, per Infosparks. Data derived from sources deemed reliable, but may contain errors and subject to revision. All numbers approximate, and may change with late-reported sales.
Measuring how long it takes for sold listings to accept offers. Houses (green line) have significantly lower average days-on-market readings than condos (blue line).
Overbidding List Prices in San Francisco
Percentage of Home Sales Closing over List Price, since 2018

Sales data reported to NORCAL MLS® ALLIANCE, per Infosparks. Reflecting the percentage of sales closing at sales prices over the final list prices. Data from sources deemed reliable, but may contain errors and subject to revision. All numbers are approximate, and may change with late-reported sales.
By property type, the % selling over list price in Nov. 2023 for houses was 63%, and for condos, co-ops and TICs, 31%.
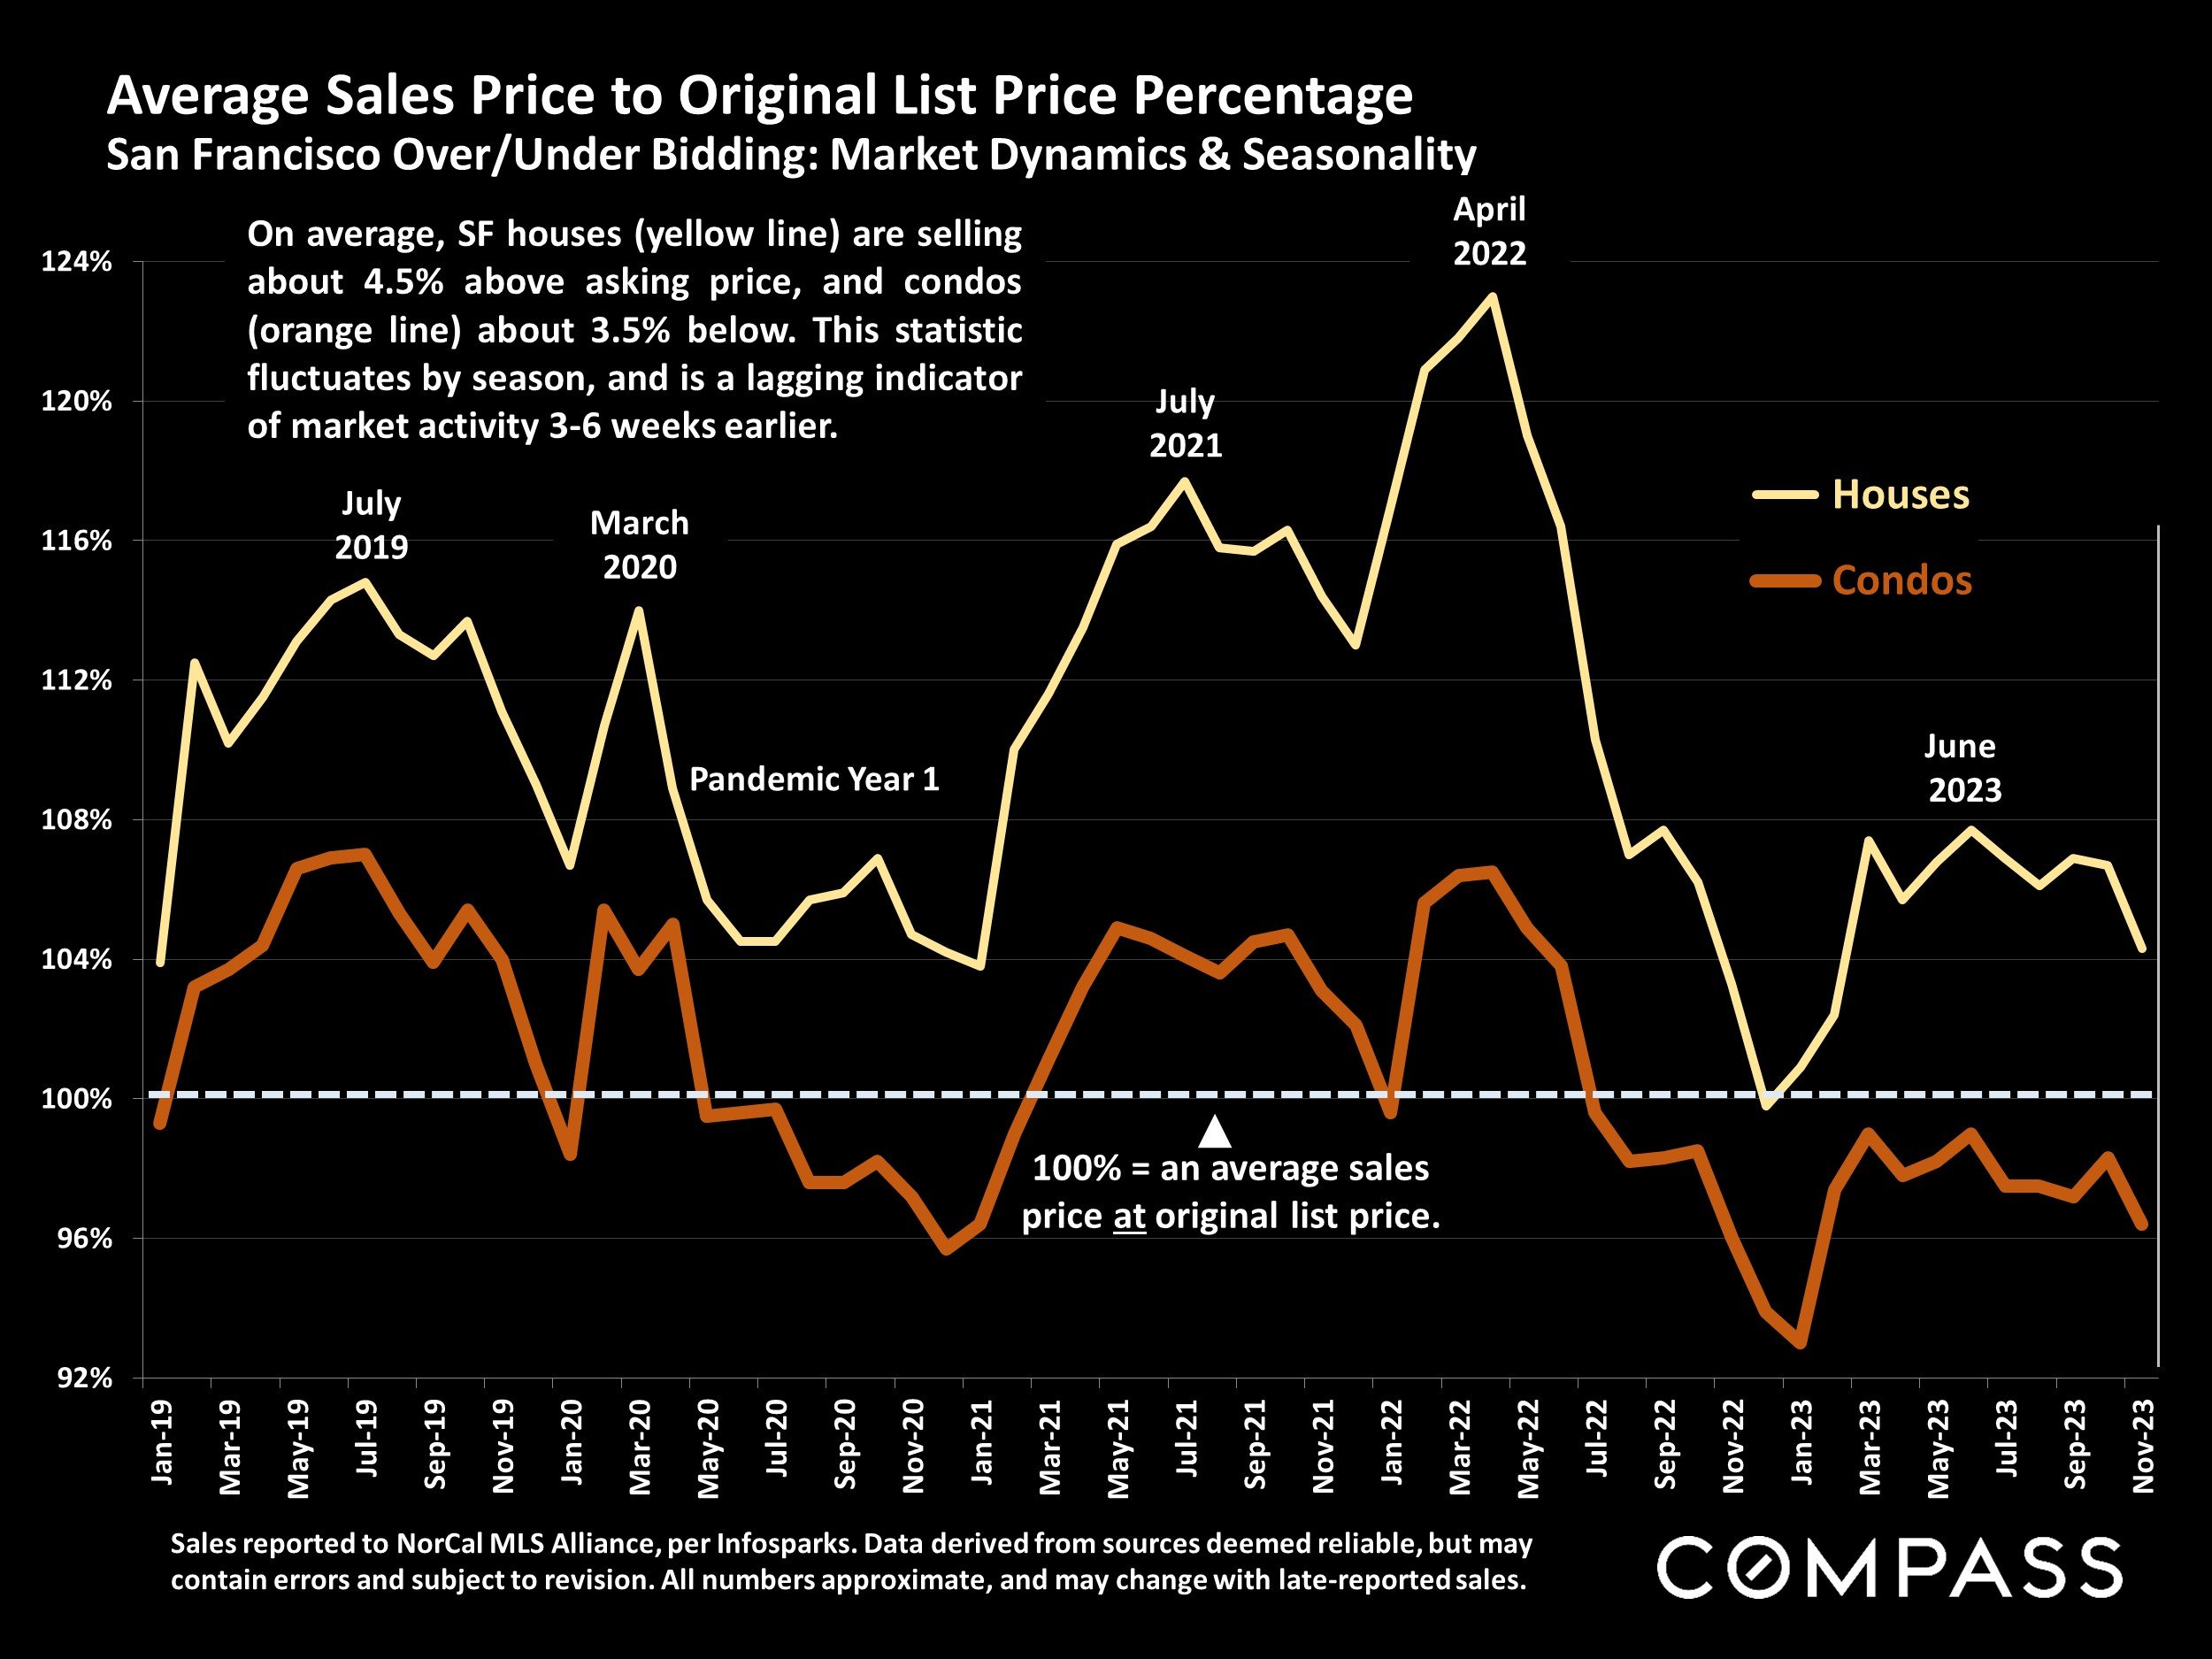
Average Sales Price to Original List Price Percentage
San Francisco Over/Under Bidding: Market Dynamics & Seasonality
Sales reported to NorCal MLS Alliance, per Infosparks. Data derived from sources deemed reliable, but may contain errors and subject to revision. All numbers approximate, and may change with late-reported sales.
On average, SF houses (yellow line) are selling about 4.5% above asking price, and condos (orange line) about 3.5% below. This statistic fluctuates by season, and is a lagging indicator of market activity 3-6 weeks earlier.
4-Year Median House Sales Price Appreciation Rates
Comparing August-October Median Sales Prices, 2023 vs. 2019, by County*

* Median house sales prices per NorCal MLS Alliance. Percentages rounded. Late-reported sales may change calculations. Counties contain submarkets of widely varying trends. All numbers approximate, may contain errors and subject to revision.
Comparing the 3-month-rolling median house sales price in mid autumn 2023 to the same period of 2019. Median sales prices can be affected by other factors besides changes in fair market value.
Inflation over the 4-year period was approximately 20% (per the BLS CPI Inflation Calculator).
Highlights from the "2023 Profile of Home Buyers and Sellers"
Published by the National Association of Realtors®, 11/13/23
The typical first-time buyer was 35 years old; the typical repeat buyer was 58.
59% of buyers were married couples, 19% single females, 10% single males, and 9% were unmarried couples.
30% of buyers had a child under 18 in their home (down from 58% in 1985).
13% of buyers purchased a new-construction home; 87% bought a previously-owned home.
Buyers typically searched for 10 weeks before purchasing. Approximately 5% - 10% purchased without seeing the property in person, using only online materials (per Realtors® Confidence Survey)
14% bought a multi-generational home - for care of aging parents, cost savings and to accommodate children aged 18+ years moving back in.
The typical home purchased had 3 bedrooms, 2 baths, and 1,860 square feet of living space.
Senior-related housing constituted 19% of purchases (involving buyers over the age of 60).
The median distance between the home purchased and the home moved from was 20 miles.
60% of buyers cited quality of neighborhood as the most important factor in location. 45% cited proximity to friends and family and 39% housing affordability as major factors.
80% of buyers financed their purchase, down from 87% in 2021. The typical downpayment for first-time homebuyers was 8%, and for repeat buyers, 19%.
The typical home seller was 60 years old, and had lived in their home for 10 years before selling. 63% of sellers reported moving within the same state, moving a median of 35 miles.
Homes sold were on market for a median 2 weeks, selling at a median of 100% of final list price.
89% of buyers and sellers worked with a real estate agent. 7% of sales were for-sale-by-owner (FSBO) - 57% of FSBO sales involved parties who already knew each other. Less than 1% of sales involved an ibuyer firm.
*Data copyright, National Association of Realtors®: https://www.nar.realtor/research-and-statistics/researchreports/highlights-from-the-profile-of-home-buyers-and-sellers. Used with permission. Data was collected via a survey of recent U.S. home buyers and sellers who completed a transaction between July 2022 and June 2023. Data from sources deemed reliable, but may contain errors and subject to revision.
U.S. Homeowner: "Probability of Moving" in Next 12 Months
Federal Reserve Bank of New York, Survey of Consumer Expectations*

*Source: Survey of Consumer Expectations, © 2013-2023 Federal Reserve Bank of New York (FRBNY). The SCE data are available without charge at http://www.newyorkfed.org/microeconomics/sce and may be used subject to license terms posted there. FRBNY disclaims any responsibility for this analysis and interpretation of Survey of Consumer Expectations data. https://www.newyorkfed.org/microeconomics/sce/housing#/owners_21
Average one-year ahead probability of homeowner moving: Readings for February of each year.
Except for the pandemic-related surge, the % of homeowners expecting to move in the following year has been rapidly declining for 10 years, deeply affecting the # of new listings coming on market.
Mortgage-Free Homes
National Percentage: Homes Owned Free & Clear*

*Data per U.S. Census as reported on by Bloomberg News, "The Share of Americans Who Are Mortgage-Free Is at an All-Time High," 11/17/23. Data from sources deemed reliable, but not guaranteed and may contain errors. All numbers should be considered approximate.
Over 39% of owner-occupied homes - involving approximately 33 million U.S. households - are owned free and clear. When these households sell, especially if relocating to more affordable properties and locations, their proceeds of sale make it much easier to buy their next homes all-cash - presumably a major factor in the increase in all-cash sales in recent years.
Statistics are generalities, essentially summaries of widely disparate data generated by dozens, hundreds or thousands of unique, individual sales occurring within different time periods. They are best seen not as precise measurements, but as broad, comparative indicators, with reasonable margins of error. Anomalous fluctuations in statistics are not uncommon, especially in smaller, expensive market segments. Last period data should be considered estimates that may change with late-reported data. Different analytics programs sometimes define statistics – such as “active listings,” “days on market,” and “months supply of inventory” – differently: what is most meaningful are not specific calculations but the trends they illustrate. Most listing and sales data derives from the local or regional multi-listing service (MLS) of the area specified in the analysis, but not all listings or sales are reported to MLS and these won’t be reflected in the data. “Homes” signifies real-property, single-household housing units: houses, condos, co-ops, townhouses, duets and TICs (but not mobile homes), as applicable to each market. City/town names refer specifically to the named cities and towns, unless otherwise delineated. Multi-county metro areas will be specified as such. Data from sources deemed reliable, but may contain errors and subject to revision. All numbers to be considered approximate.
Many aspects of value cannot be adequately reflected in median and average statistics: curb appeal, age, condition, amenities, views, lot size, quality of outdoor space, “bonus” rooms, additional parking, quality of location within the neighborhood, and so on. How any of these statistics apply to any particular home is unknown without a specific comparative market analysis.
Median Sales Price is that price at which half the properties sold for more and half for less. It may be affected by seasonality, “unusual” events, or changes in inventory and buying trends, as well as by changes in fair market value. The median sales price for an area will often conceal an enormous variety of sales prices in the underlying individual sales.
Dollar per Square Foot is based upon the home’s interior living space and does not include garages, unfinished attics and basements, rooms built without permit, patios, decks or yards (though all those can add value to a home). These figures are usually derived from appraisals or tax records, but are sometimes unreliable (especially for older homes) or unreported altogether. The calculation can only be made on those home sales that reported square footage.
Compass is a real estate broker licensed by the State of California, DRE 01527235. Equal Housing Opportunity. This report has been prepared solely for information purposes. The information herein is based on or derived from information generally available to the public and/or from sources believed to be reliable. No representation or warranty can be given with respect to the accuracy or completeness of the information. Compass disclaims any and all liability relating to this report, including without limitation any express or implied representations or warranties for statements contained in, and omissions from, the report. Nothing contained herein is intended to be or should be read as any regulatory, legal, tax, accounting or other advice and Compass does not provide such advice. All opinions are subject to change without notice. Compass makes no representation regarding the accuracy of any statements regarding any references to the laws, statutes or regulations of any state are those of the author(s). Past performance is no guarantee of future results.