January 2026 Market Report

Photo by Kellen Riggin on Unsplash
In 2025, Bay Area real estate markets started the year seeing strong buyer demand, but had the wind taken out of their sails by the political/economic uncertainty that soared in early spring. Then, in mid-late summer, stock markets rebounded to hit new highs, and interest rates began a sustained decline, initiating a shift in the psychology of buyers and sellers that is still developing.
However, in San Francisco, the market has been supercharged by its AI startup boom, a dynamic that dramatically accelerated this past fall. After years of social, economic and demographic challenges, the city has shifted back from being the weakest market in the Bay Area to the strongest. Stupendous amounts of new wealth are being created, and market conditions may well exceed those last seen in the IPO boom of 2019. Demand is far outpacing the supply of homes for sale, and we expect the city’s median house sales price will reach a new high in 2026. The luxury home market is particularly competitive, and in our most expensive district – which includes Pacific & Presidio Heights, Cow Hollow and Marina – median house and condo prices already hit new peaks in 2025. The condo market, though not as heated as the house market, has begun a substantial recovery fueled by high-tech workers flocking to the city.
As 2026 begins, interest rates are near multi-year lows and stock markets are at or close to all-time peaks. Early in the new year, it is common for buyers, re-energized to move forward with major life decisions, to jump back into the market faster than sellers list their homes for sale. This disparity of increasing demand versus a low supply of new listings usually runs through the spring, typically making these months the most heated selling season of the year. Last year, this was upended by the tariff shock. Barring new, unexpected economic alarms, we expect this spring to very heated indeed.
NOTE: This report includes an image link to our comprehensive review of district and neighborhood values and market dynamics.
Report created in good faith using data from sources deemed reliable but may contain errors and subject to revision. Last period figures are preliminary estimates based on data available early in the following month. All numbers approximate and may change with late-reported activity.
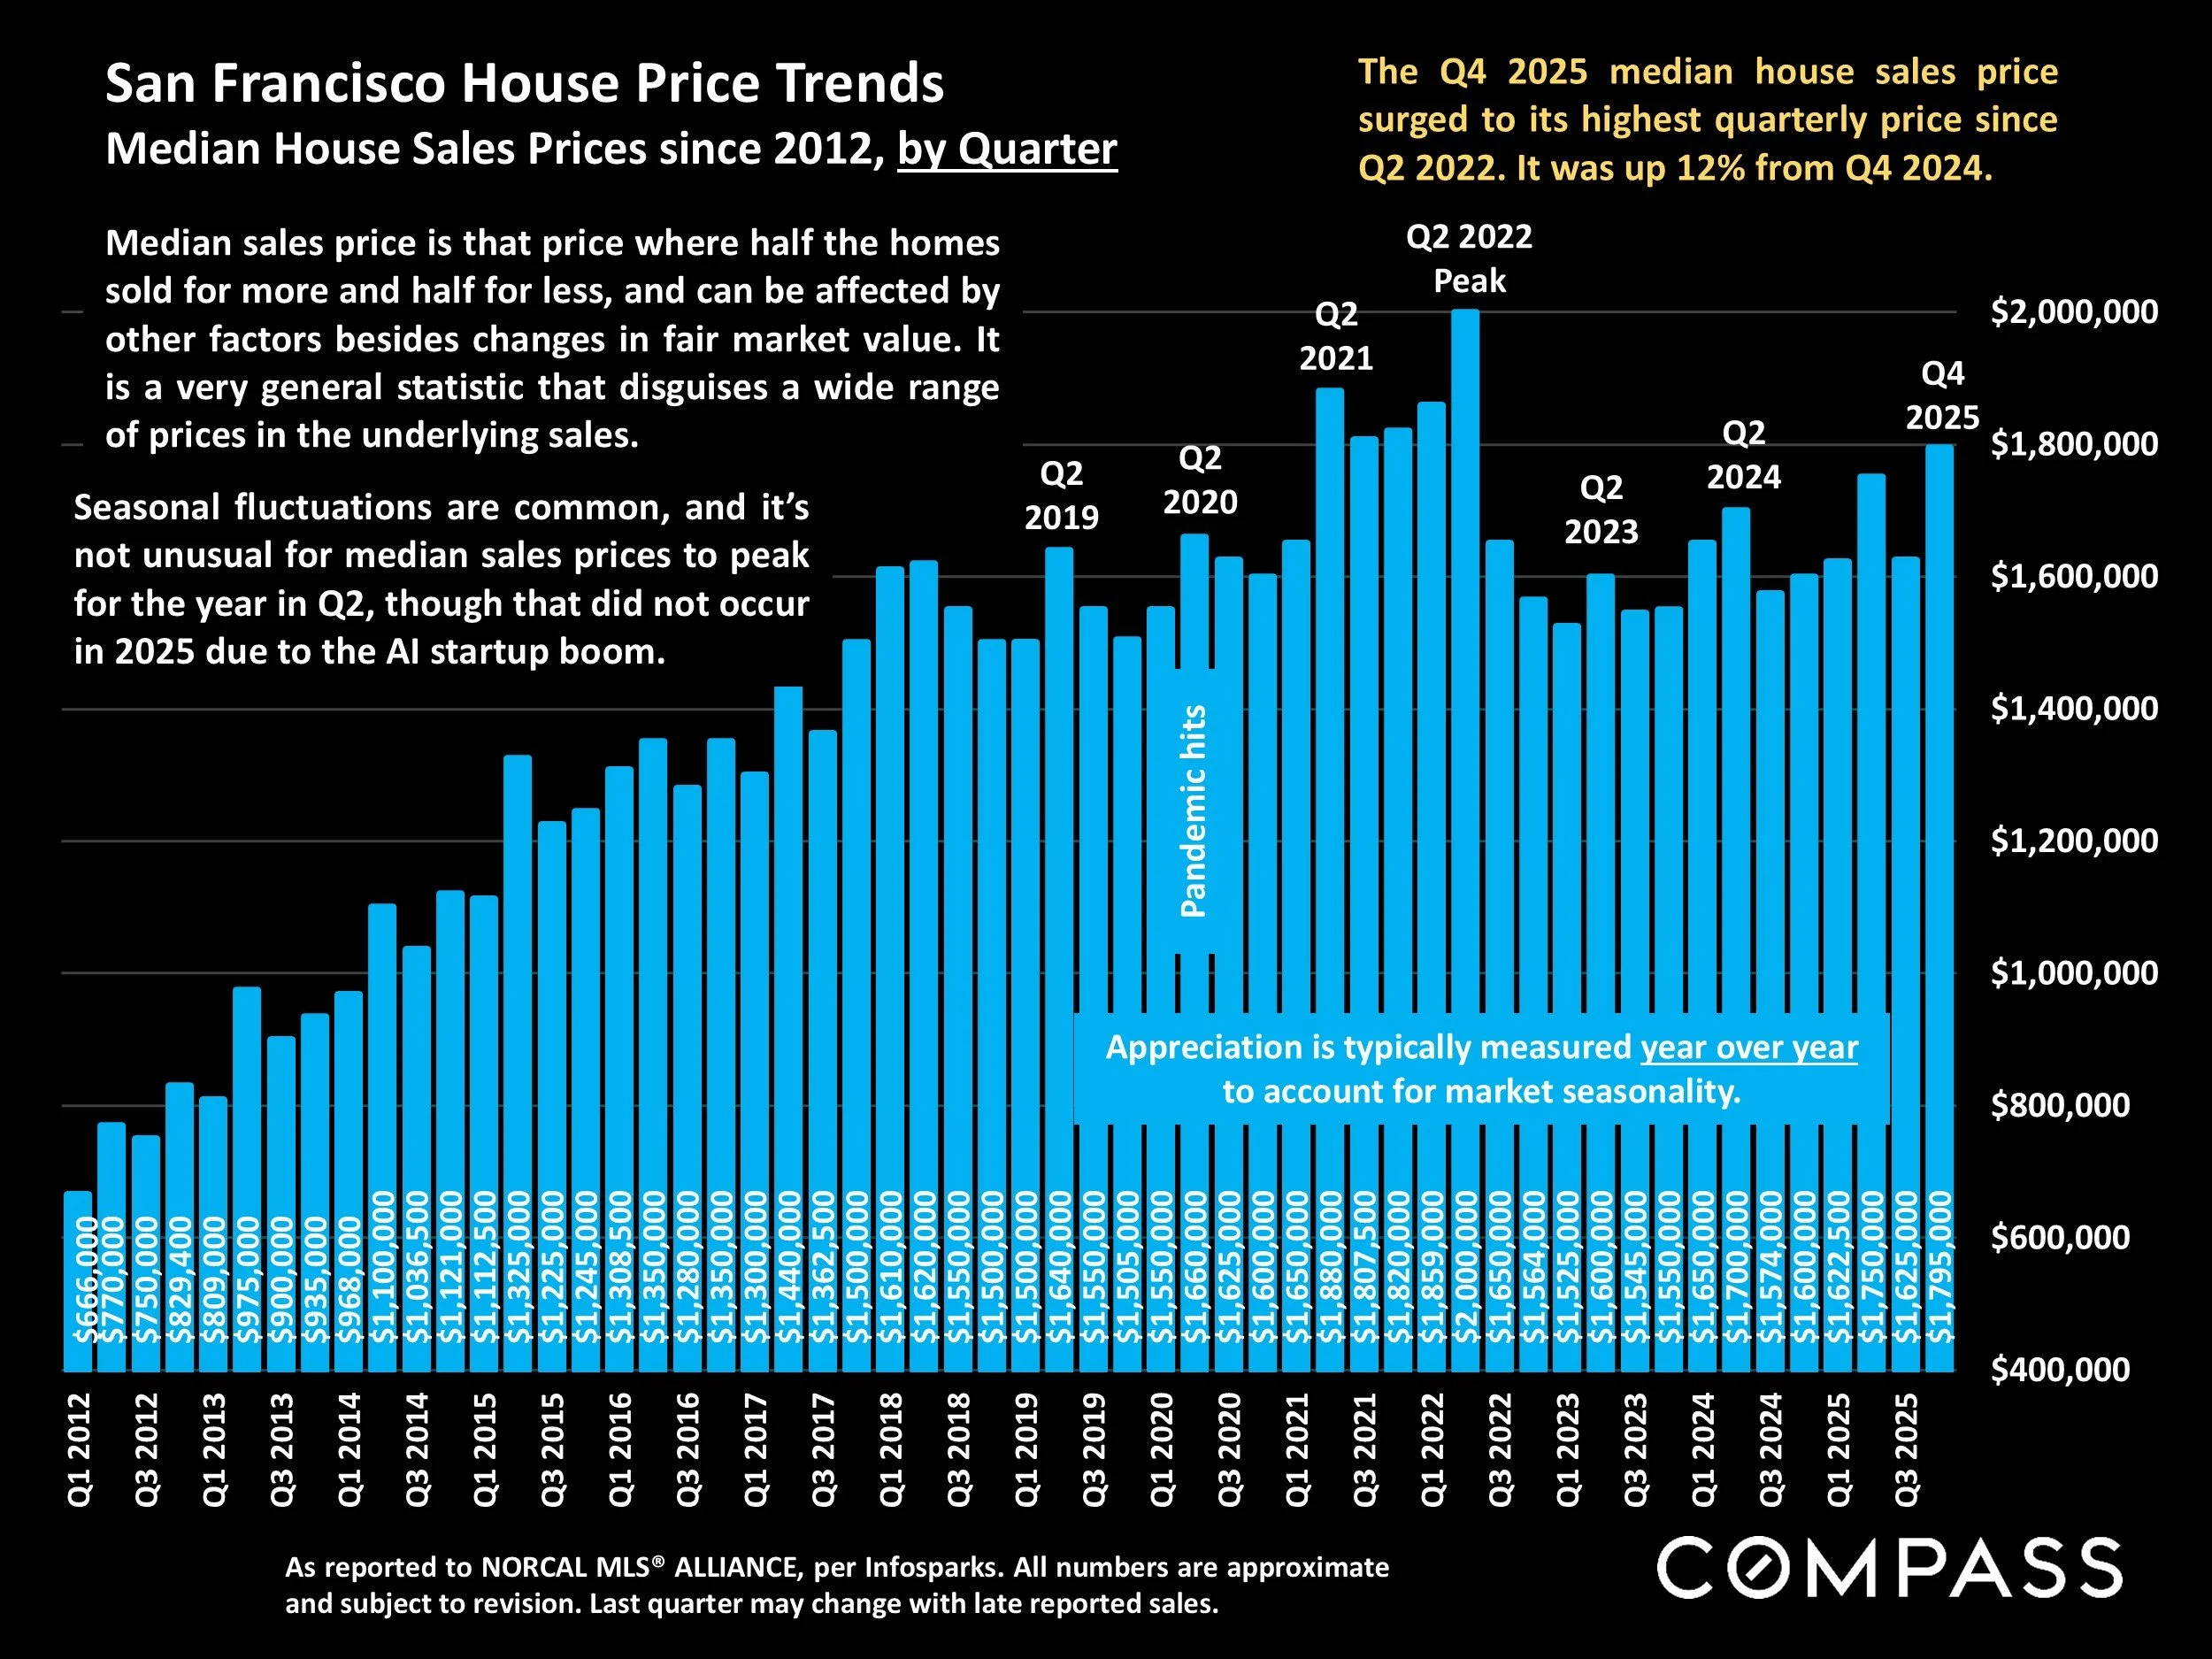
San Francisco House Price Trends
Median House Sales Prices since 2012, by Quarter
As reported to NORCAL MLS® ALLIANCE, per Infosparks. All numbers are approximate and subject to revision. Last quarter may change with late reported sales.
The Q4 2025 median house sales price surged to its highest quarterly price since Q2 2022. It was up 12% from Q4 2024.
Median sales price is that price where half the homes sold for more and half for less, and can be affected by other factors besides changes in fair market value. It is a very general statistic that disguises a wide range of prices in the underlying sales.
Seasonal fluctuations are common, and it’s not unusual for median sales prices to peak for the year in Q2, though that did not occur in 2025 due to the AI startup boom.
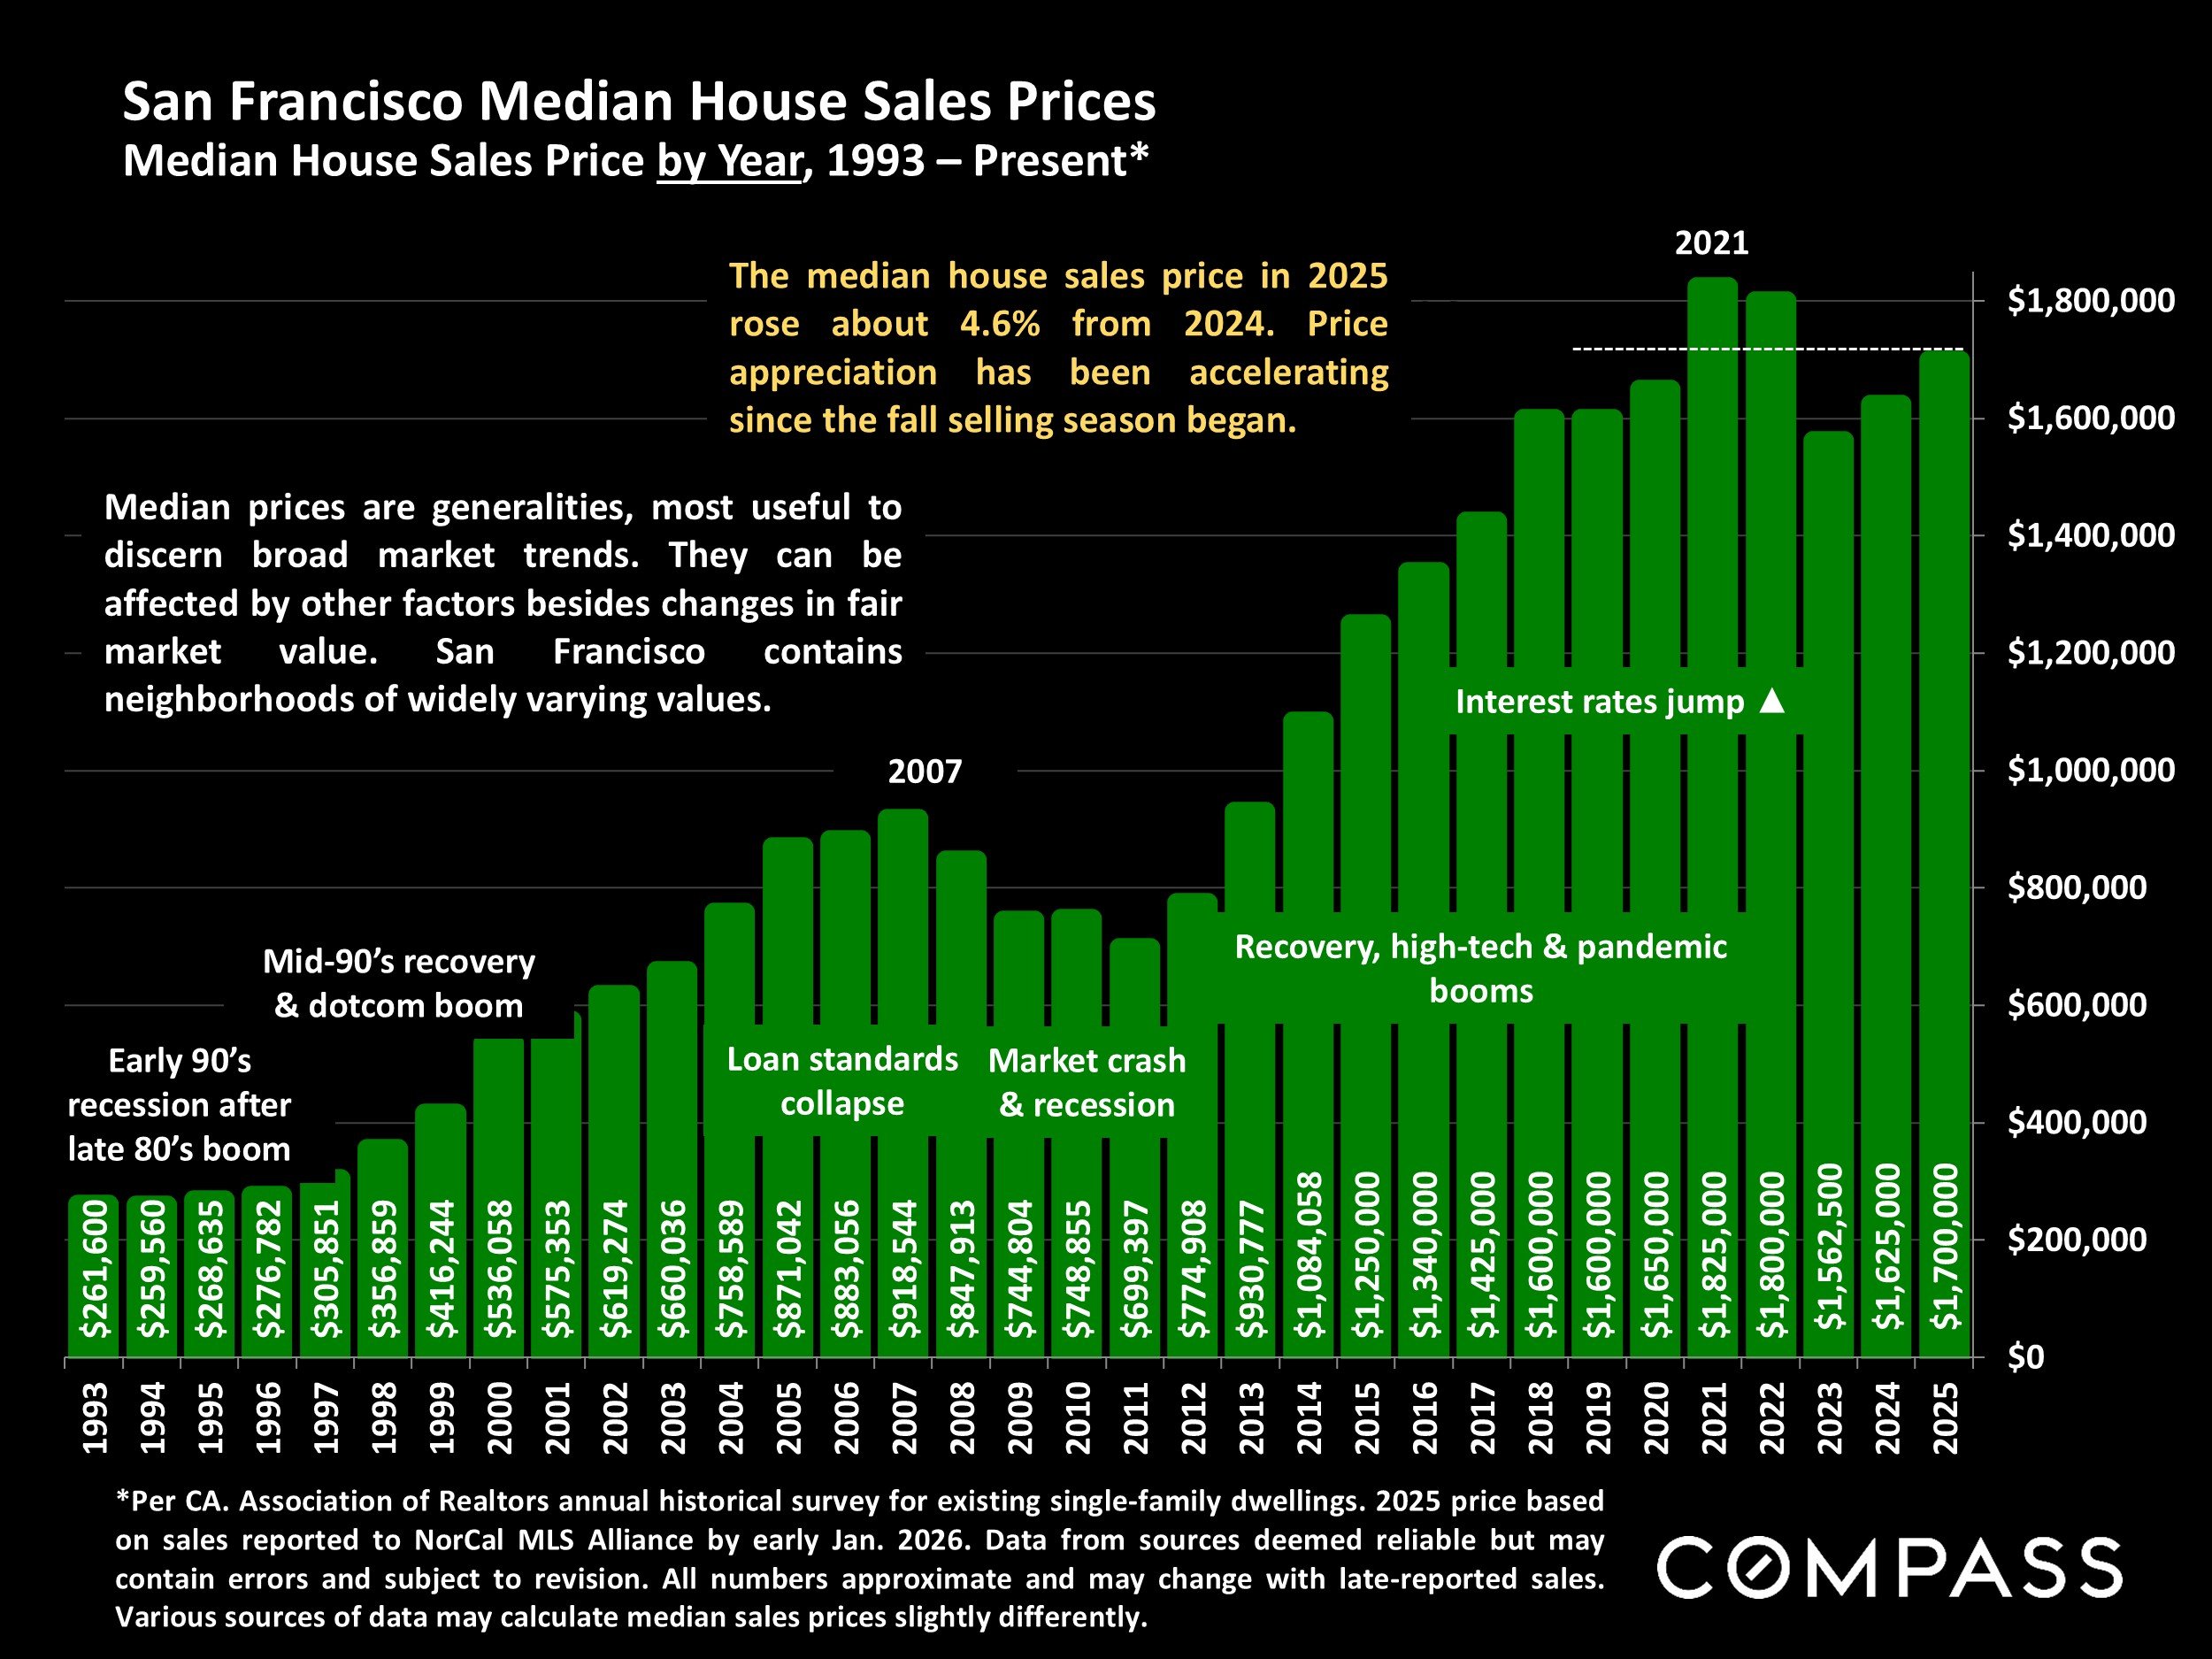
San Francisco Median House Sales Prices
Median House Sales Price by Year, 1993 – Present*
*Per CA. Association of Realtors annual historical survey for existing single-family dwellings. 2025 price basedon sales reported to NorCal MLS Alliance by early Jan. 2026. Data from sources deemed reliable but may contain errors and subject to revision. All numbers approximate and may change with late-reported sales. Various sources of data may calculate median sales prices slightly differently.
The median house sales price in 2025 rose about 4.6% from 2024. Priceappreciation has been accelerating since the fall selling season began.
Median prices are generalities, most useful to discern broad market trends. They can be affected by other factors besides changes in fair market value. San Francisco contains neighborhoods of widely varying values.
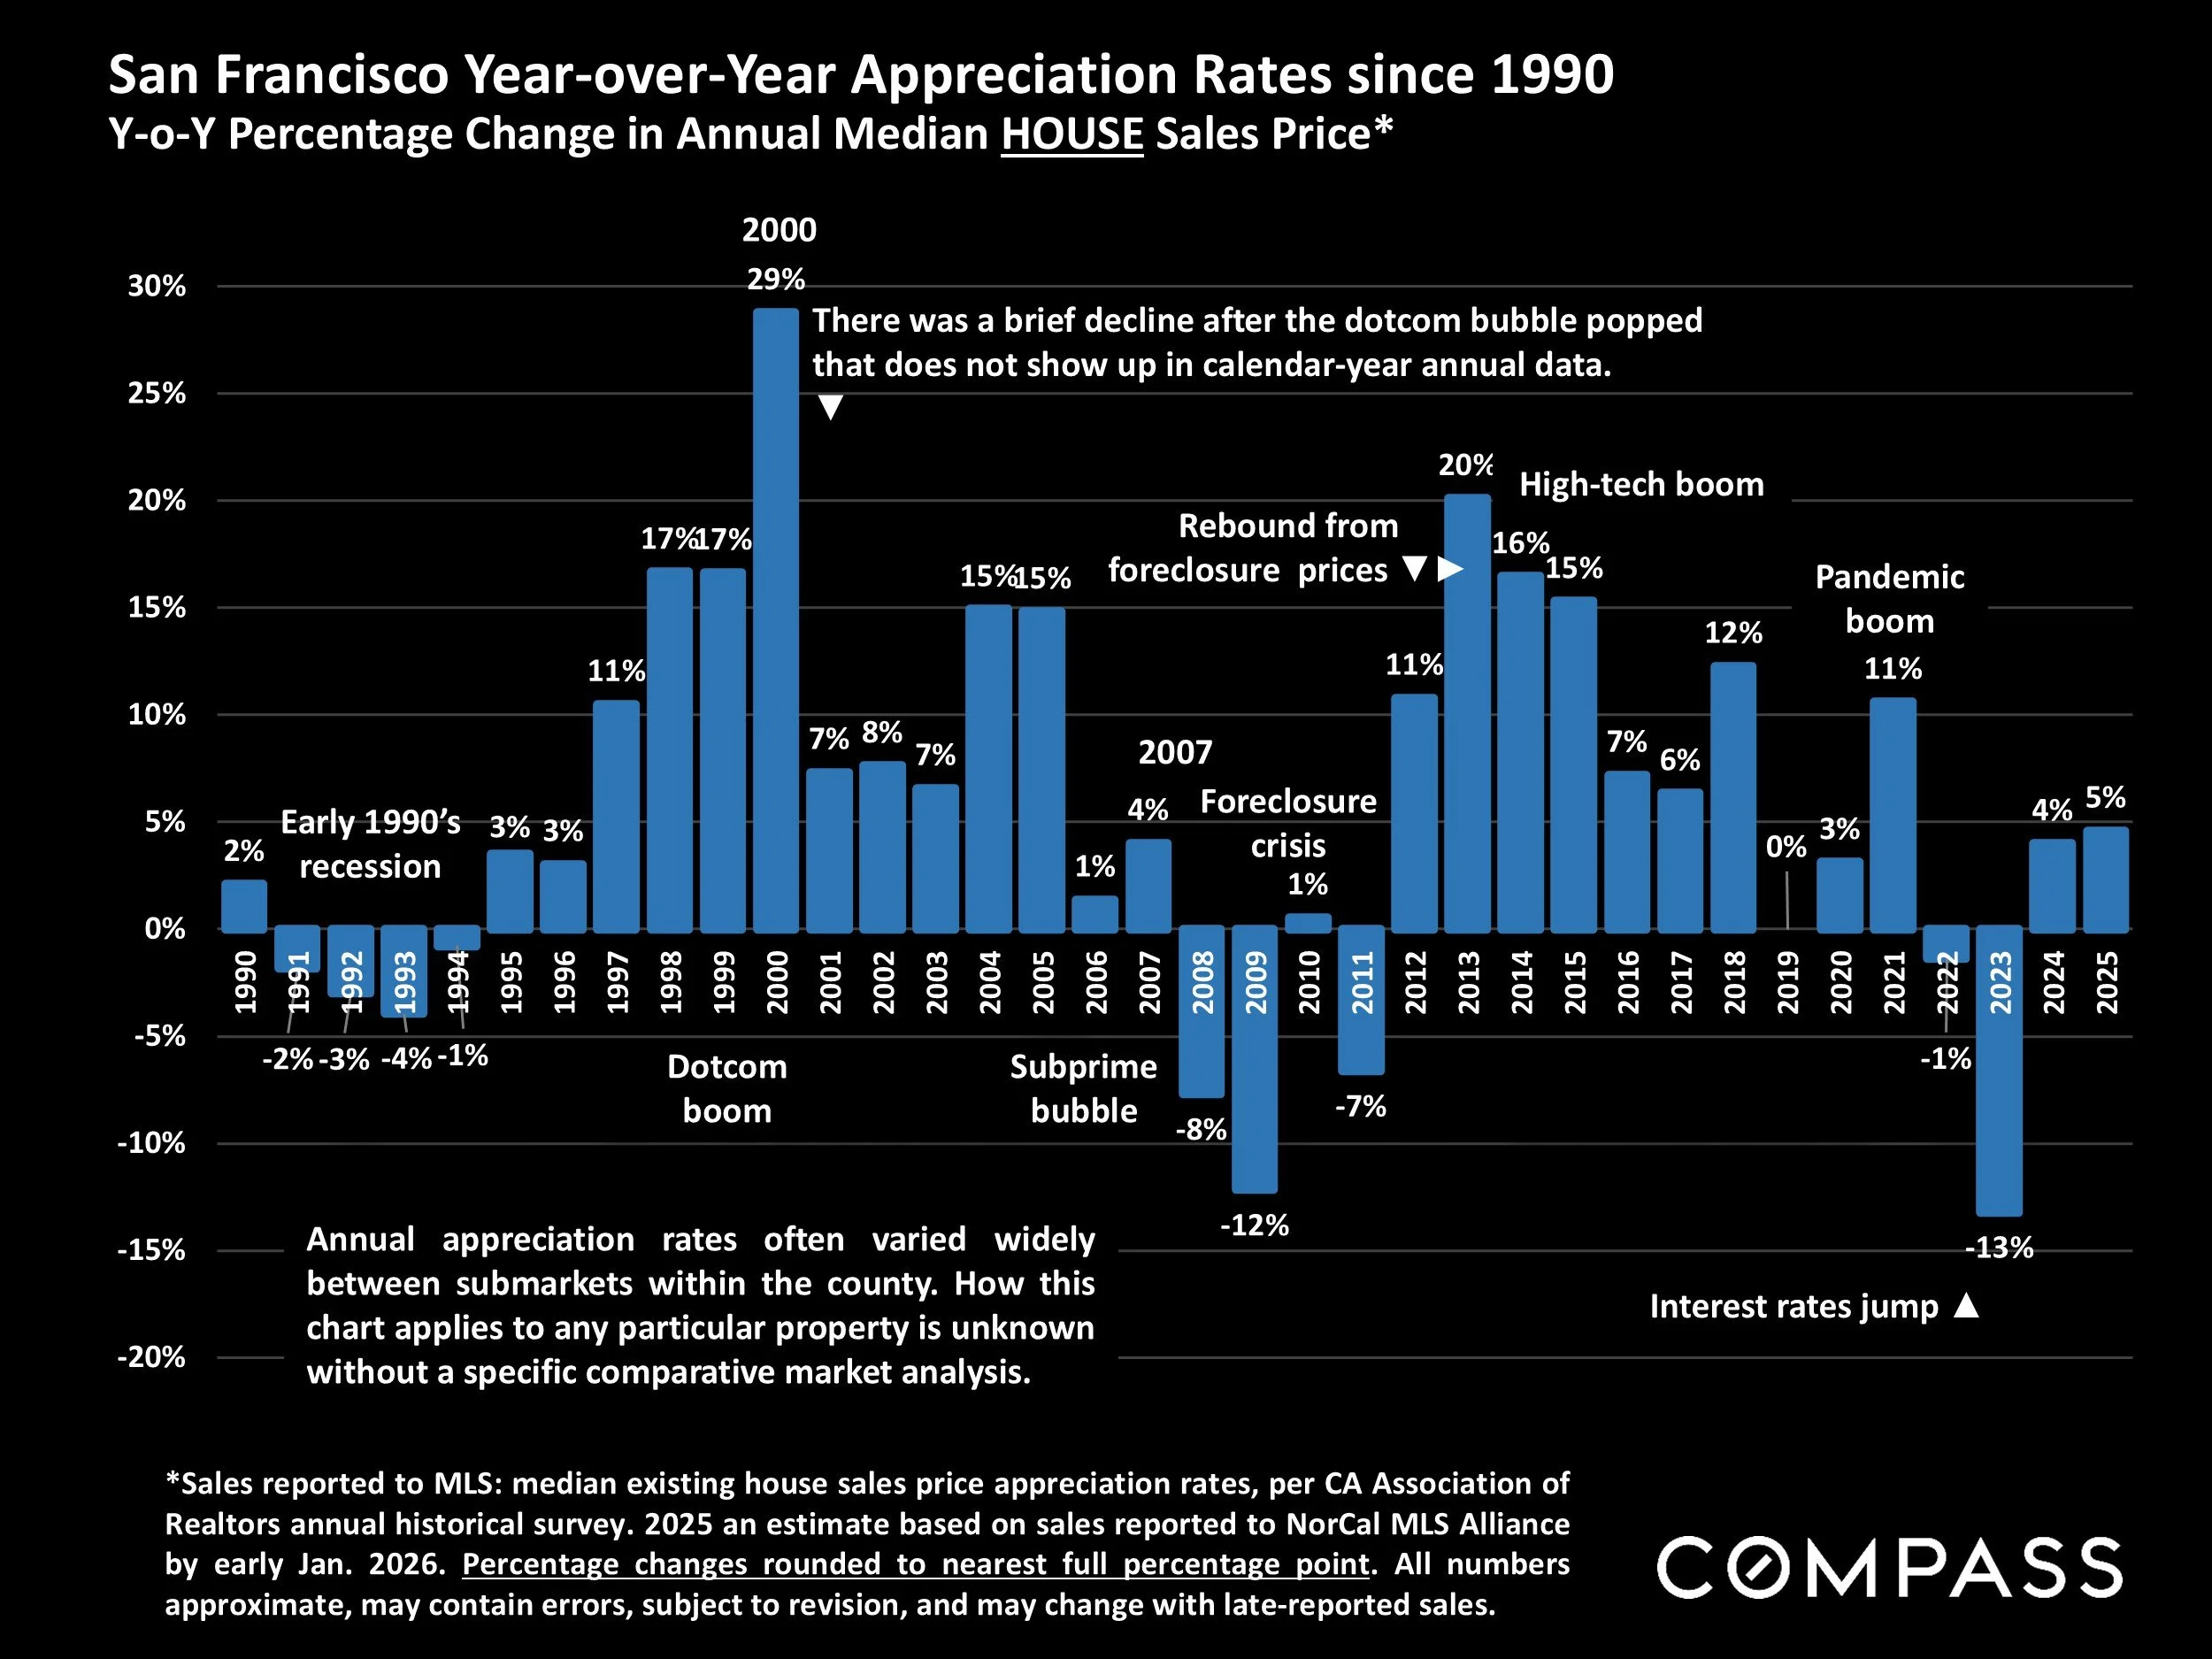
San Francisco Year-over-Year Appreciation Rates since 1990
Y-o-Y Percentage Change in Annual Median HOUSE Sales Price*
*Sales reported to MLS: median existing house sales price appreciation rates, per CA Association of Realtors annual historical survey. 2025 an estimate based on sales reported to NorCal MLS Allianceby early Jan. 2026. Percentage changes rounded to nearest full percentage point. All numbers approximate, may contain errors, subject to revision, and may change with late-reported sales.
Annual appreciation rates often varied widely between submarkets within the county. How this chart applies to any particular property is unknown without a specific comparative market analysis.
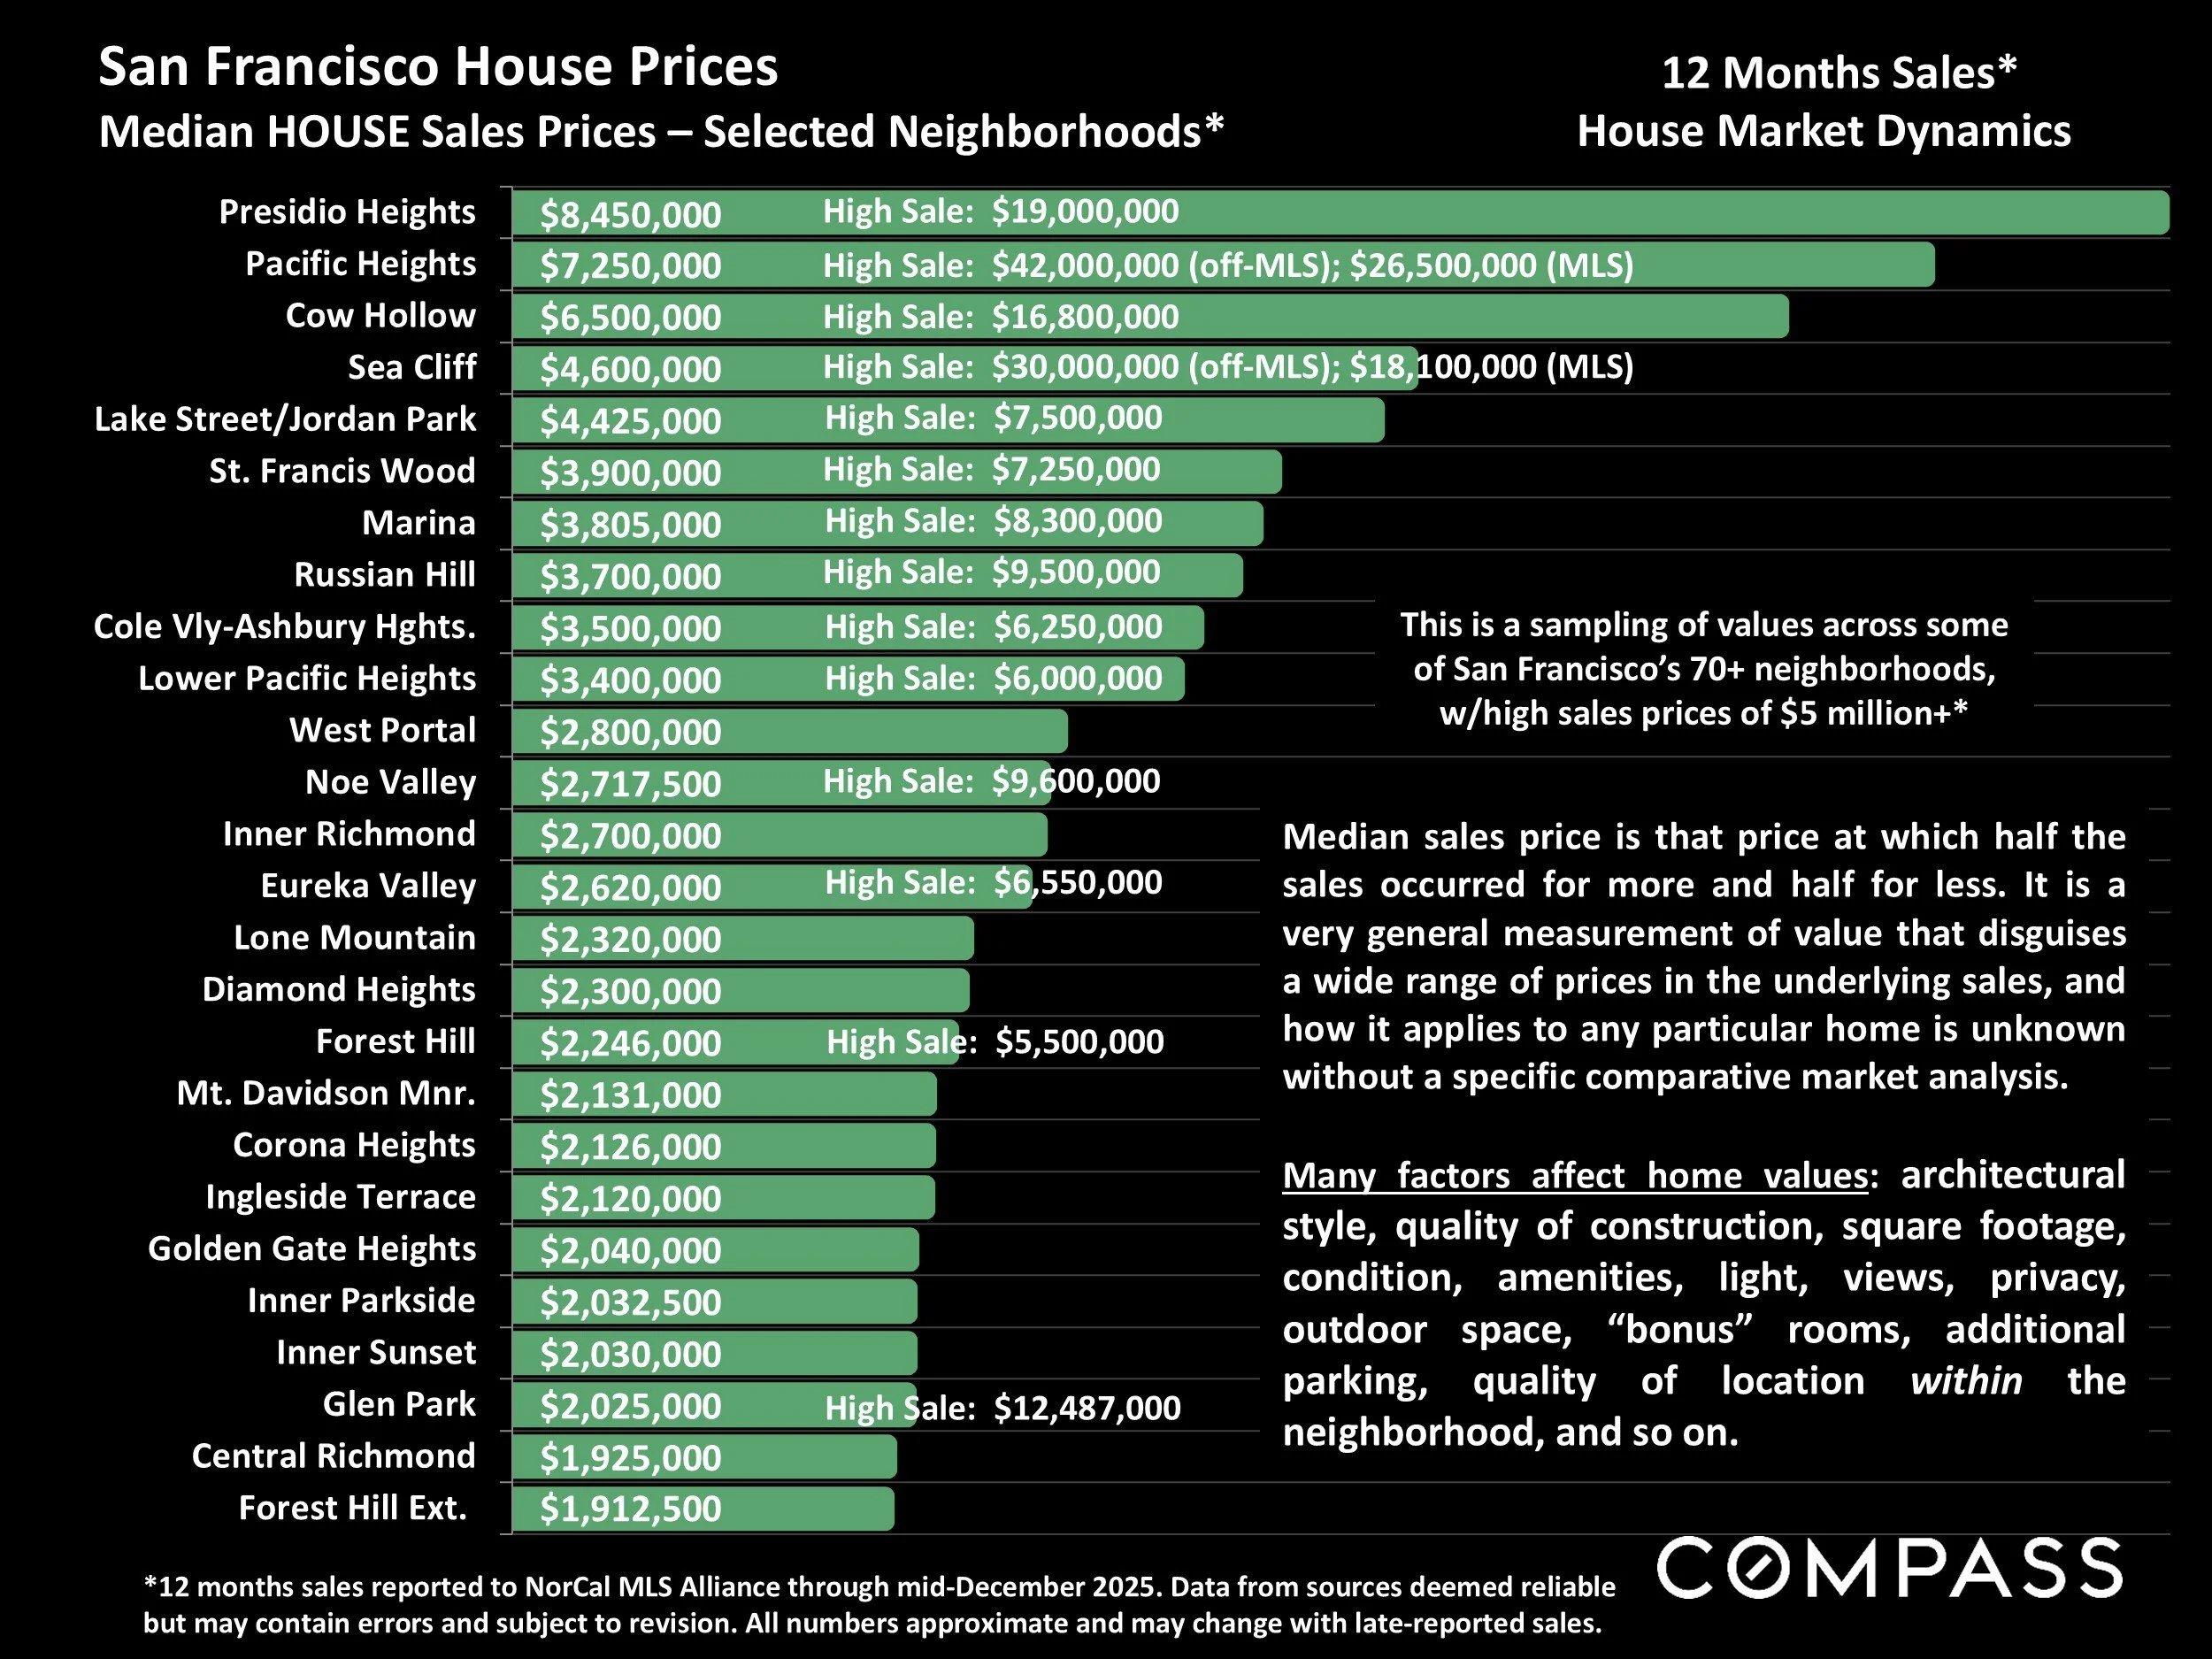
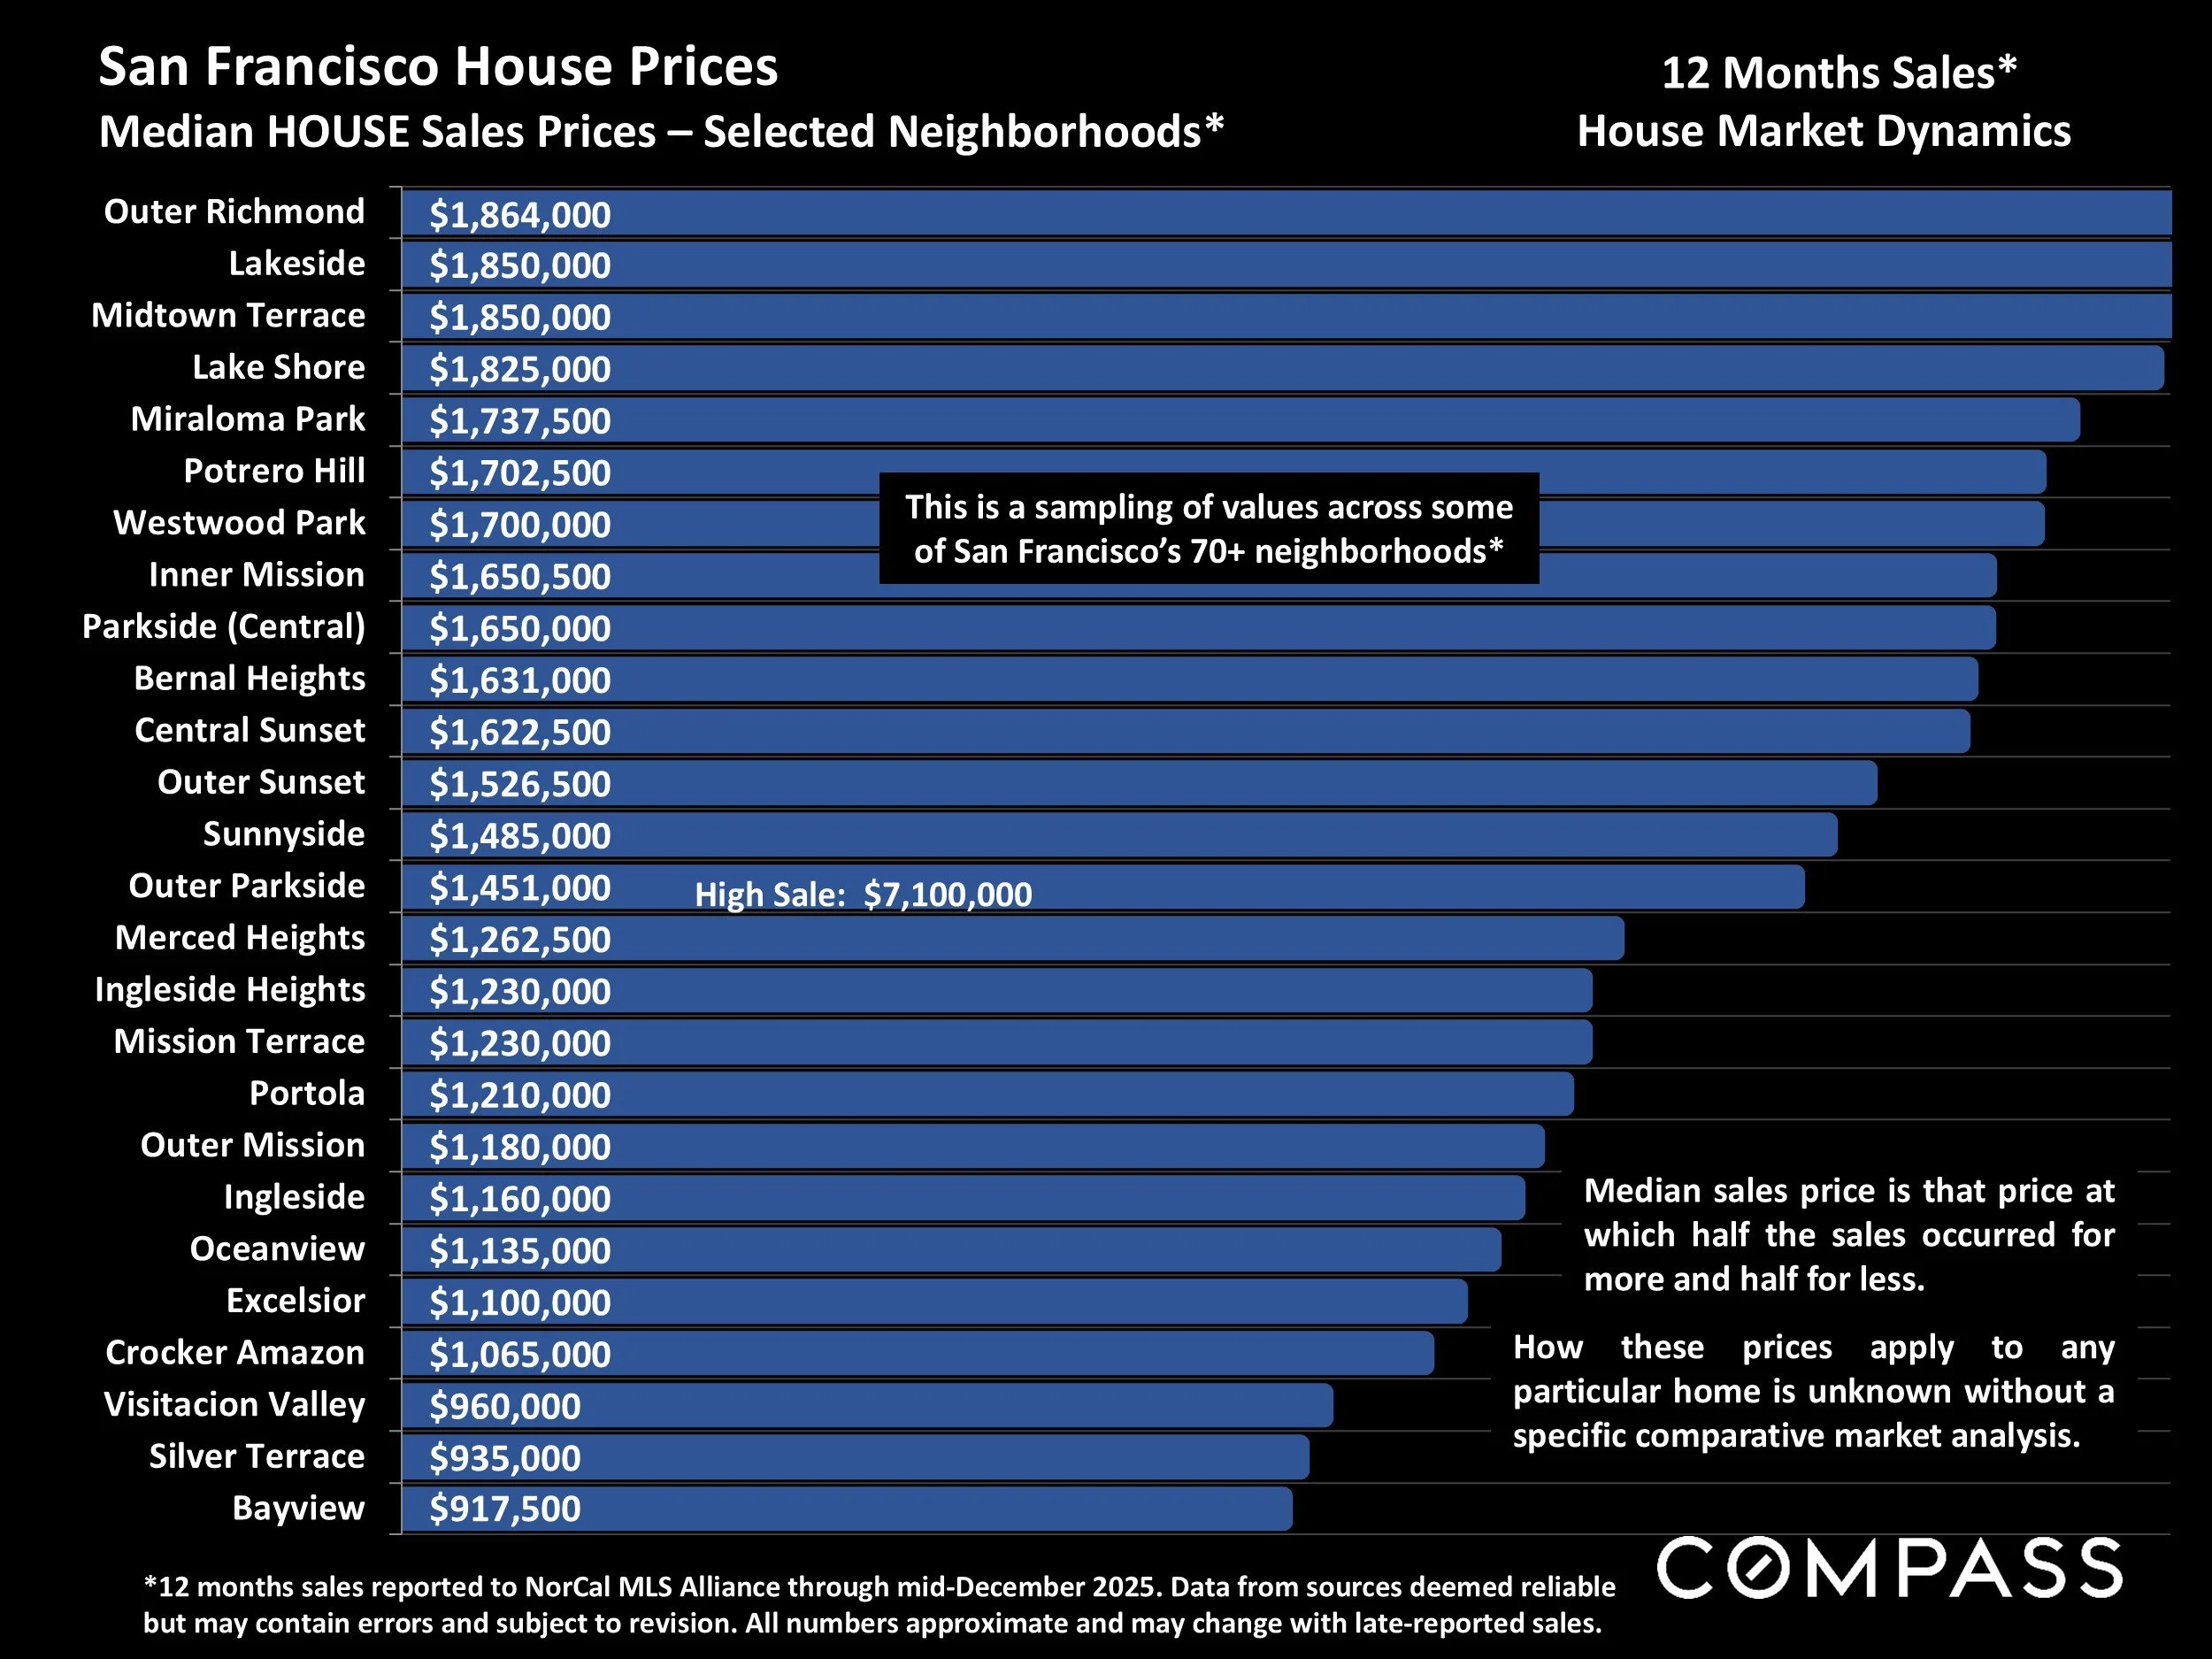
Median HOUSE Sales Prices – Selected Neighborhoods*
San Francisco House Prices
*12 months sales reported to NorCal MLS Alliance through mid-December 2025. Data from sources deemed reliable but may contain errors and subject to revision. All numbers approximate and may change with late-reported sales.
This is a sampling of values across some of San Francisco’s 70+ neighborhoods, w/high sales prices of $5 million+*
Median sales price is that price at which half the sales occurred for more and half for less. It is a very general measurement of value that disguises a wide range of prices in the underlying sales, and how it applies to any particular home is unknown without a specific comparative market analysis.
Many factors affect home values: architectural style, quality of construction, square footage, condition, amenities, light, views, privacy, outdoor space, “bonus” rooms, additional parking, quality of location within the neighborhood, and so on.
San Francisco Condo Price Appreciation
Median Condo Sales Prices, 2012 – Present, by Quarter
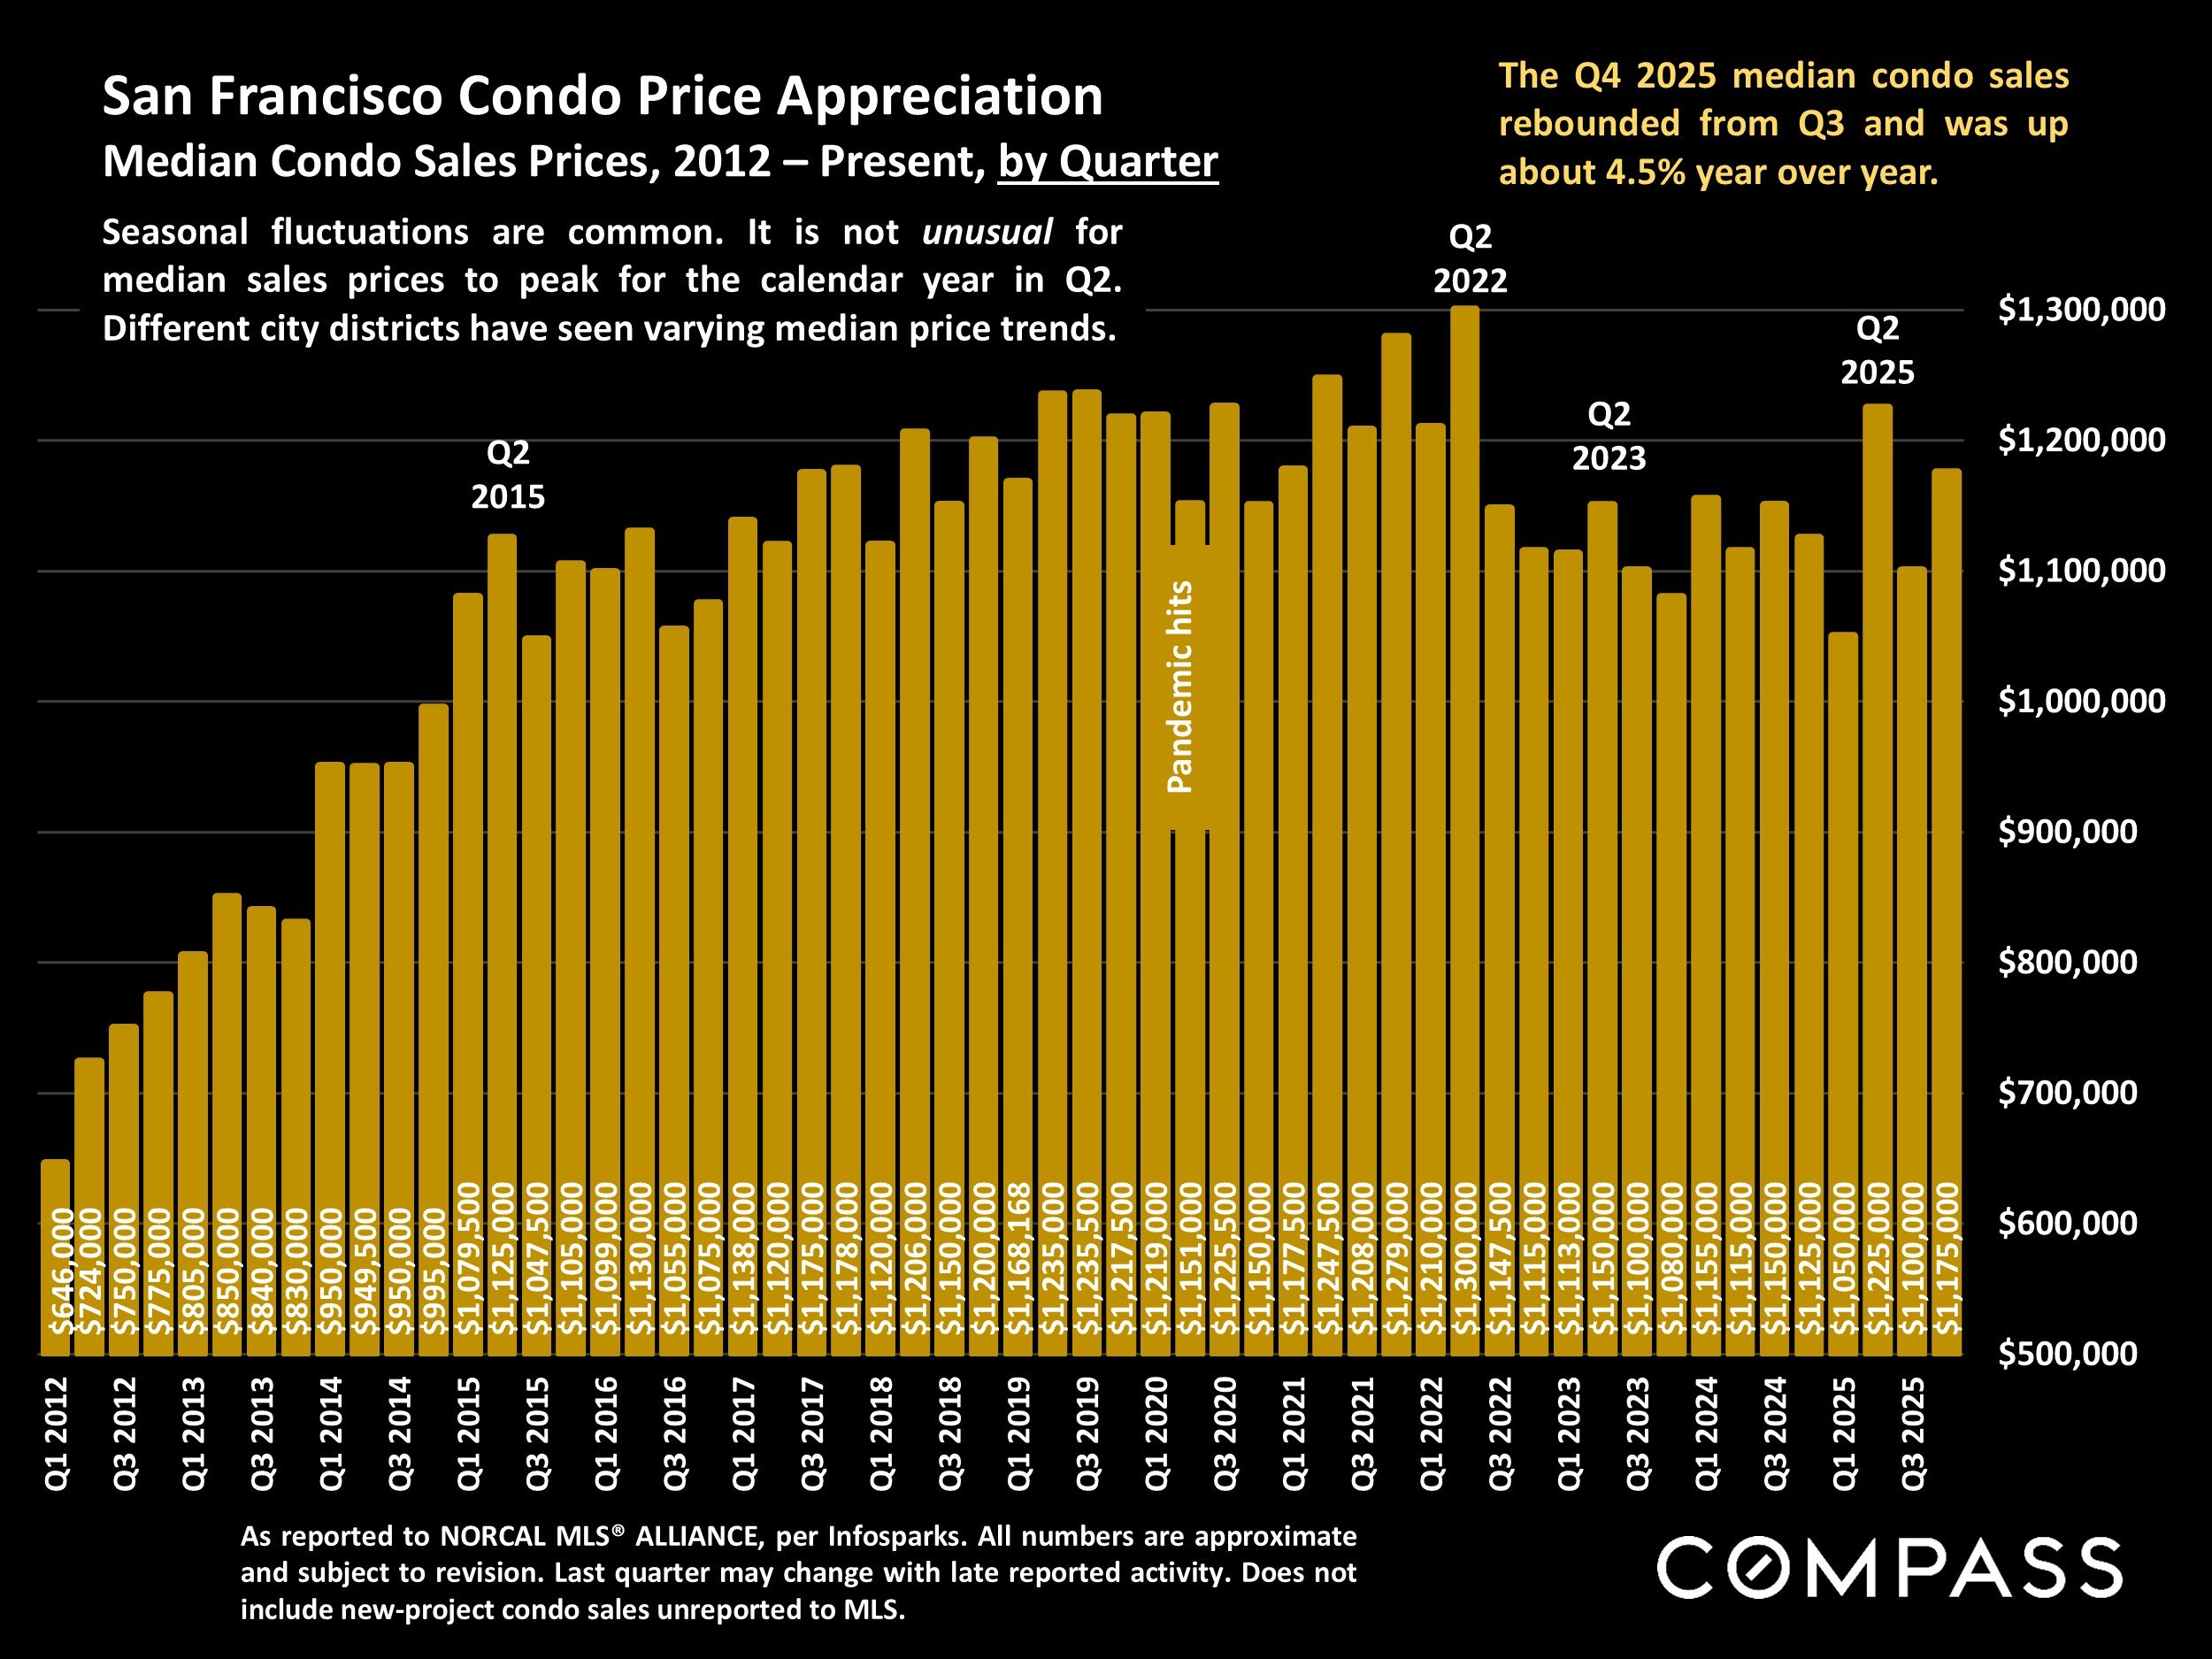
As reported to NORCAL MLS® ALLIANCE, per Infosparks. All numbers are approximate and subject to revision. Last quarter may change with late reported activity. Does not include new-project condo sales unreported to MLS.
The Q4 2025 median condo sales rebounded from Q3 and was up about 4.5% year over year.
Seasonal fluctuations are common. It is not unusual for median sales prices to peak for the calendar year in Q2. Different city districts have seen varying median price trends.
San Francisco Median Condo Prices
Median Condo Sales Price by Year, 1993 – Present*
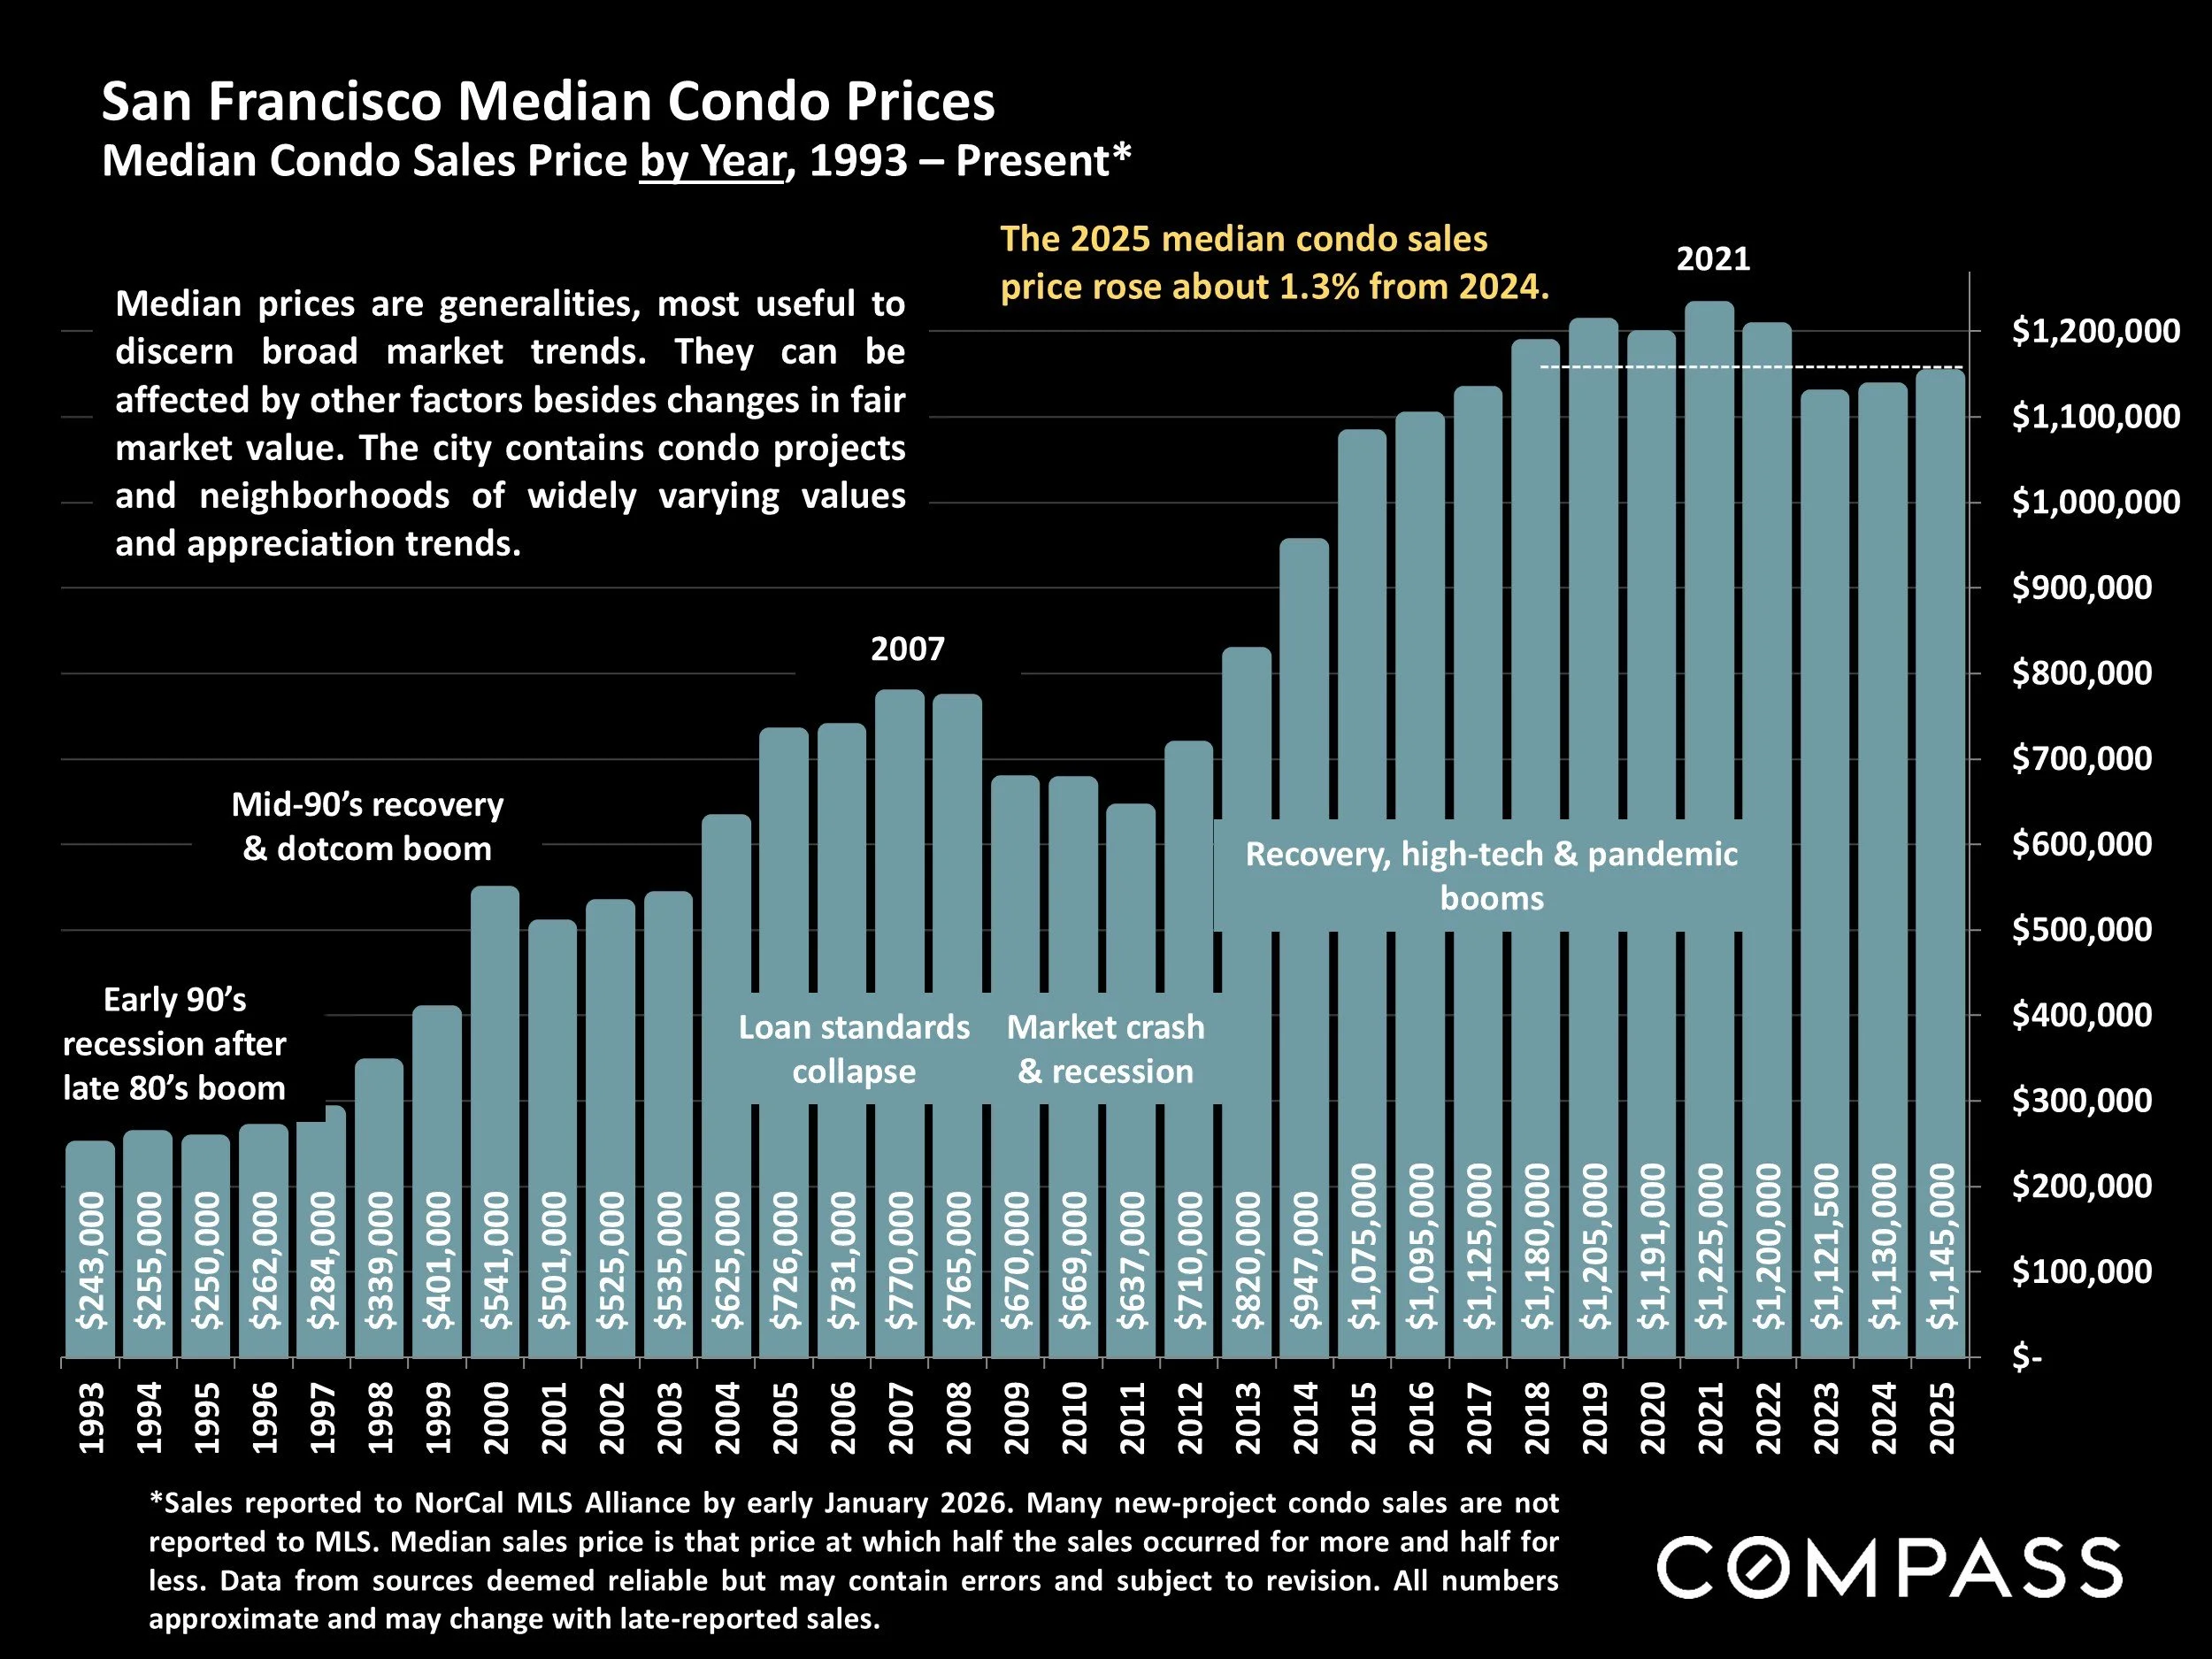
*Sales reported to NorCal MLS Alliance by early January 2026. Many new-project condo sales are notreported to MLS. Median sales price is that price at which half the sales occurred for more and half for less. Data from sources deemed reliable but may contain errors and subject to revision. All numbers approximate and may change with late-reported sales.
The 2025 median condo sales price rose about 1.3% from 2024.
Median prices are generalities, most useful to discern broad market trends. They can be affected by other factors besides changes in fair market value. The city contains condo projects and neighborhoods of widely varying values and appreciation trends.
San Francisco Year-over-Year Appreciation Rates since 1990
Y-o-Y Percentage Change in Annual Median CONDO Sales Price*
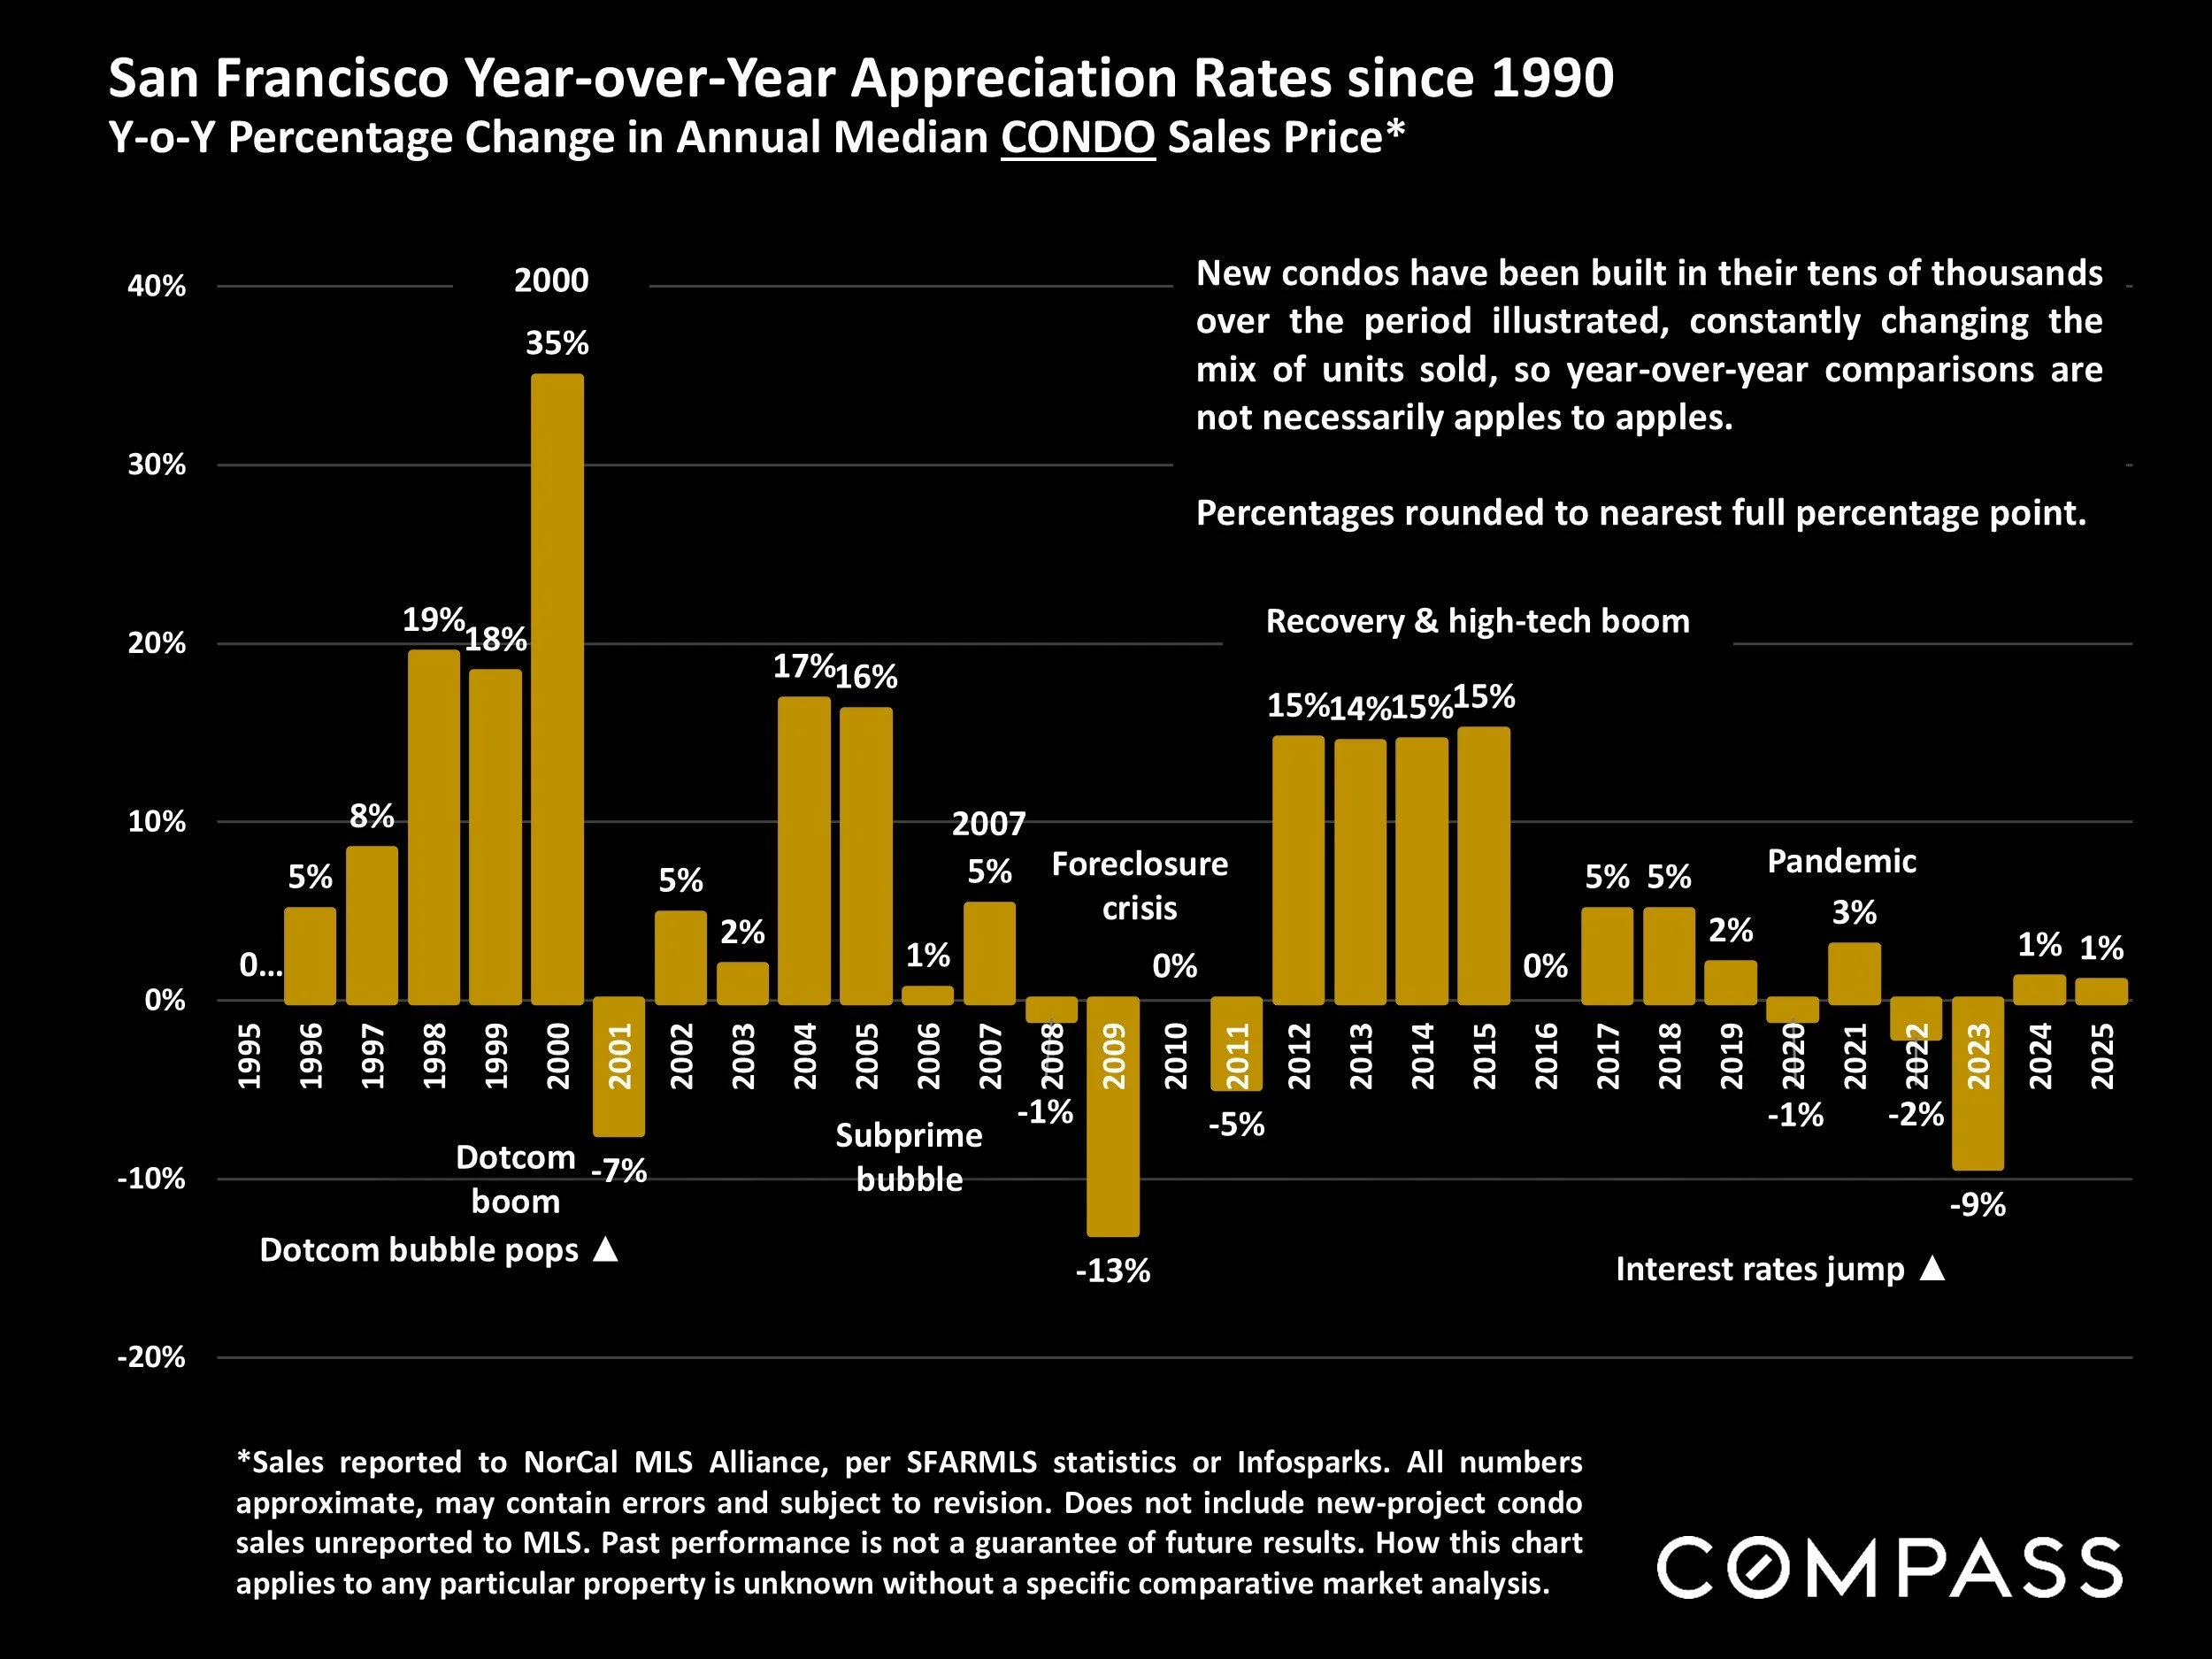
*Sales reported to NorCal MLS Alliance, per SFARMLS statistics or Infosparks. All numbers approximate, may contain errors and subject to revision. Does not include new-project condo sales unreported to MLS. Past performance is not a guarantee of future results. How this chart applies to any particular property is unknown without a specific comparative market analysis.
New condos have been built in their tens of thousands over the period illustrated, constantly changing the mix of units sold, so year-over-year comparisons are not necessarily apples to apples.
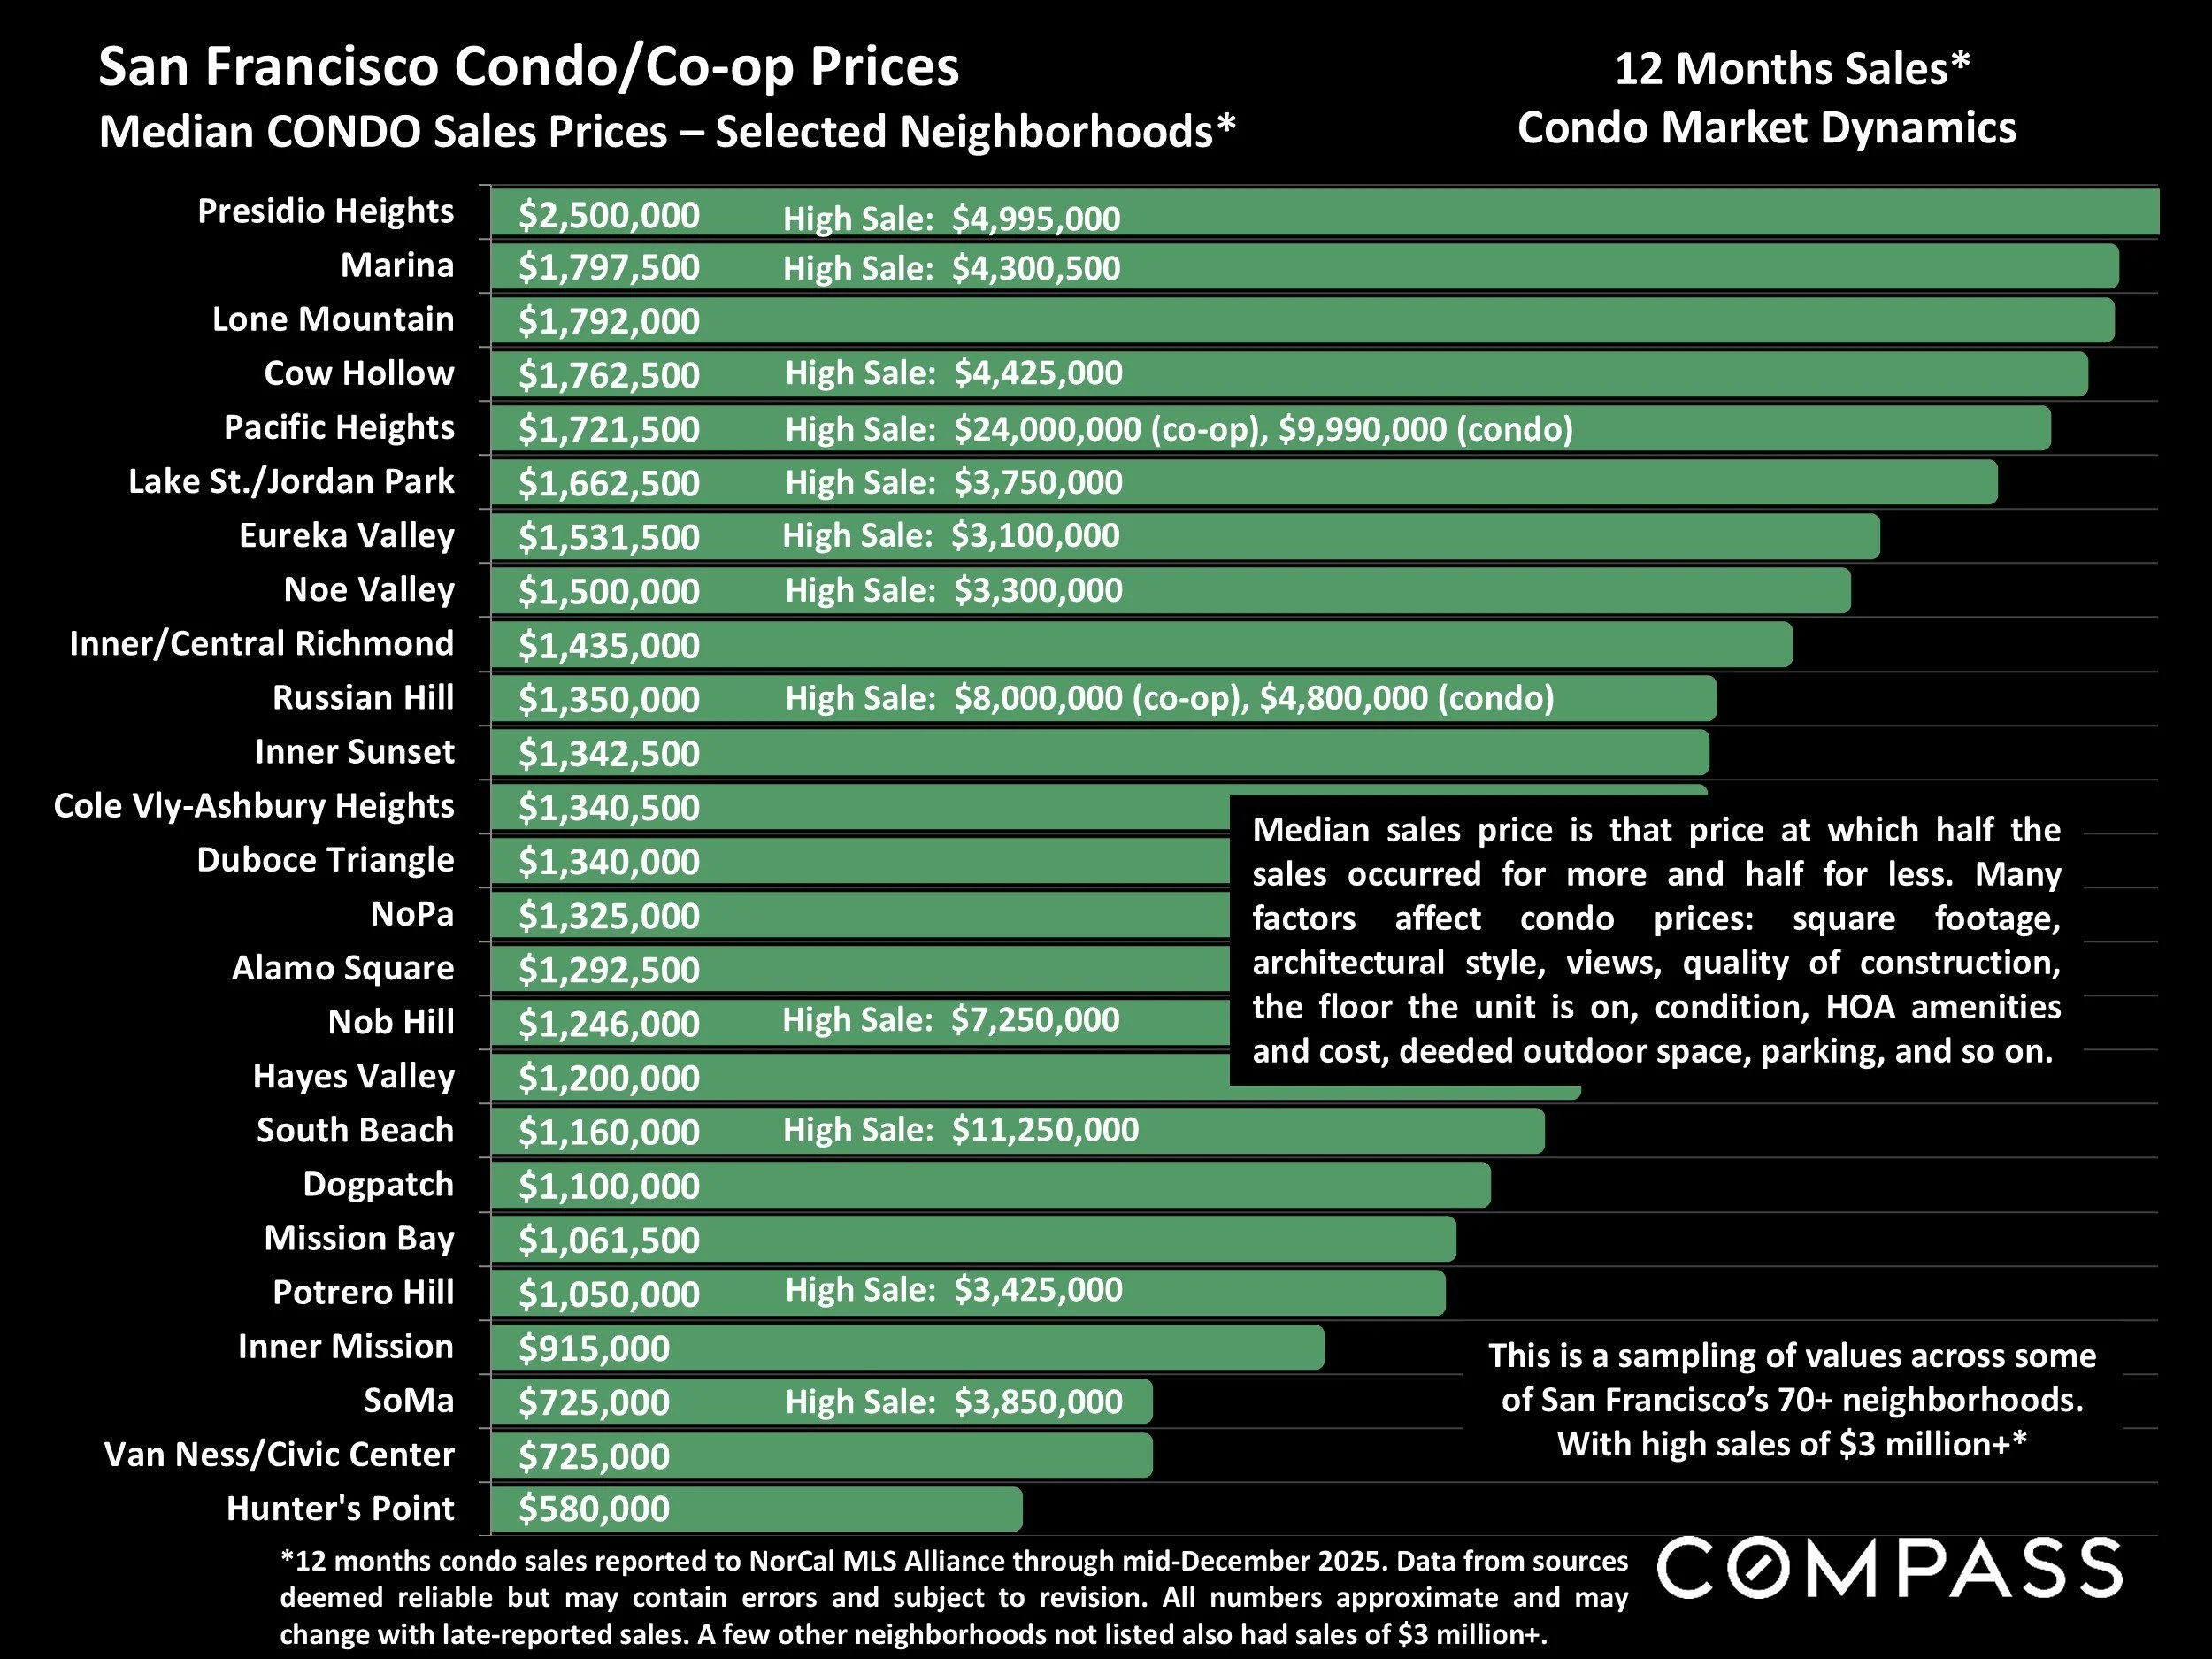
Median CONDO Sales Prices – Selected Neighborhoods*
San Francisco Condo/Co-op Prices
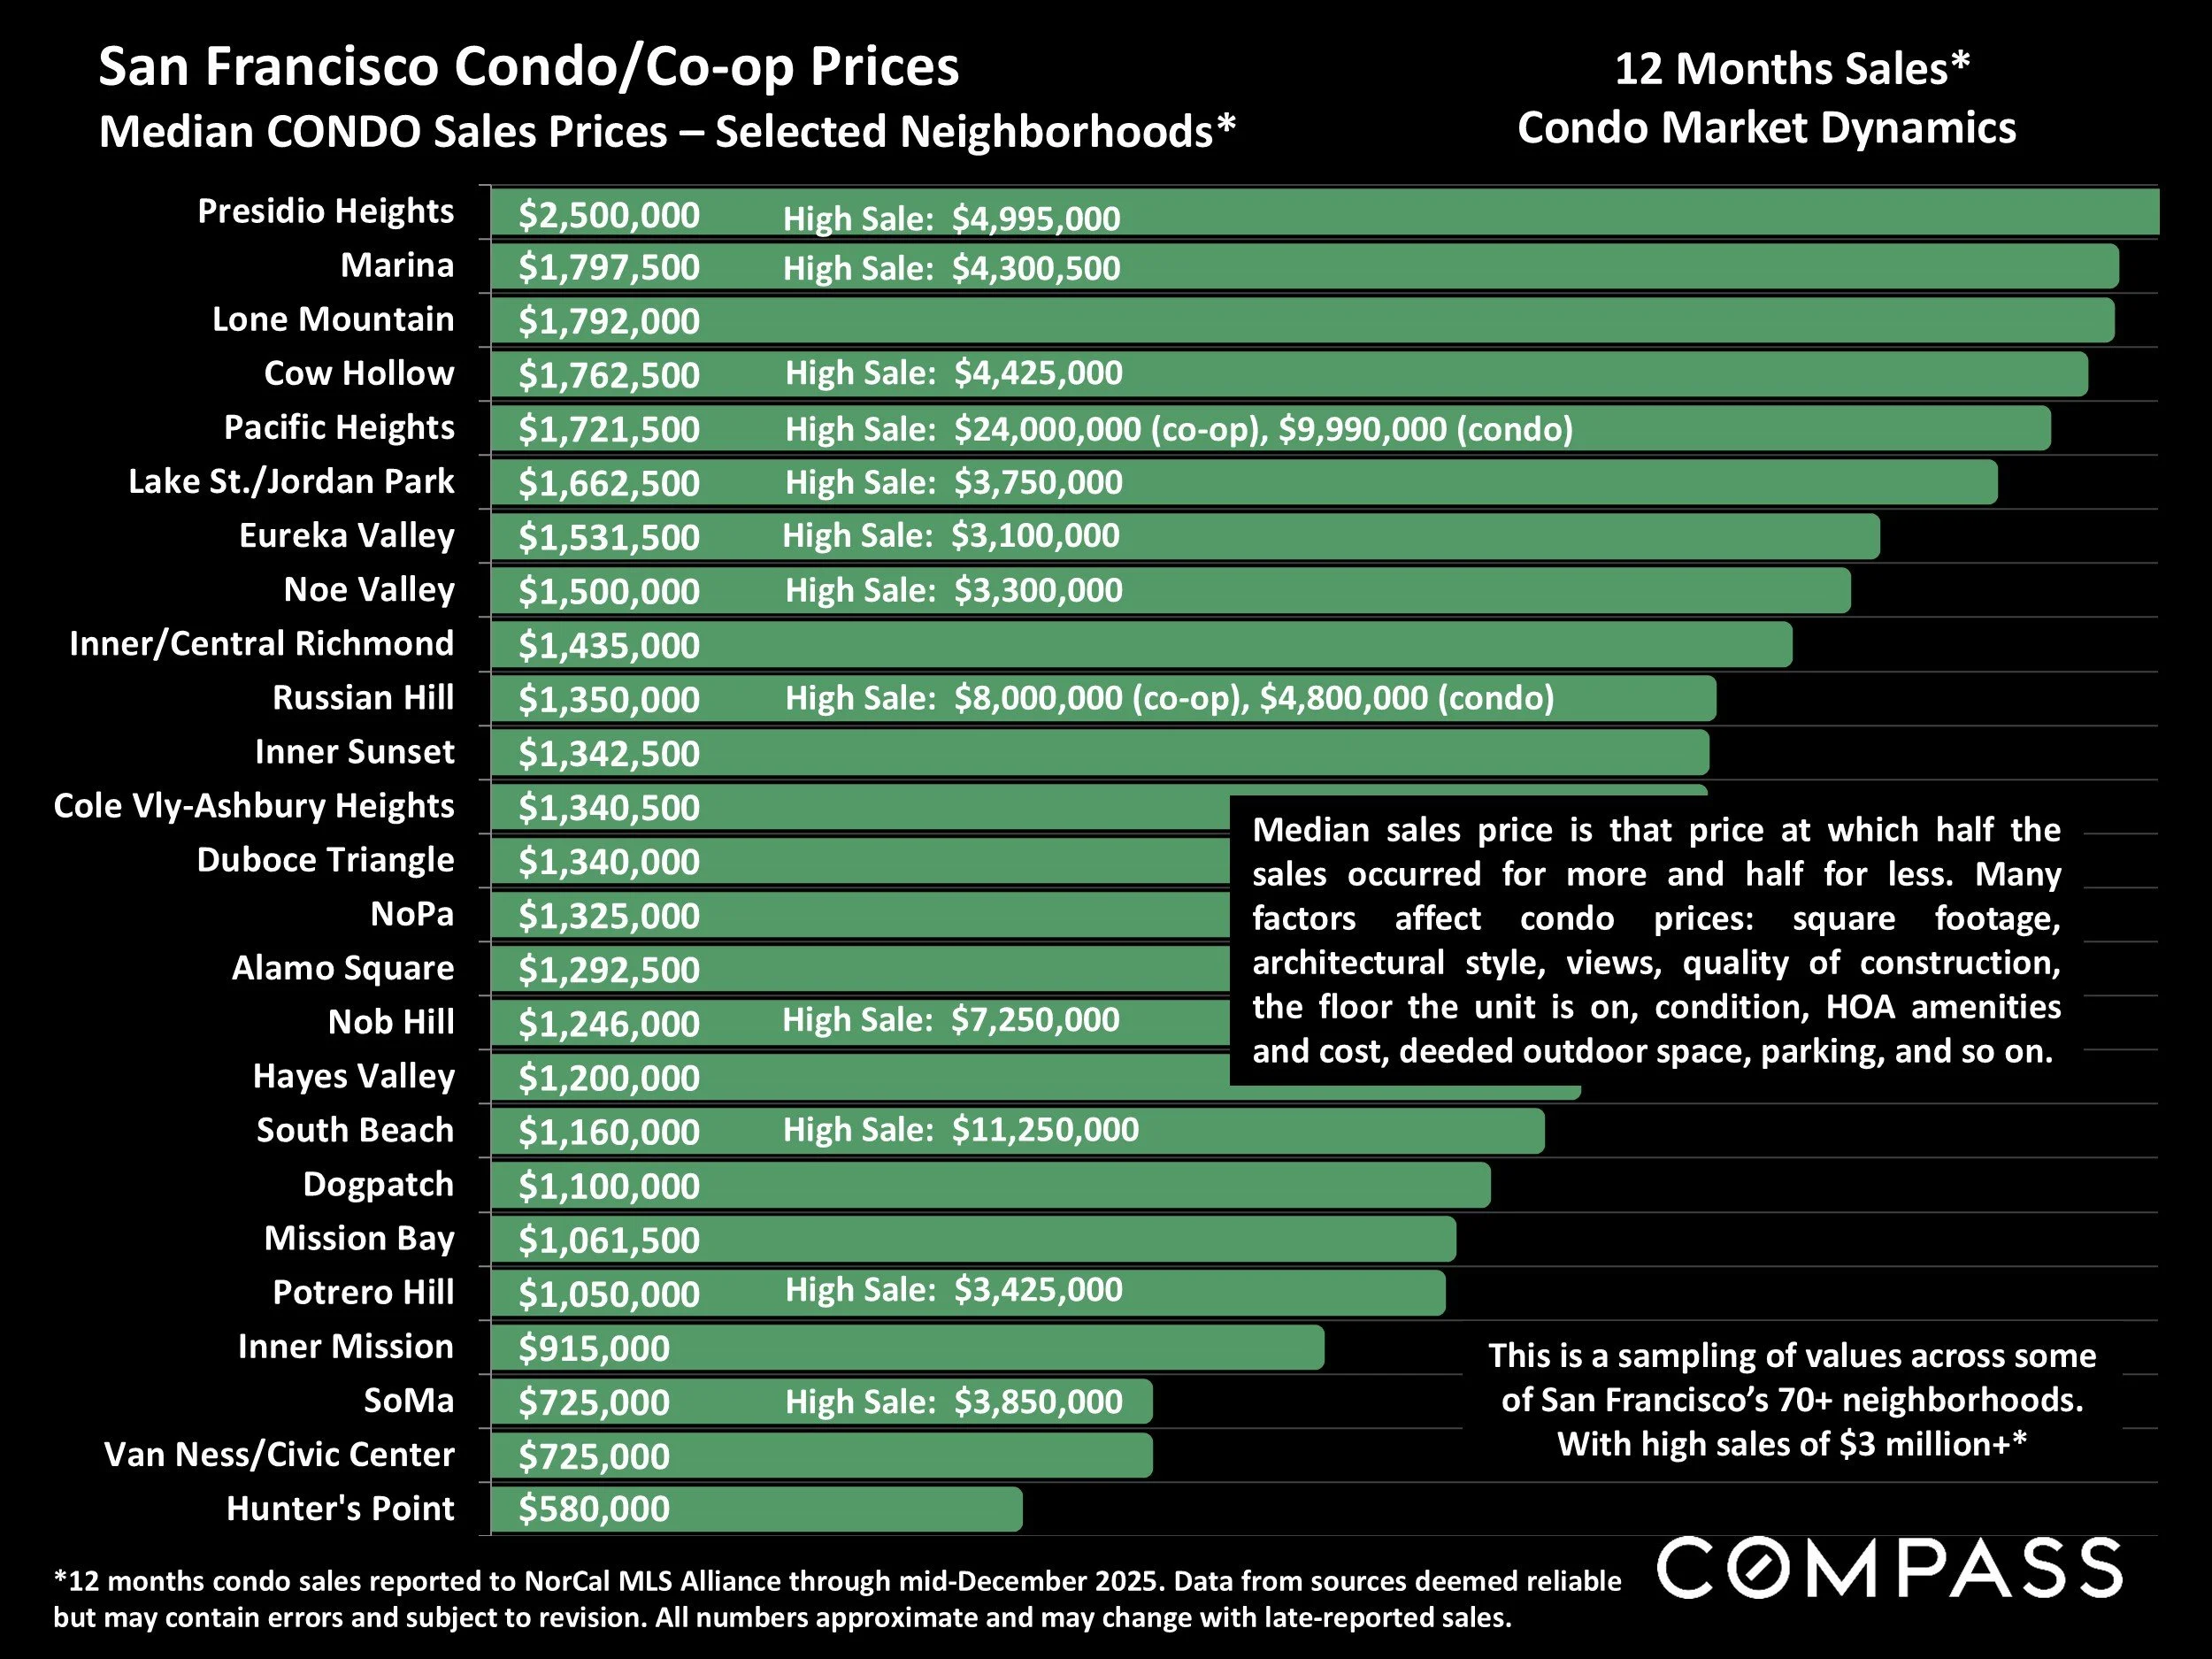
*12 months condo sales reported to NorCal MLS Alliance through mid-December 2025. Data from sources deemed reliable but may contain errors and subject to revision. All numbers approximate and may change with late-reported sales.
Median sales price is that price at which half the sales occurred for more and half for less. Many factors affect condo prices: square footage, architectural style, views, quality of construction, the floor the unit is on, condition, HOA amenities and cost, deeded outdoor space, parking, and so on.
San Francisco Median $/Sq.Ft. Values
Median Home Values by Year since 2005*
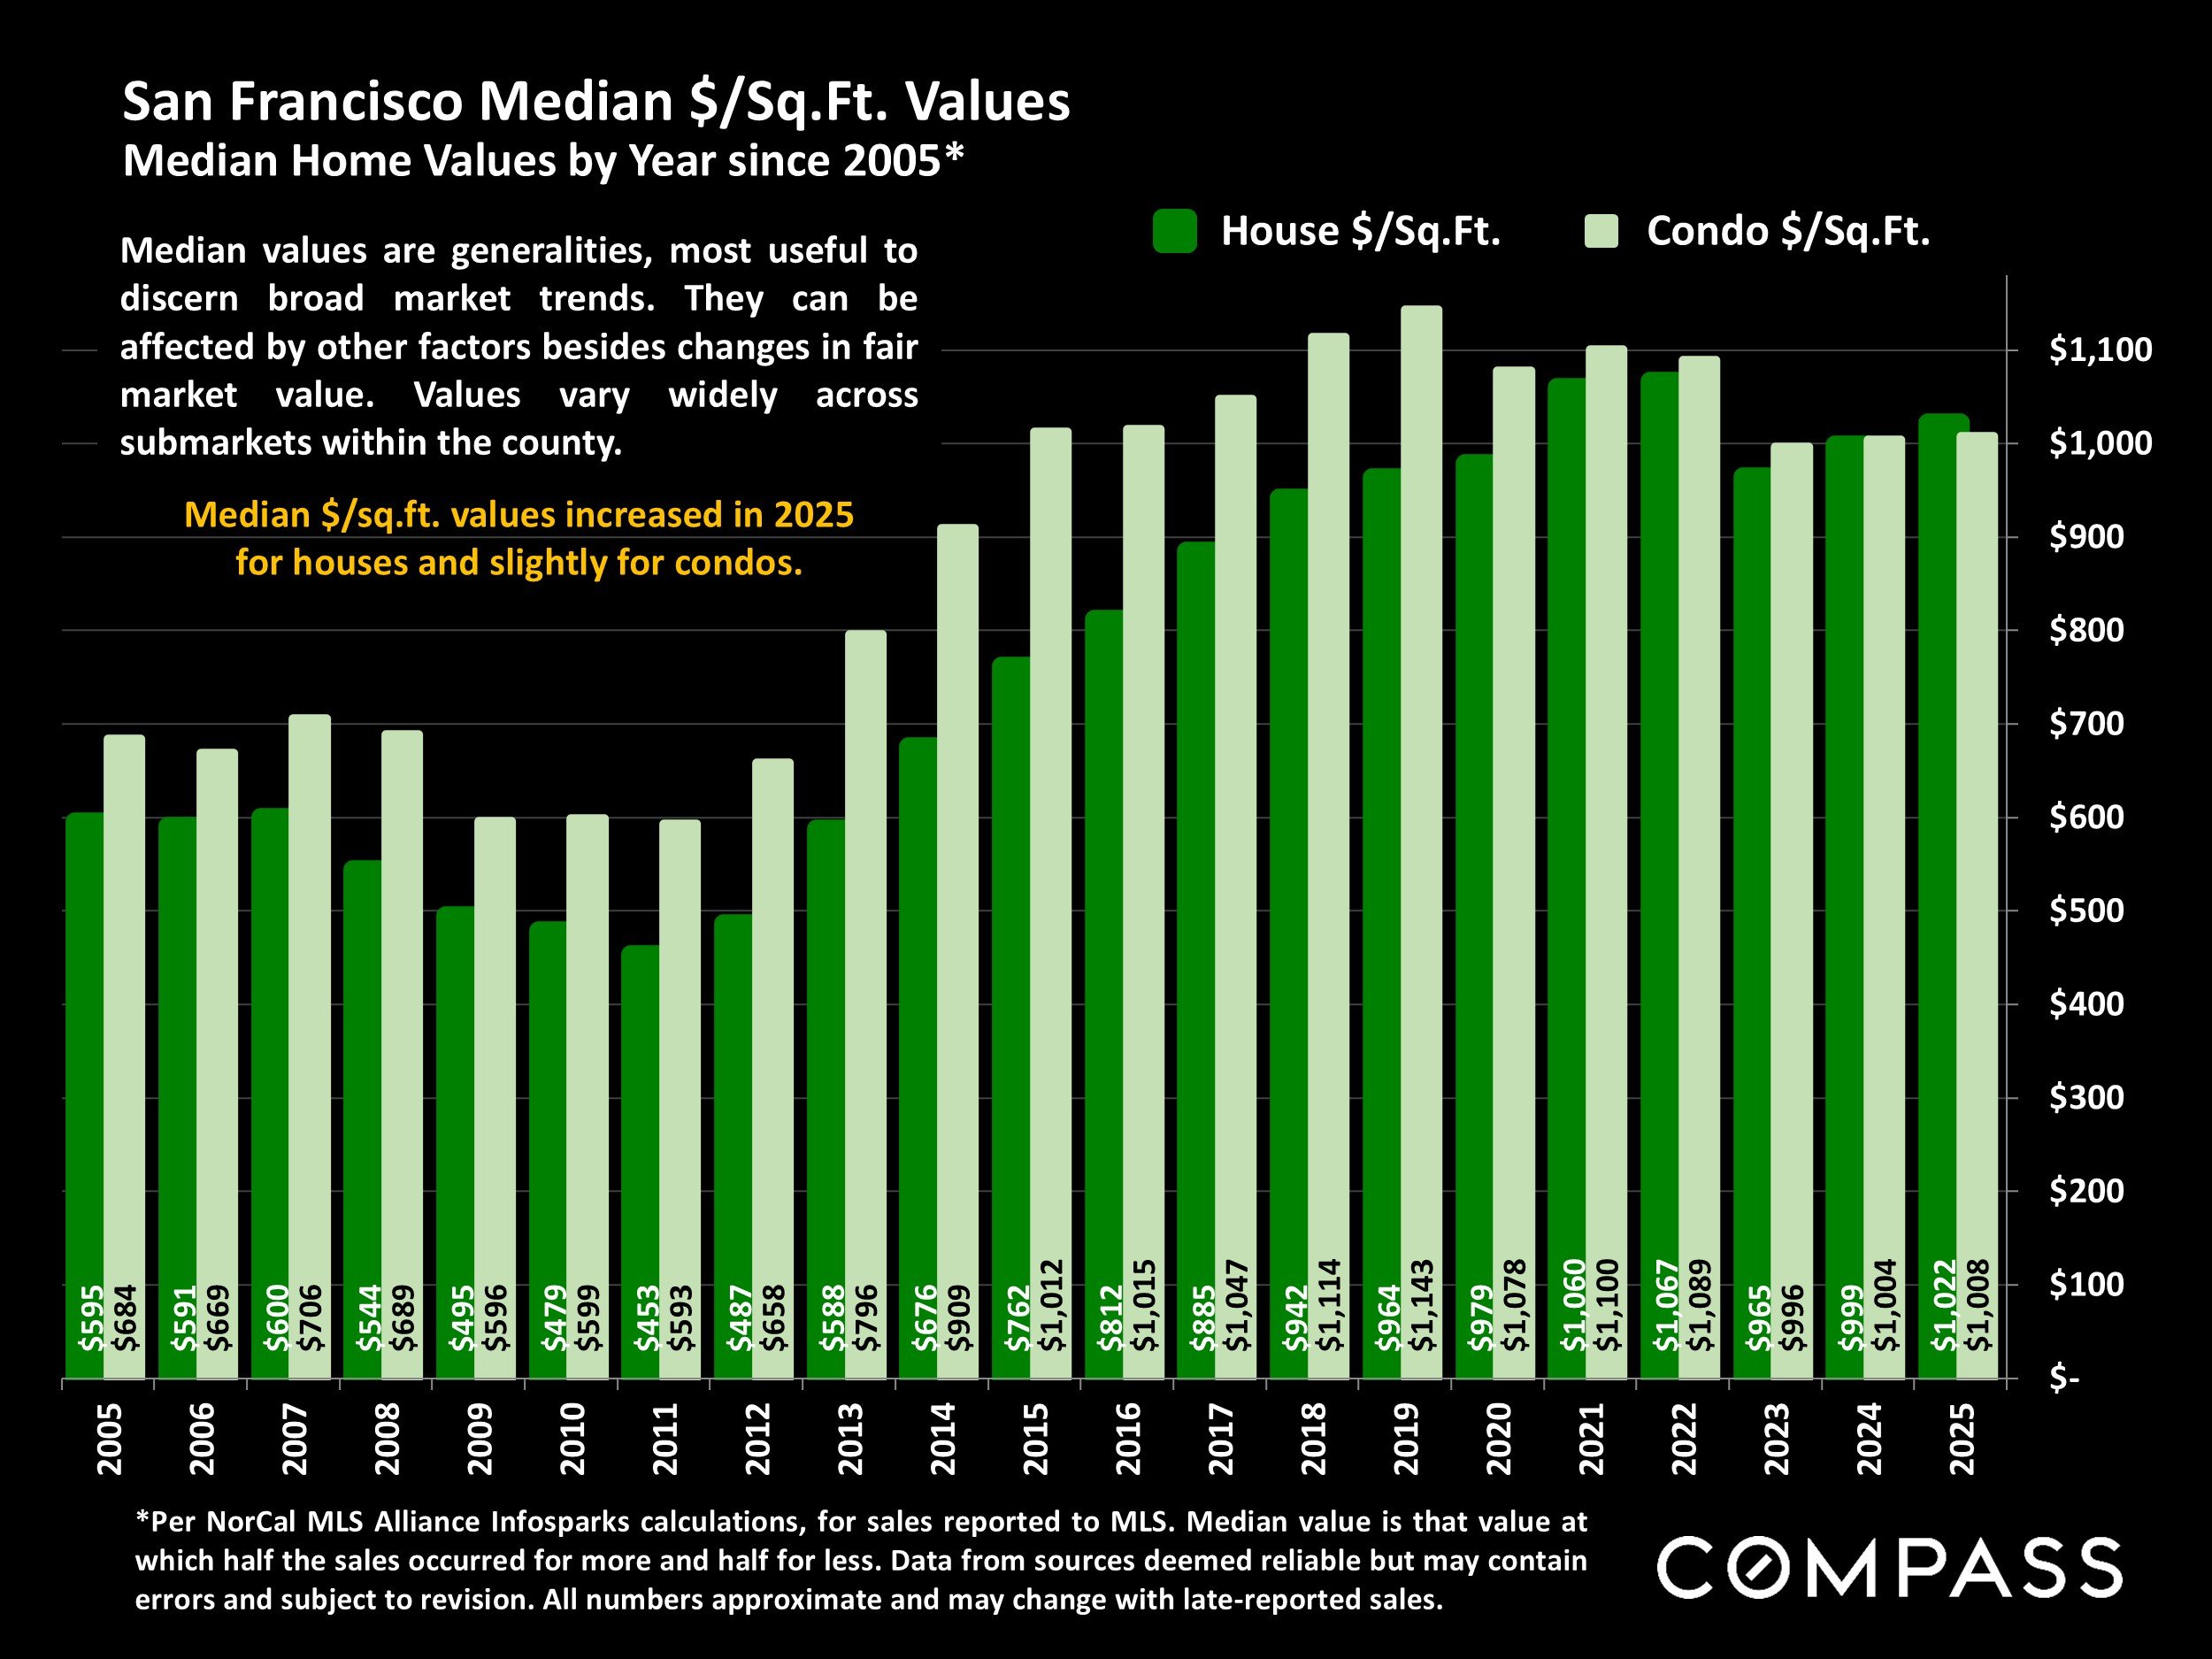
*Per NorCal MLS Alliance Infosparks calculations, for sales reported to MLS. Median value is that value at which half the sales occurred for more and half for less. Data from sources deemed reliable but may contain errors and subject to revision. All numbers approximate and may change with late-reported sales.
Median $/sq.ft. values increased in 2025 for houses and slightly for condos.
Median values are generalities, most useful to discern broad market trends. They can be affected by other factors besides changes in fair market value. Values vary widely across submarkets within the county.
Active & Coming-Soon Listings on 1st of Month*
San Francisco Homes Market
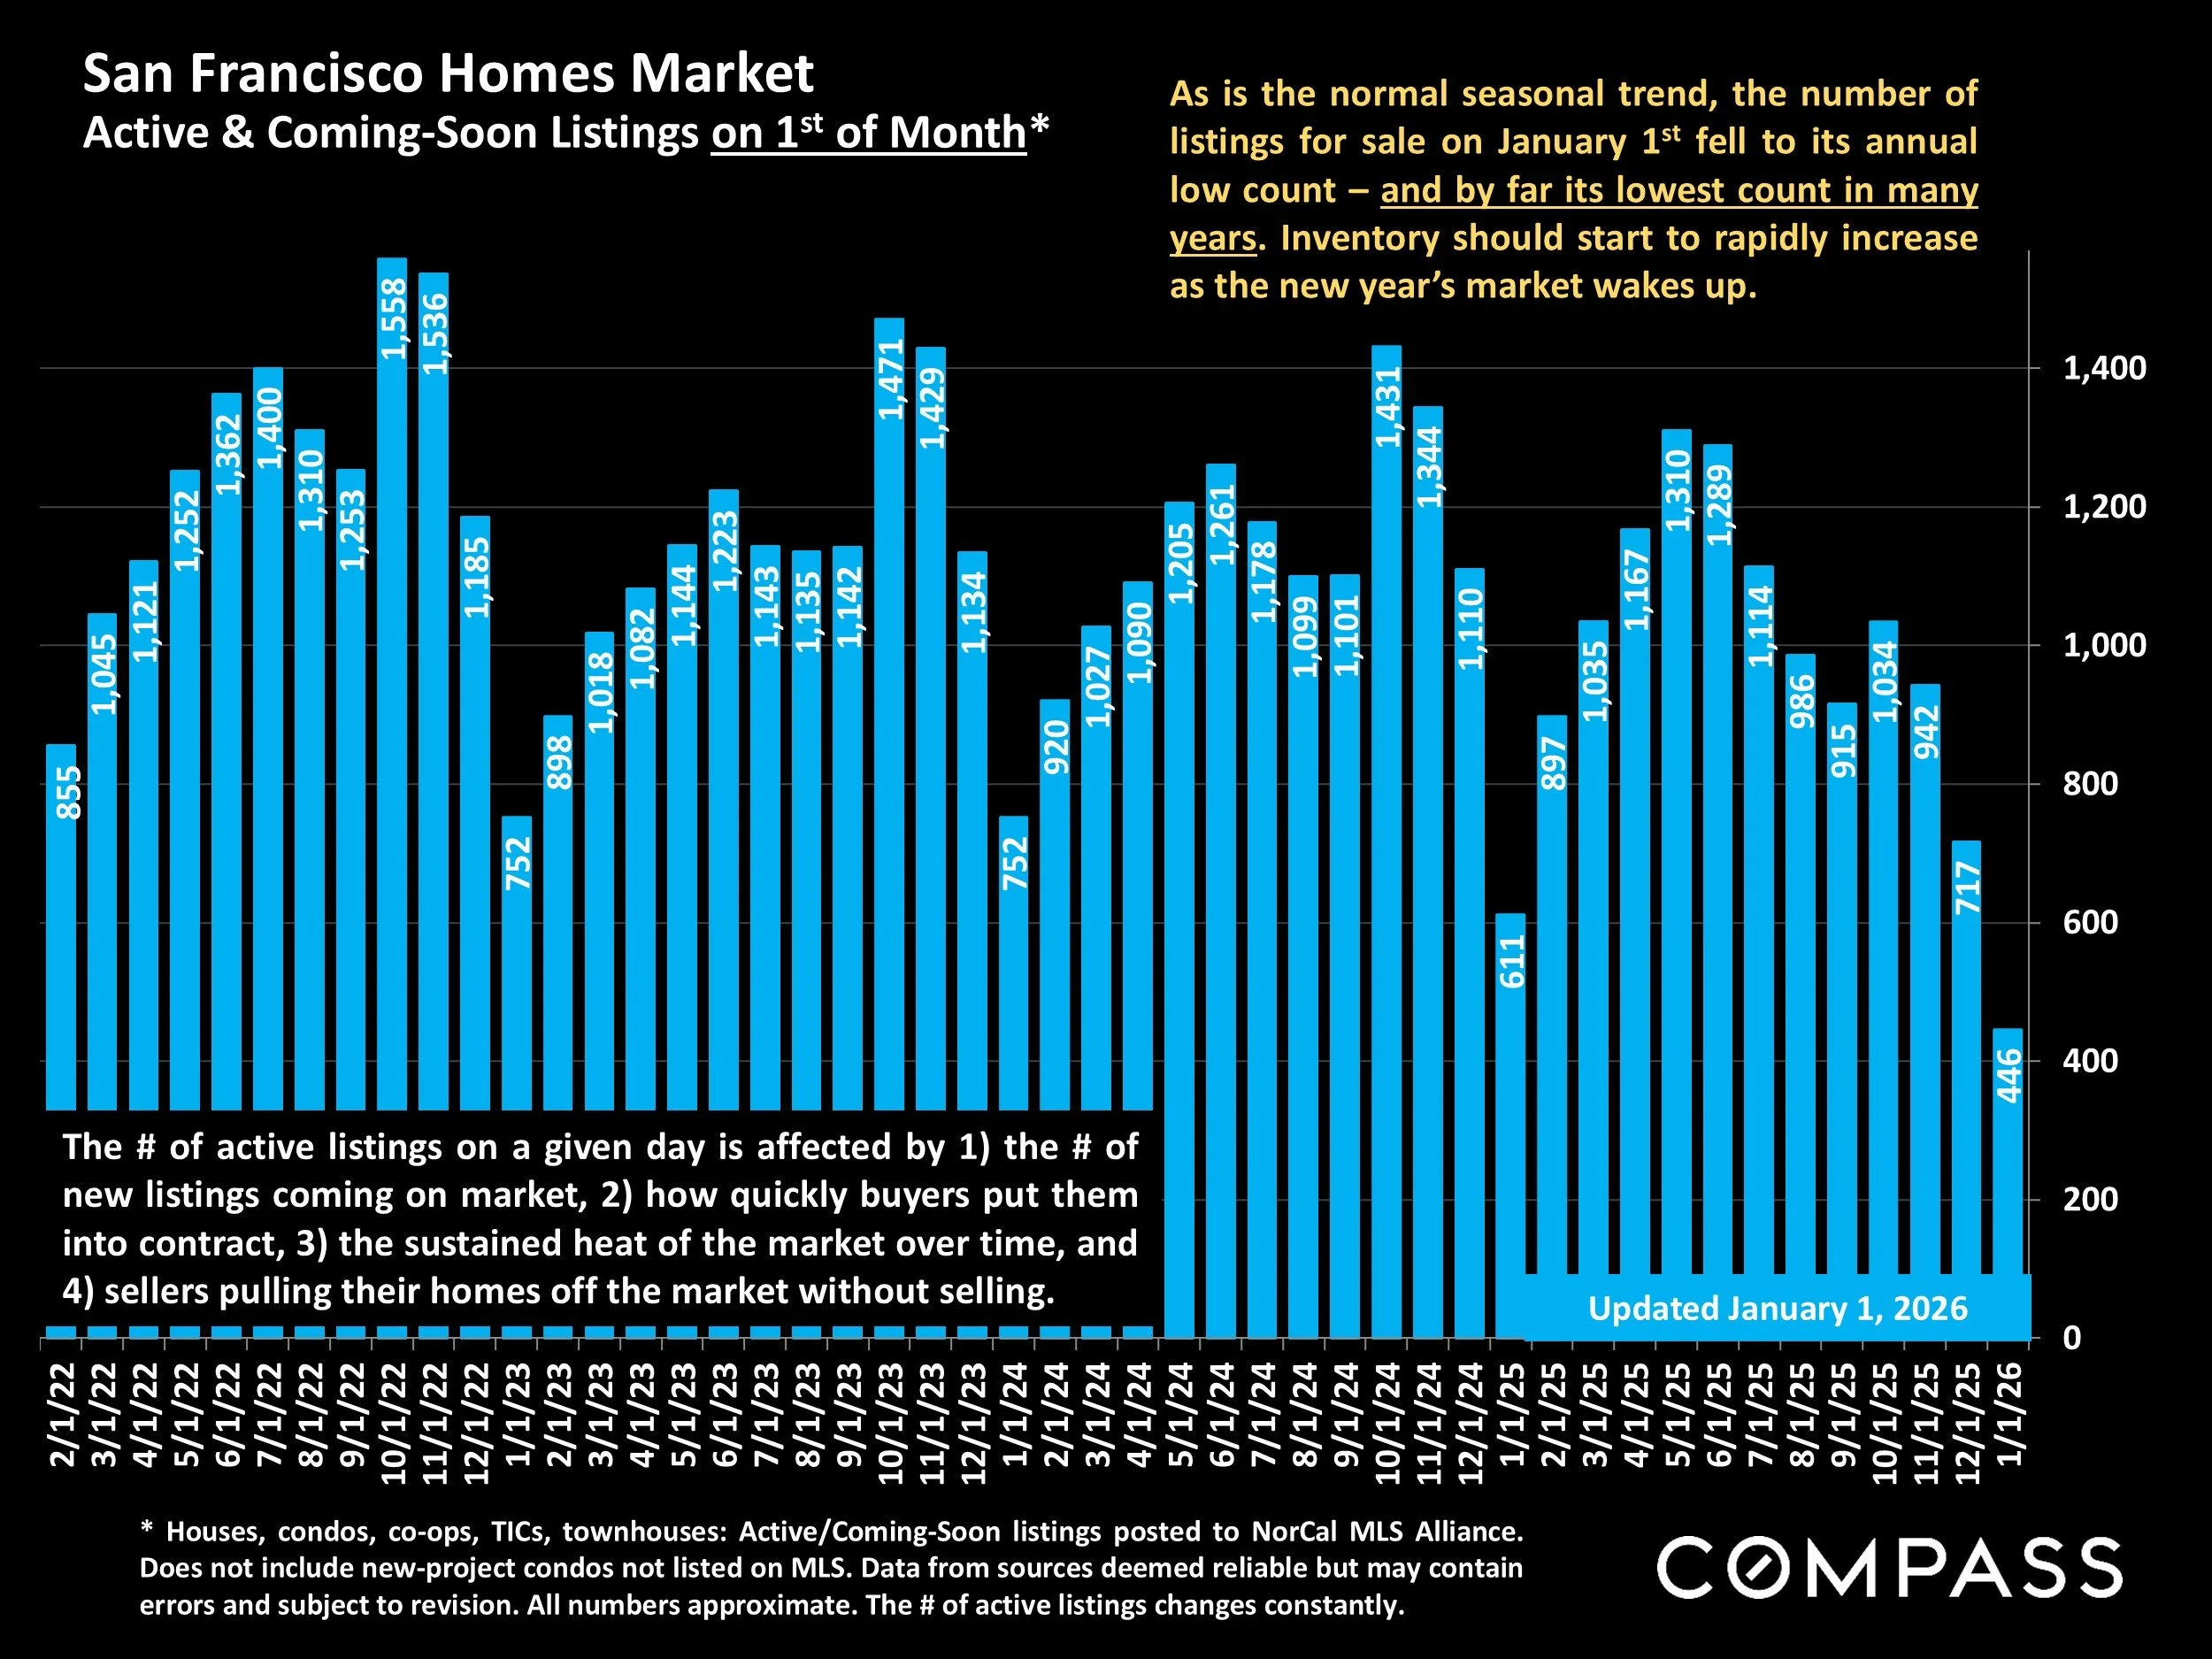
* Houses, condos, co-ops, TICs, townhouses: Active/Coming-Soon listings posted to NorCal MLS Alliance. Does not include new-project condos not listed on MLS. Data from sources deemed reliable but may contain errors and subject to revision. All numbers approximate. The # of active listings changes constantly.
As is the normal seasonal trend, the number of listings for sale on January 1st fell to its annual low count – and by far its lowest count in many years. Inventory should start to rapidly increase as the new year’s market wakes up.
The # of active listings on a given day is affected by 1) the # of new listings coming on market, 2) how quickly buyers put them into contract, 3) the sustained heat of the market over time, and 4) sellers pulling their homes off the market without selling.
San Francisco: Annual New-Listing Volume
Number of New Listings Coming on Market by Year, since 2018*
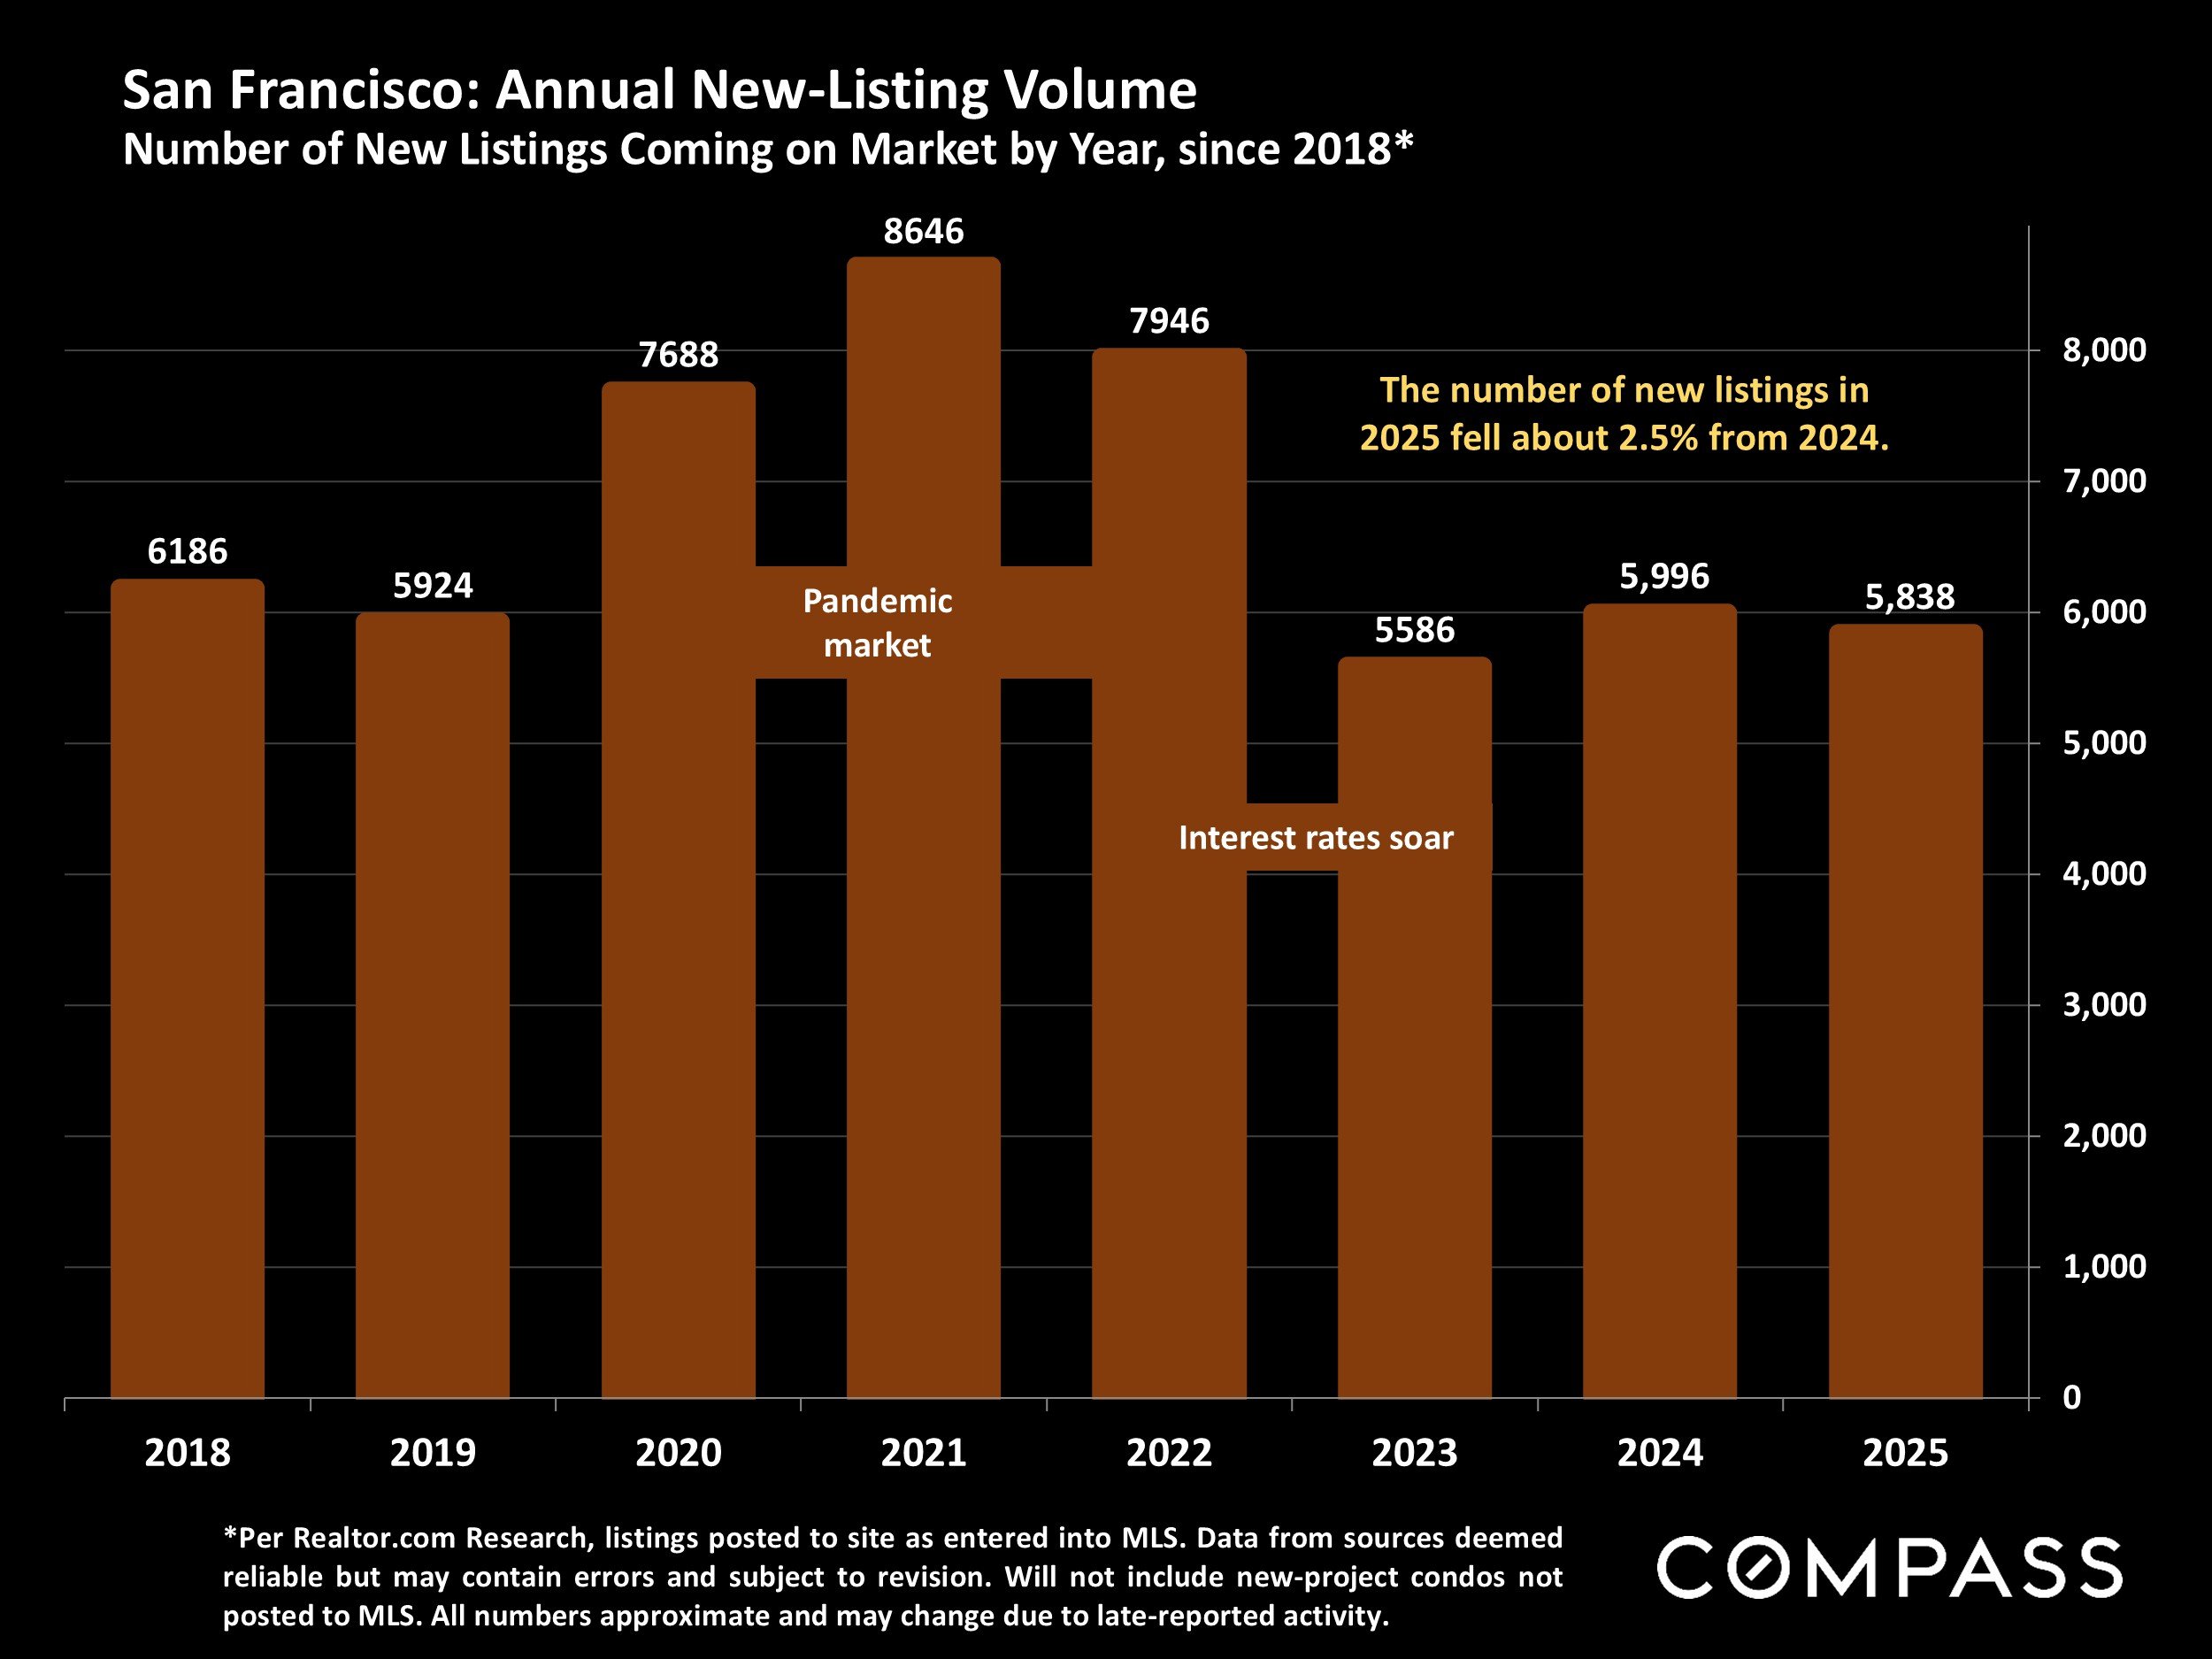
*Per Realtor.com Research, listings posted to site as entered into MLS. Data from sources deemed reliable but may contain errors and subject to revision. Will not include new-project condos not posted to MLS. All numbers approximate and may change due to late-reported activity.
The number of new listings in 2025 fell about 2.5% from 2024.
Monthly Home Sales Volume*
San Francisco Market Dynamics & Seasonality
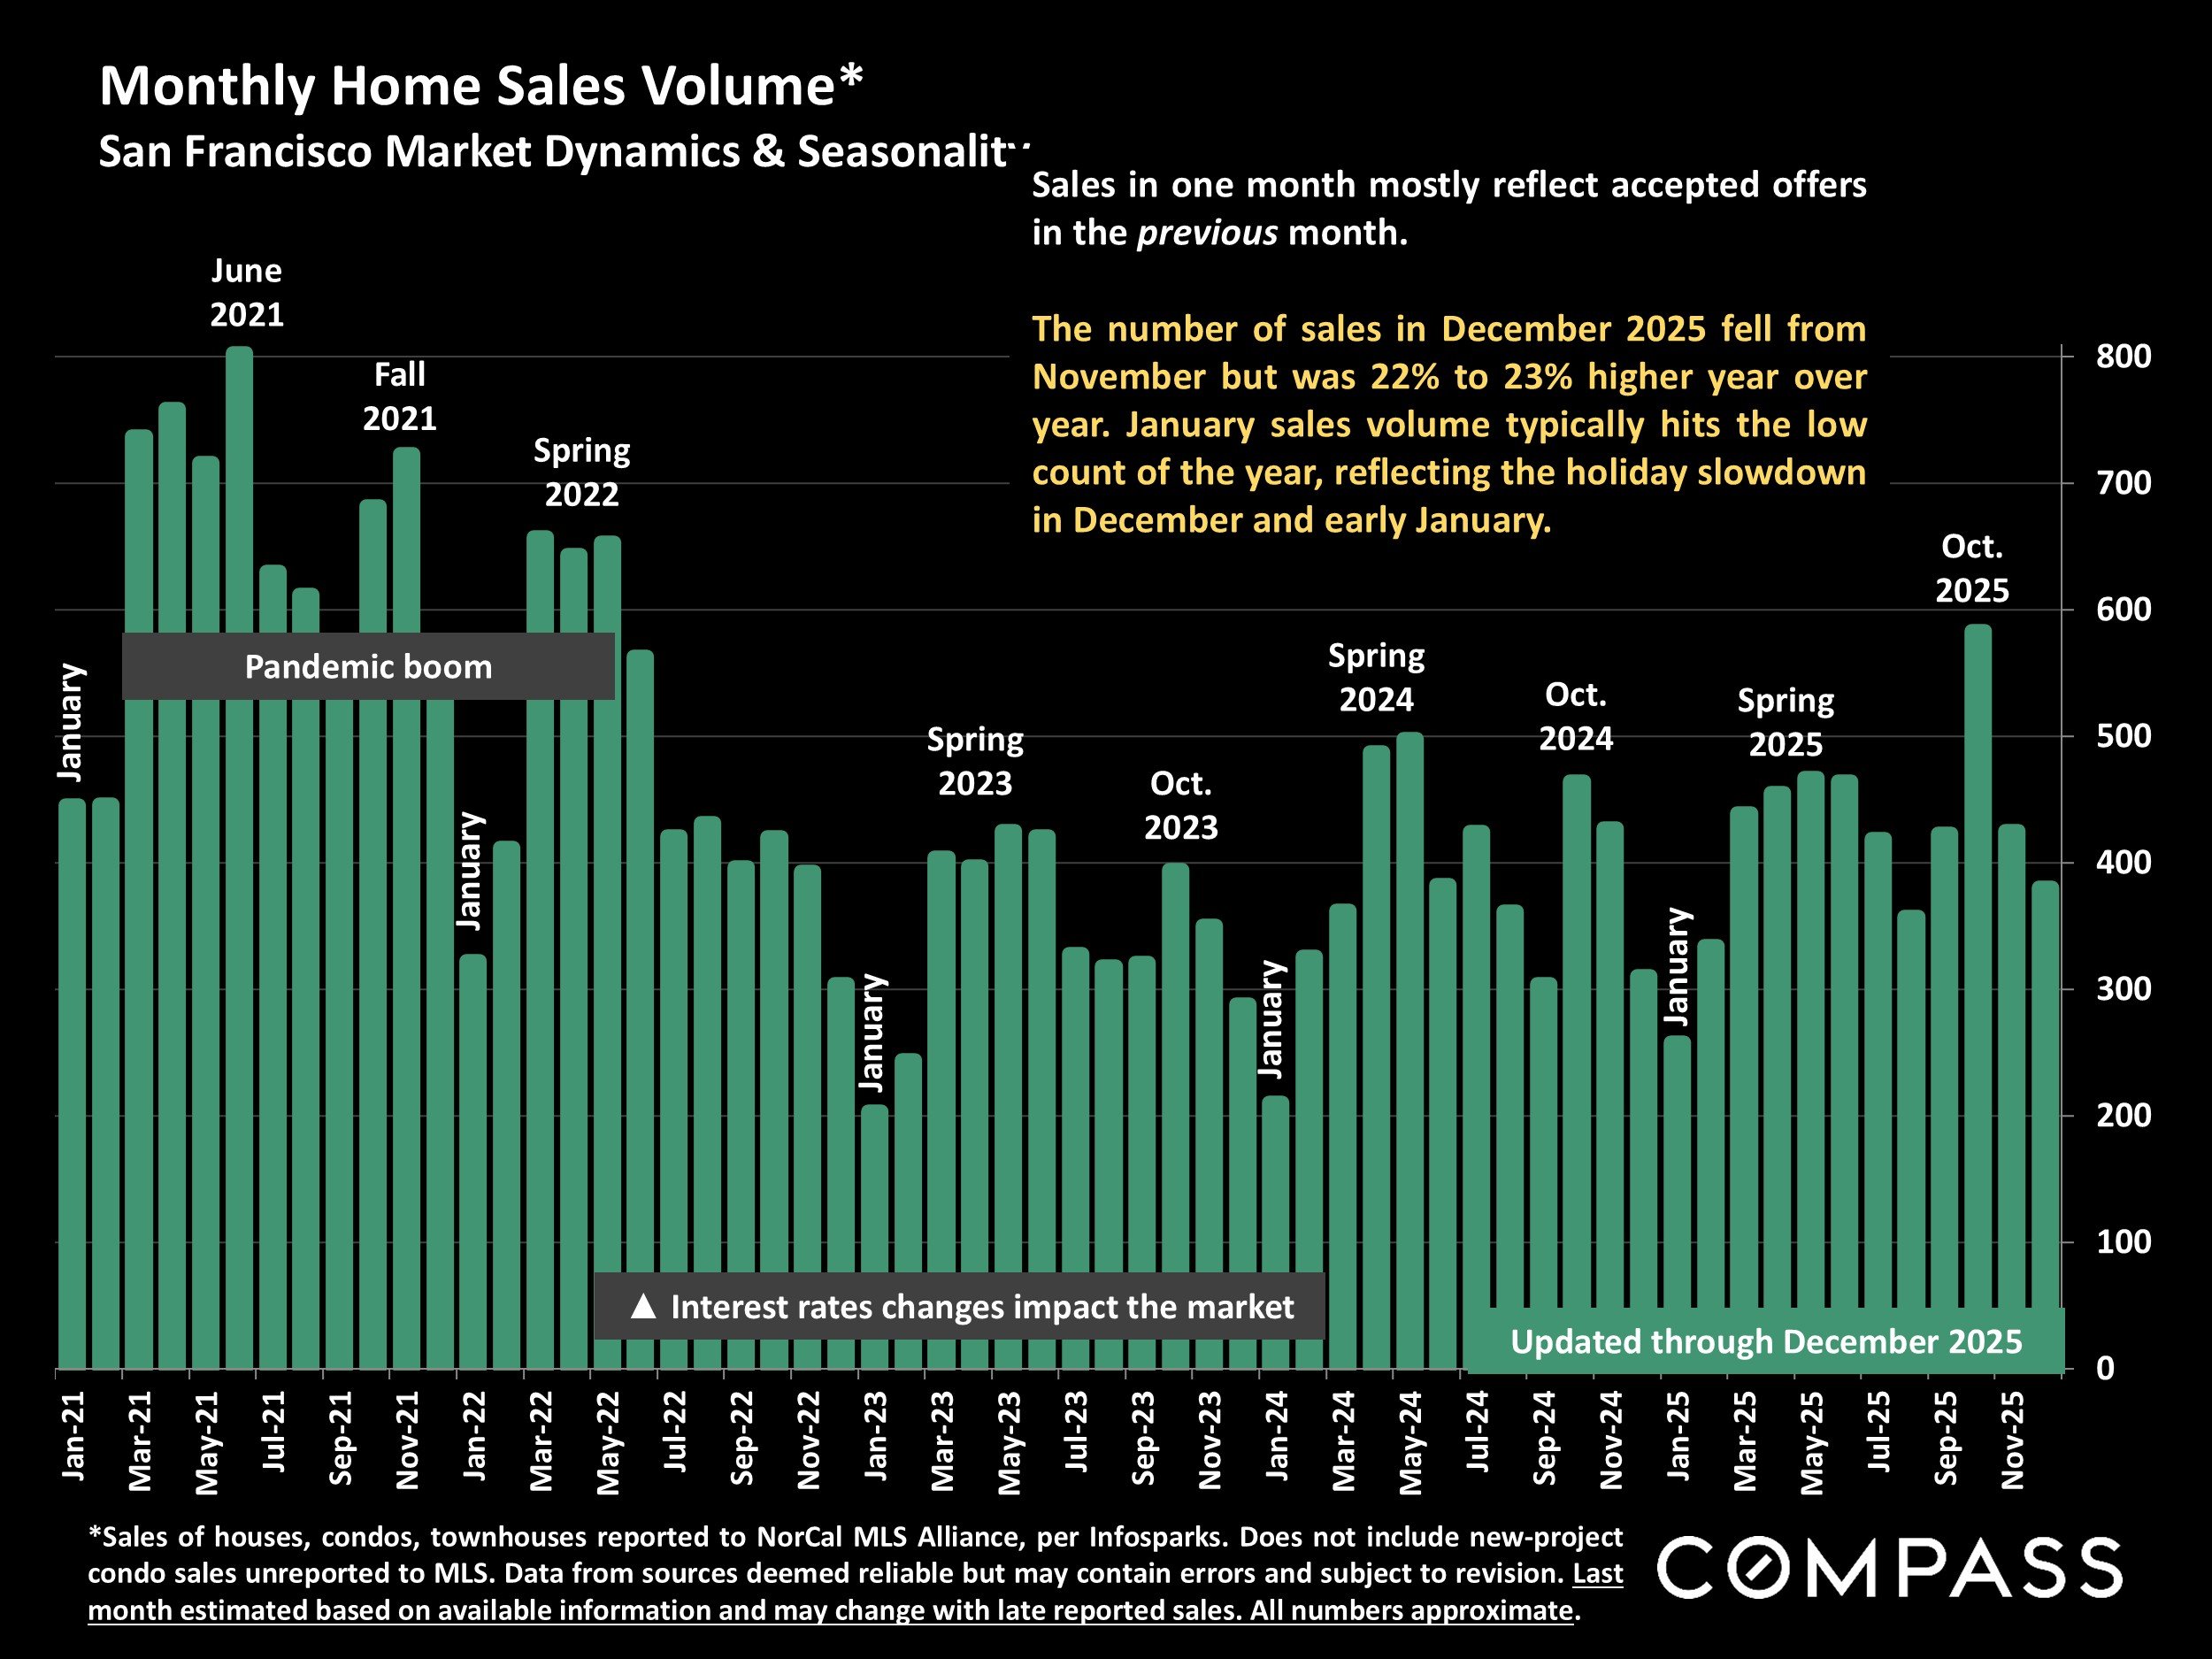
*Sales of houses, condos, townhouses reported to NorCal MLS Alliance, per Infosparks. Does not include new-project condo sales unreported to MLS. Data from sources deemed reliable but may contain errors and subject to revision. Last month estimated based on available information and may change with late reported sales. All numbers approximate.
The number of sales in December 2025 fell from November but was 22% to 23% higher year over year. January sales volume typically hits the low count of the year, reflecting the holiday slowdown in December and early January.
Sales in one month mostly reflect accepted offers in the previous month.
San Francisco Annual Sales Volume
Number of Home Sales by Year, since 2005*
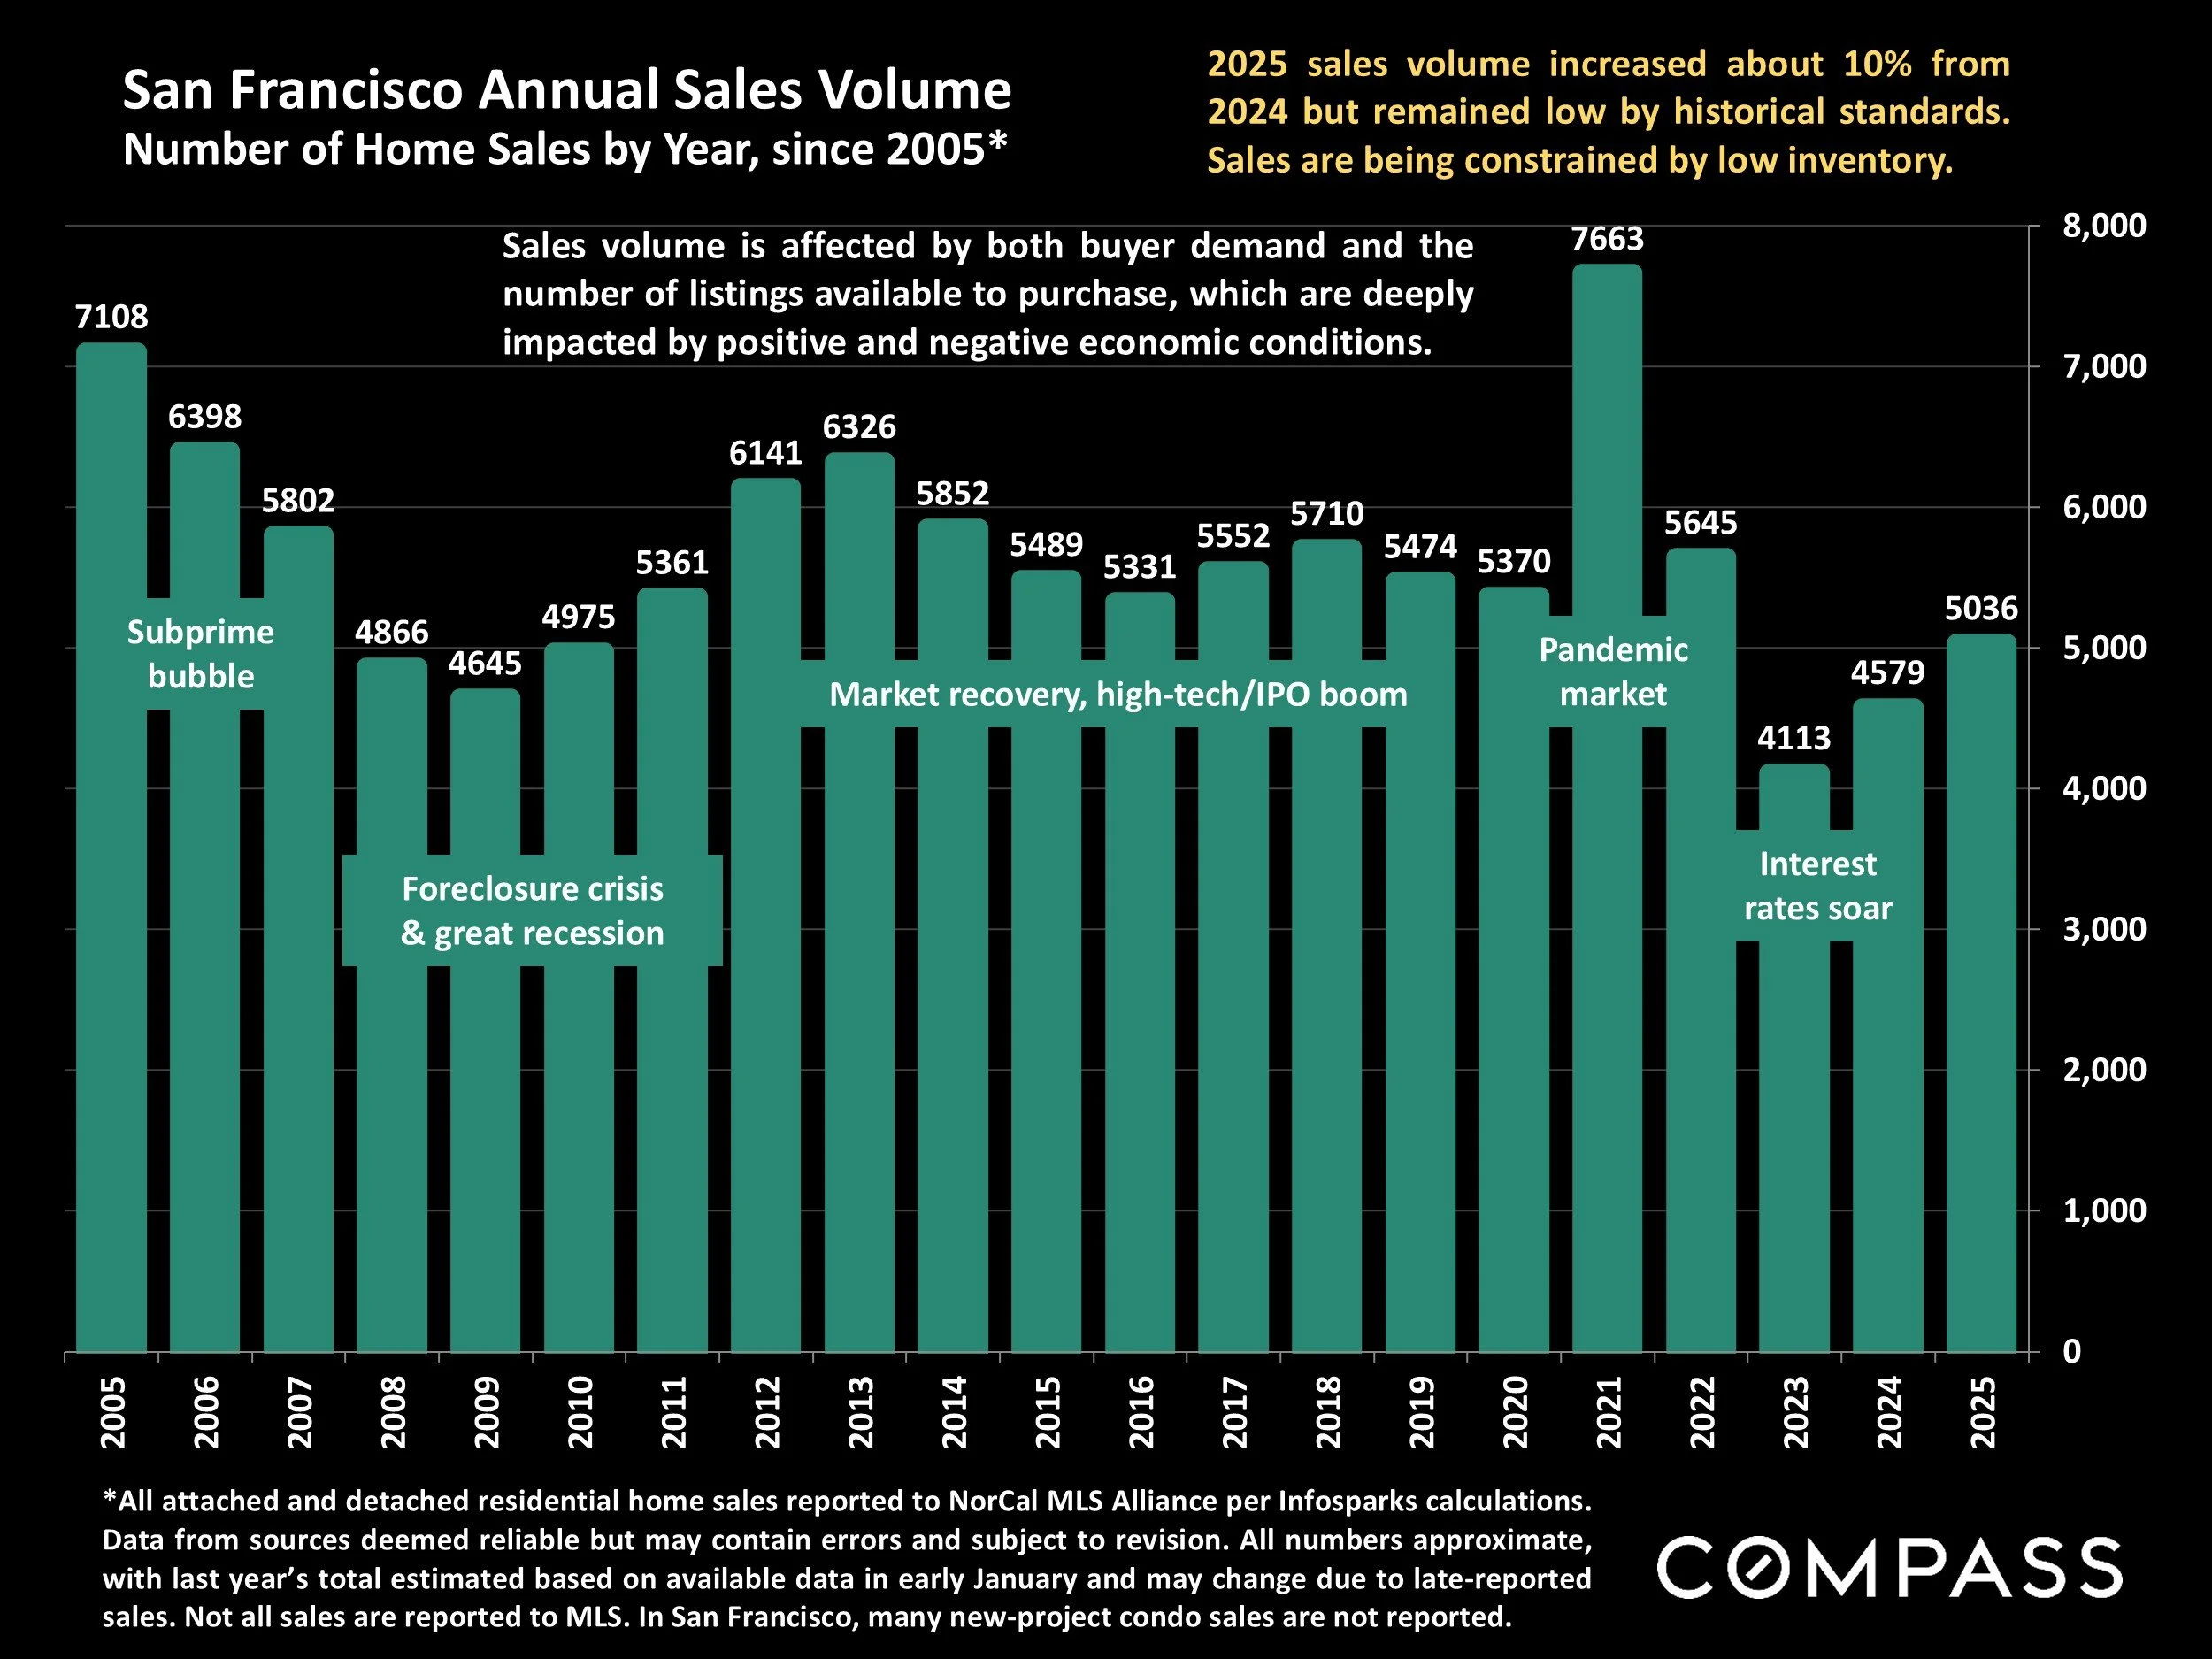
*All attached and detached residential home sales reported to NorCal MLS Alliance per Infosparks calculations.Data from sources deemed reliable but may contain errors and subject to revision. All numbers approximate, with last year’s total estimated based on available data in early January and may change due to late-reported sales. Not all sales are reported to MLS. In San Francisco, many new-project condo sales are not reported.
2025 sales volume increased about 10% from 2024 but remained low by historical standards. Sales are being constrained by low inventory.
Sales volume is affected by both buyer demand and the number of listings available to purchase, which are deeply impacted by positive and negative economic conditions.
San Francisco Annual Sales - $5,000,000+
Number of Luxury Home Sales by Year, since 2005*
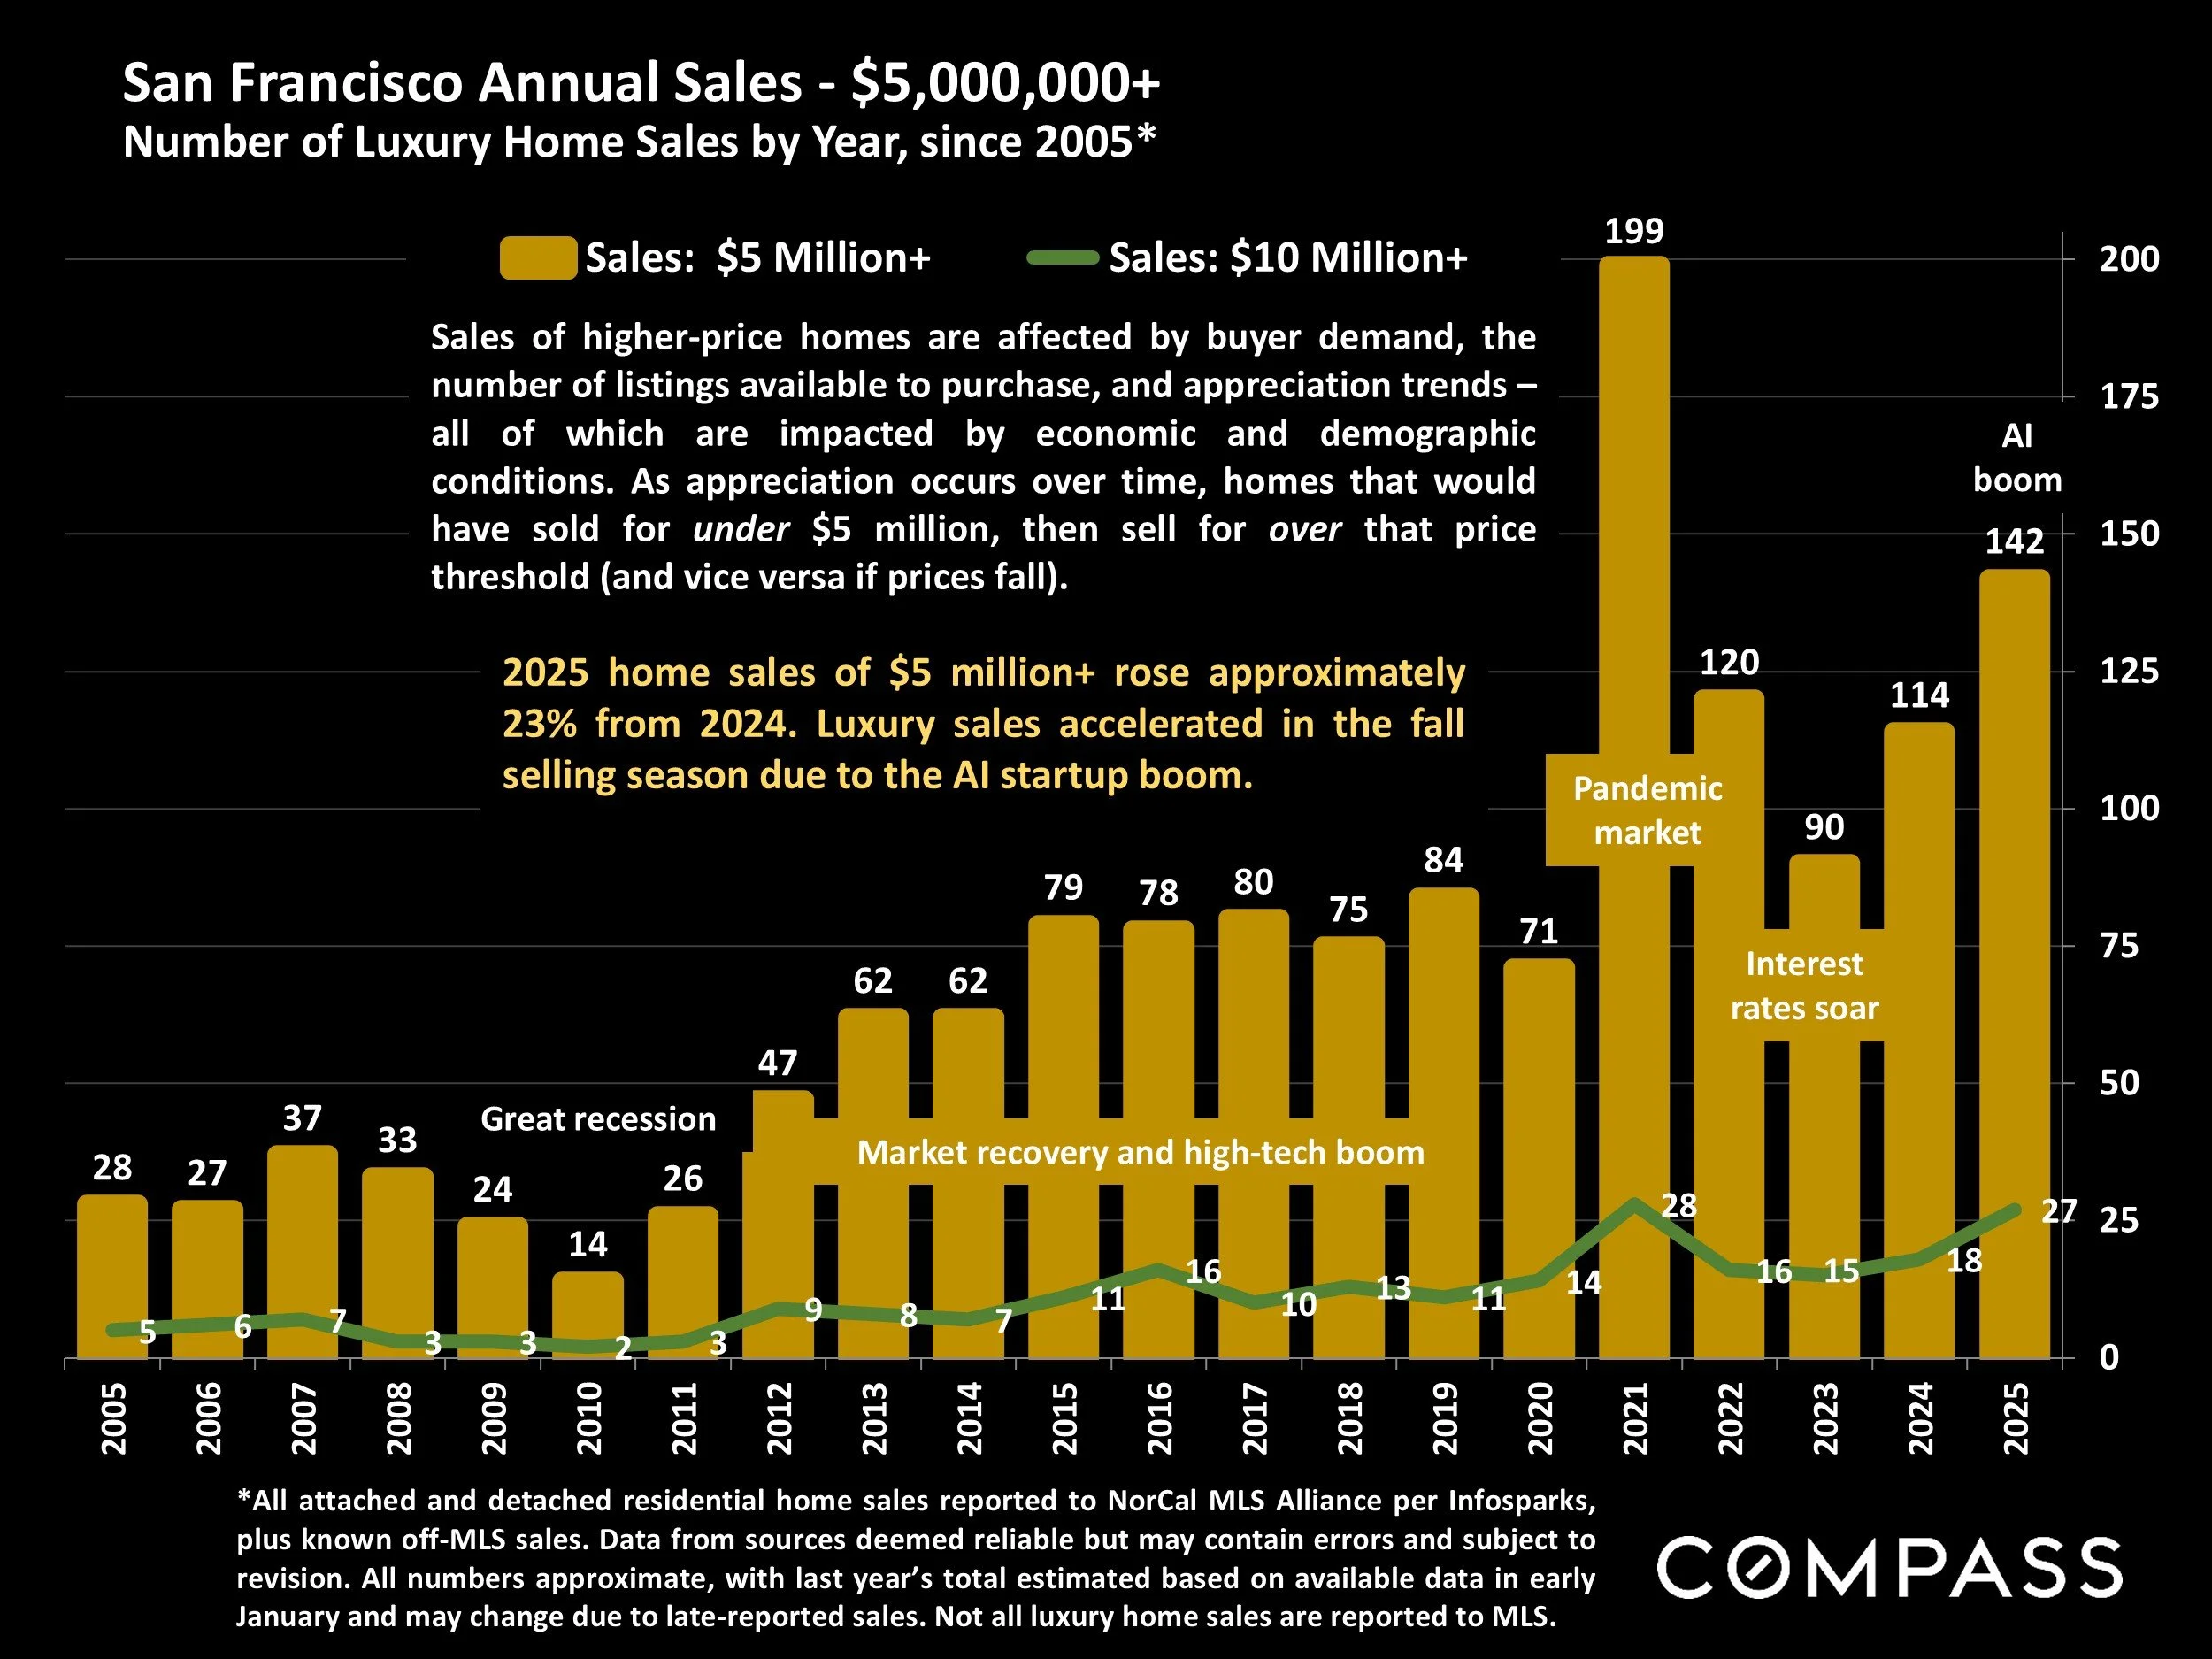
*All attached and detached residential home sales reported to NorCal MLS Alliance per Infosparks,plus known off-MLS sales. Data from sources deemed reliable but may contain errors and subject to revision. All numbers approximate, with last year’s total estimated based on available data in early January and may change due to late-reported sales. Not all luxury home sales are reported to MLS.
2025 home sales of $5 million+ rose approximately 23% from 2024. Luxury sales accelerated in the fall selling season due to the AI startup boom.
Sales of higher-price homes are affected by buyer demand, the number of listings available to purchase, and appreciation trends – all of which are impacted by economic and demographic conditions. As appreciation occurs over time, homes that would have sold for under $5 million, then sell for over that price threshold (and vice versa if prices fall).
2025 Home Sales by Price Segment*
San Francisco Residential Market

*2025 sales reported to NorCal MLS Alliance by late December 2025. Not all sales are reported to MLS, especially many new-project condo sales. Data from sources deemed reliable but may contain errors and subject to revision. All numbers approximate. Percentages rounded and may not add up to 100%.
Under $1,000,000: 29% (82% of sales under $1,000,000 were condos, co-ops and TICs.)
$1,000,000-$1,499,999: 27% (54% of sales of $1m - $1,499,999 were condos, co-ops and TICs.)
$1,500,000 - $1,999,999: 18%
$2,000,000– $2,999,999: 15%
$3,000,000 - $3,999,999: 5%
$4,000,000 - $4,999,999: 3%
$5,000,000+: 3% (.6% of sales were for $10 million+)
Sales by Property Type*
House: 46%
Condo: 46%
TIC: 6.5%
Co-op: 1.5%
Townhouse: less than 1%
Percentage of Listings Accepting Offers
San Francisco: Absorption Rate by Month
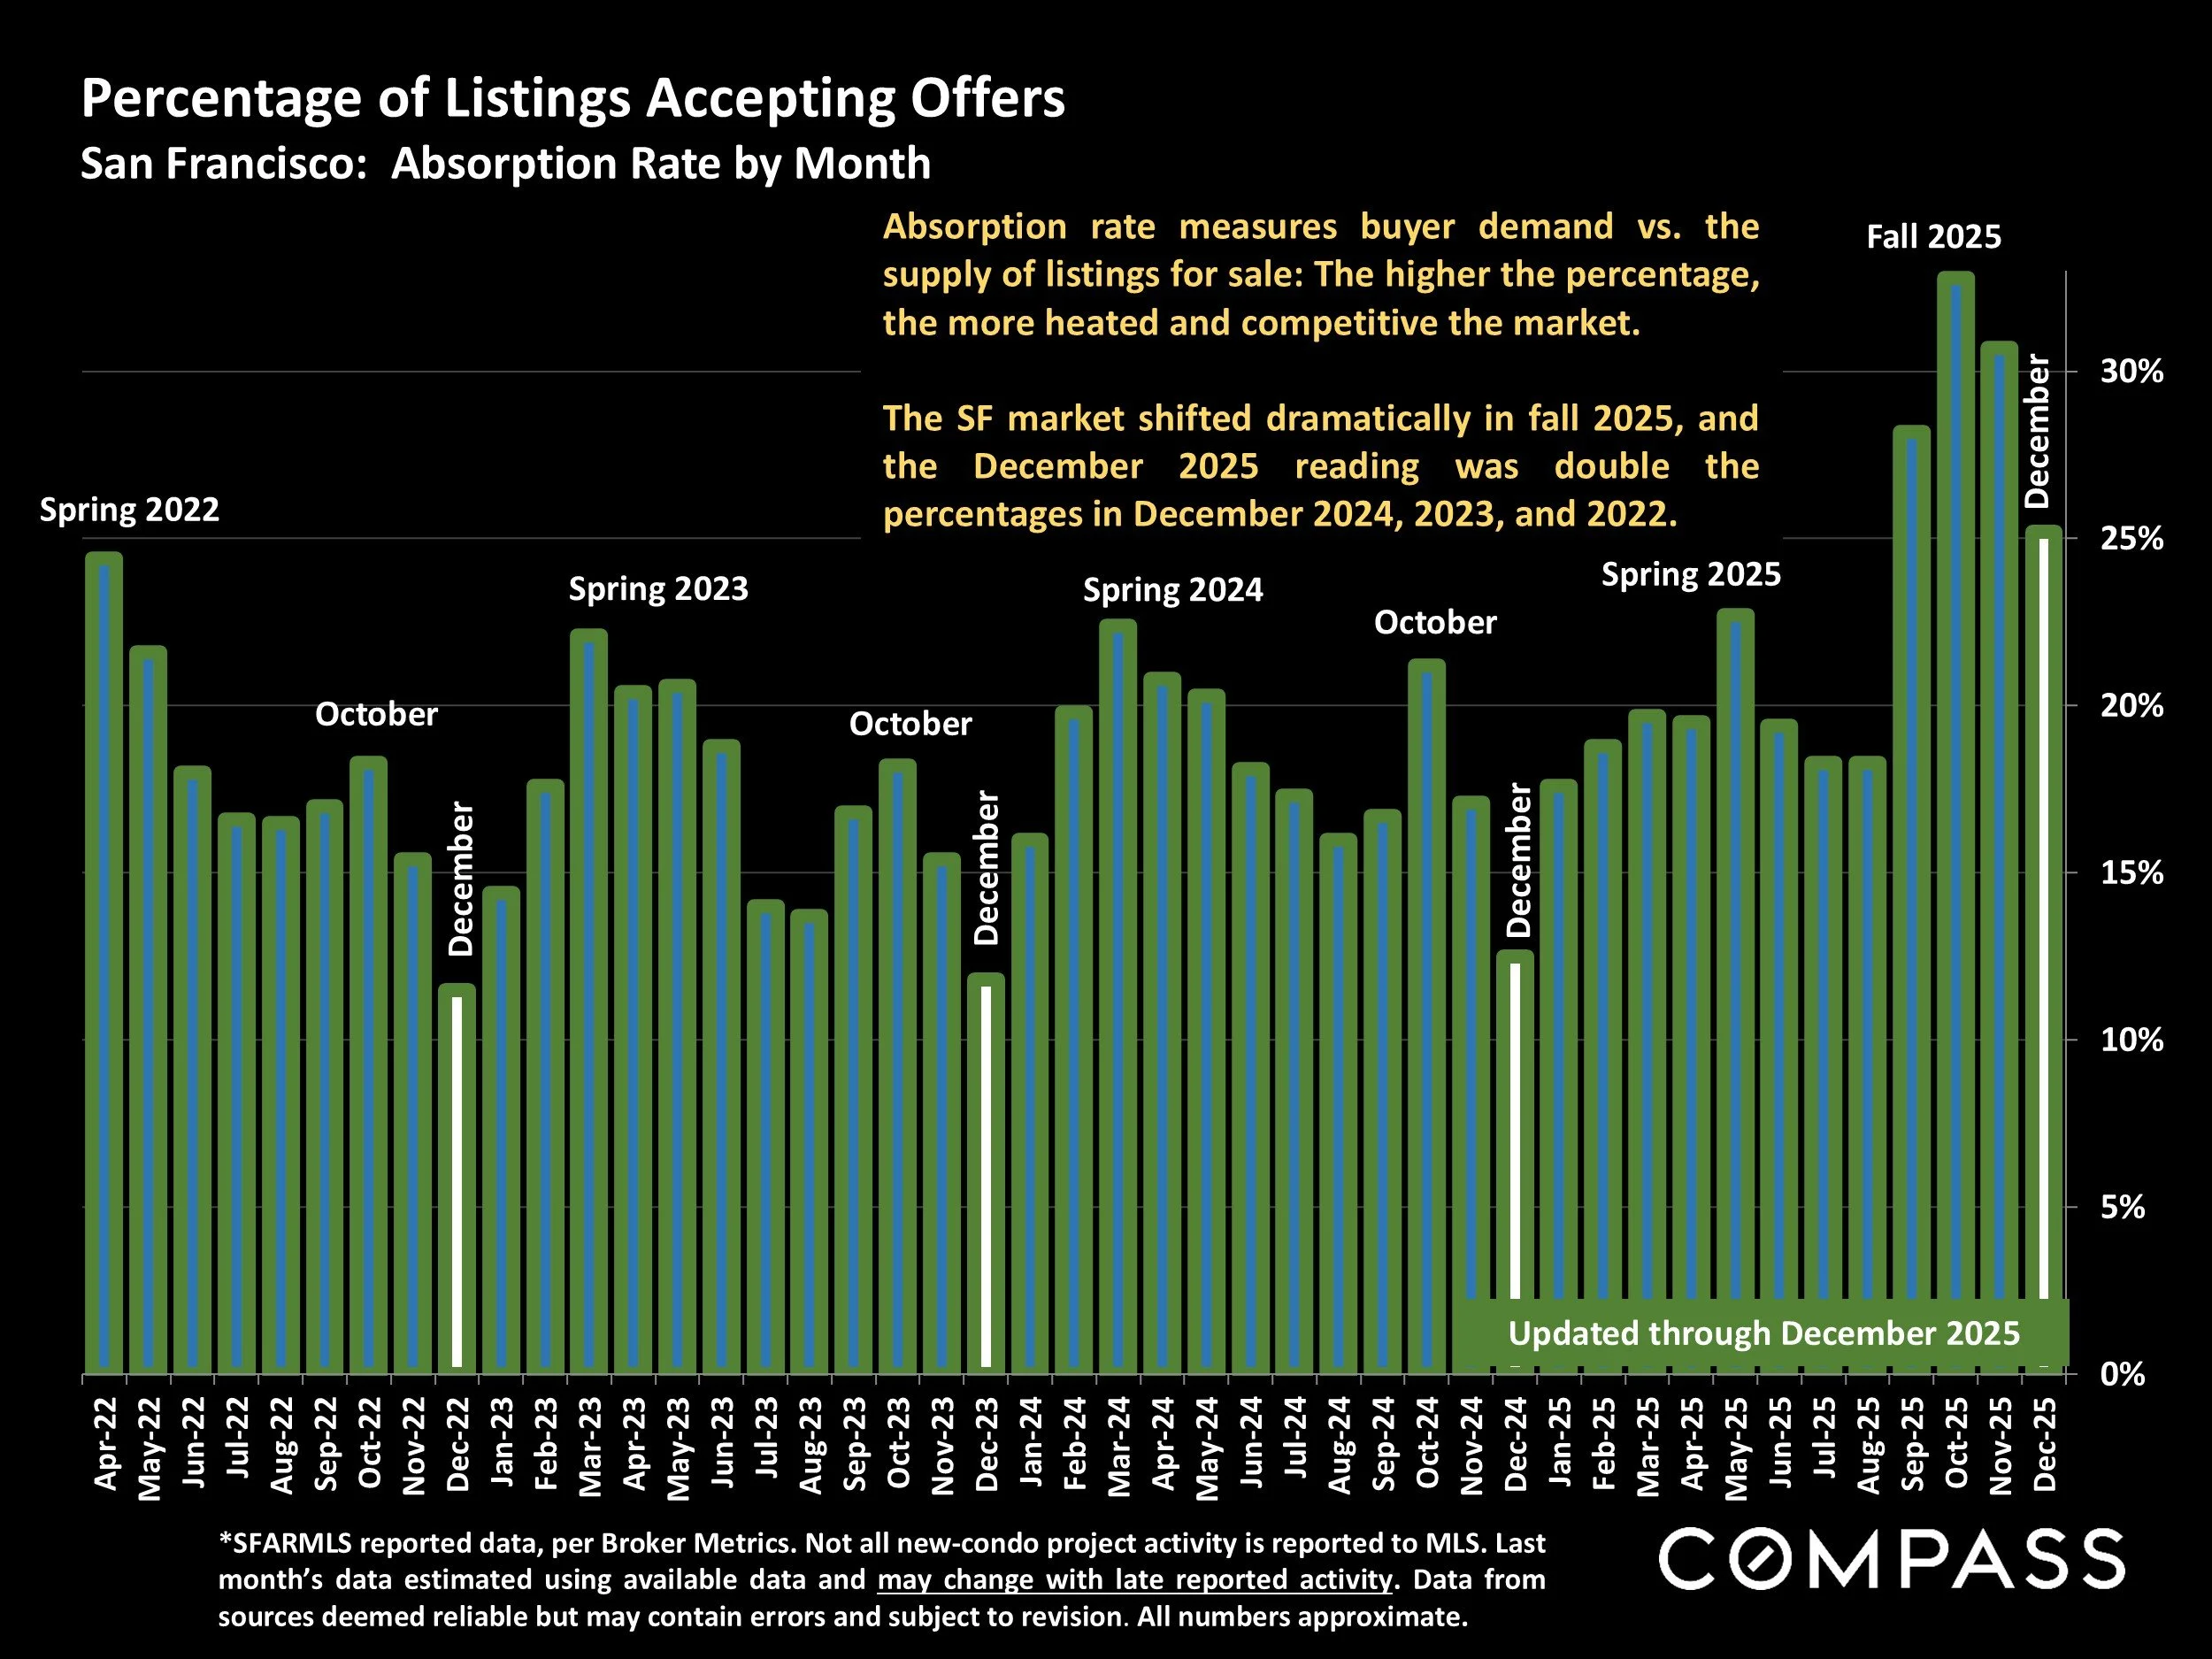
*SFARMLS reported data, per Broker Metrics. Not all new-condo project activity is reported to MLS. Last month’s data estimated using available data and may change with late reported activity. Data from sources deemed reliable but may contain errors and subject to revision. All numbers approximate.
The SF market shifted dramatically in fall 2025, and the December 2025 reading was double the percentages in December 2024, 2023, and 2022.
Absorption rate measures buyer demand vs. the supply of listings for sale: The higher the percentage, the more heated and competitive the market.
San Francisco – Speed of Sale
Average Days on Market, Annual Readings by Year, since 2005*
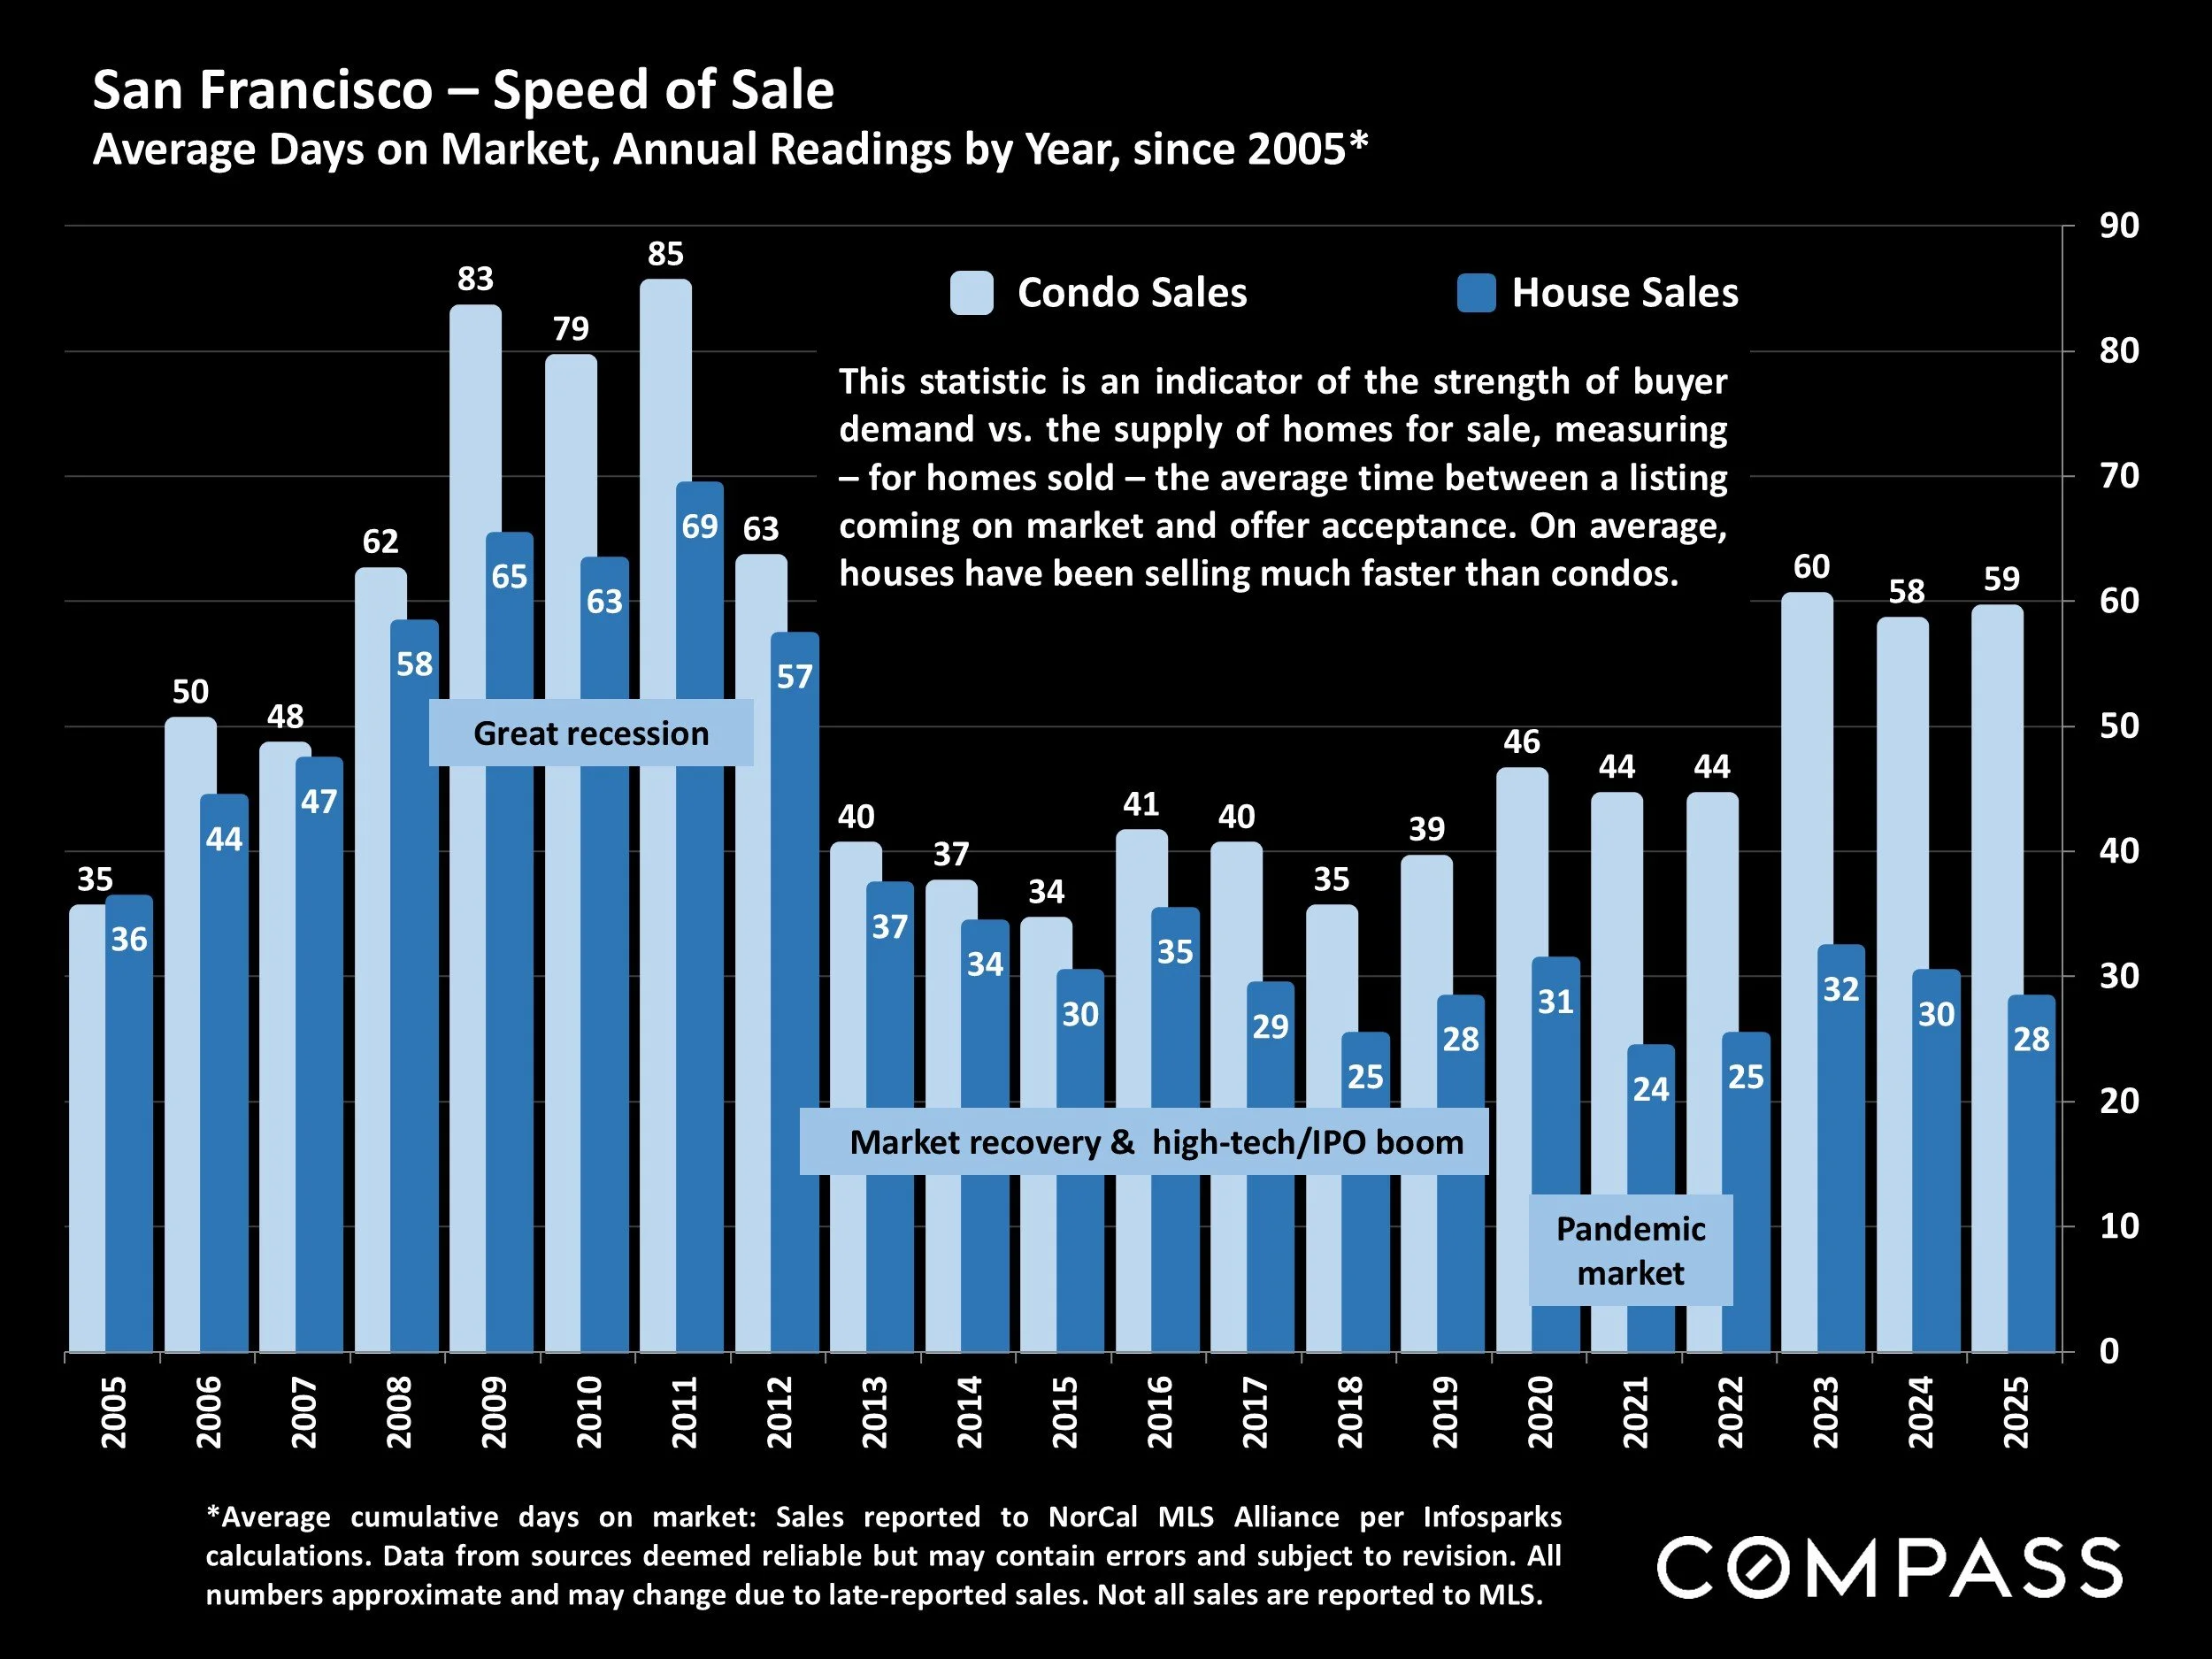
*Average cumulative days on market: Sales reported to NorCal MLS Alliance per Infosparks calculations. Data from sources deemed reliable but may contain errors and subject to revision. All numbers approximate and may change due to late-reported sales. Not all sales are reported to MLS.
This statistic is an indicator of the strength of buyer demand vs. the supply of homes for sale, measuring – for homes sold – the average time between a listing coming on market and offer acceptance. On average, houses have been selling much faster than condos.
San Francisco – Overbidding Asking Price
Percentage of Sales Over List Price, Annual Readings, since 2005*
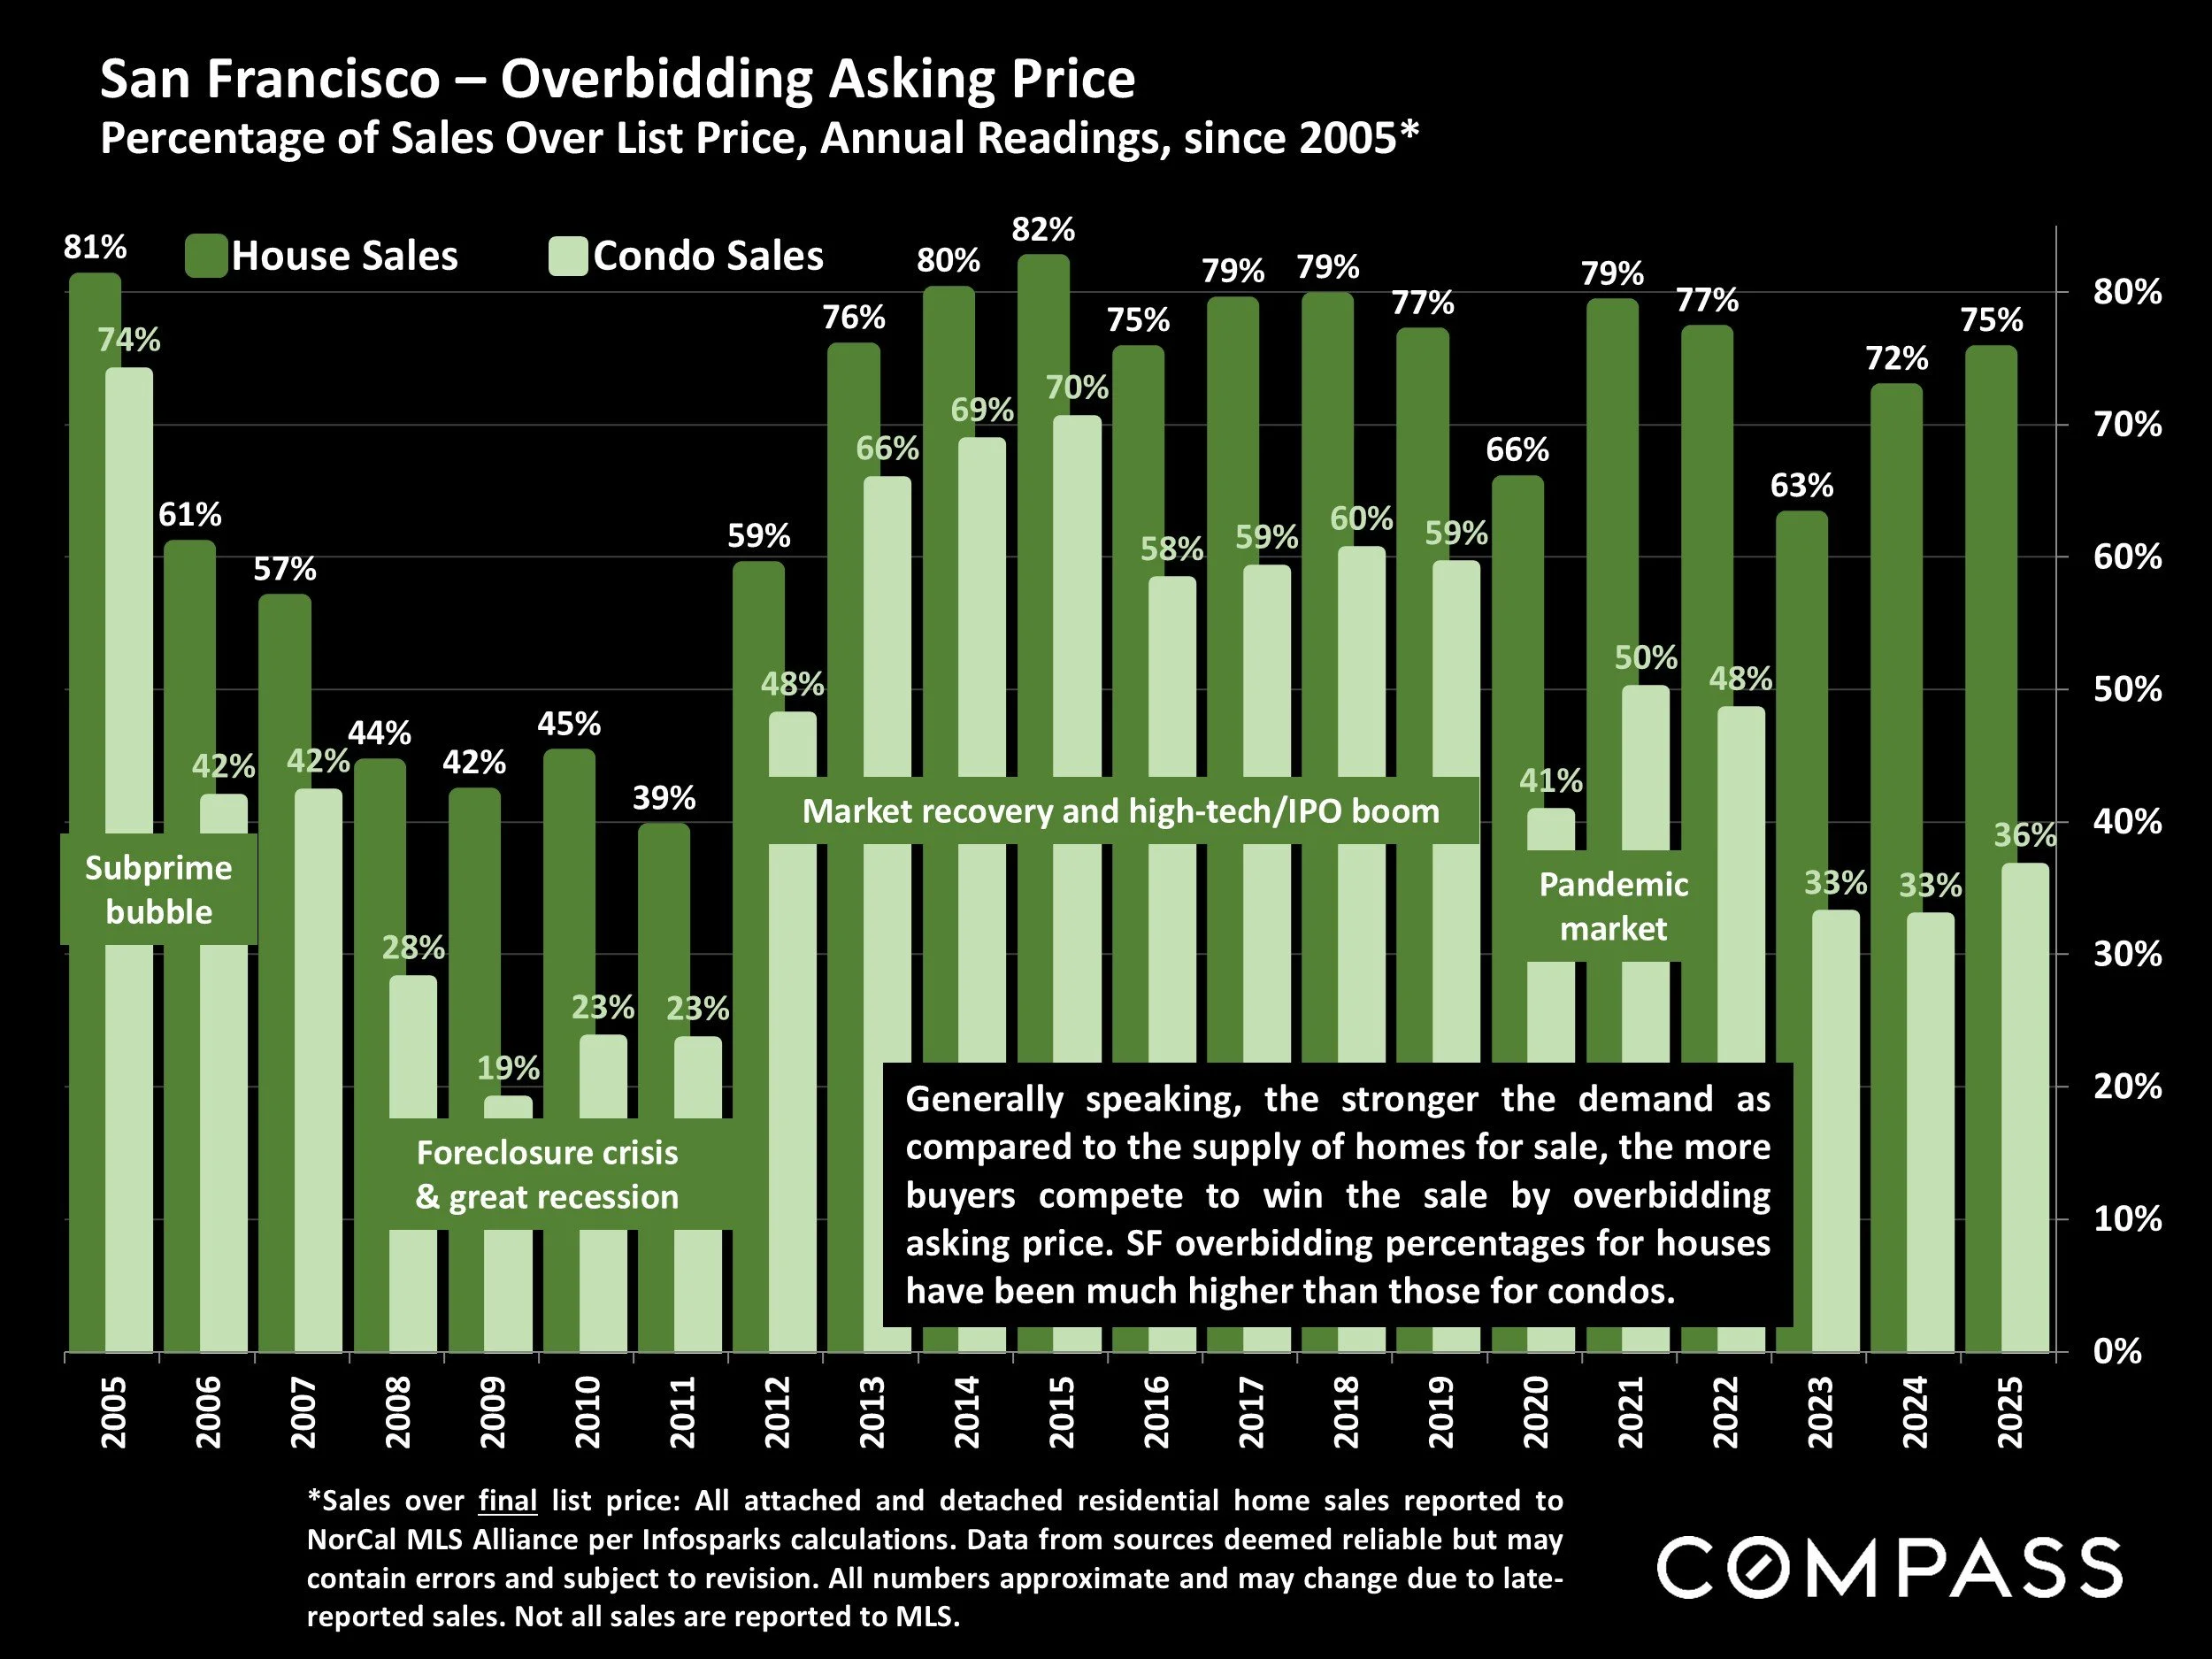
*Sales over final list price: All attached and detached residential home sales reported toNorCal MLS Alliance per Infosparks calculations. Data from sources deemed reliable but may contain errors and subject to revision. All numbers approximate and may change due to late-reported sales. Not all sales are reported to MLS.
Generally speaking, the stronger the demand as compared to the supply of homes for sale, the more buyers compete to win the sale by overbidding asking price. SF overbidding percentages for houses have been much higher than those for condos.
San Francisco: Overbidding & Underbidding
Sales Price to List Price Percentage, Annual Readings, since 2005*
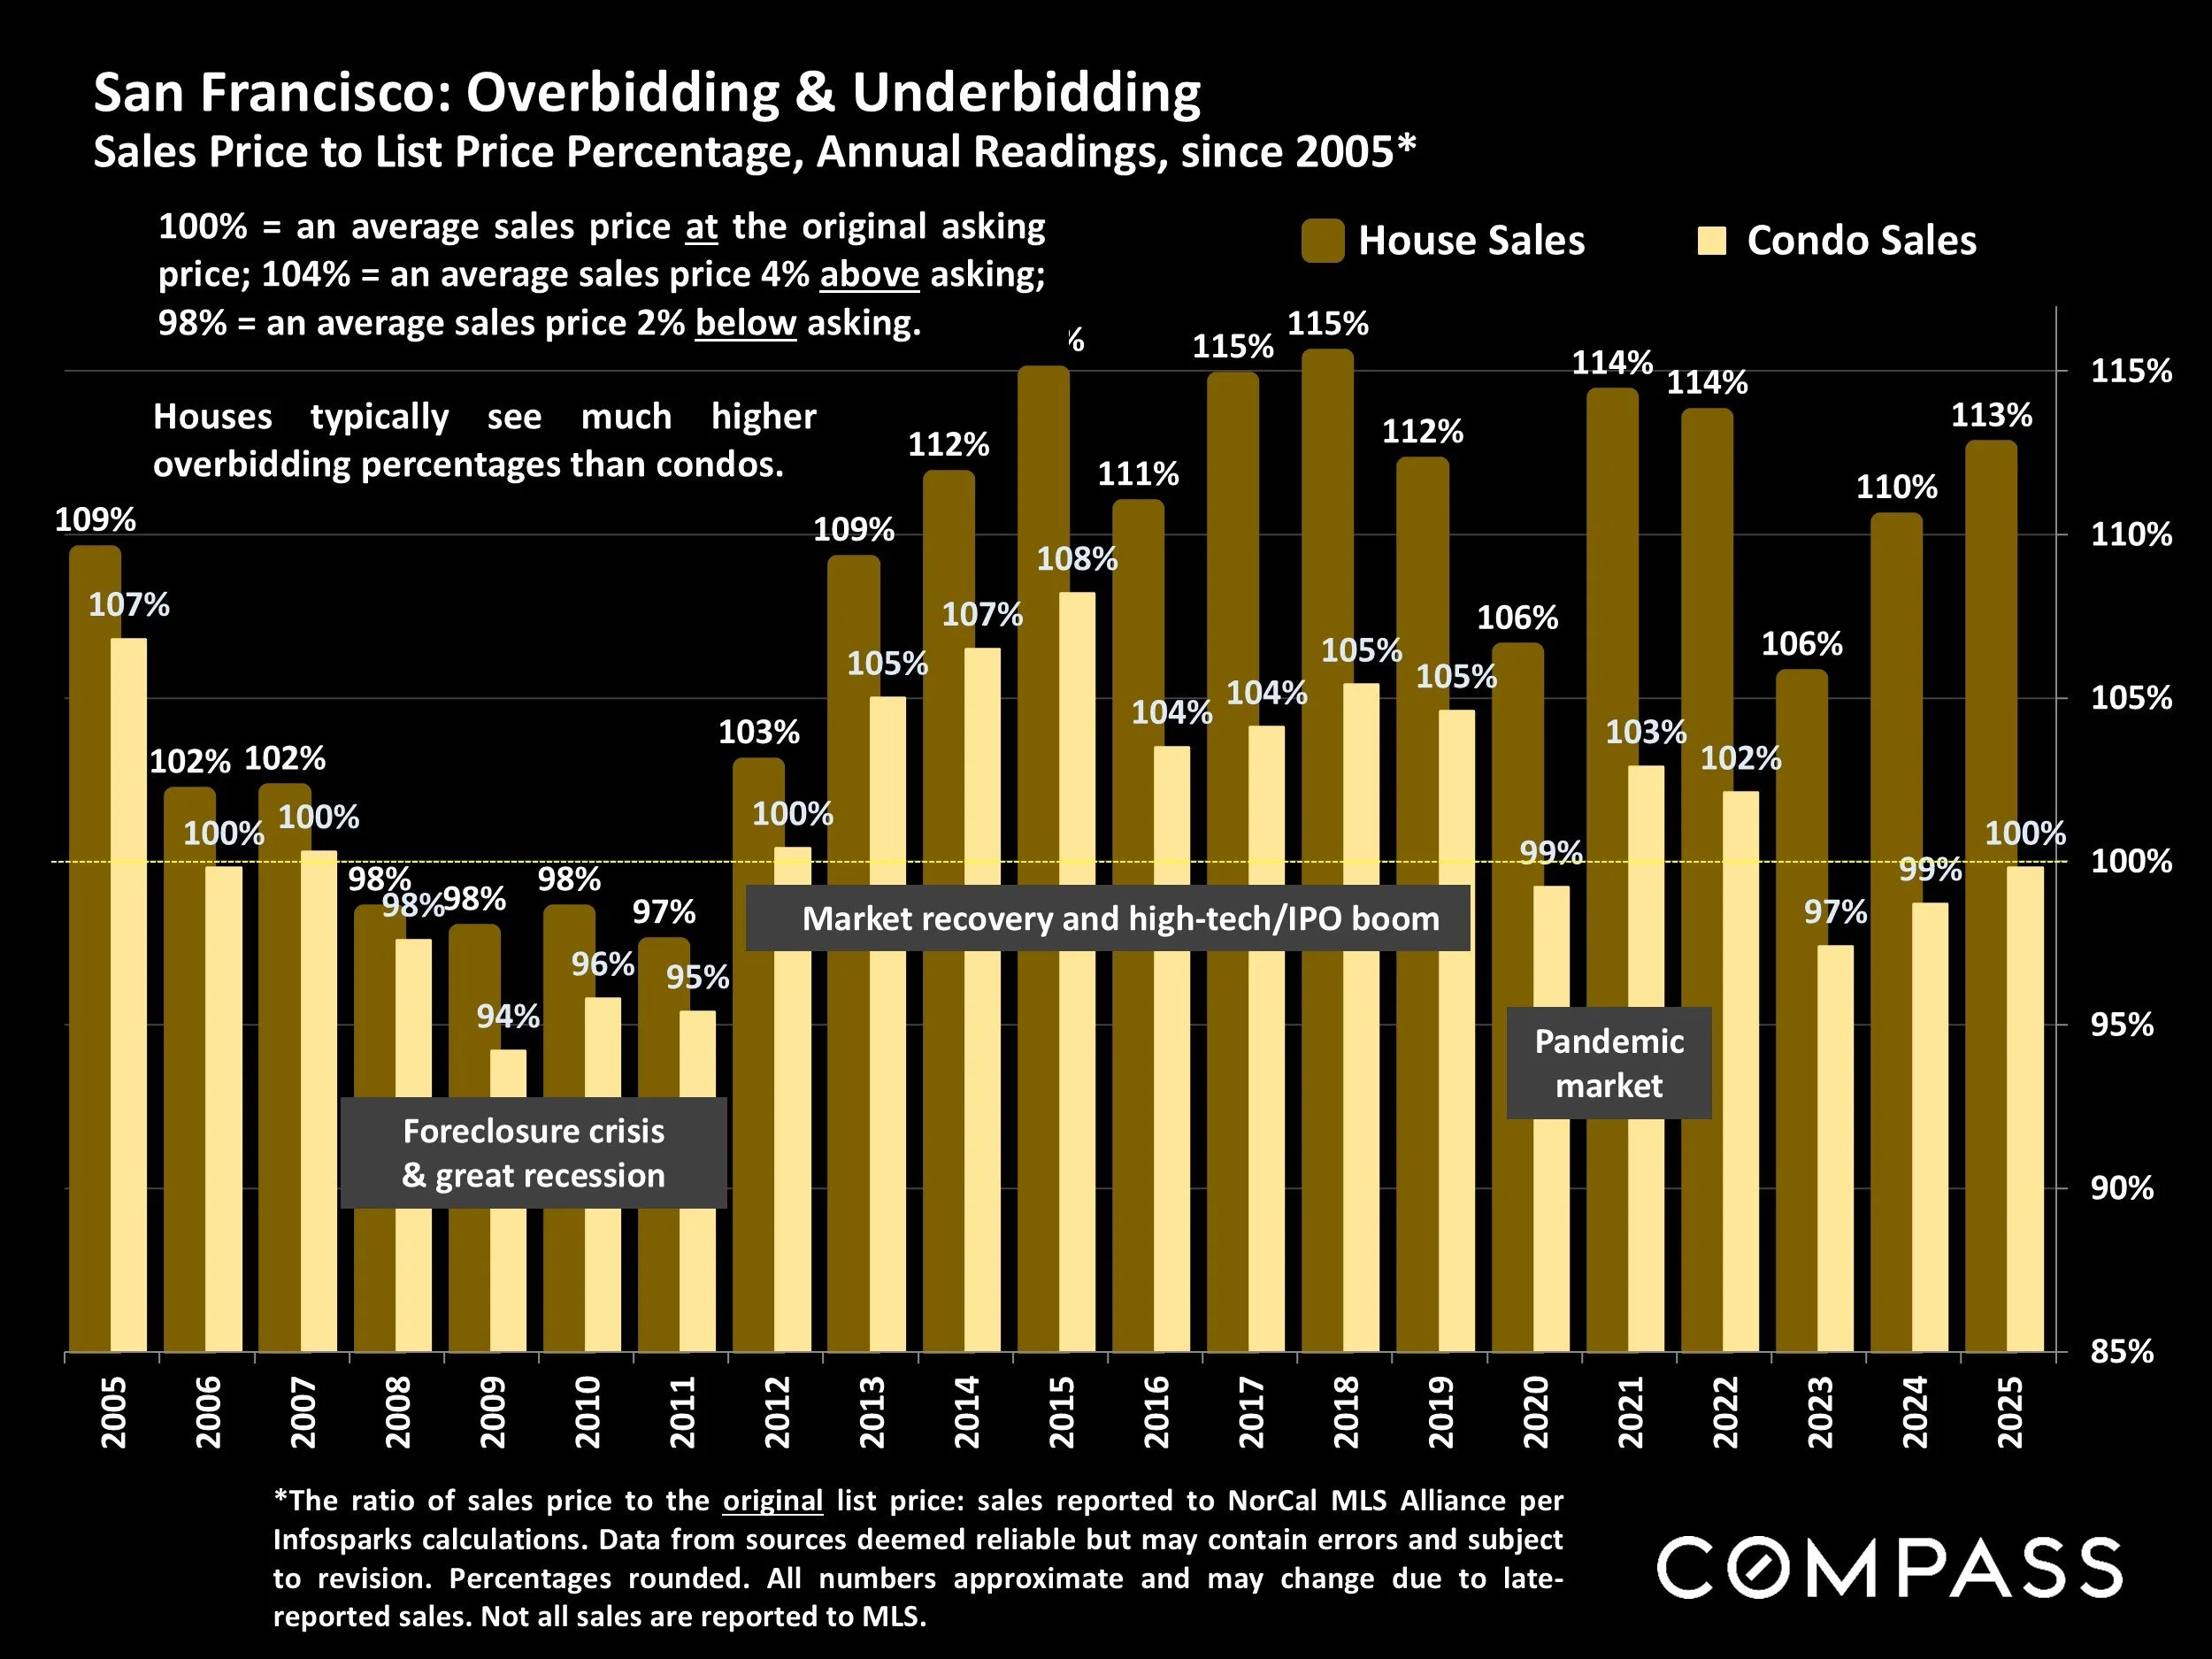
*The ratio of sales price to the original list price: sales reported to NorCal MLS Alliance perInfosparks calculations. Data from sources deemed reliable but may contain errors and subject to revision. Percentages rounded. All numbers approximate and may change due to late-reported sales. Not all sales are reported to MLS.
100% = an average sales price at the original asking price; 104% = an average sales price 4% above asking; 98% = an average sales price 2% below asking.
Houses typically see much higher overbidding percentages than condos.
Annual Number of Price Reductions
San Francisco Market Dynamics, by Year since 2017*
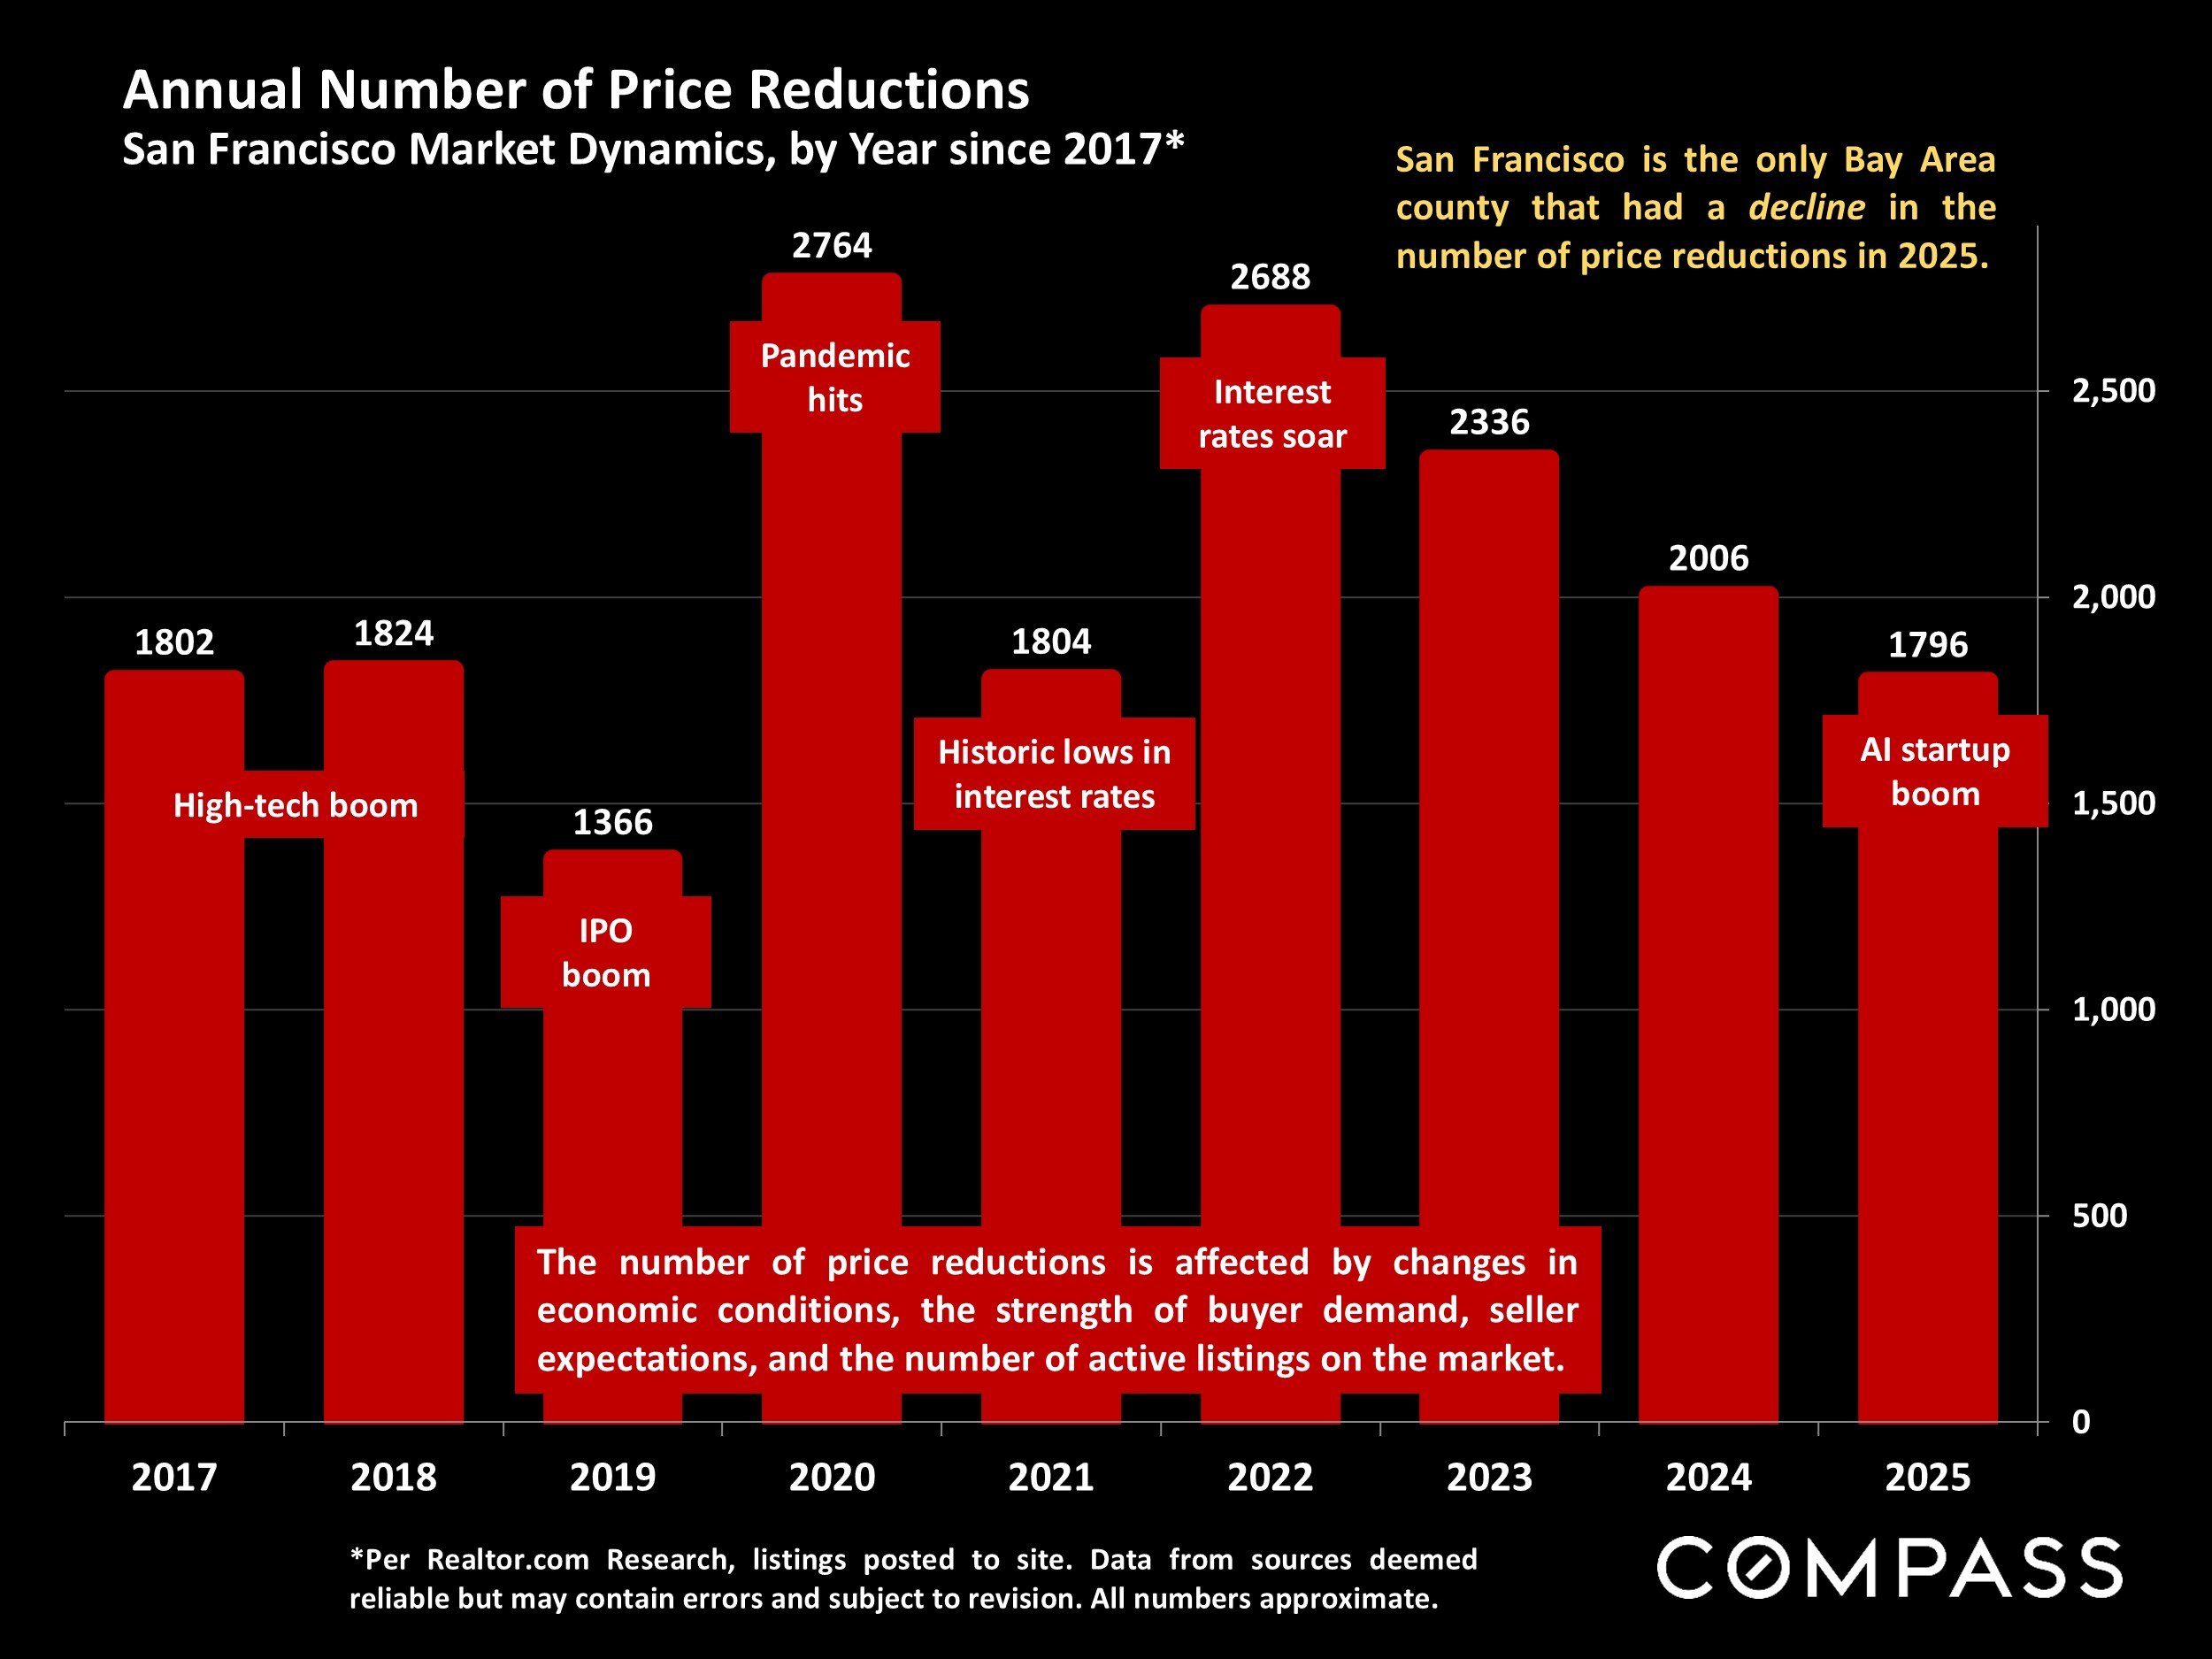
*Per Realtor.com Research, listings posted to site. Data from sources deemed reliable but may contain errors and subject to revision. All numbers approximate.
San Francisco is the only Bay Area county that had a decline in the number of price reductions in 2025.
The number of price reductions is affected by changes in economic conditions, the strength of buyer demand, seller expectations, and the number of active listings on the market.
Annual Median House Sales Prices
by Bay Area County + Sacramento, 2012 – 2025*

*Sales reported to MLS, per the CA Association of Realtors, or NorCal MLS Alliance. Data from sources deemed reliable but may contain errors and subject to revision. All numbers approximate. Different data sources sometimes calculate median house sales prices using varying methodologies.
Due to specific market conditions and economic factors – such as the pandemic boom, interest rate changes, stock markets, the AI boom – appreciation rates between counties vary year-to-year, but over the longer term, county home prices throughout the region tend to move roughly in parallel.
Home values vary widely across submarkets within the county markets.
Median sales price can be affected by factors besides changes in fair market value.
Mortgage Interest Rates in 2025 – 2026 YTD
30-Year Conforming Fixed-Rate Loans, Weekly Average Readings*
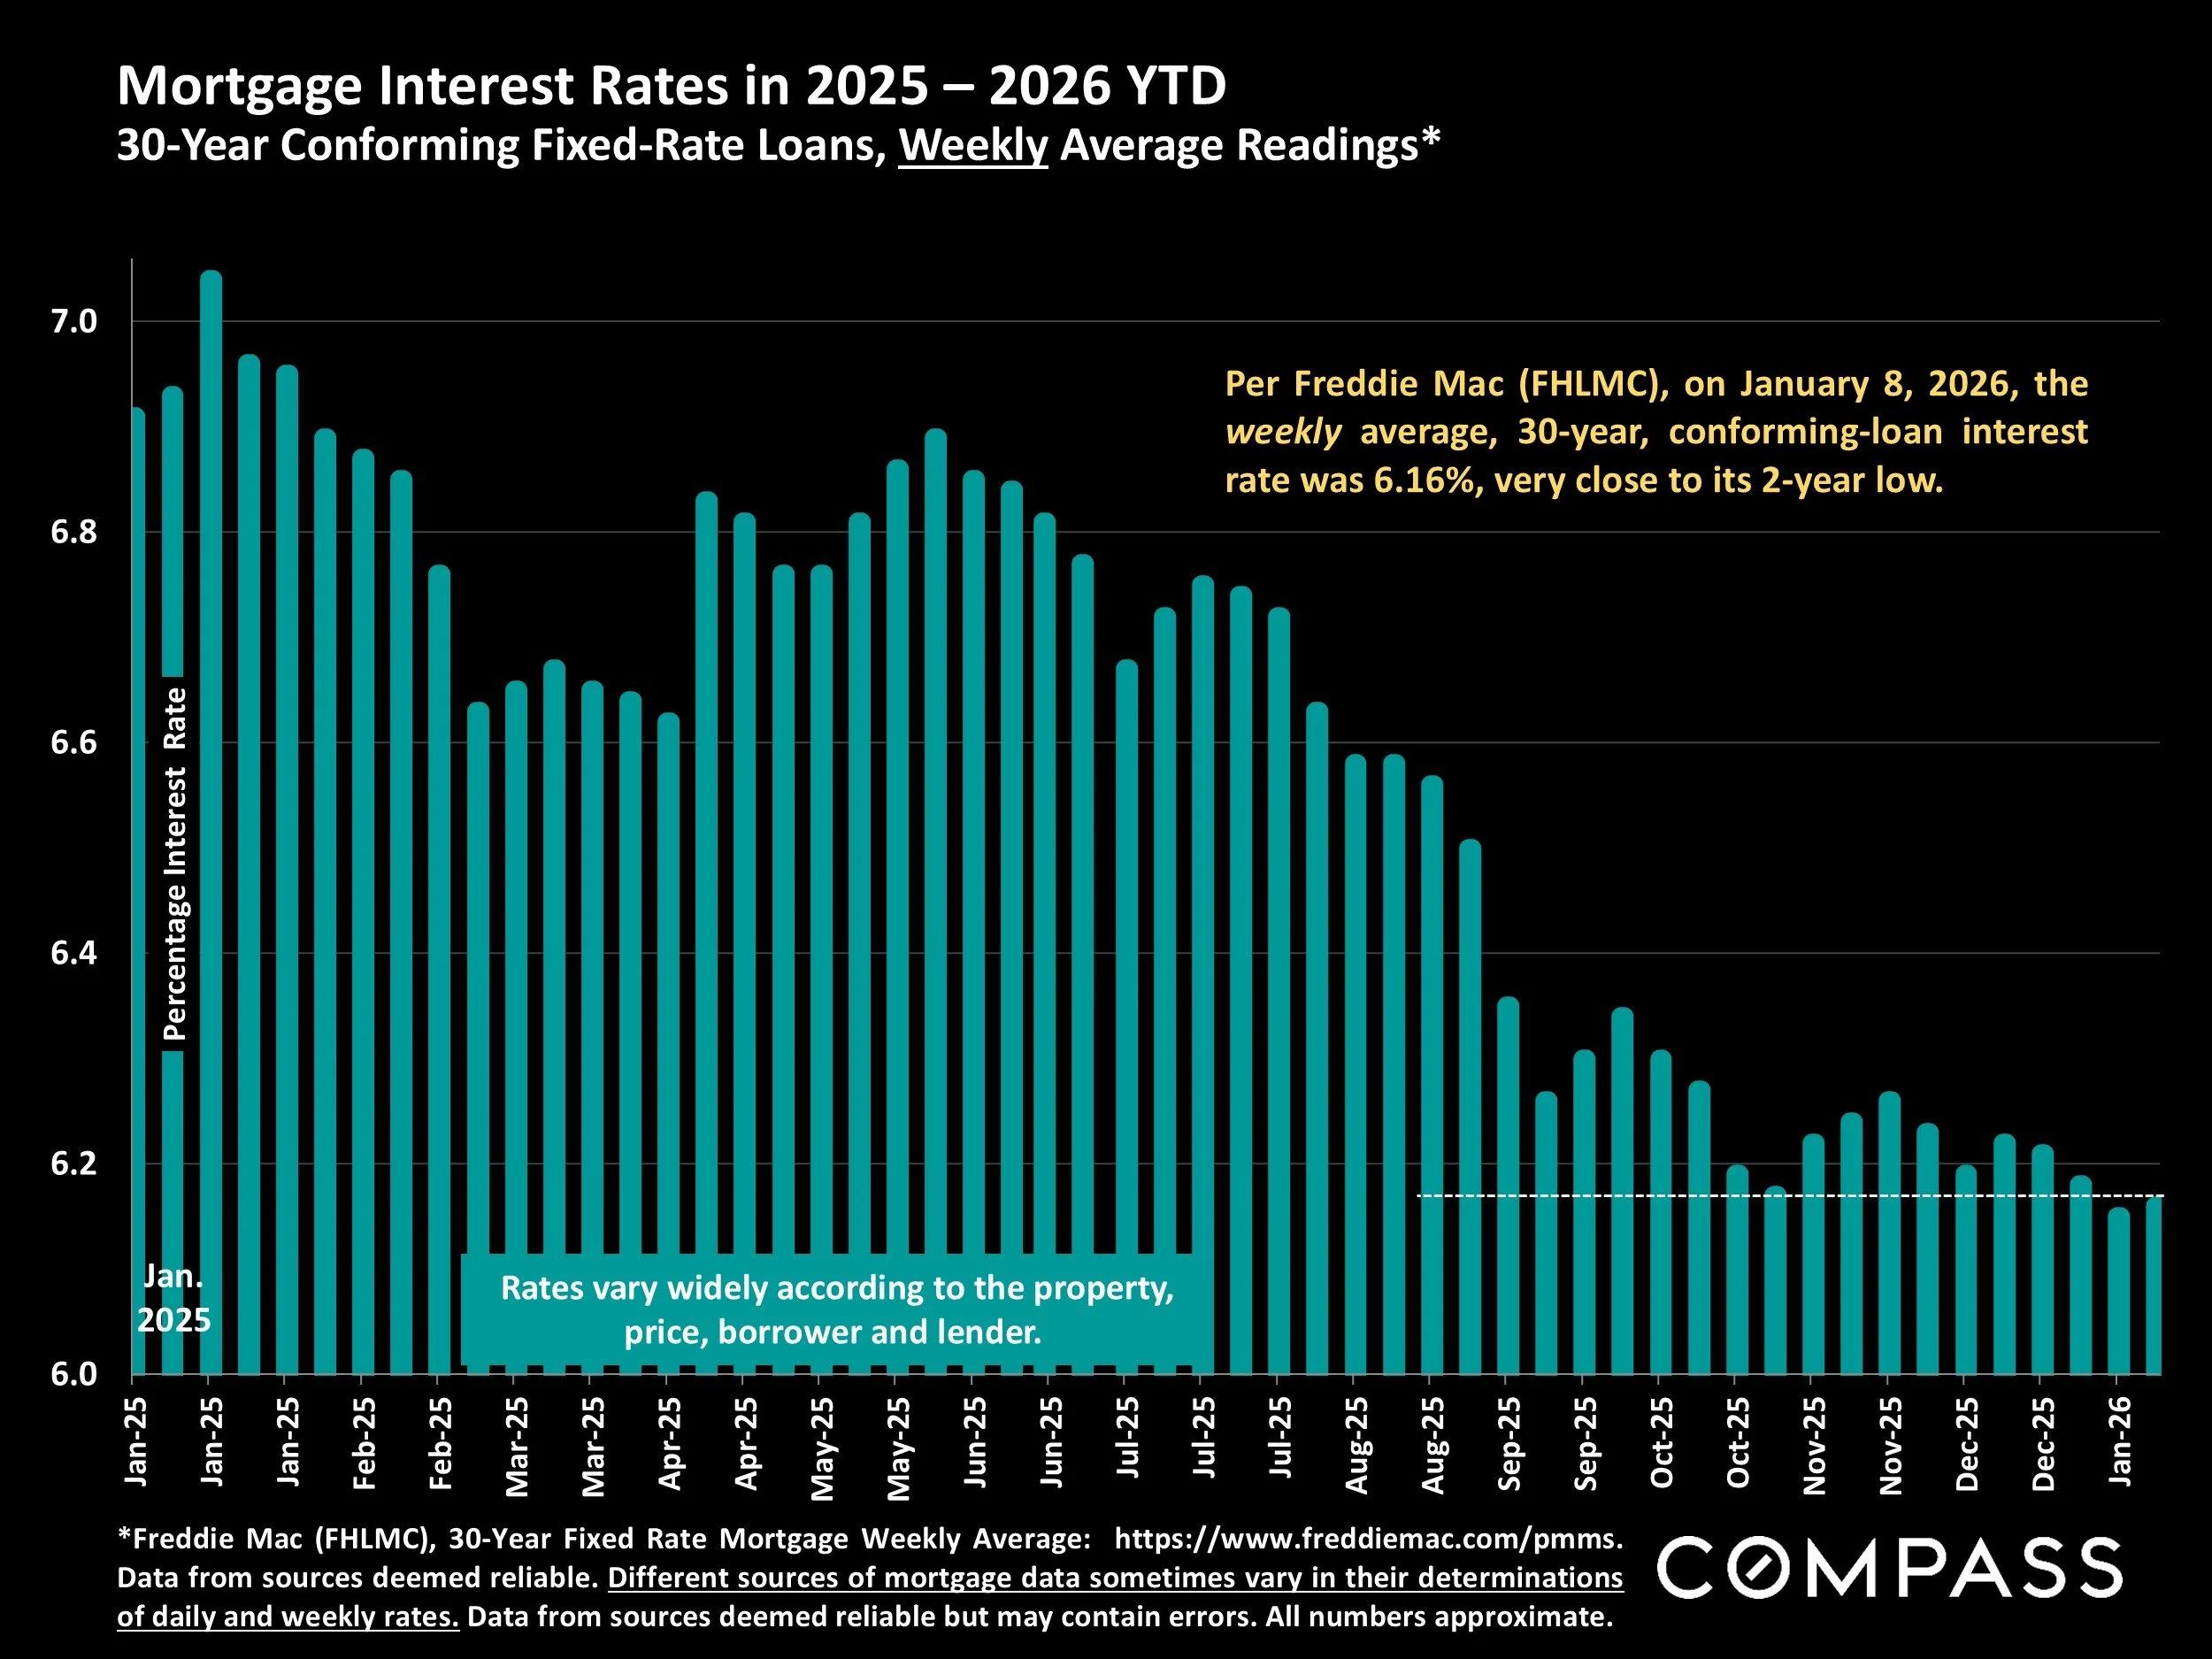
*Freddie Mac (FHLMC), 30-Year Fixed Rate Mortgage Weekly Average: https://www.freddiemac.com/pmms. Data from sources deemed reliable. Different sources of mortgage data sometimes vary in their determinations of daily and weekly rates. Data from sources deemed reliable but may contain errors. All numbers approximate.
Per Freddie Mac (FHLMC), on January 8, 2026, the weekly average, 30-year, conforming-loan interest rate was 6.16%, very close to its 2-year low.
Financial Markets, 2025 – 2026 YTD
Percentage Increases in S&P 500 & Nasdaq since 1/2/25
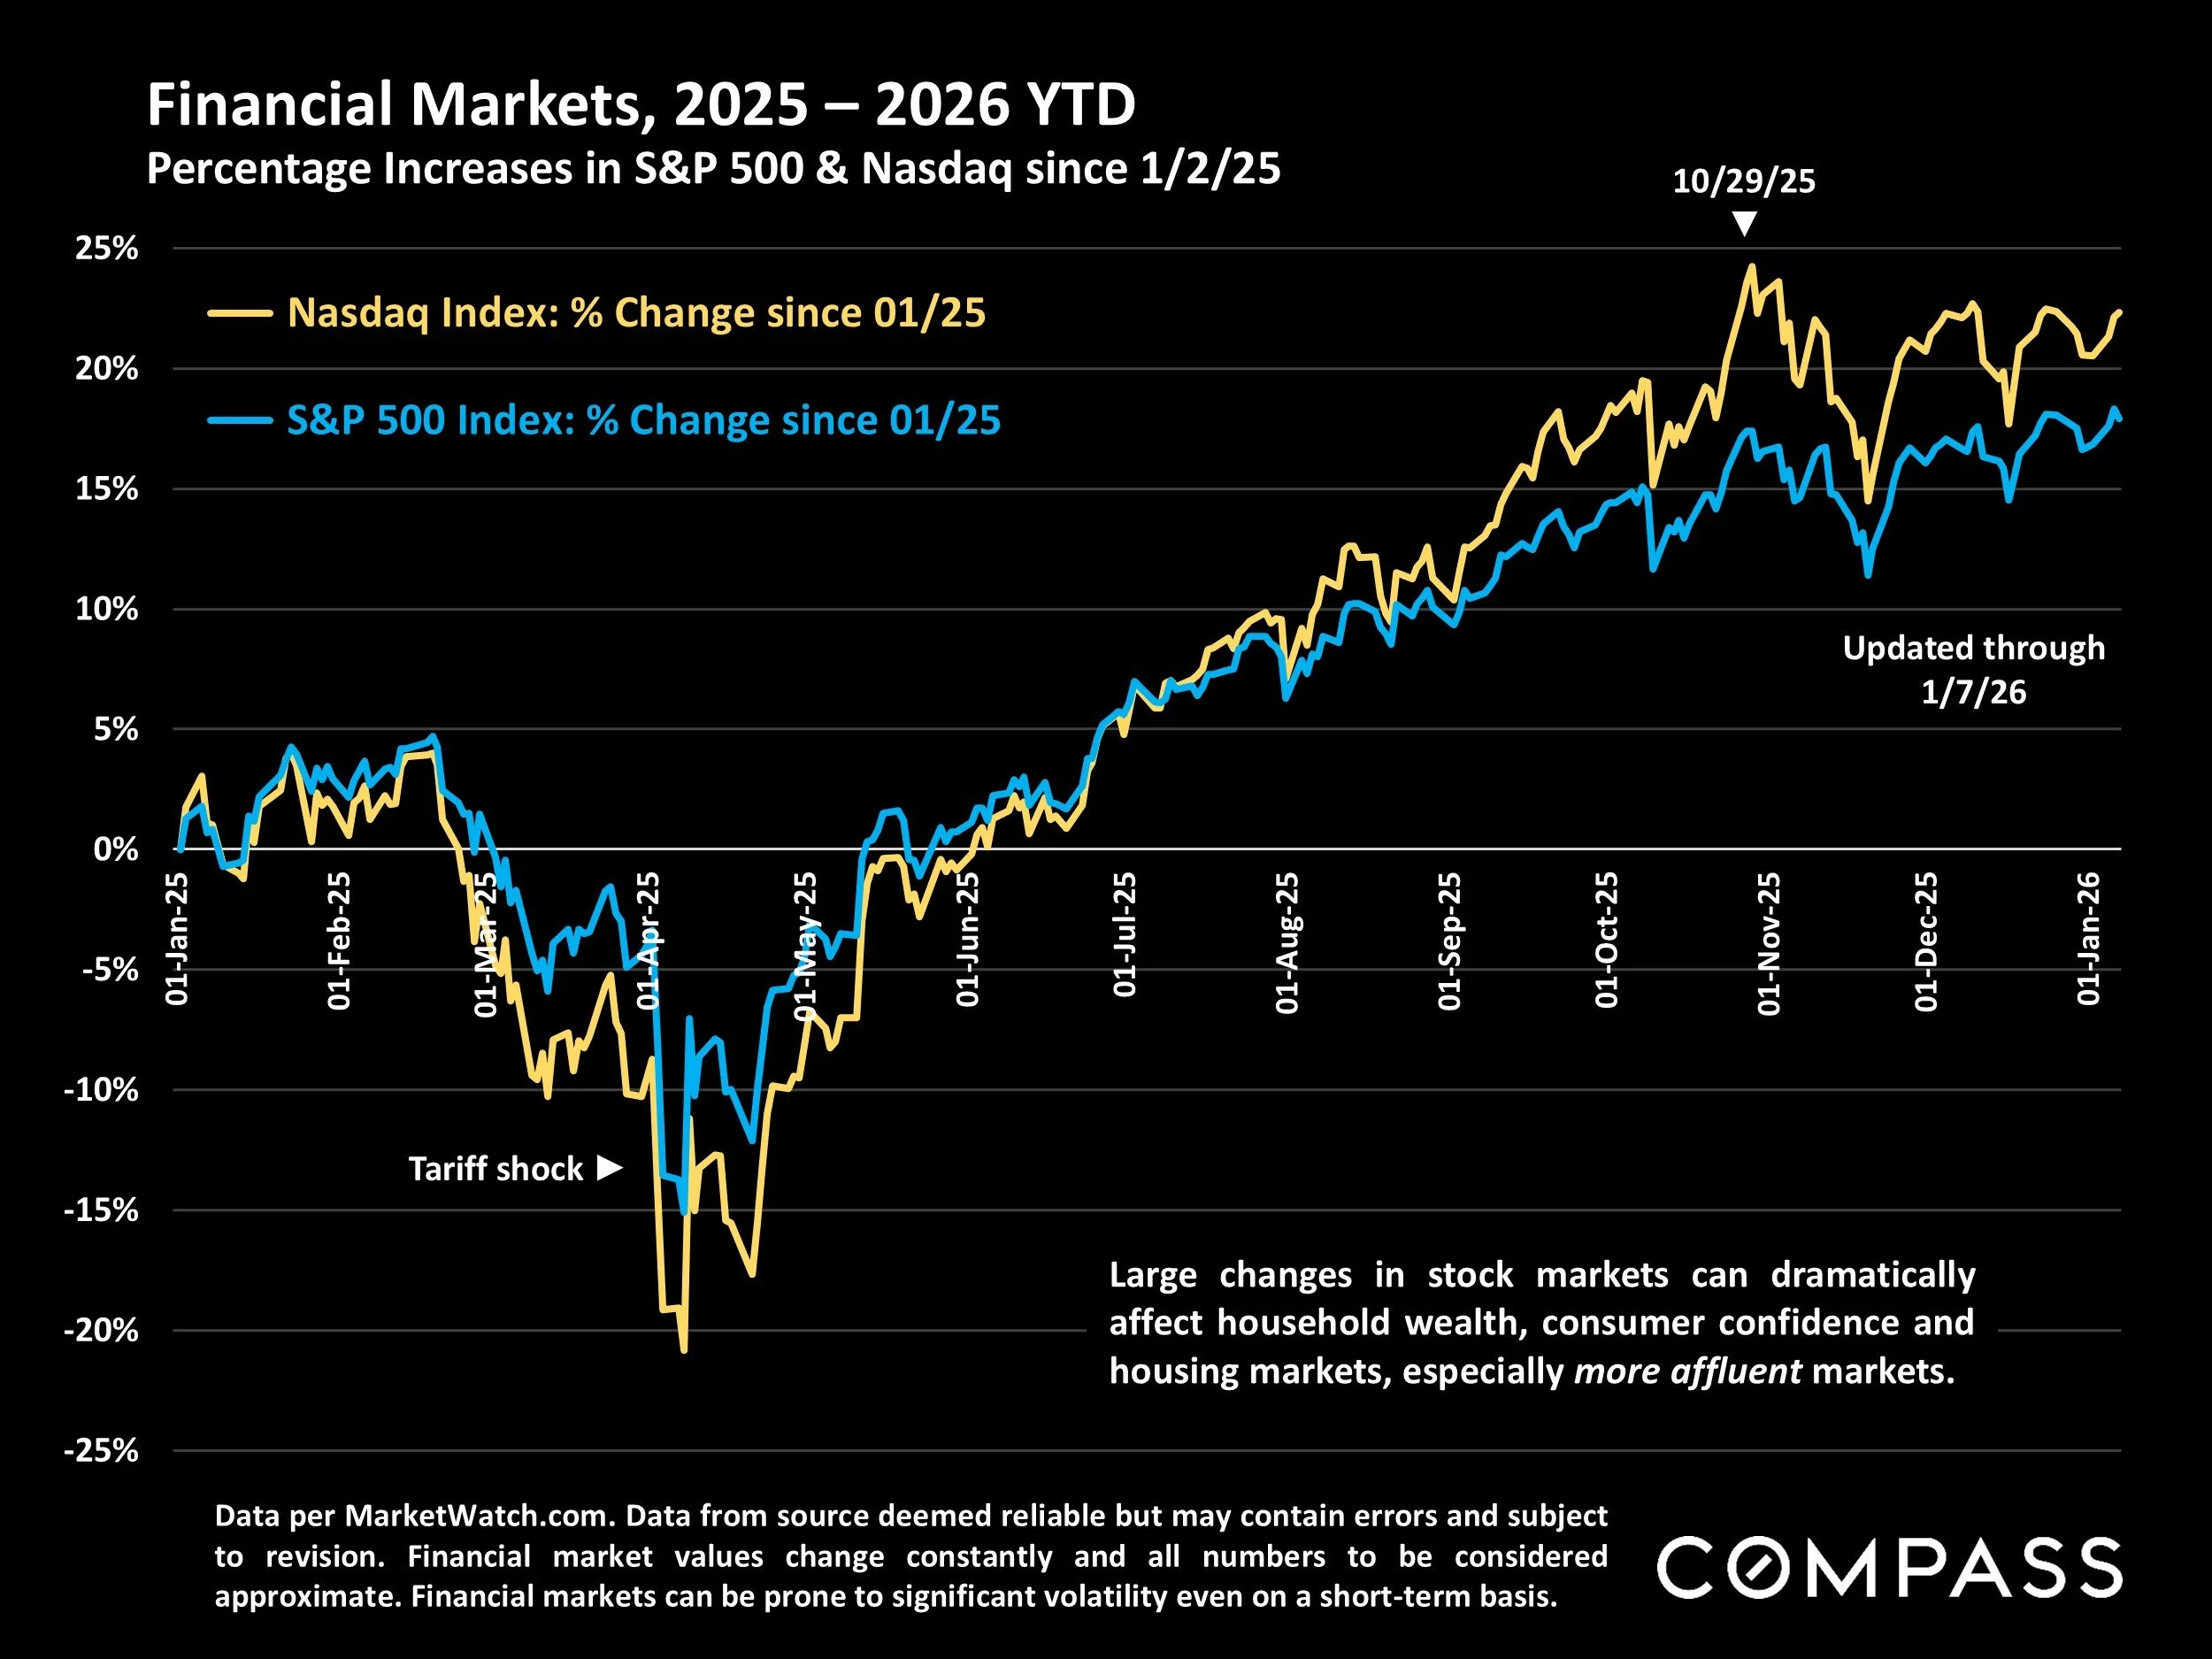
Data per MarketWatch.com. Data from source deemed reliable but may contain errors and subject to revision. Financial market values change constantly and all numbers to be considered approximate. Financial markets can be prone to significant volatility even on a short-term basis.
Large changes in stock markets can dramatically affect household wealth, consumer confidence and housing markets, especially more affluent markets.
Economic Policy Uncertainty Index*
By Month since January 2000
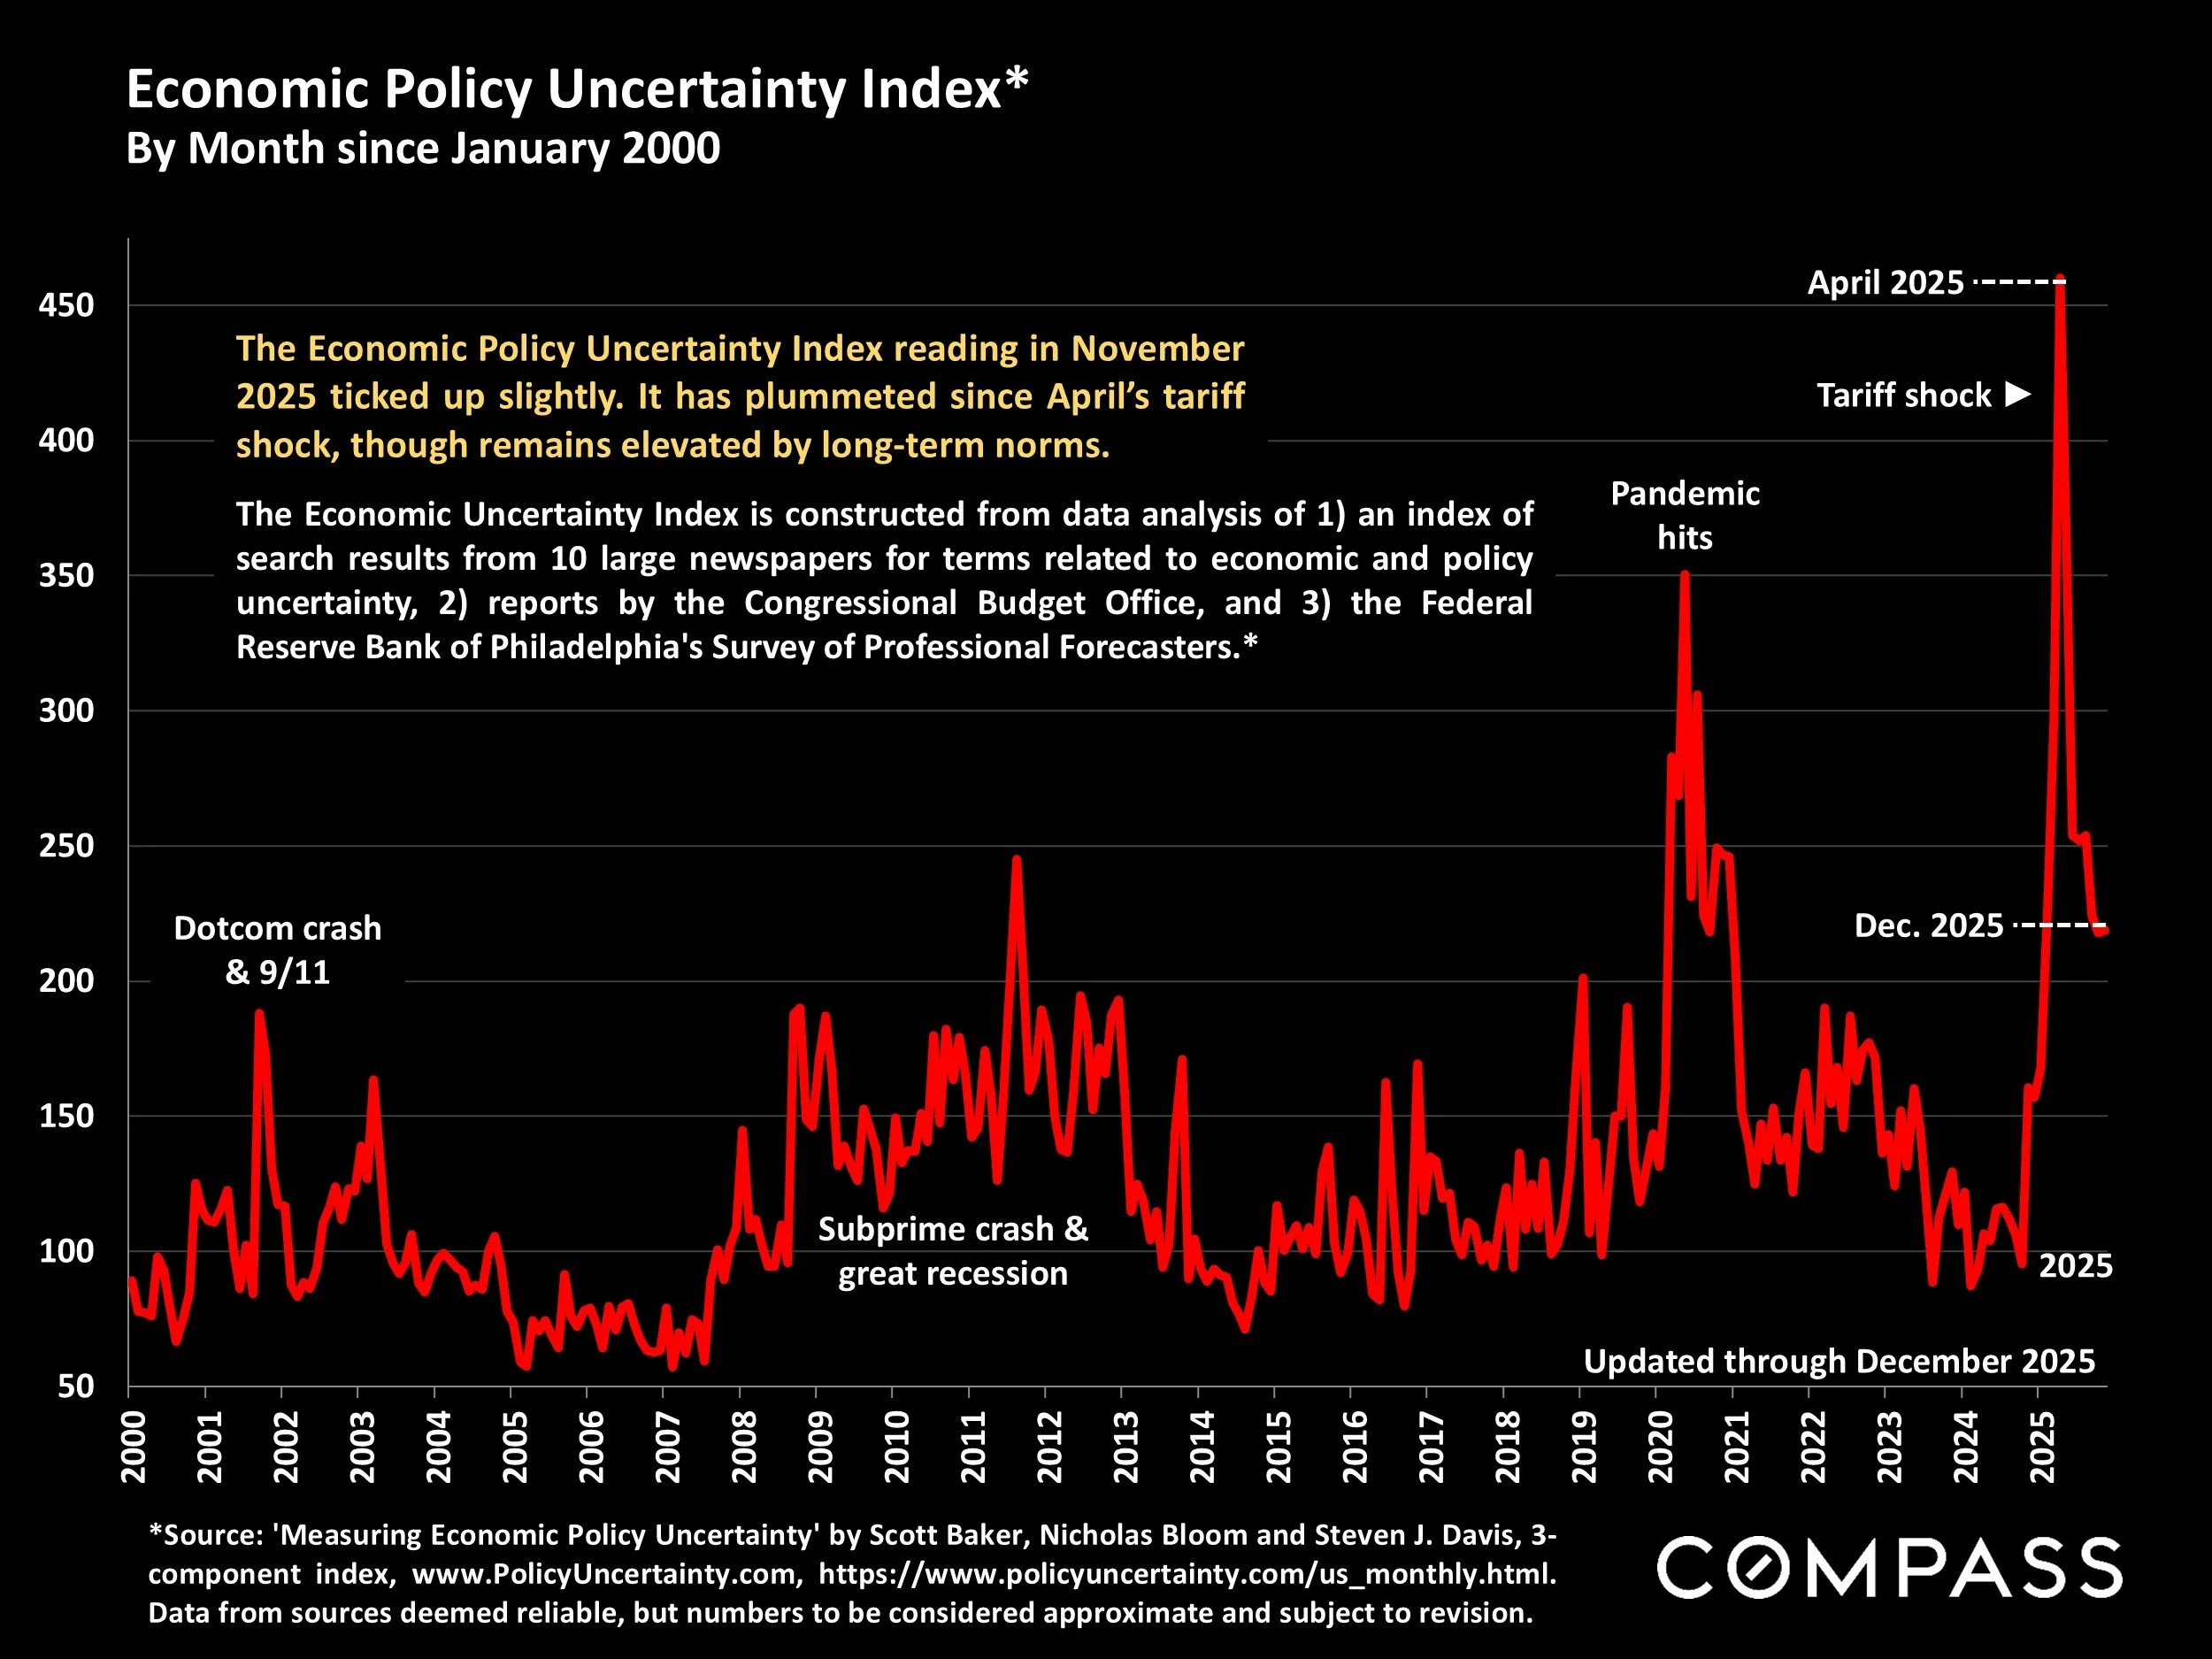
*Source: 'Measuring Economic Policy Uncertainty' by Scott Baker, Nicholas Bloom and Steven J. Davis, 3-component index, www.PolicyUncertainty.com, https://www.policyuncertainty.com/us_monthly.html. Data from sources deemed reliable, but numbers to be considered approximate and subject to revision.
The Economic Policy Uncertainty Index reading in November 2025 ticked up slightly. It has plummeted since April’s tariff shock, though remains elevated by long-term norms.
The Economic Uncertainty Index is constructed from data analysis of 1) an index of search results from 10 large newspapers for terms related to economic and policy uncertainty, 2) reports by the Congressional Budget Office, and 3) the Federal Reserve Bank of Philadelphia's Survey of Professional Forecasters.*
San Francisco HOUSE Markets By Neighborhood & Realtor District
Realtor districts can contain neighborhoods of widely varying demographics and characteristics, housing types and values: The numbers in this report are generalities, and how they apply to any particular property is unknown without a specific comparative market analysis. Statistics are generalities and anomalous fluctuations in statistics are not uncommon, especially in smaller district and neighborhood markets with fewer sales and wide ranges in sales prices. The time period for each analysis is delineated at the bottom of the chart.
Condo market analyses follow the house market charts.
Median HOUSE Sales Prices – Selected Neighborhoods*

*12 months sales reported to NorCal MLS Alliance through mid-December 2025. Data from sources deemed reliable but may contain errors and subject to revision. All numbers approximate and may change with late-reported sales.
*12 months sales reported to NorCal MLS Alliance through mid-December 2025. Data from sources deemed reliable but may contain errors and subject to revision. All numbers approximate and may change with late-reported sales.
Median sales price is that price at which half the sales occurred for more and half for less. It is a very general measurement of value that disguises a wide range of prices in the underlying sales, and how it applies to any particular home is unknown without a specific comparative market analysis.
Many factors affect home values: architectural style, quality of construction, square footage, condition, amenities, light, views, privacy, outdoor space, “bonus” rooms, additional parking, quality of location within the neighborhood, and so on.
Median HOUSE $/Sq.Ft. Values – Selected Neighborhoods*
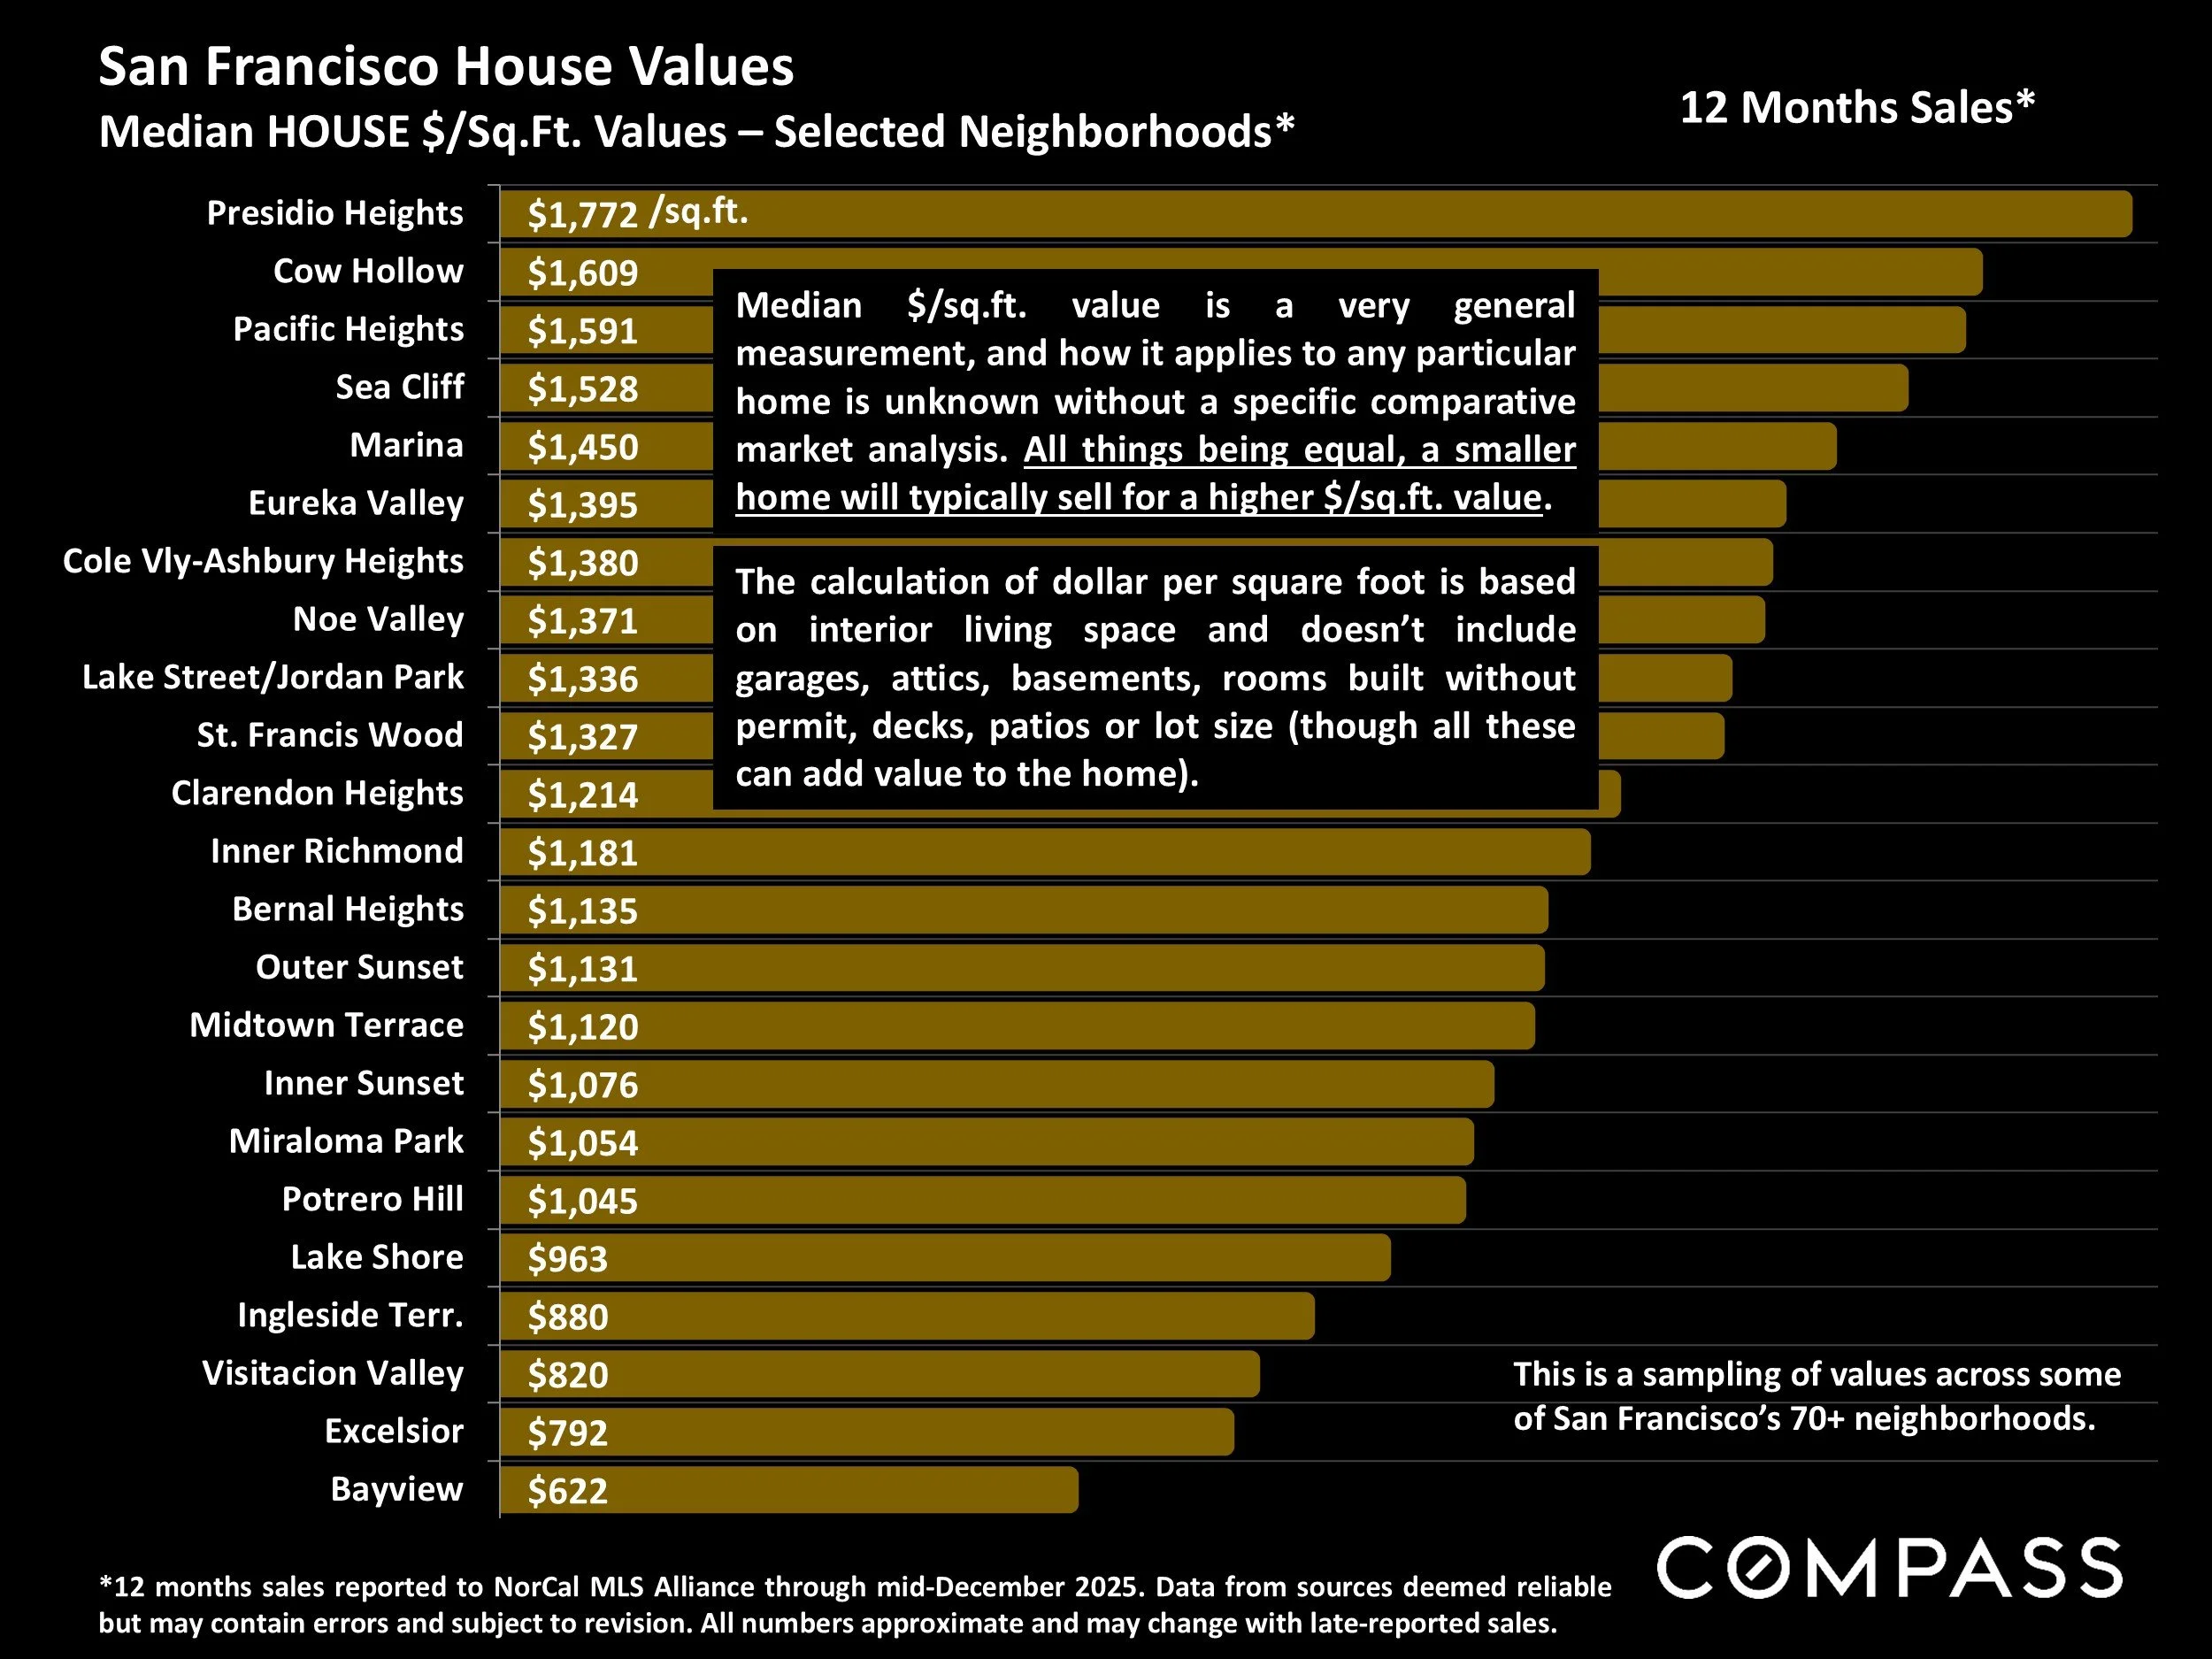
*12 months sales reported to NorCal MLS Alliance through mid-December 2025. Data from sources deemed reliable but may contain errors and subject to revision. All numbers approximate and may change with late-reported sales.
Median $/sq.ft. value is a very general measurement, and how it applies to any particular home is unknown without a specific comparative market analysis. All things being equal, a smaller home will typically sell for a higher $/sq.ft. value.
The calculation of dollar per square foot is based on interior living space and doesn’t include garages, attics, basements, rooms built without permit, decks, patios or lot size (though all these can add value to the home).
San Francisco Median House Sizes
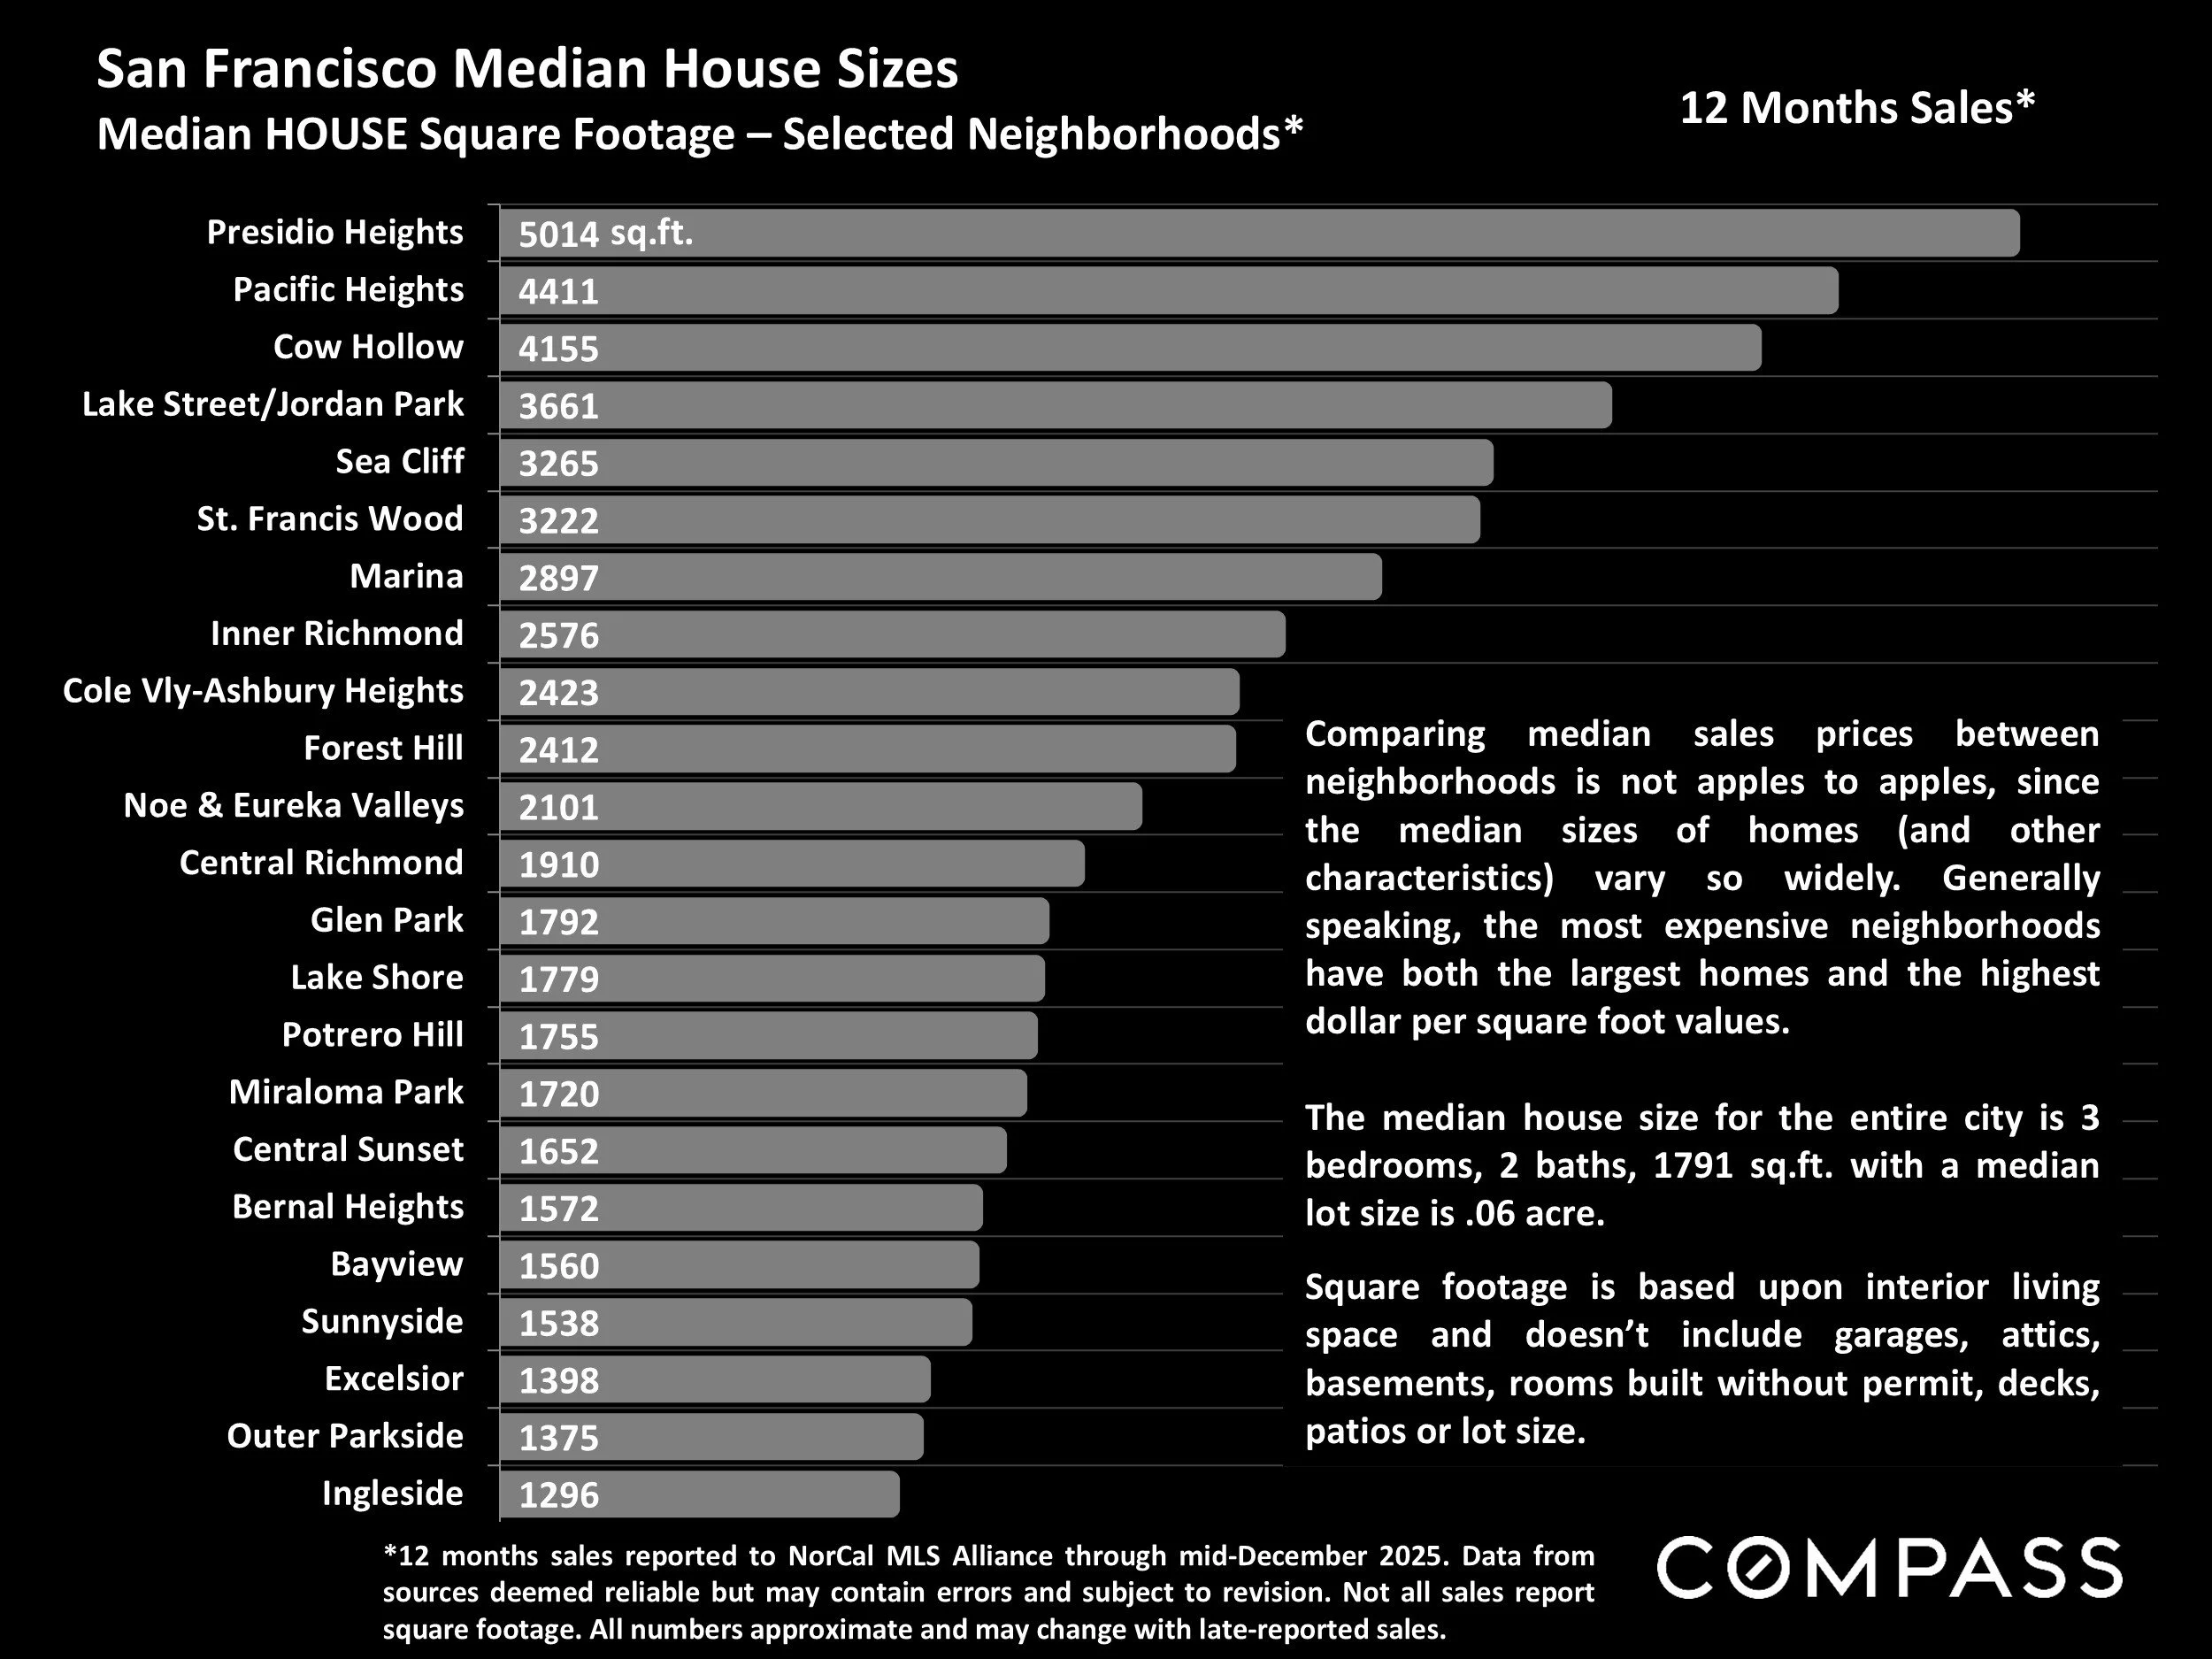
Median HOUSE Square Footage – Selected Neighborhoods*
*12 months sales reported to NorCal MLS Alliance through mid-December 2025. Data from sources deemed reliable but may contain errors and subject to revision. Not all sales report square footage. All numbers approximate and may change with late-reported sales.
Comparing median sales prices between neighborhoods is not apples to apples, since the median sizes of homes (and other characteristics) vary so widely. Generally speaking, the most expensive neighborhoods have both the largest homes and the highest dollar per square foot values.
The median house size for the entire city is 3 bedrooms, 2 baths, 1791 sq.ft. with a median lot size is .06 acre.
Square footage is based upon interior living space and doesn’t include garages, attics, basements, rooms built without permit, decks, patios or lot size.
San Francisco Neighborhoods with Most House Sales
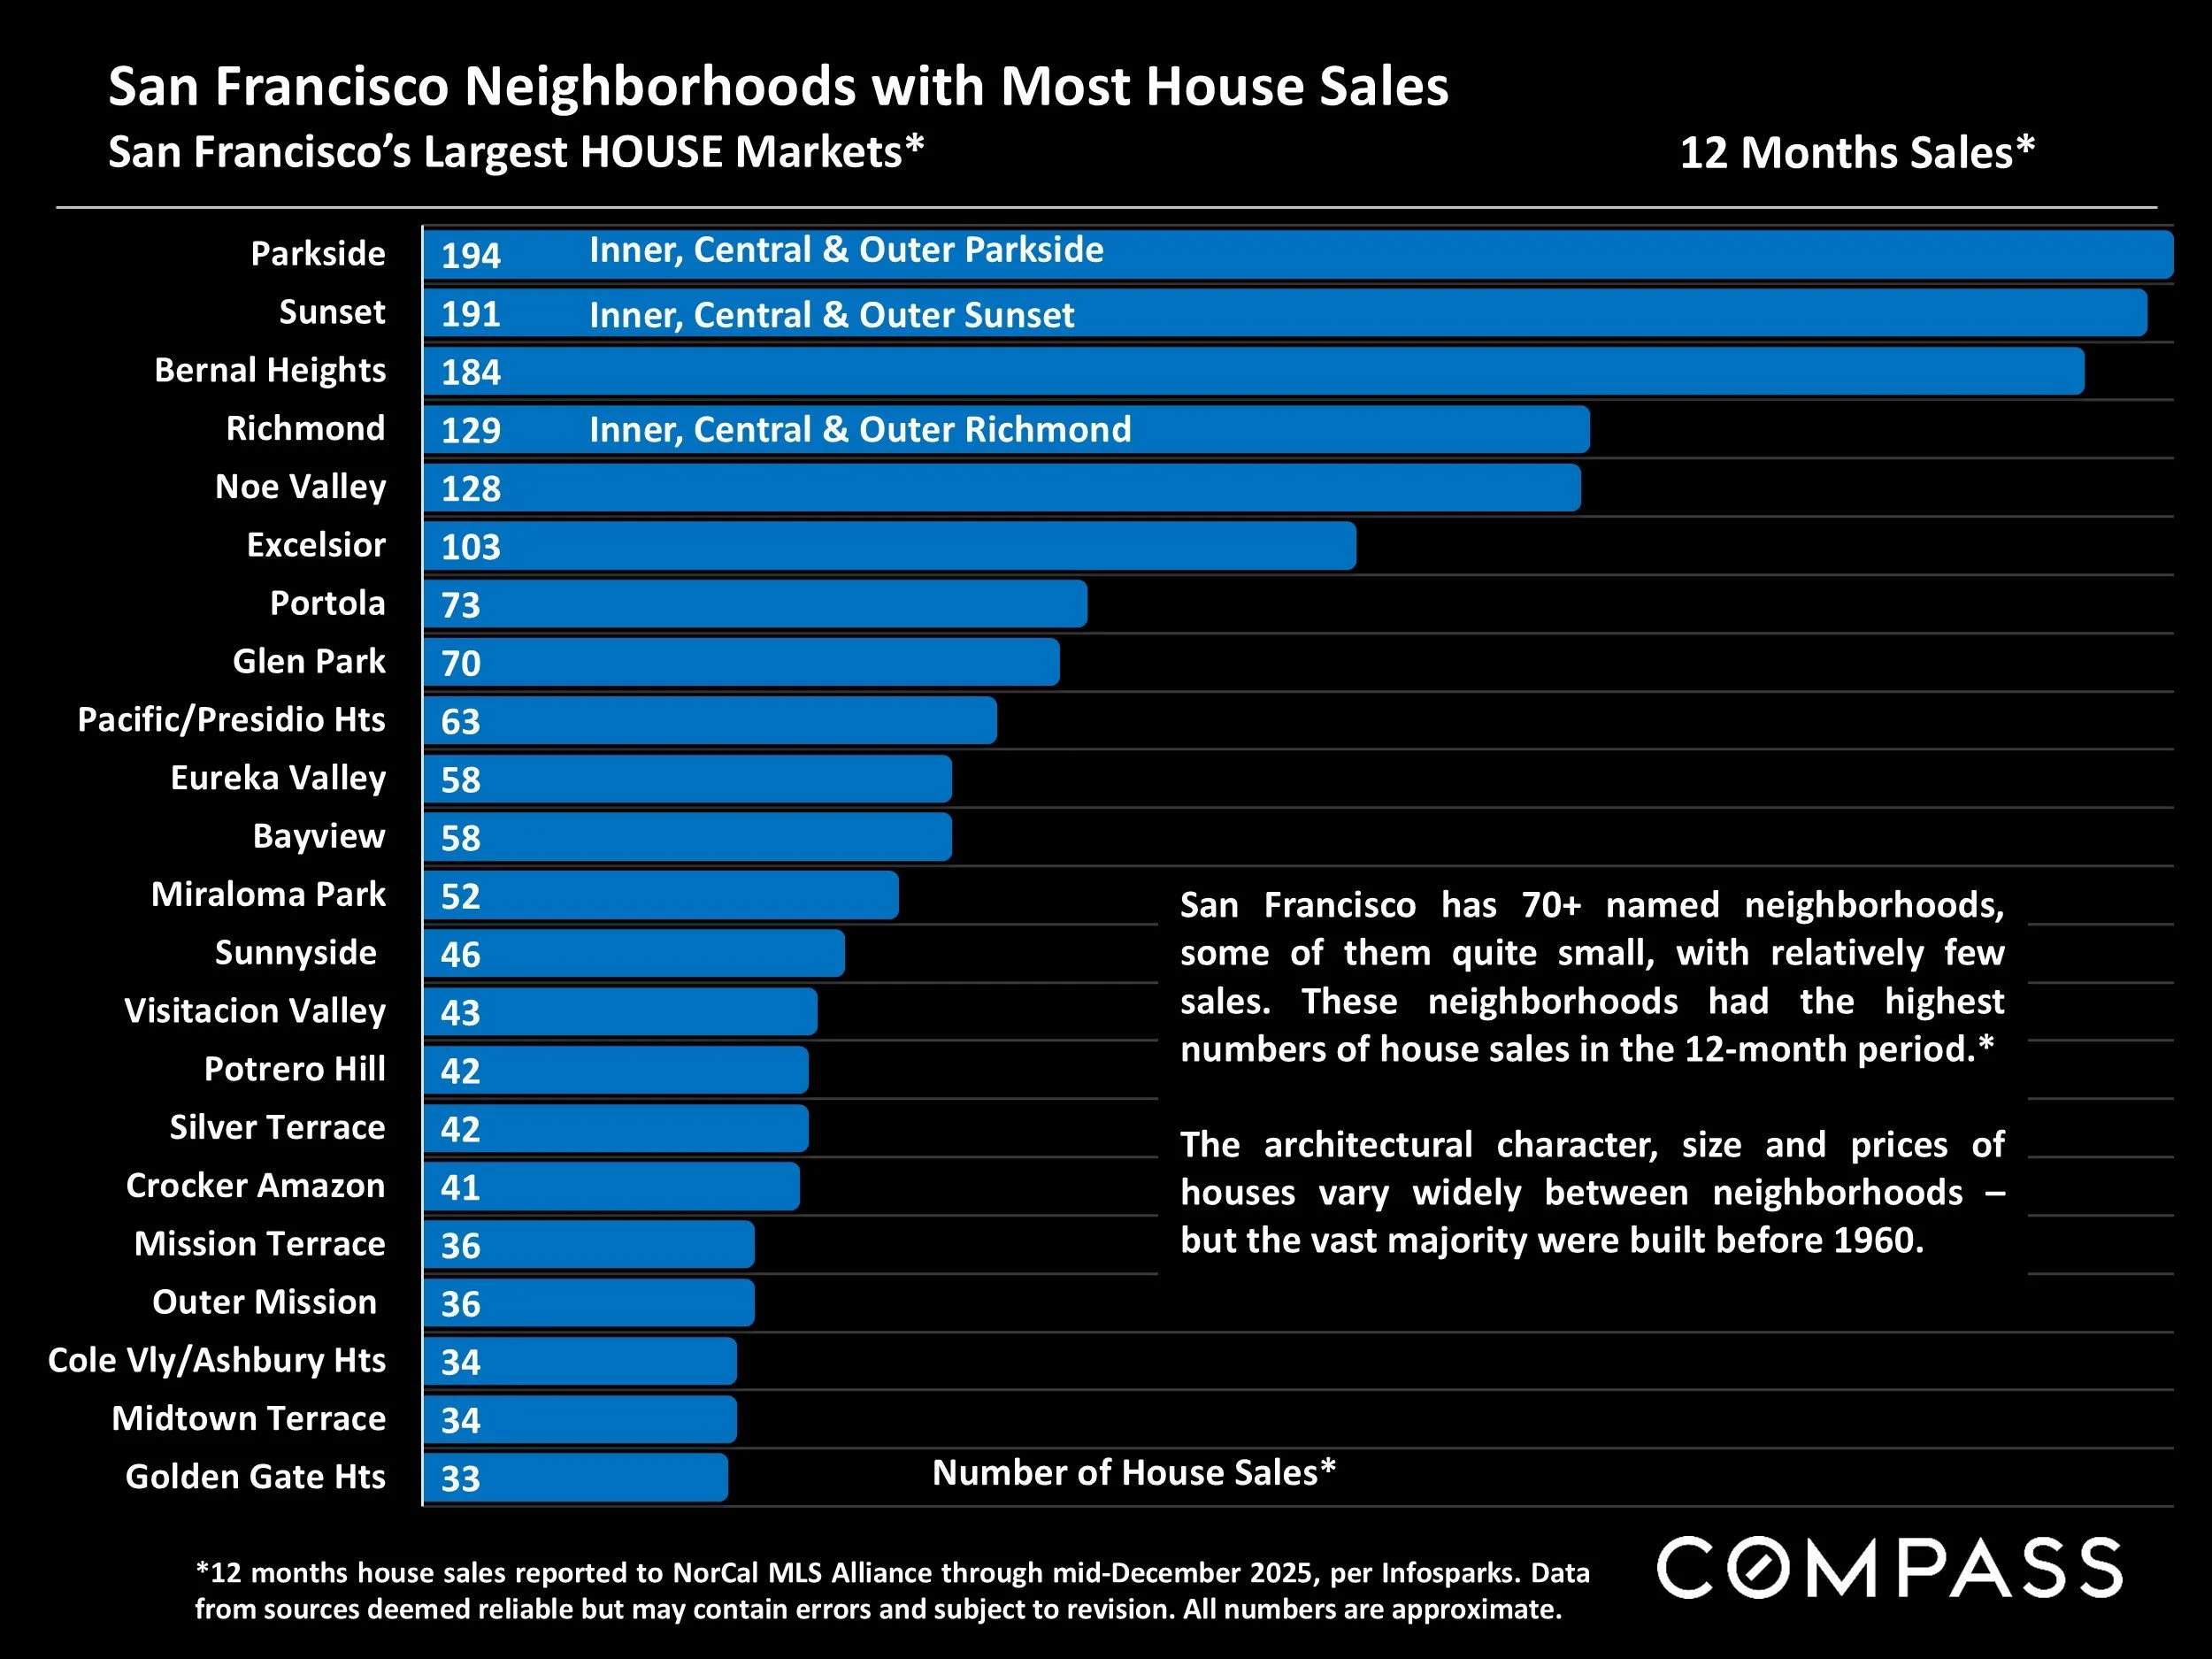
San Francisco’s Largest HOUSE Markets*
*12 months house sales reported to NorCal MLS Alliance through mid-December 2025, per Infosparks. Data from sources deemed reliable but may contain errors and subject to revision. All numbers are approximate.
San Francisco has 70+ named neighborhoods, some of them quite small, with relatively few sales. These neighborhoods had the highest numbers of house sales in the 12-month period.*
The architectural character, size and prices of houses vary widely between neighborhoods – but the vast majority were built before 1960.
Average Days on Market to Acceptance of Offer
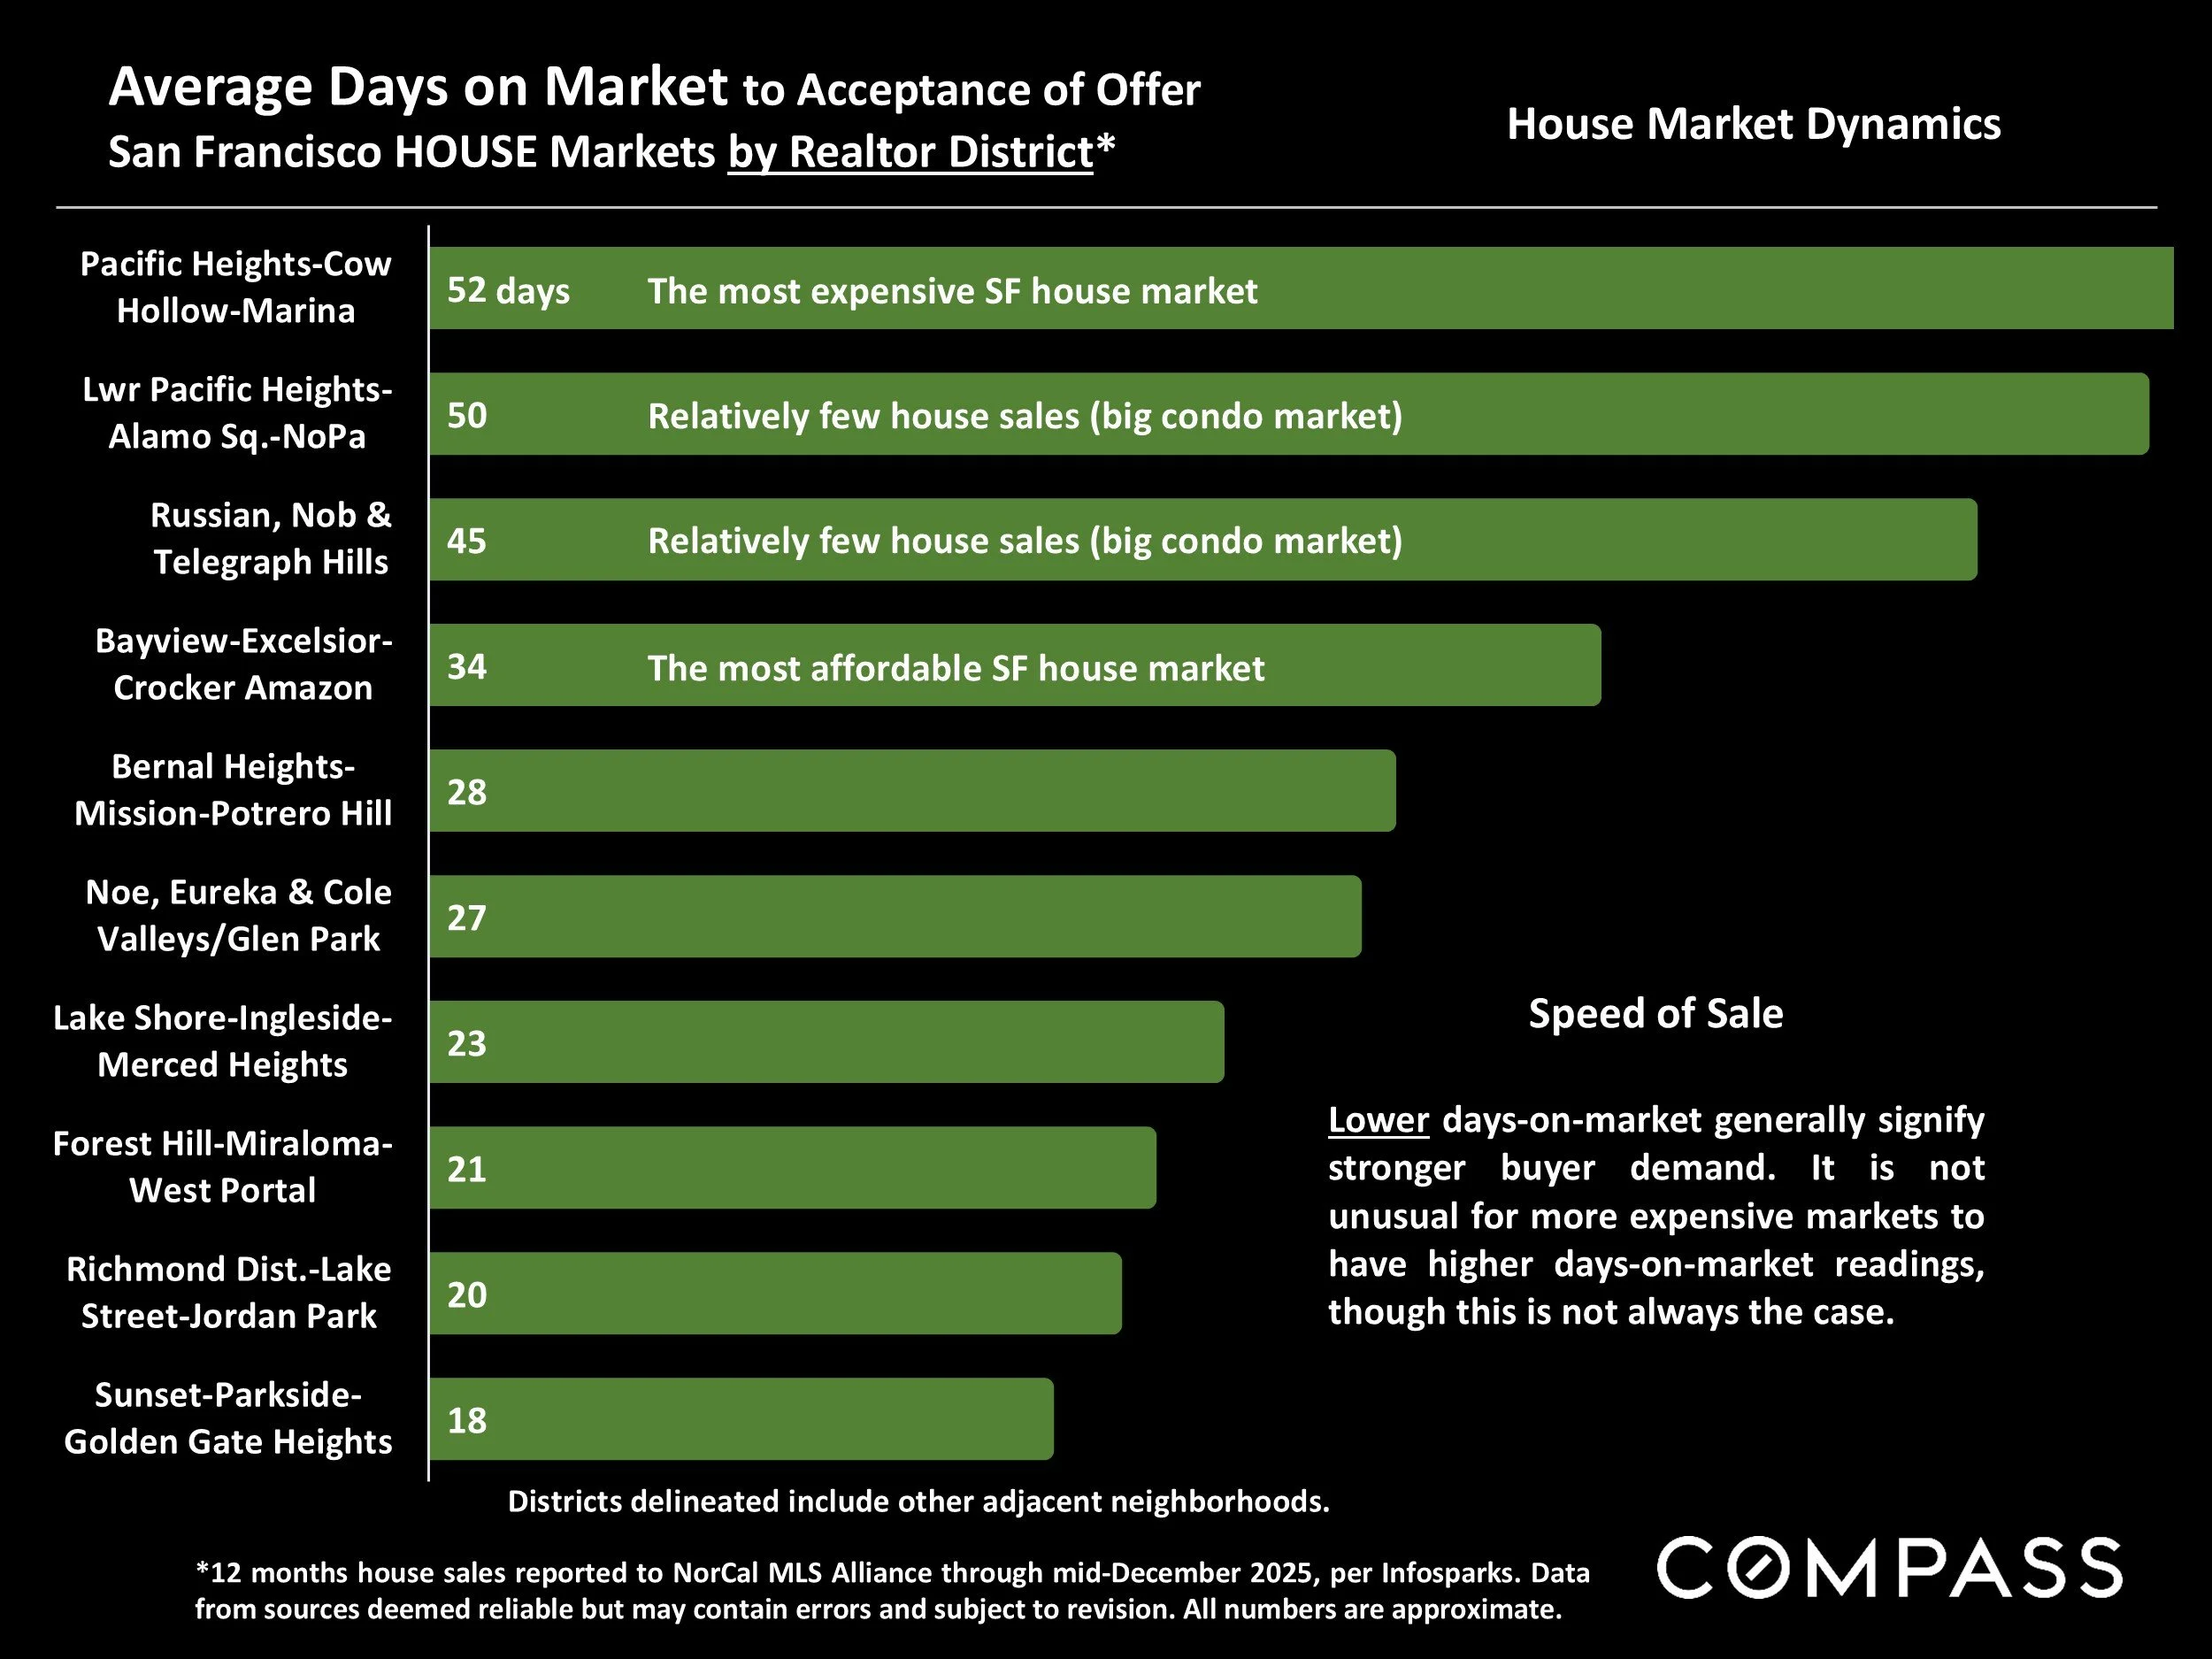
San Francisco HOUSE Markets by Realtor District*
*12 months house sales reported to NorCal MLS Alliance through mid-December 2025, per Infosparks. Data from sources deemed reliable but may contain errors and subject to revision. All numbers are approximate.
Lower days-on-market generally signify stronger buyer demand. It is not unusual for more expensive markets to have higher days-on-market readings, though this is not always the case.
Percentage of Listings Selling Over List Price
San Francisco HOUSE Markets by Realtor District*

*12 months house sales reported to NorCal MLS Alliance through mid-December 2025, per Infosparks. Data from sources deemed reliable but may contain errors and subject to revision. All numbers are approximate.
Higher percentages of sales over list price typically signify greater buyer competition for new listings, but this statistic can be distorted by strategic underpricing strategies by sellers and listing agents.
Average Overbid & Underbid Percentages
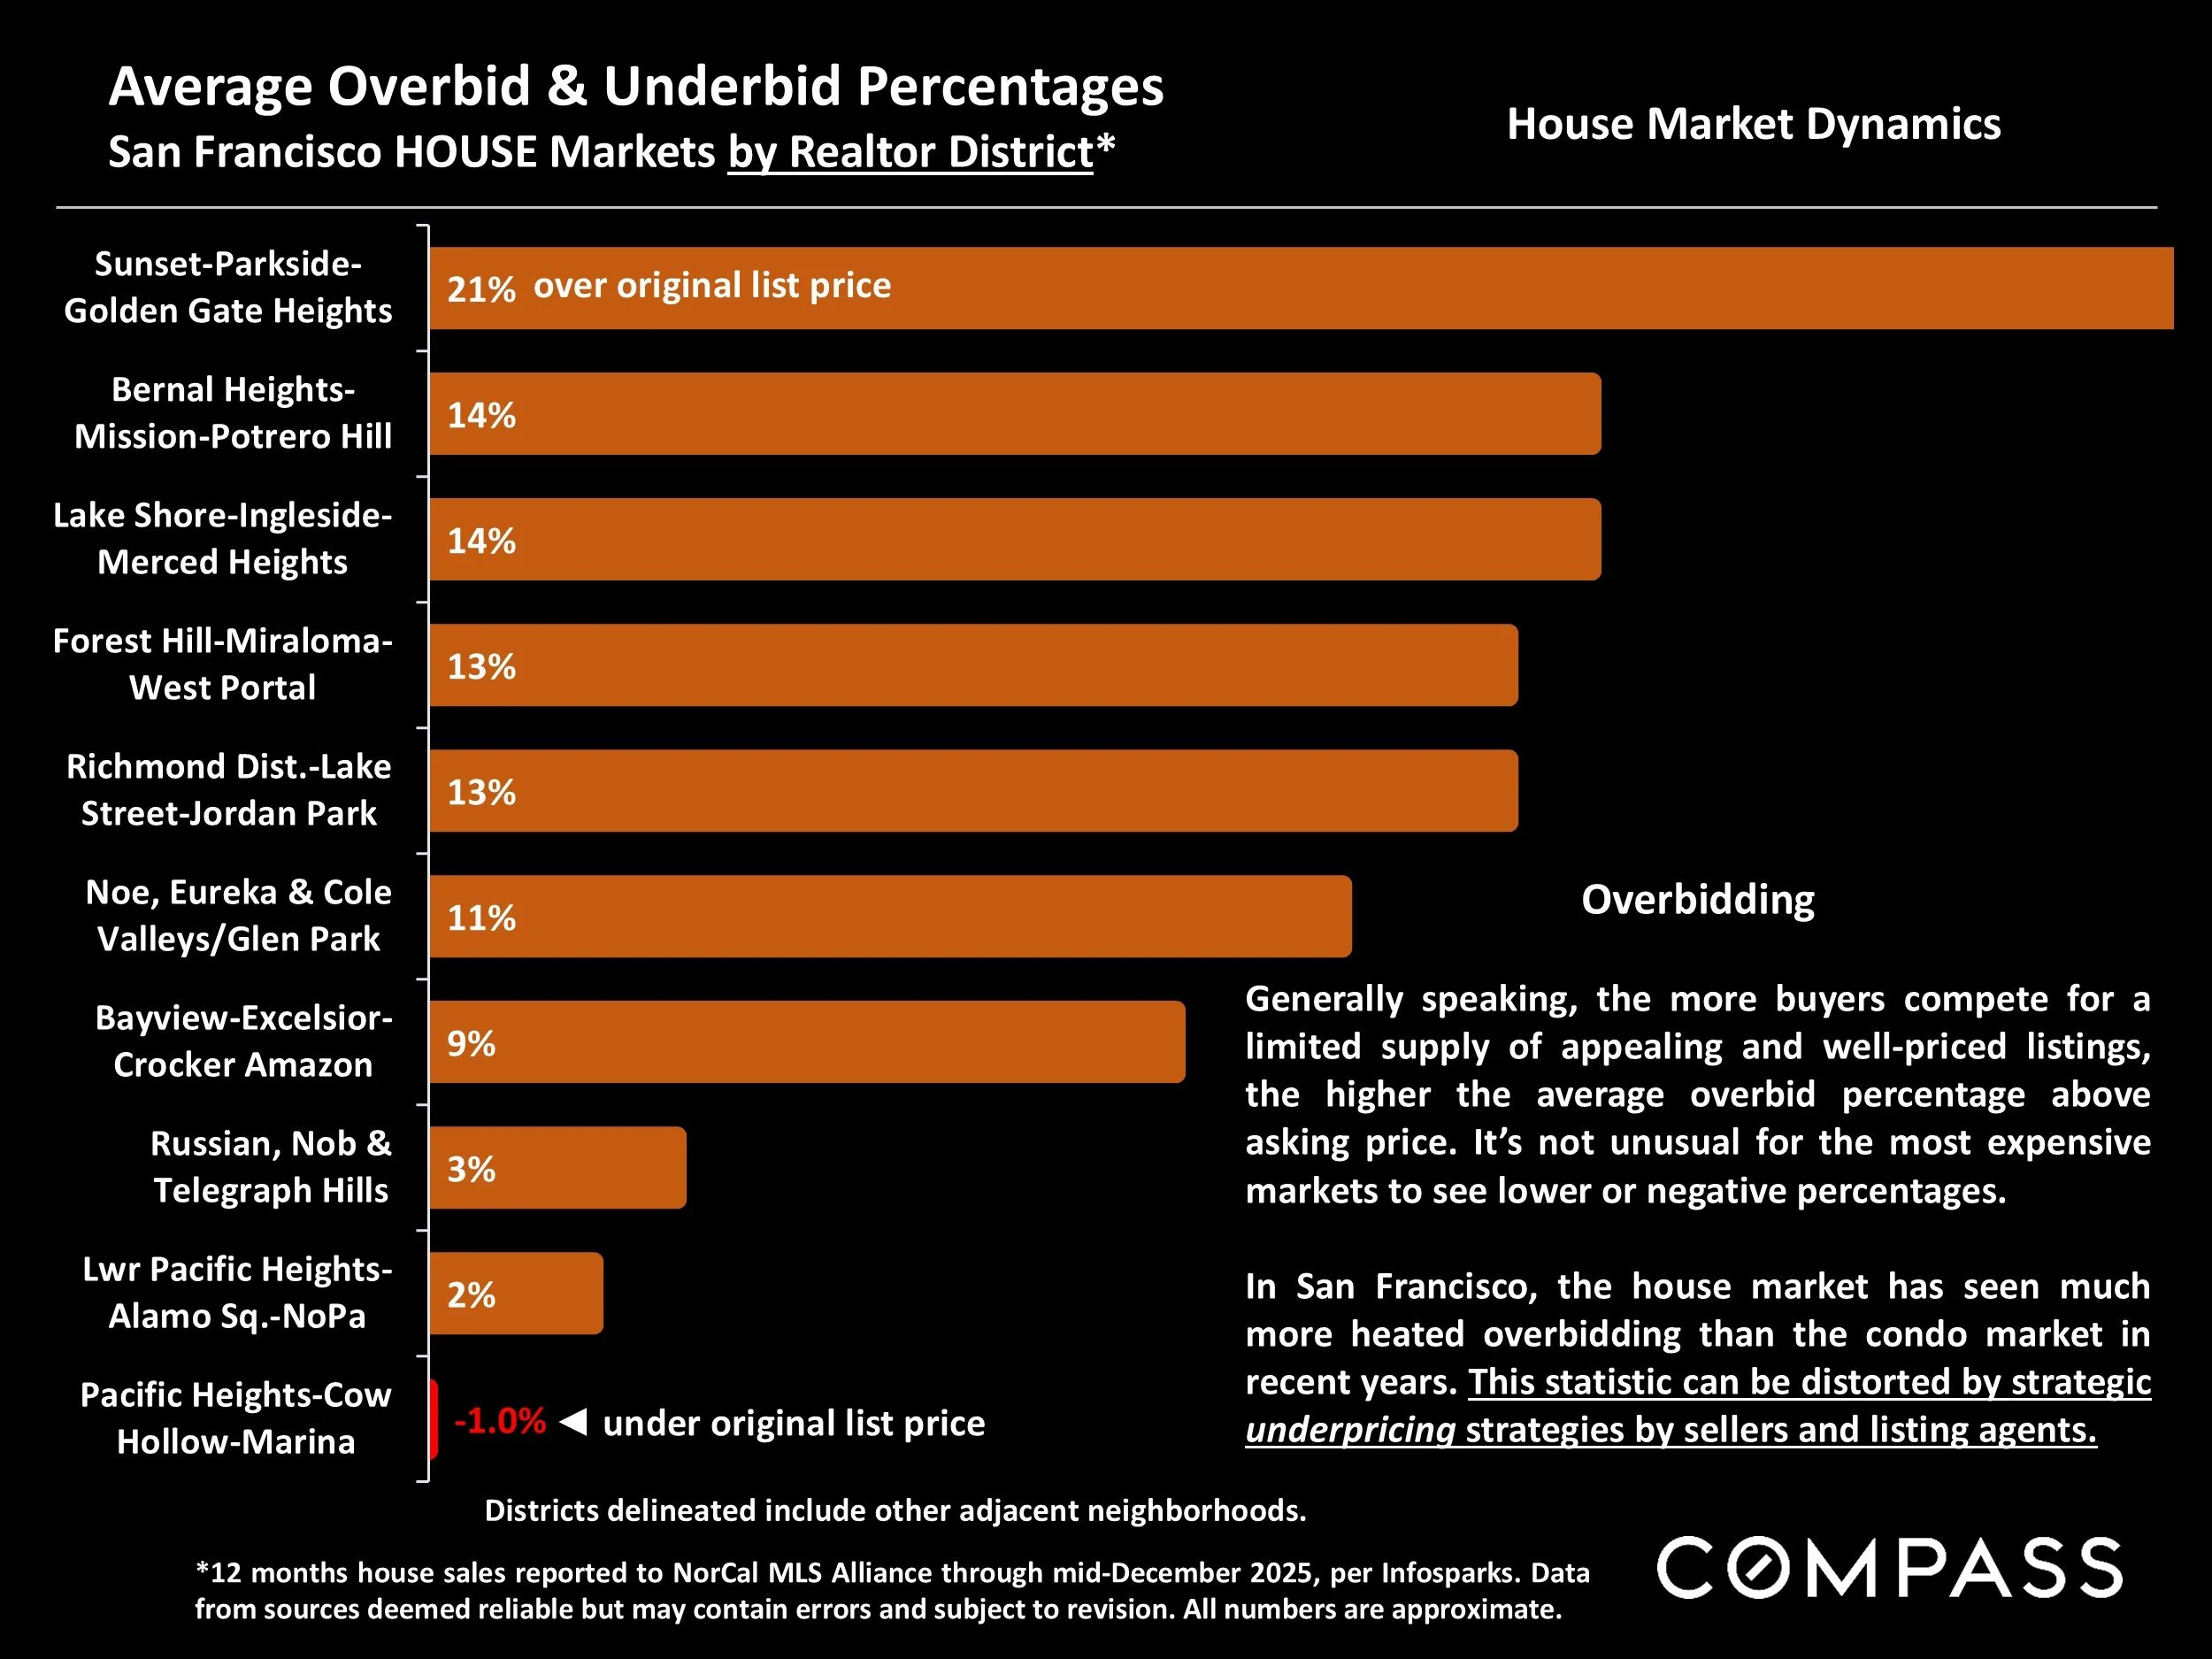
San Francisco HOUSE Markets by Realtor District*
*12 months house sales reported to NorCal MLS Alliance through mid-December 2025, per Infosparks. Data from sources deemed reliable but may contain errors and subject to revision. All numbers are approximate.
Generally speaking, the more buyers compete for a limited supply of appealing and well-priced listings, the higher the average overbid percentage above asking price. It’s not unusual for the most expensive markets to see lower or negative percentages.
In San Francisco, the house market has seen much more heated overbidding than the condo market in recent years. This statistic can be distorted by strategic underpricing strategies by sellers and listing agents.
San Francisco Luxury Home Market
Sales of $5,000,000+, by District, 12 Months Sales*
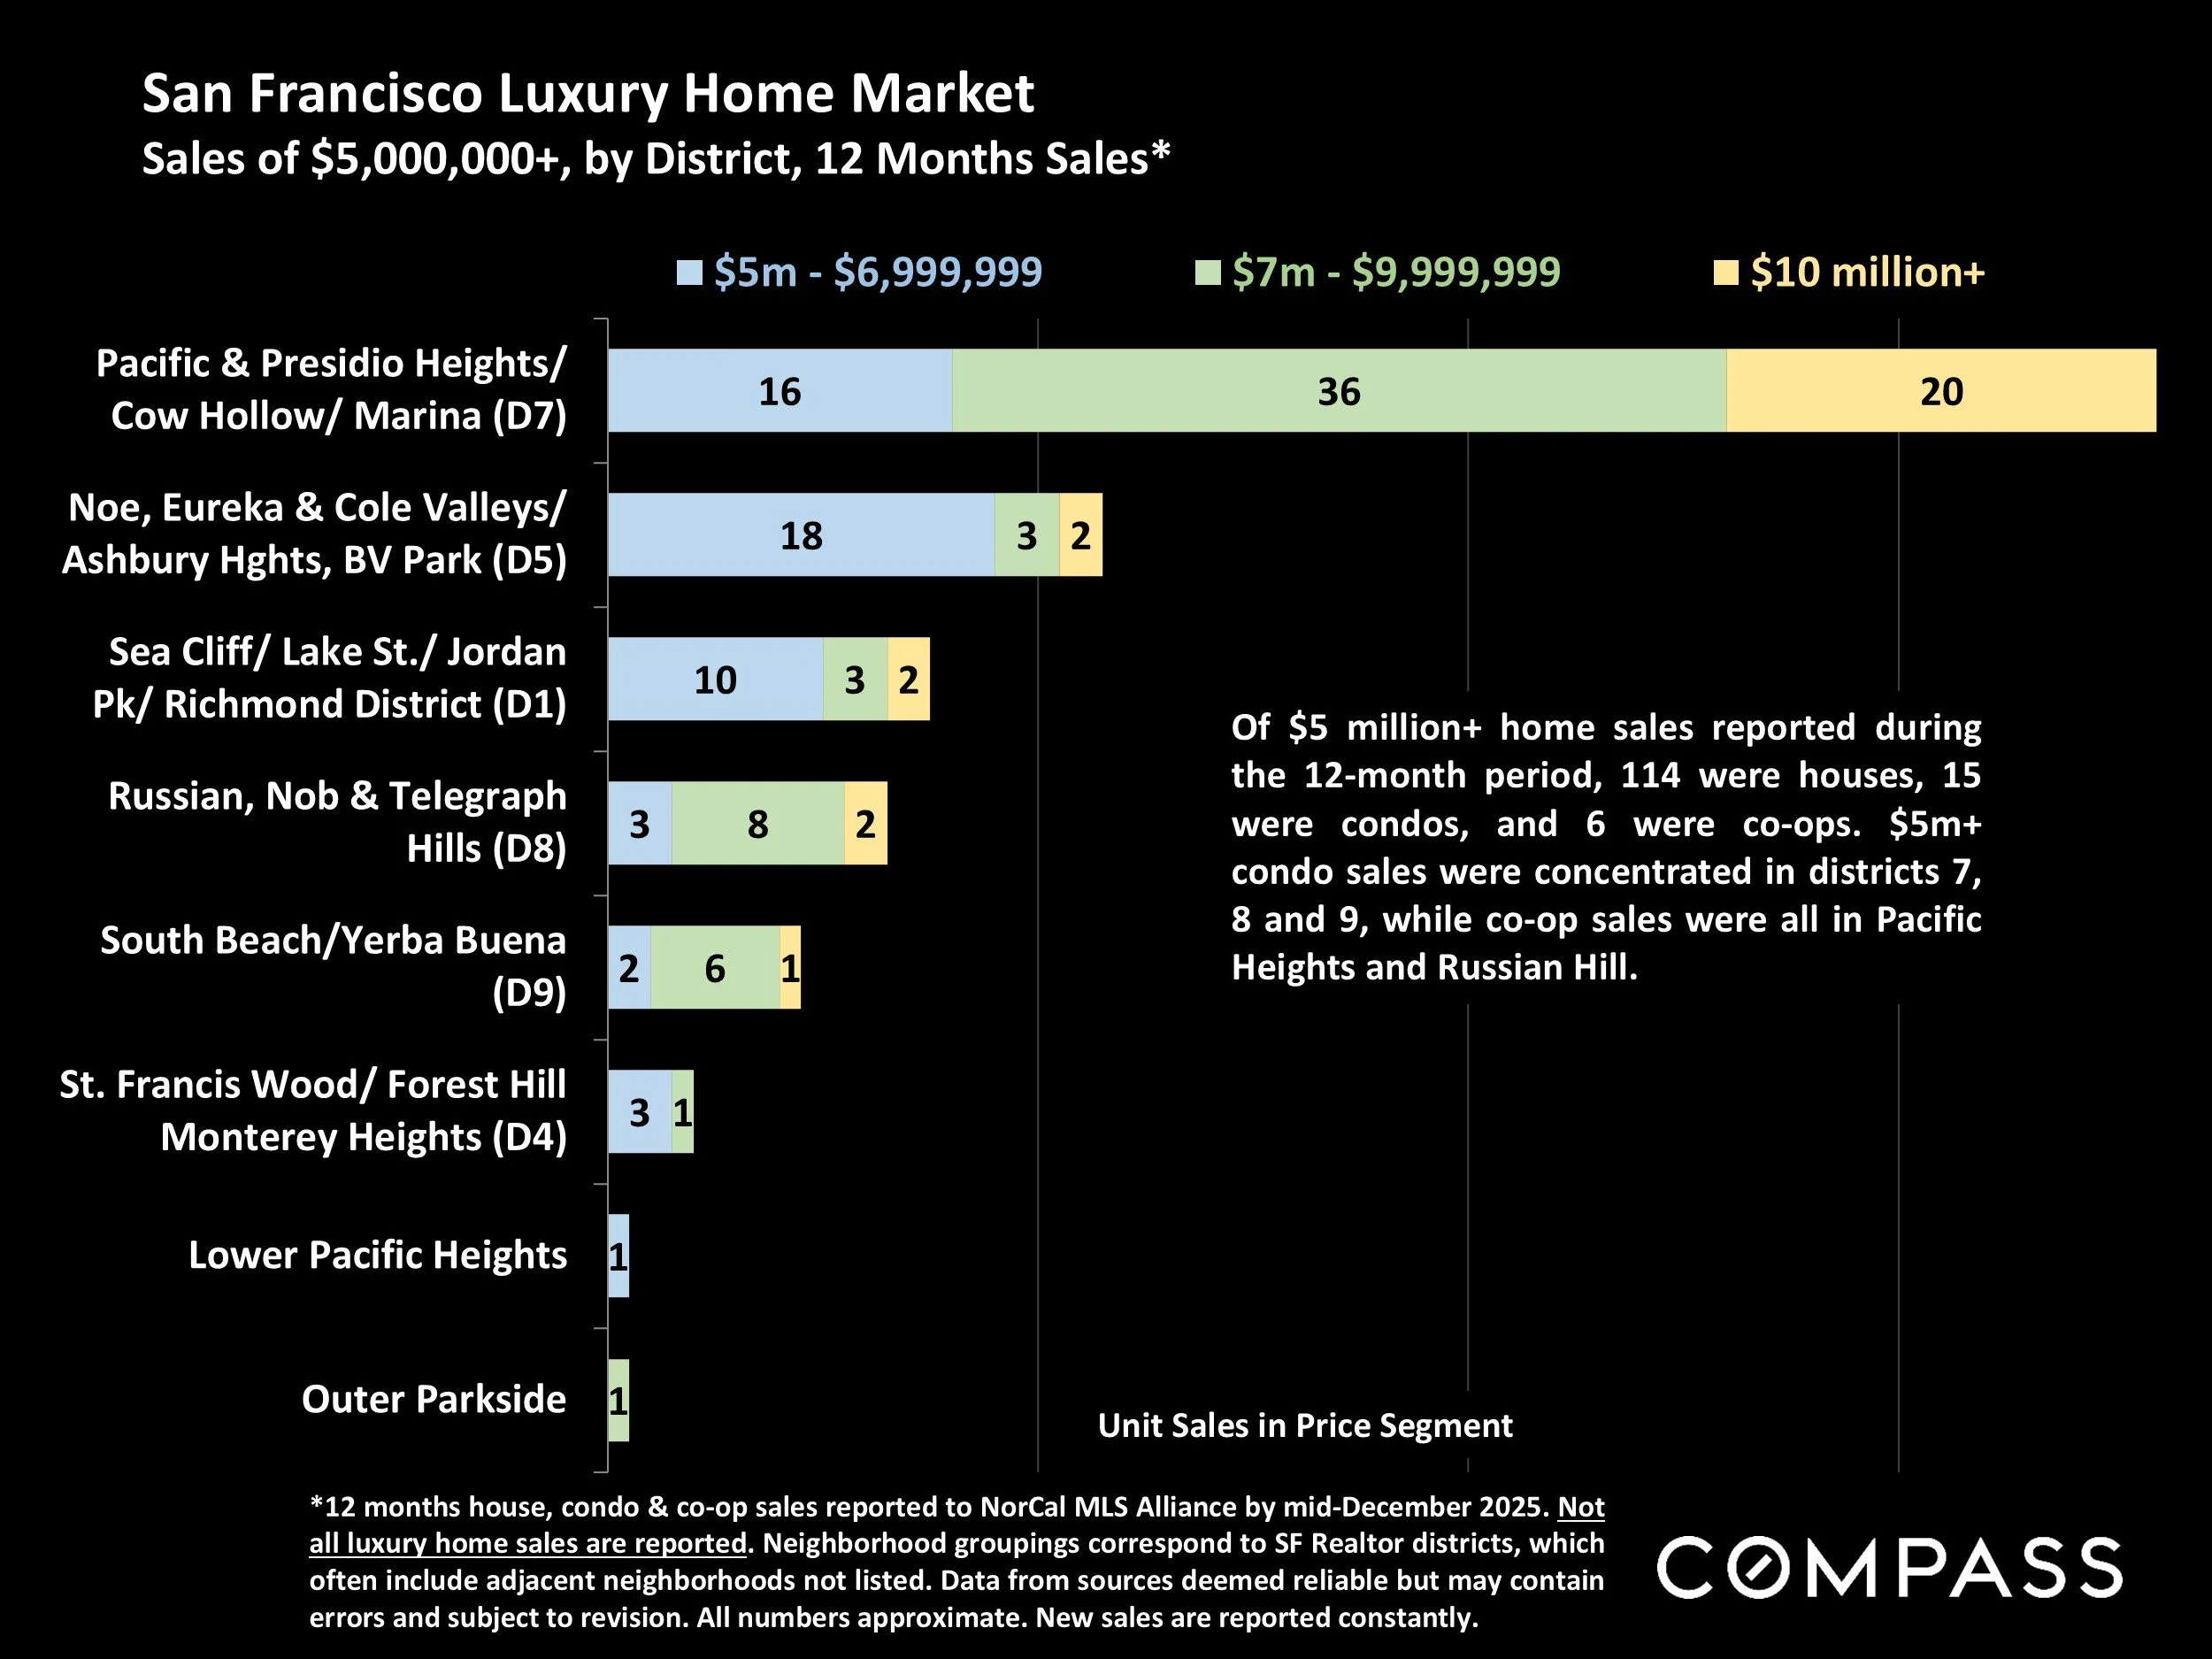
*12 months house, condo & co-op sales reported to NorCal MLS Alliance by mid-December 2025. Not all luxury home sales are reported. Neighborhood groupings correspond to SF Realtor districts, which often include adjacent neighborhoods not listed. Data from sources deemed reliable but may contain errors and subject to revision. All numbers approximate. New sales are reported constantly.
Of $5 million+ home sales reported during the 12-month period, 114 were houses, 15 were condos, and 6 were co-ops. $5m+ condo sales were concentrated in districts 7, 8 and 9, while co-op sales were all in Pacific Heights and Russian Hill.
Median House Sales Prices & Annual Appreciation Calculations
The 2025 SF district median house sales price calculations on the following annual-trend charts are based on calendar-year sales reported to NorCal MLS Alliance by early January 2026. They may change as late-reported sales are entered into MLS: A few additional home sales may alter the median sales price, especially in smaller markets.
Median home sales prices are not like stock prices where each share sold is essentially the same product period to period: Median home prices are calculated using differing collections of unique home sales occurring in each period measured. There is no such thing as an unchanging “median house” whose change in value can be determined at different times. The median size of houses sold can sometimes vary significantly period to period, or within a city, sales in one district neighborhood increase while declining in another. Sales in different price segments can be affected differently by economic circumstances such as interest rates or stock markets. All these situations can impact median sales prices in ways unrelated to fair market value.
Therefore, changes in median sales prices are not exact measurements of area appreciation or depreciation, but using large datasets, they typically generate fairly reliable indicators of general trends in fair market values. (Expensive markets with relatively small sales volumes occurring over wide ranges of sales prices are most prone to anomalous fluctuations in median prices.)
How median sales prices and appreciation calculations apply to any particular home is unknown without a specific comparative market analysis.
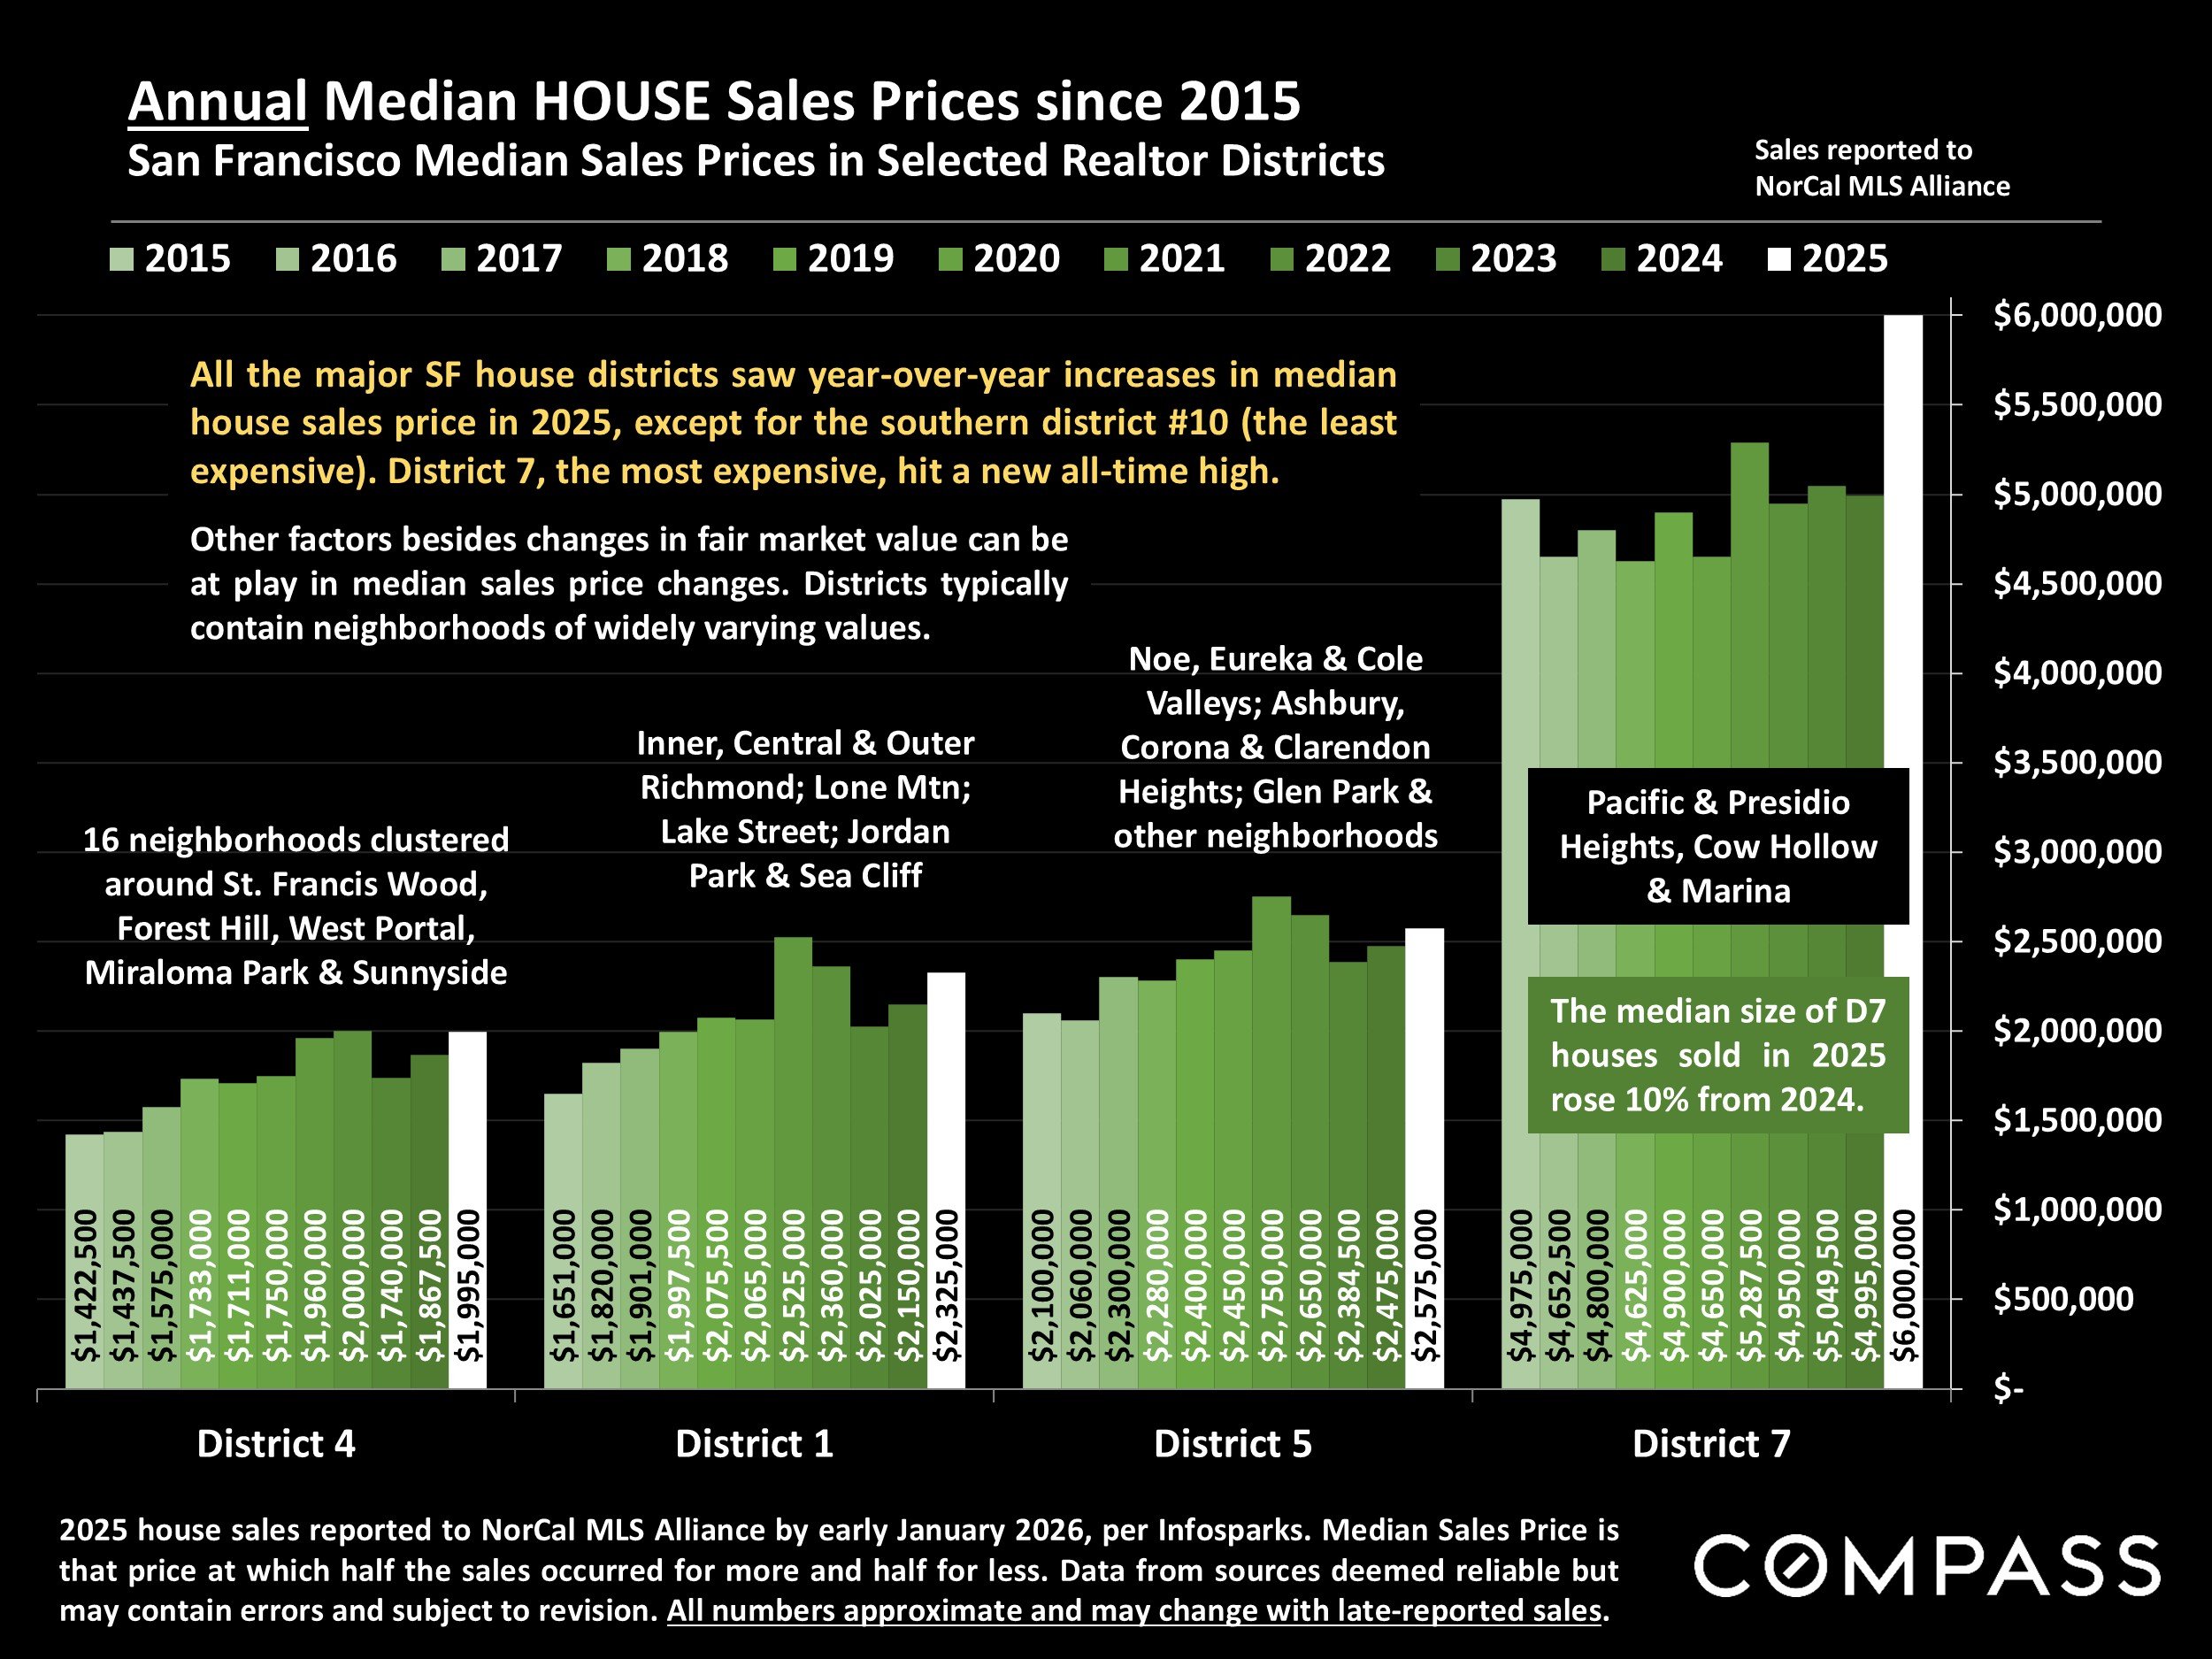
Annual Median HOUSE Sales Prices since 2015
San Francisco Median Sales Prices in Selected Realtor Districts
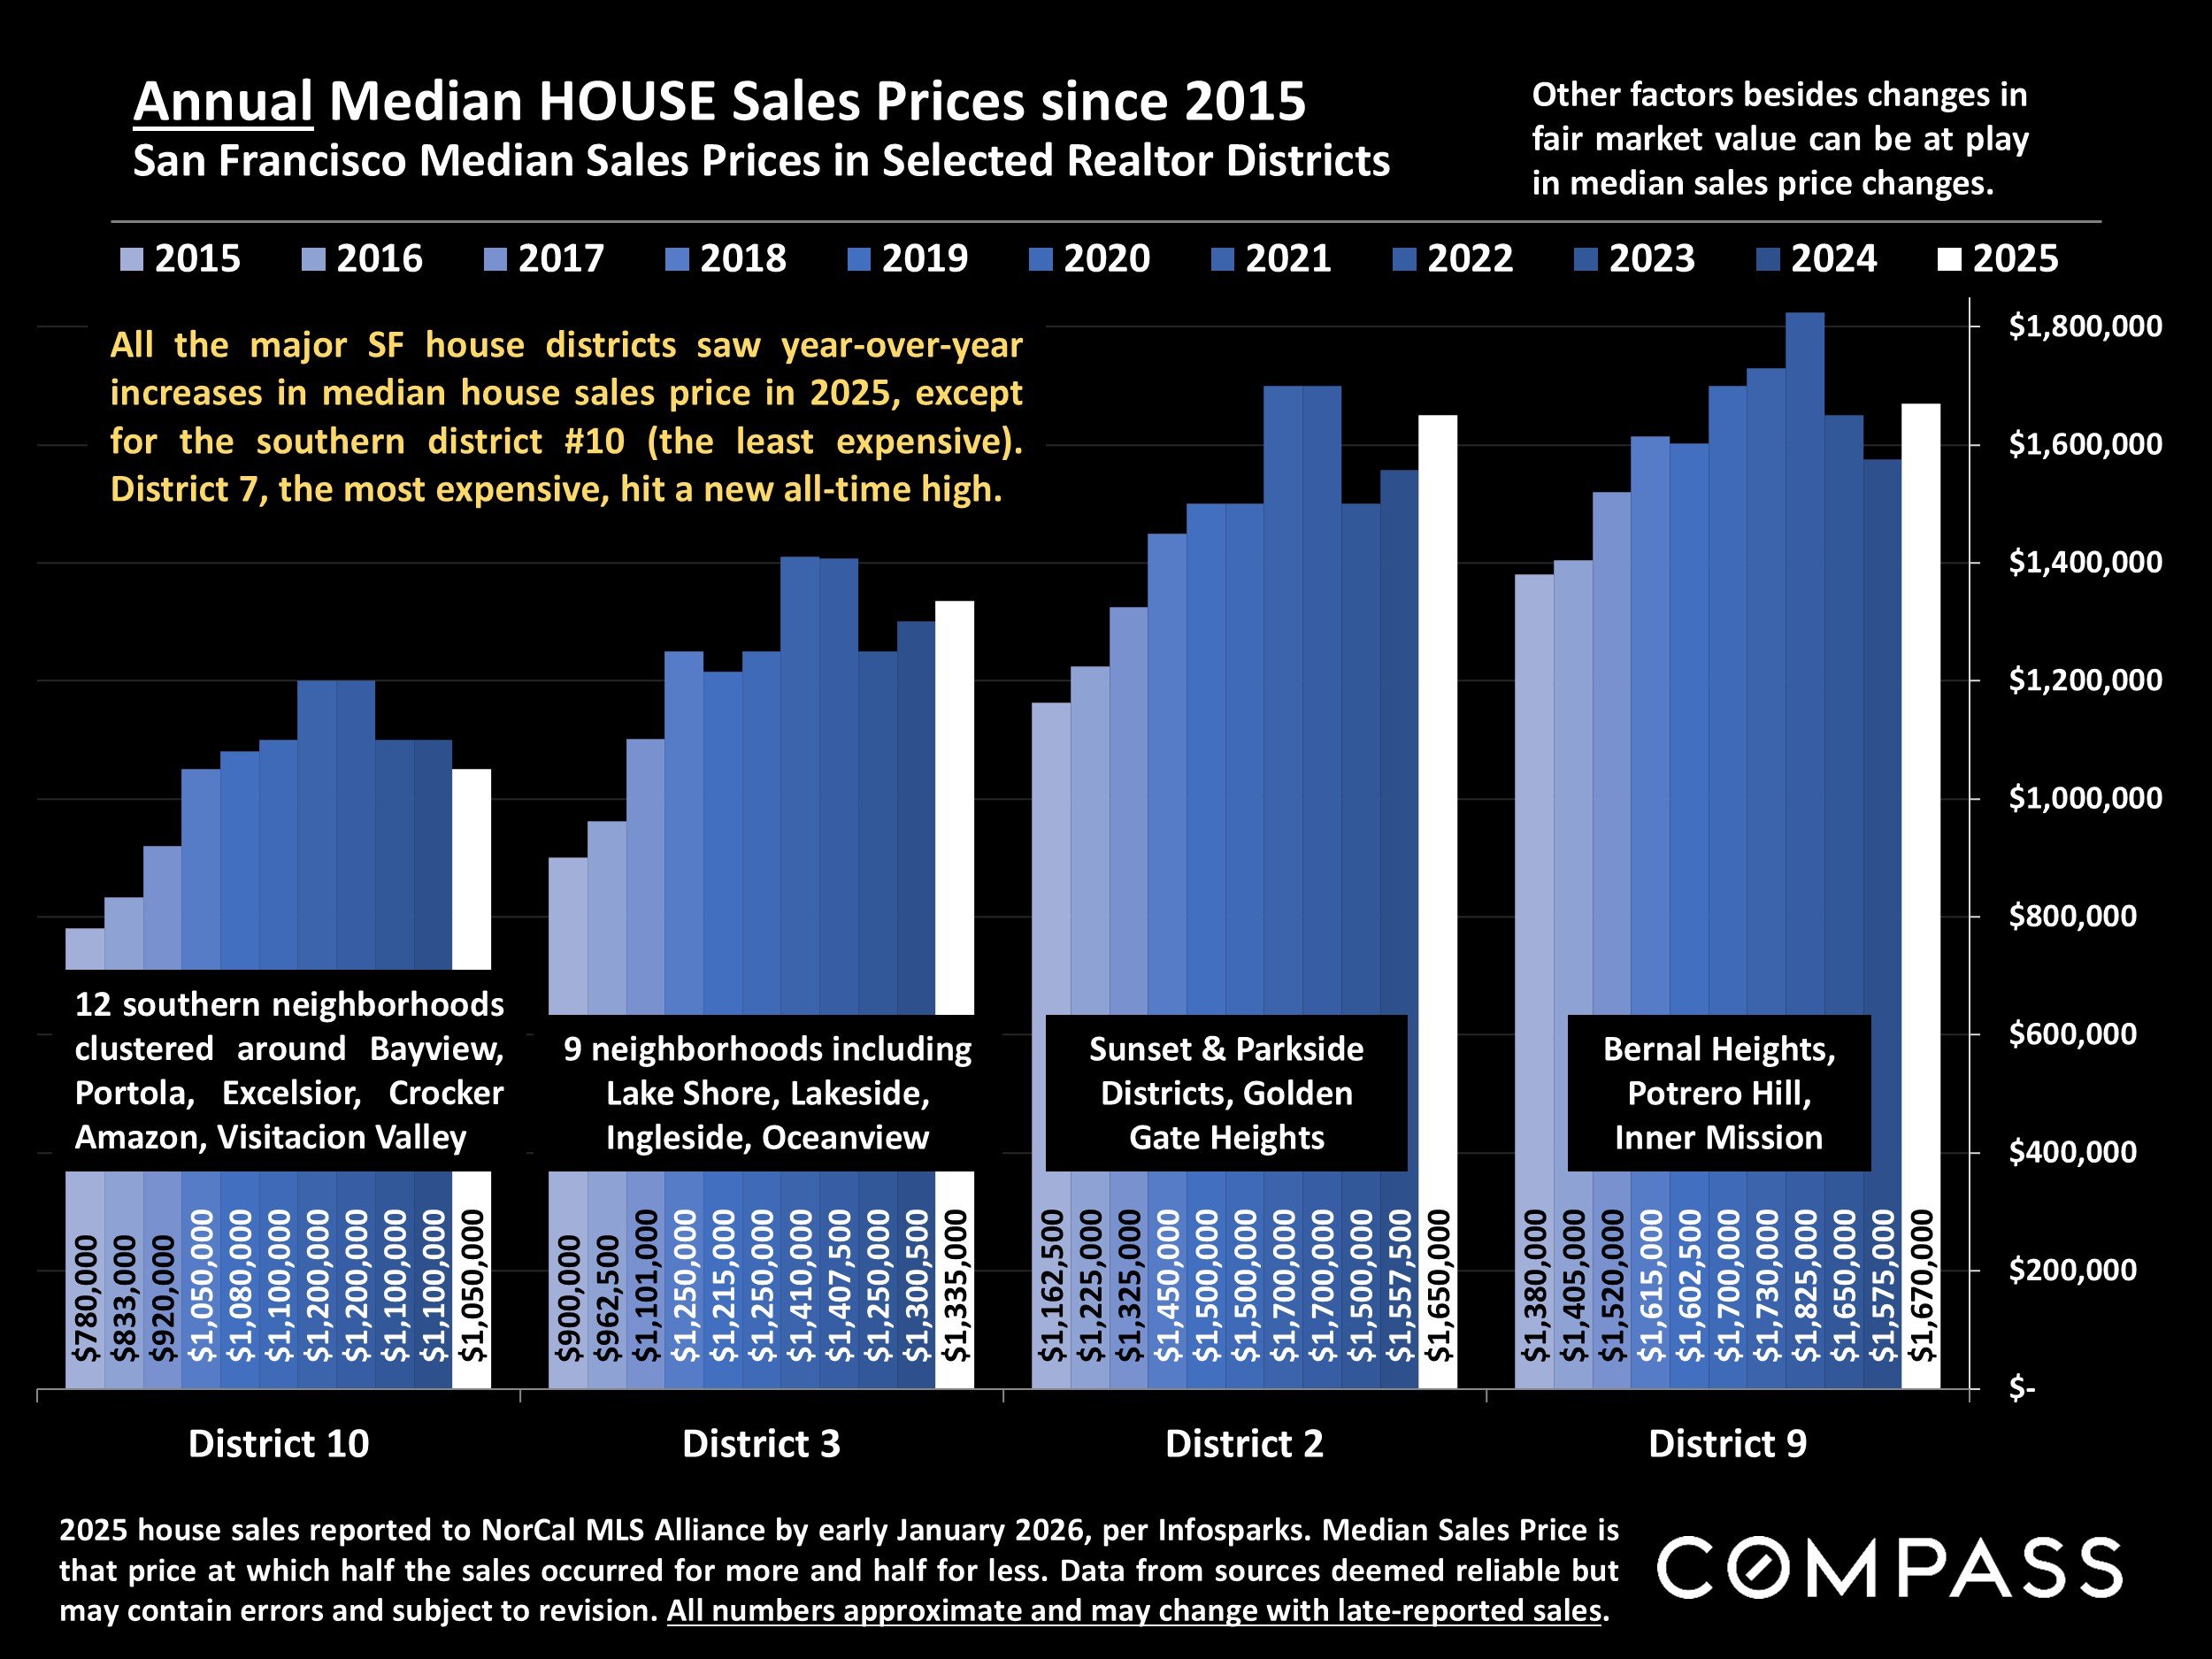
2025 house sales reported to NorCal MLS Alliance by early January 2026, per Infosparks. Median Sales Price is that price at which half the sales occurred for more and half for less. Data from sources deemed reliable but may contain errors and subject to revision. All numbers approximate and may change with late-reported sales.
All the major SF house districts saw year-over-year increases in median house sales price in 2025, except for the southern district #10 (the least expensive). District 7, the most expensive, hit a new all-time high.
Other factors besides changes in fair market value can be at play in median sales price changes.
San Francisco CONDO Markets By Neighborhood & Realtor District
Generally speaking, the city’s house market has seen more heated market dynamics than its condo market, though the details vary by neighborhood and district. 12-month data removes seasonality from calculations and provides a larger, more reliable data set, but may lag short term developments.
Realtor districts can contain neighborhoods of widely varying demographics and characteristics, housing types and values: The numbers in this report are generalities, and how they apply to any particular property is unknown without a specific comparative market analysis. Statistics are generalities and anomalous fluctuations in statistics are not uncommon, especially in smaller district and neighborhood markets with fewer sales and wide ranges in sales prices. The time period for each analysis is delineated at the bottom of the chart.
Median CONDO Sales Prices – Selected Neighborhoods
*12 months condo sales reported to NorCal MLS Alliance through mid-December 2025. Data from sources deemed reliable but may contain errors and subject to revision. All numbers approximate and may change with late-reported sales. A few other neighborhoods not listed also had sales of $3 million+.
Median sales price is that price at which half the sales occurred for more and half for less. Many factors affect condo prices: square footage, architectural style, views, quality of construction, the floor the unit is on, condition, HOA amenities and cost, deeded outdoor space, parking, and so on.
Median CONDO $/Sq.Ft. Values – Selected Neighborhoods
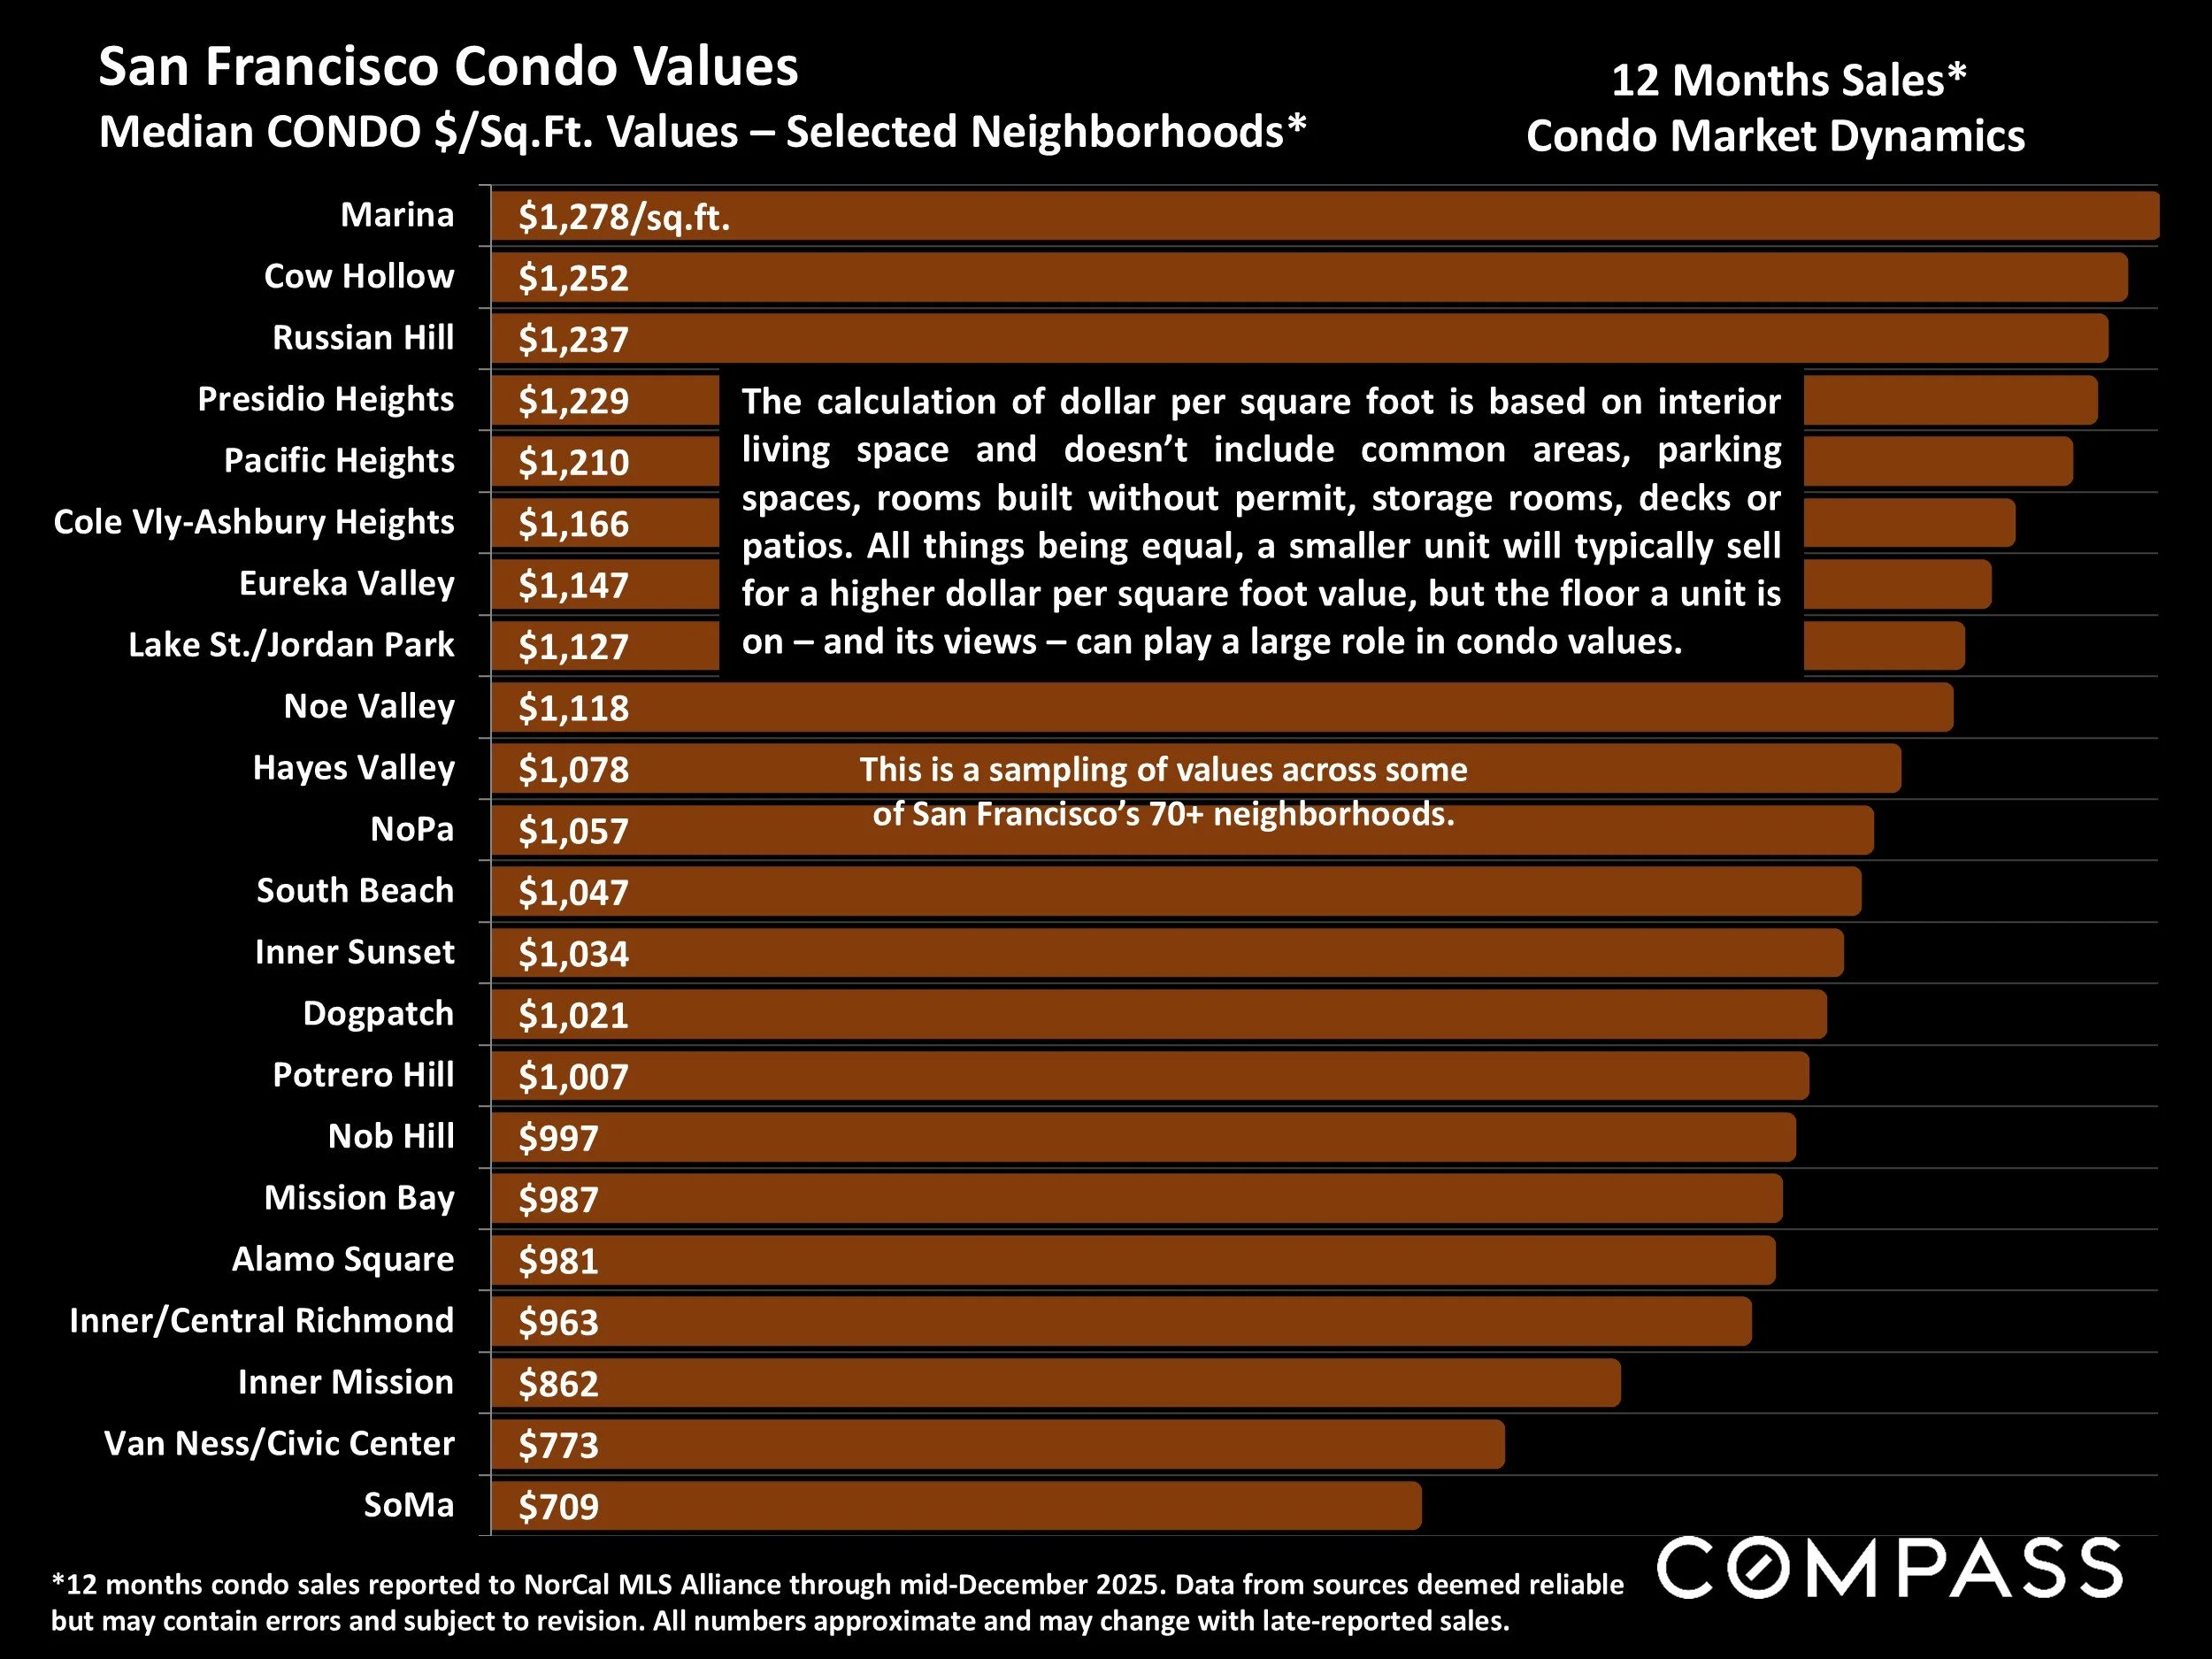
*12 months condo sales reported to NorCal MLS Alliance through mid-December 2025. Data from sources deemed reliable but may contain errors and subject to revision. All numbers approximate and may change with late-reported sales.
The calculation of dollar per square foot is based on interior living space and doesn’t include common areas, parking spaces, rooms built without permit, storage rooms, decks or patios. All things being equal, a smaller unit will typically sell for a higher dollar per square foot value, but the floor a unit is on – and its views – can play a large role in condo values.
Median CONDO Square Footage – Selected Neighborhoods
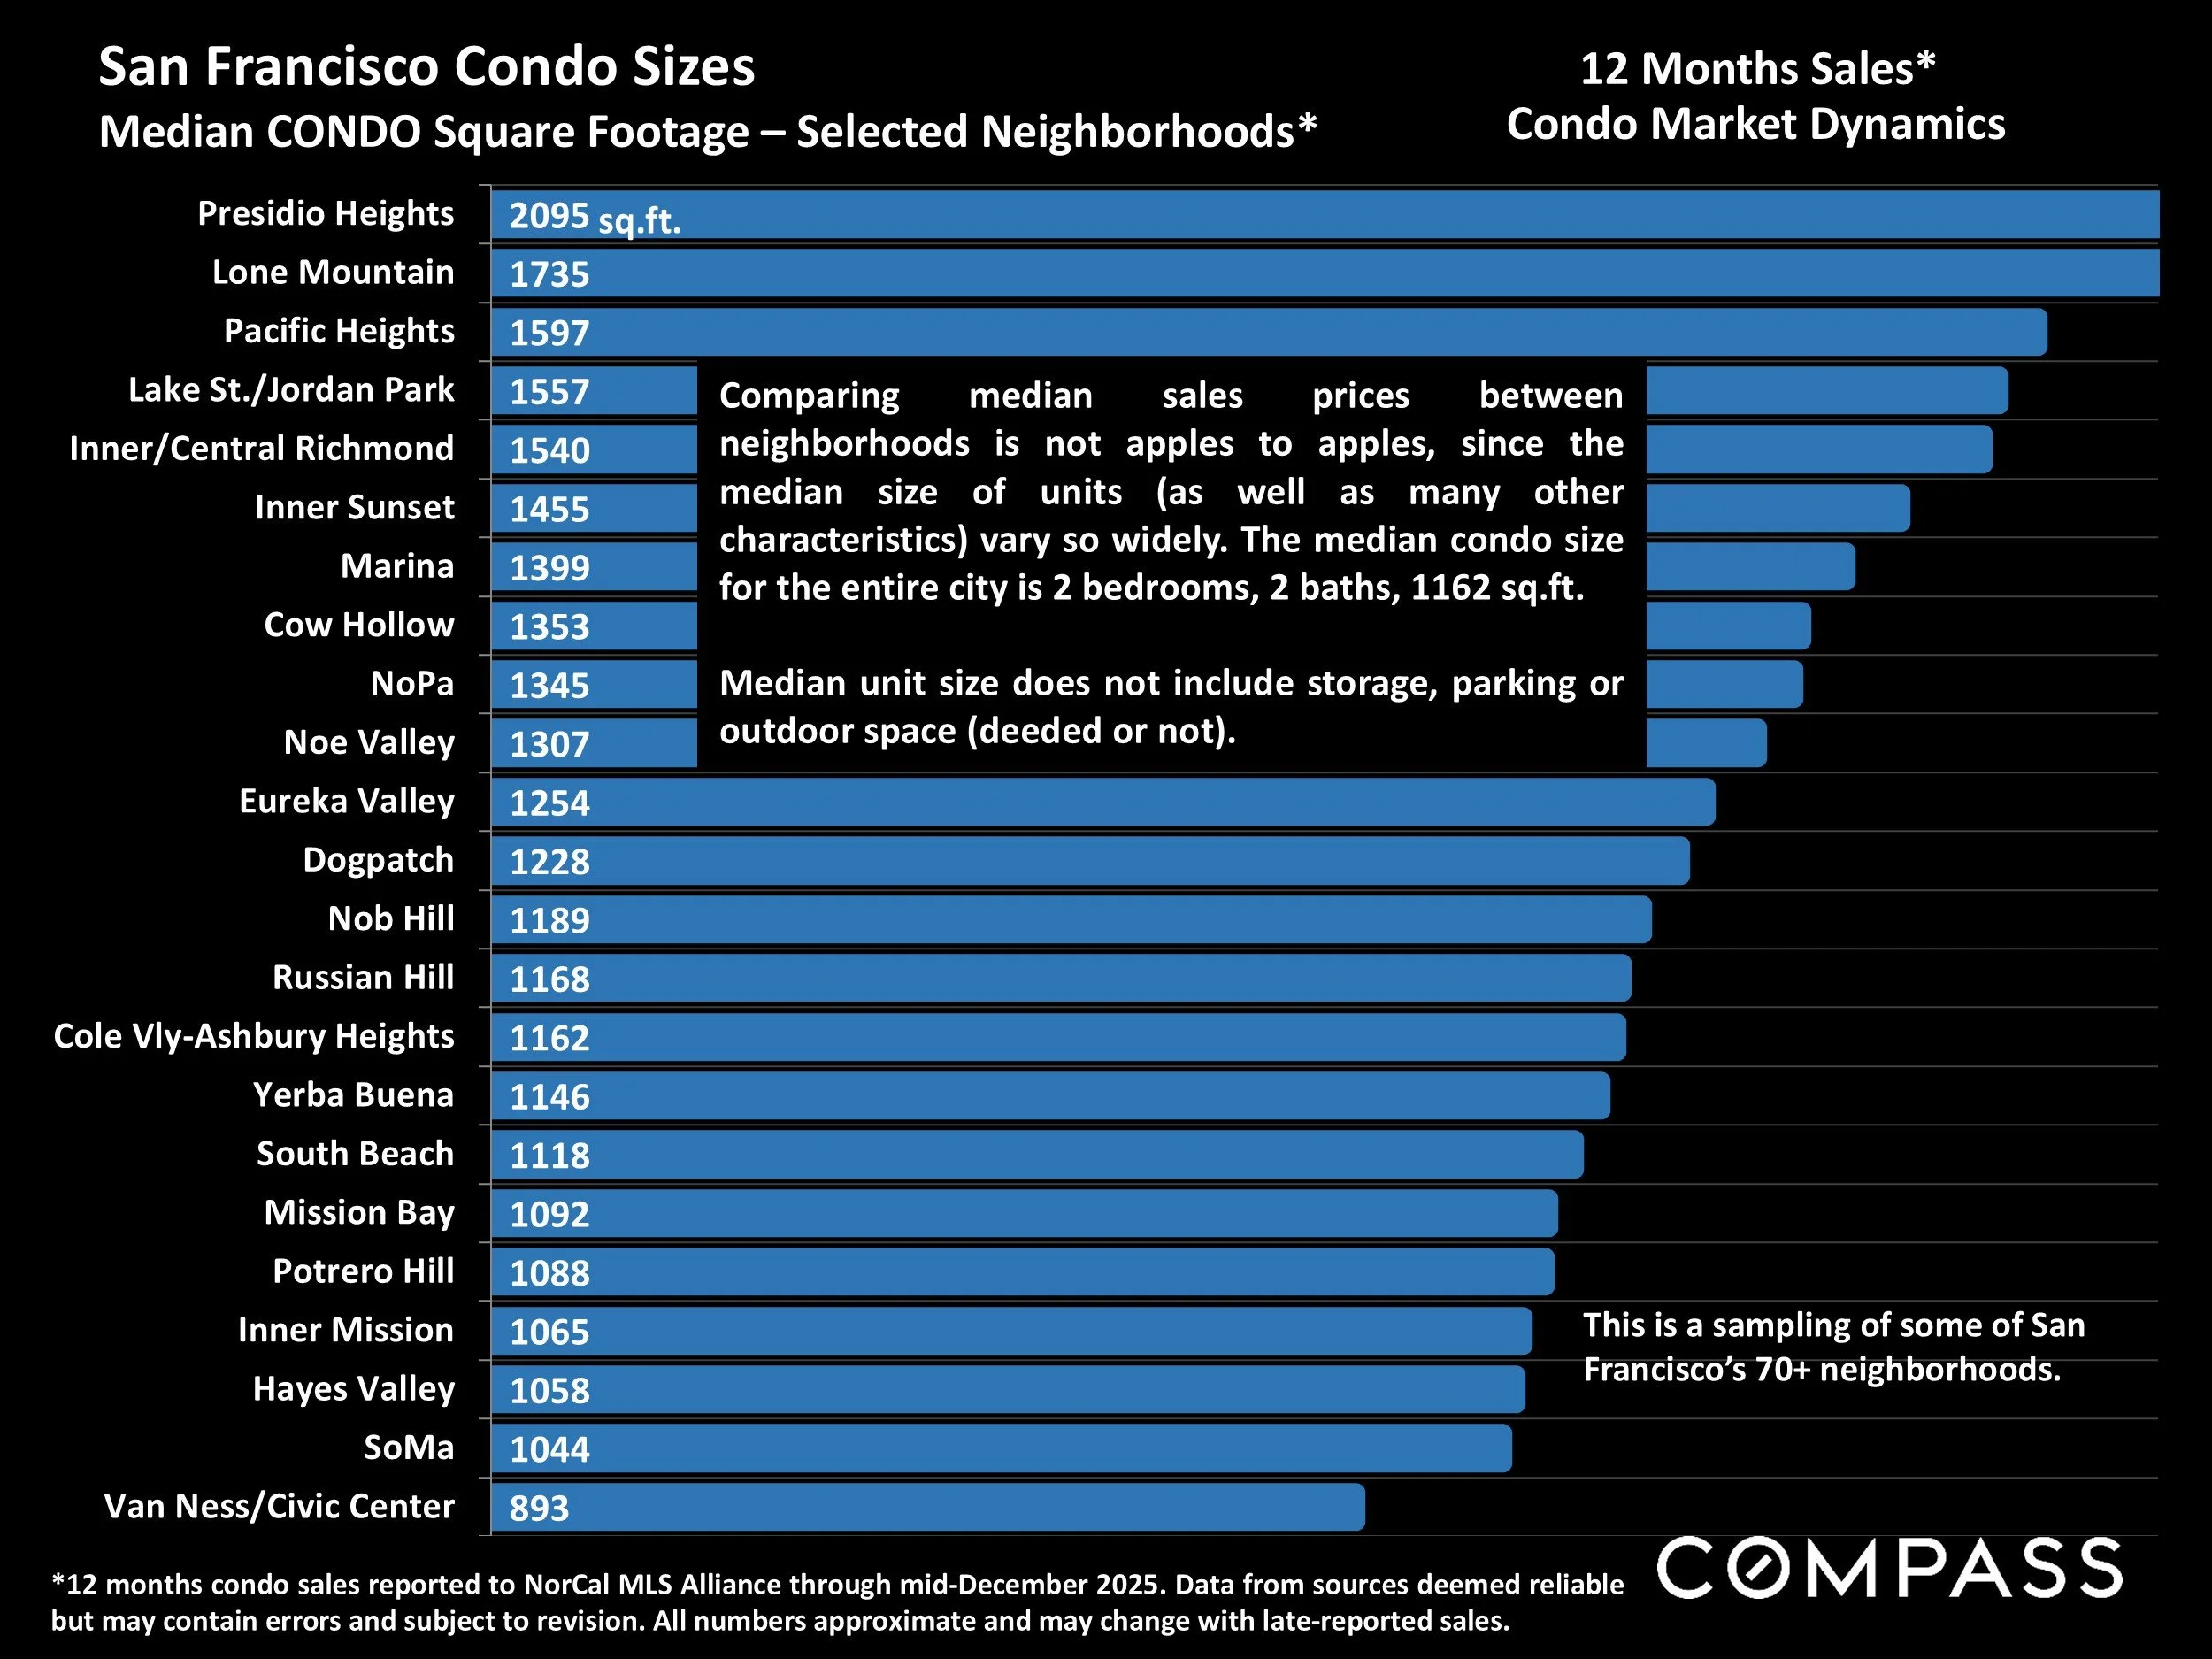
*12 months condo sales reported to NorCal MLS Alliance through mid-December 2025. Data from sources deemed reliable but may contain errors and subject to revision. All numbers approximate and may change with late-reported sales.
Comparing median sales prices between neighborhoods is not apples to apples, since hte median size of units ( as well as many other scharacterisics) vary so widely. The median condo size for the entire city is 2 bedrooms, 2 baths, 1162 sqyare feet.
Median uit size does not include storaeg, parking or outdoor space (deeded or not).
San Francisco Neighborhoods with Most Condo Sales
San Francisco’s Largest Condo Markets*
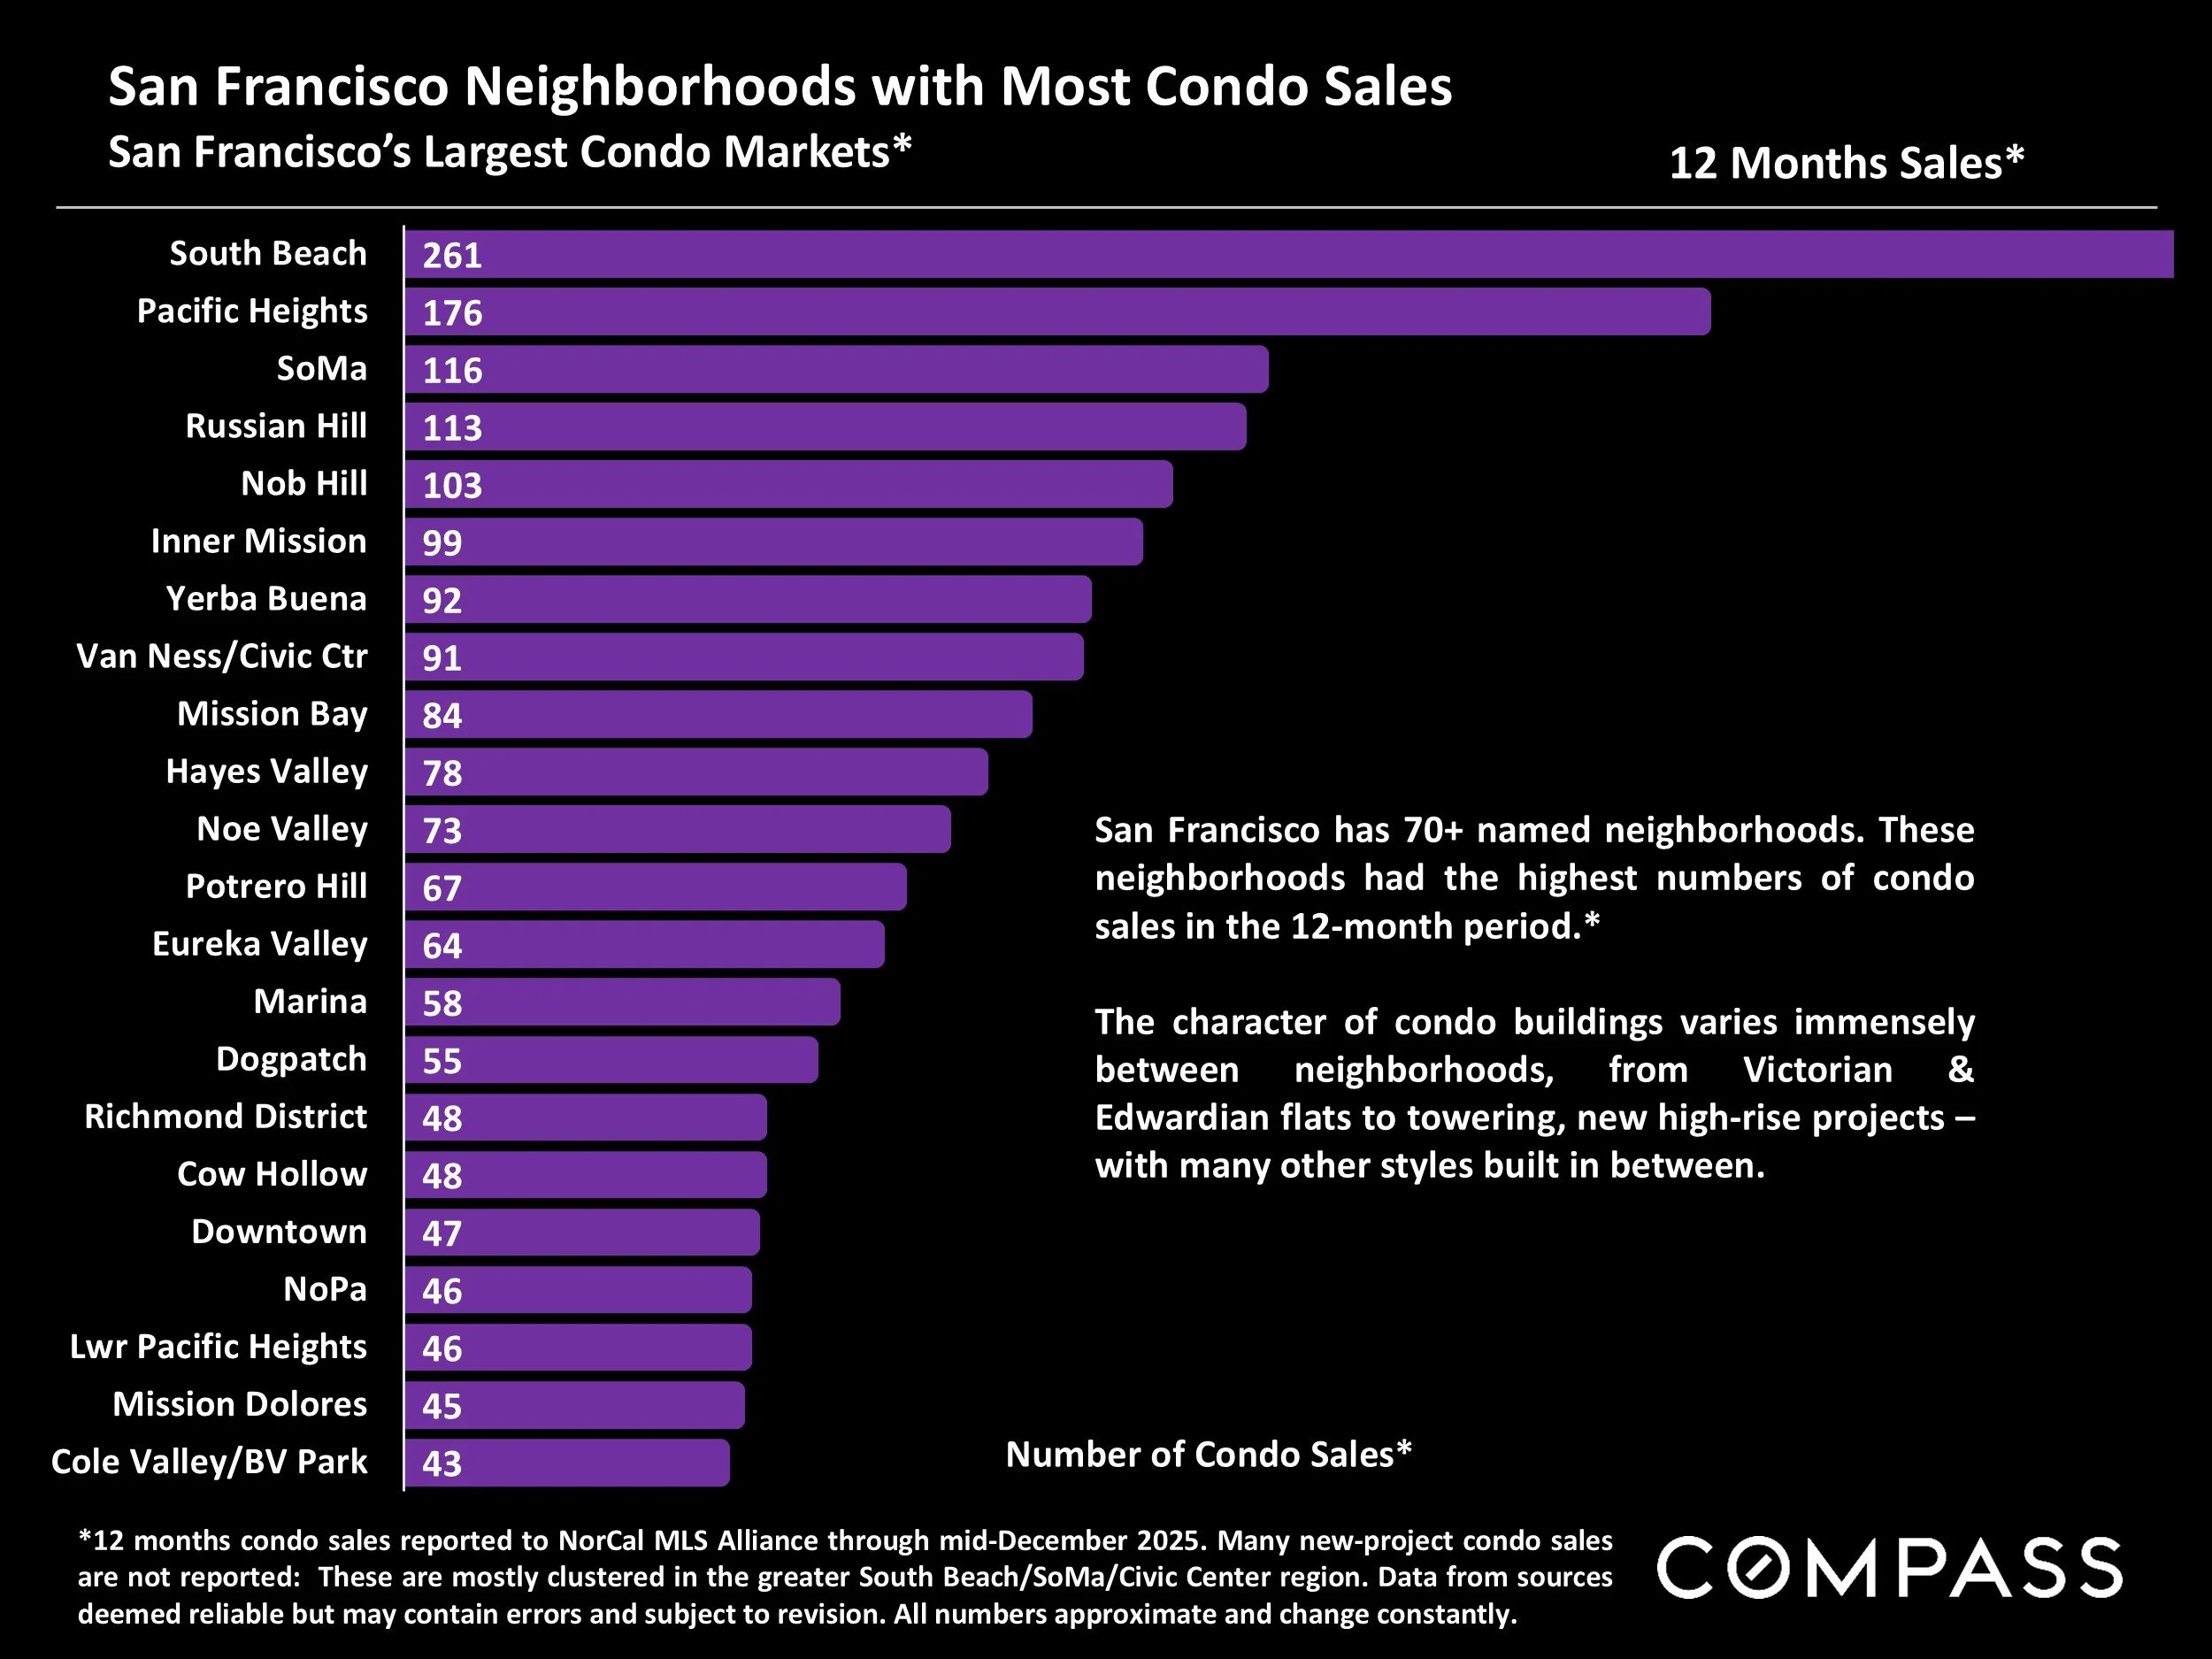
*12 months condo sales reported to NorCal MLS Alliance through mid-December 2025. Many new-project condo sales are not reported: These are mostly clustered in the greater South Beach/SoMa/Civic Center region. Data from sources deemed reliable but may contain errors and subject to revision. All numbers approximate and change constantly.
San Francisco has 70+ named neighborhoods. These neighborhoods had the highest numbers of condo sales in the 12-month period.*
The character of condo buildings varies immensely between neighborhoods, from Victorian & Edwardian flats to towering, new high-rise projects – with many other styles built in between.
Average Days on Market to Acceptance of Offer
Major San Francisco CONDO Markets by Realtor District*
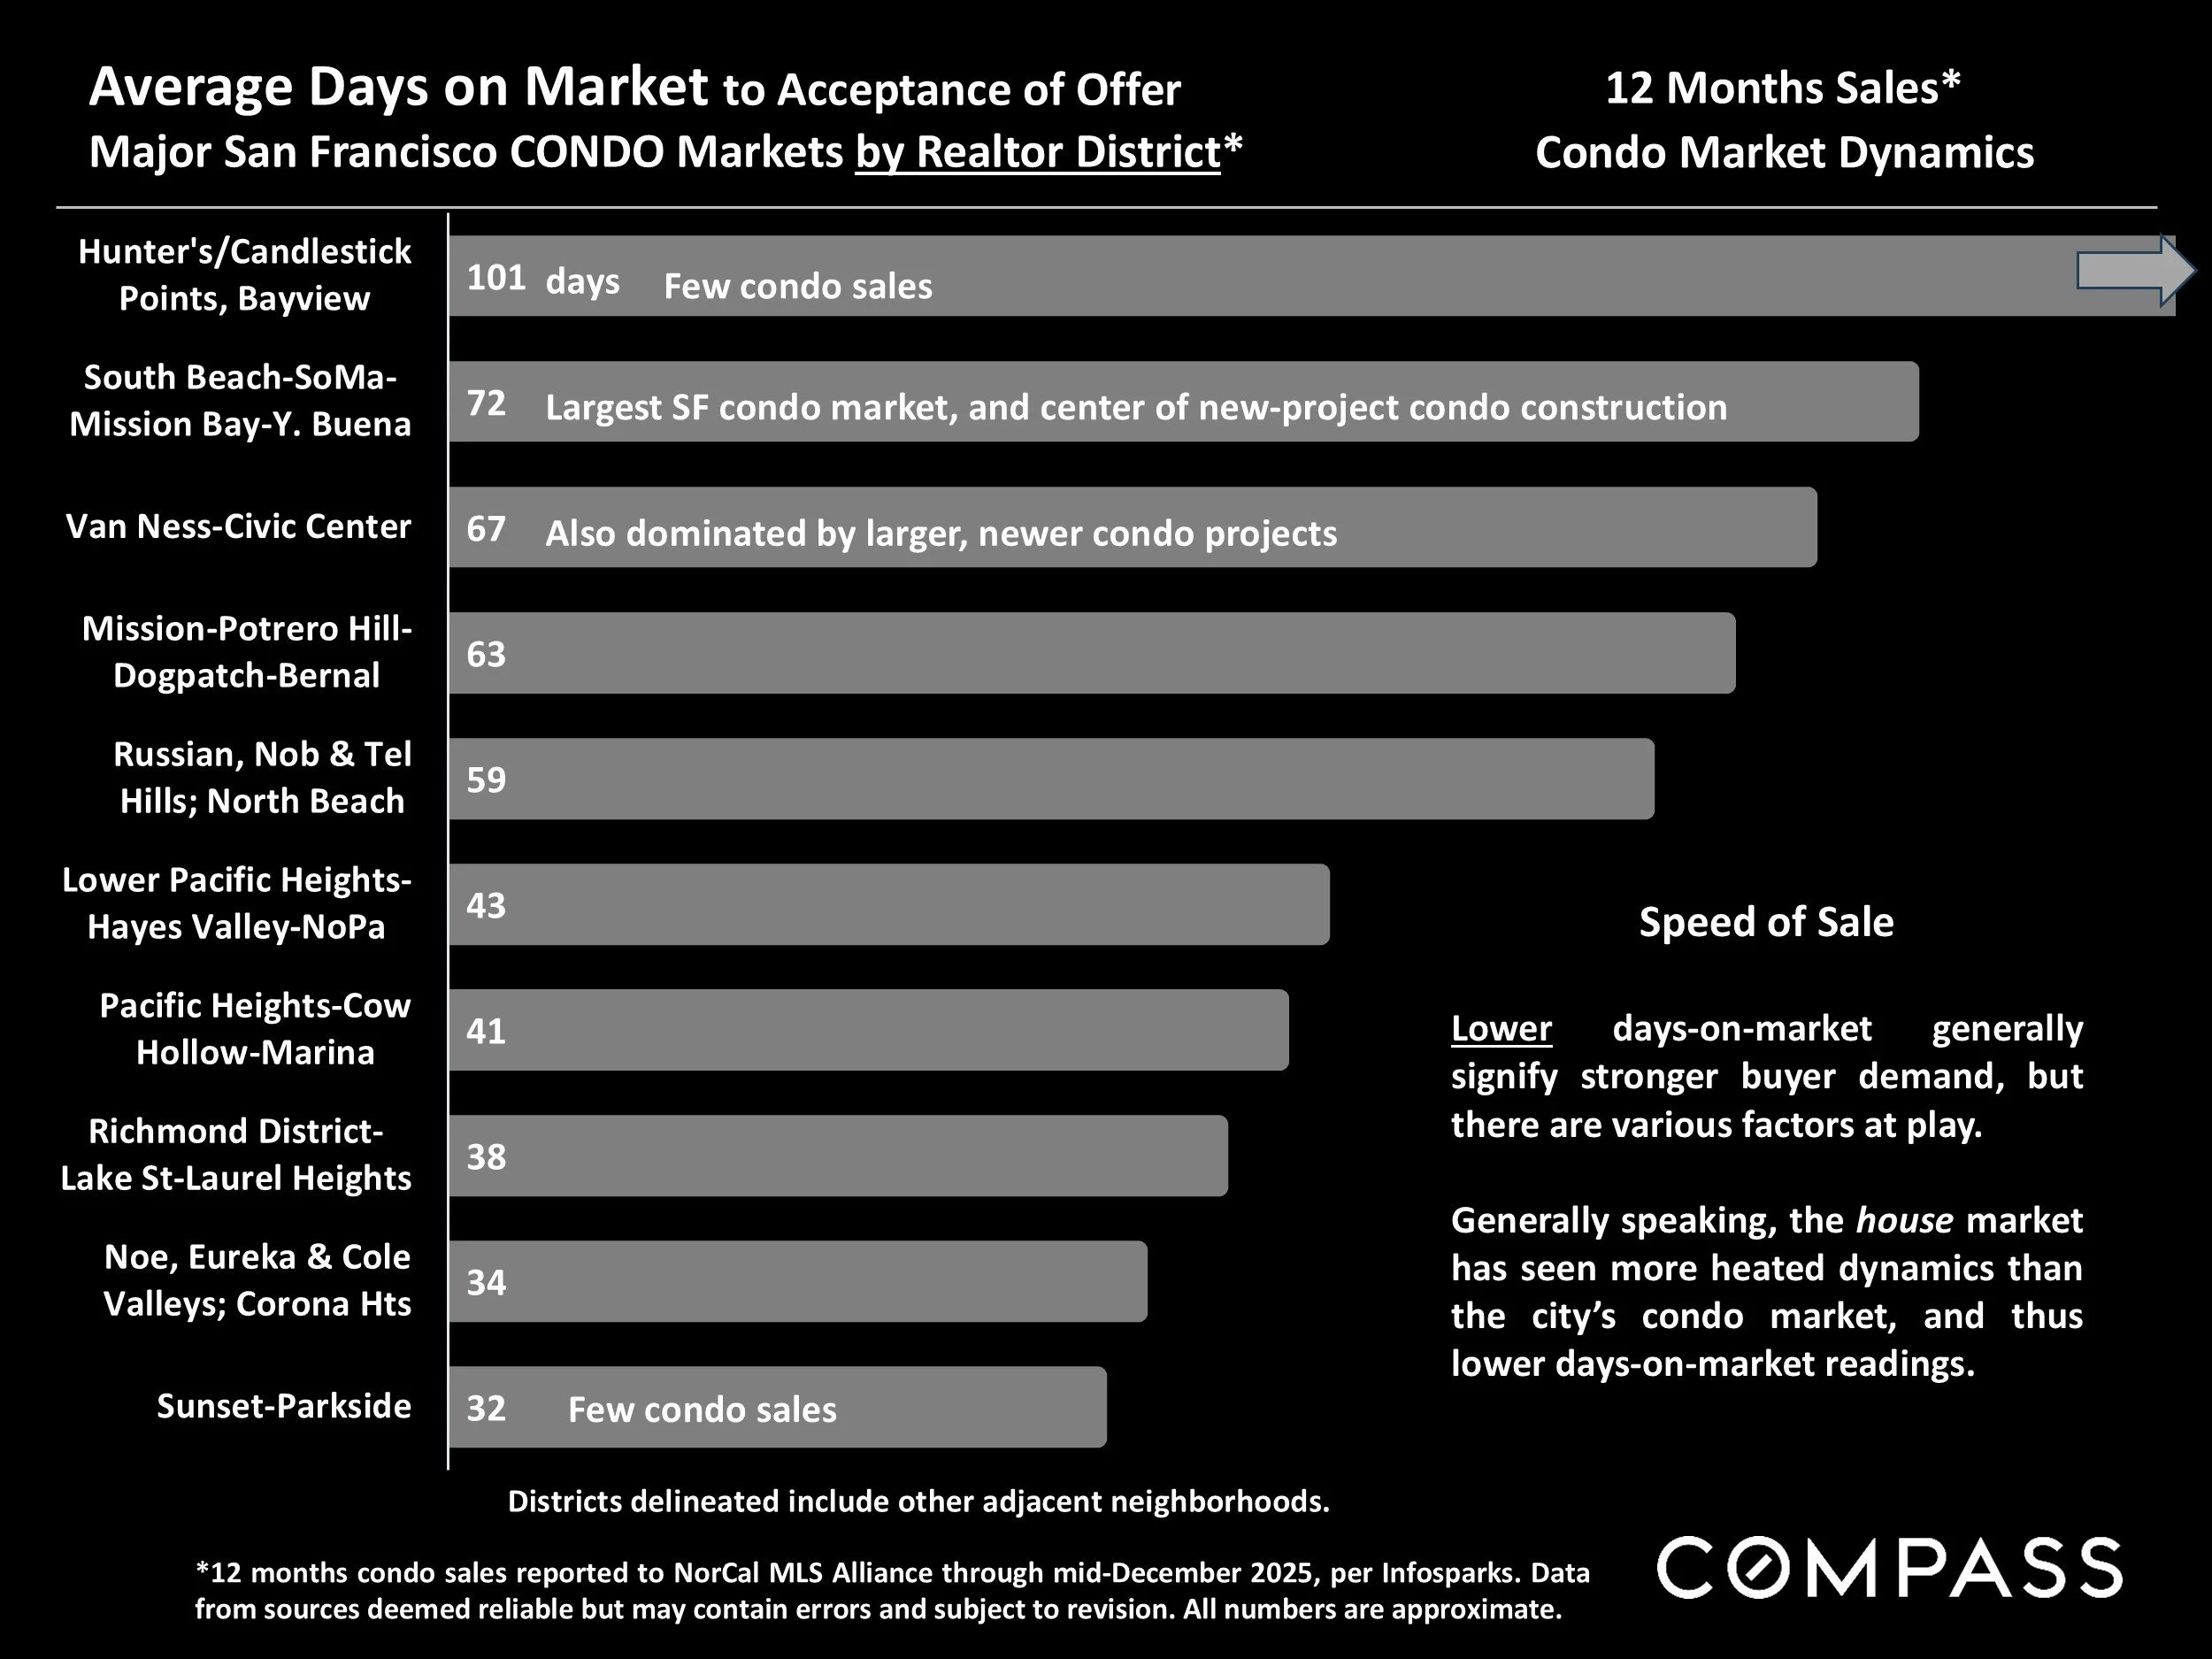
*12 months condo sales reported to NorCal MLS Alliance through mid-December 2025, per Infosparks. Data from sources deemed reliable but may contain errors and subject to revision. All numbers are approximate.
Lower days-on-market generally signify stronger buyer demand, but there are various factors at play.
Generally speaking, the house market has seen more heated dynamics than the city’s condo market, and thus lower days-on-market readings.
Percentage of Listings Selling Over List Price
Major San Francisco CONDO Markets by Realtor District*

*12 months condo sales reported to NorCal MLS Alliance through mid-December 2025, per Infosparks. Data from sources deemed reliable but may contain errors and subject to revision. All numbers are approximate.
Higher percentages of sales over list price typically signify more heated markets and greater buyer competition for new listings.
Average Overbid & Underbid Percentages
Major San Francisco CONDO Markets by Realtor District*

*12 months condo sales reported to NorCal MLS Alliance through mid-December 2025, per Infosparks. Data from sources deemed reliable but may contain errors and subject to revision. All numbers are approximate.
Generally speaking, the more that buyers compete for a limited supply of appealing and well-priced listings, the higher the average overbid percentage above asking price. In softer markets, where buyers have more negotiating leverage, the average sales price often runs below list price.
Median Condo Sales Prices & Annual Appreciation Calculations
The 2025 SF district median condo sales price calculations on the following annual-trend chart are based on calendar-year 2-bedroom unit sales reported to NorCal MLS Alliance by early January 2026. They may change as late-reported sales are entered into MLS. 2-bedroom condo sales were used to make the annual price comparisons more apples to apples.
Median home sales prices are not like stock prices where each share sold is essentially the same product period to period: Median home prices are calculated using differing collections of unique home sales occurring in each period measured. There is no such thing as an unchanging “median house” whose change in value can be determined at different times. The median size of condos sold can sometimes vary significantly period to period, or within a city, sales in one district neighborhood increase while declining in another. Sales in different price segments can be affected differently by economic circumstances such as interest rates or stock markets. All these situations can impact median sales prices in ways unrelated to fair market value.
Therefore, changes in median sales prices are not exact measurements of area appreciation or depreciation, but using large datasets, they typically generate fairly reliable indicators of general trends in fair market values.
How median sales prices and appreciation calculations apply to any particular home is unknown without a specific comparative market analysis.
Annual Median 2-Bedroom CONDO Prices since 2015
San Francisco Median Sales Prices in Selected Realtor Districts
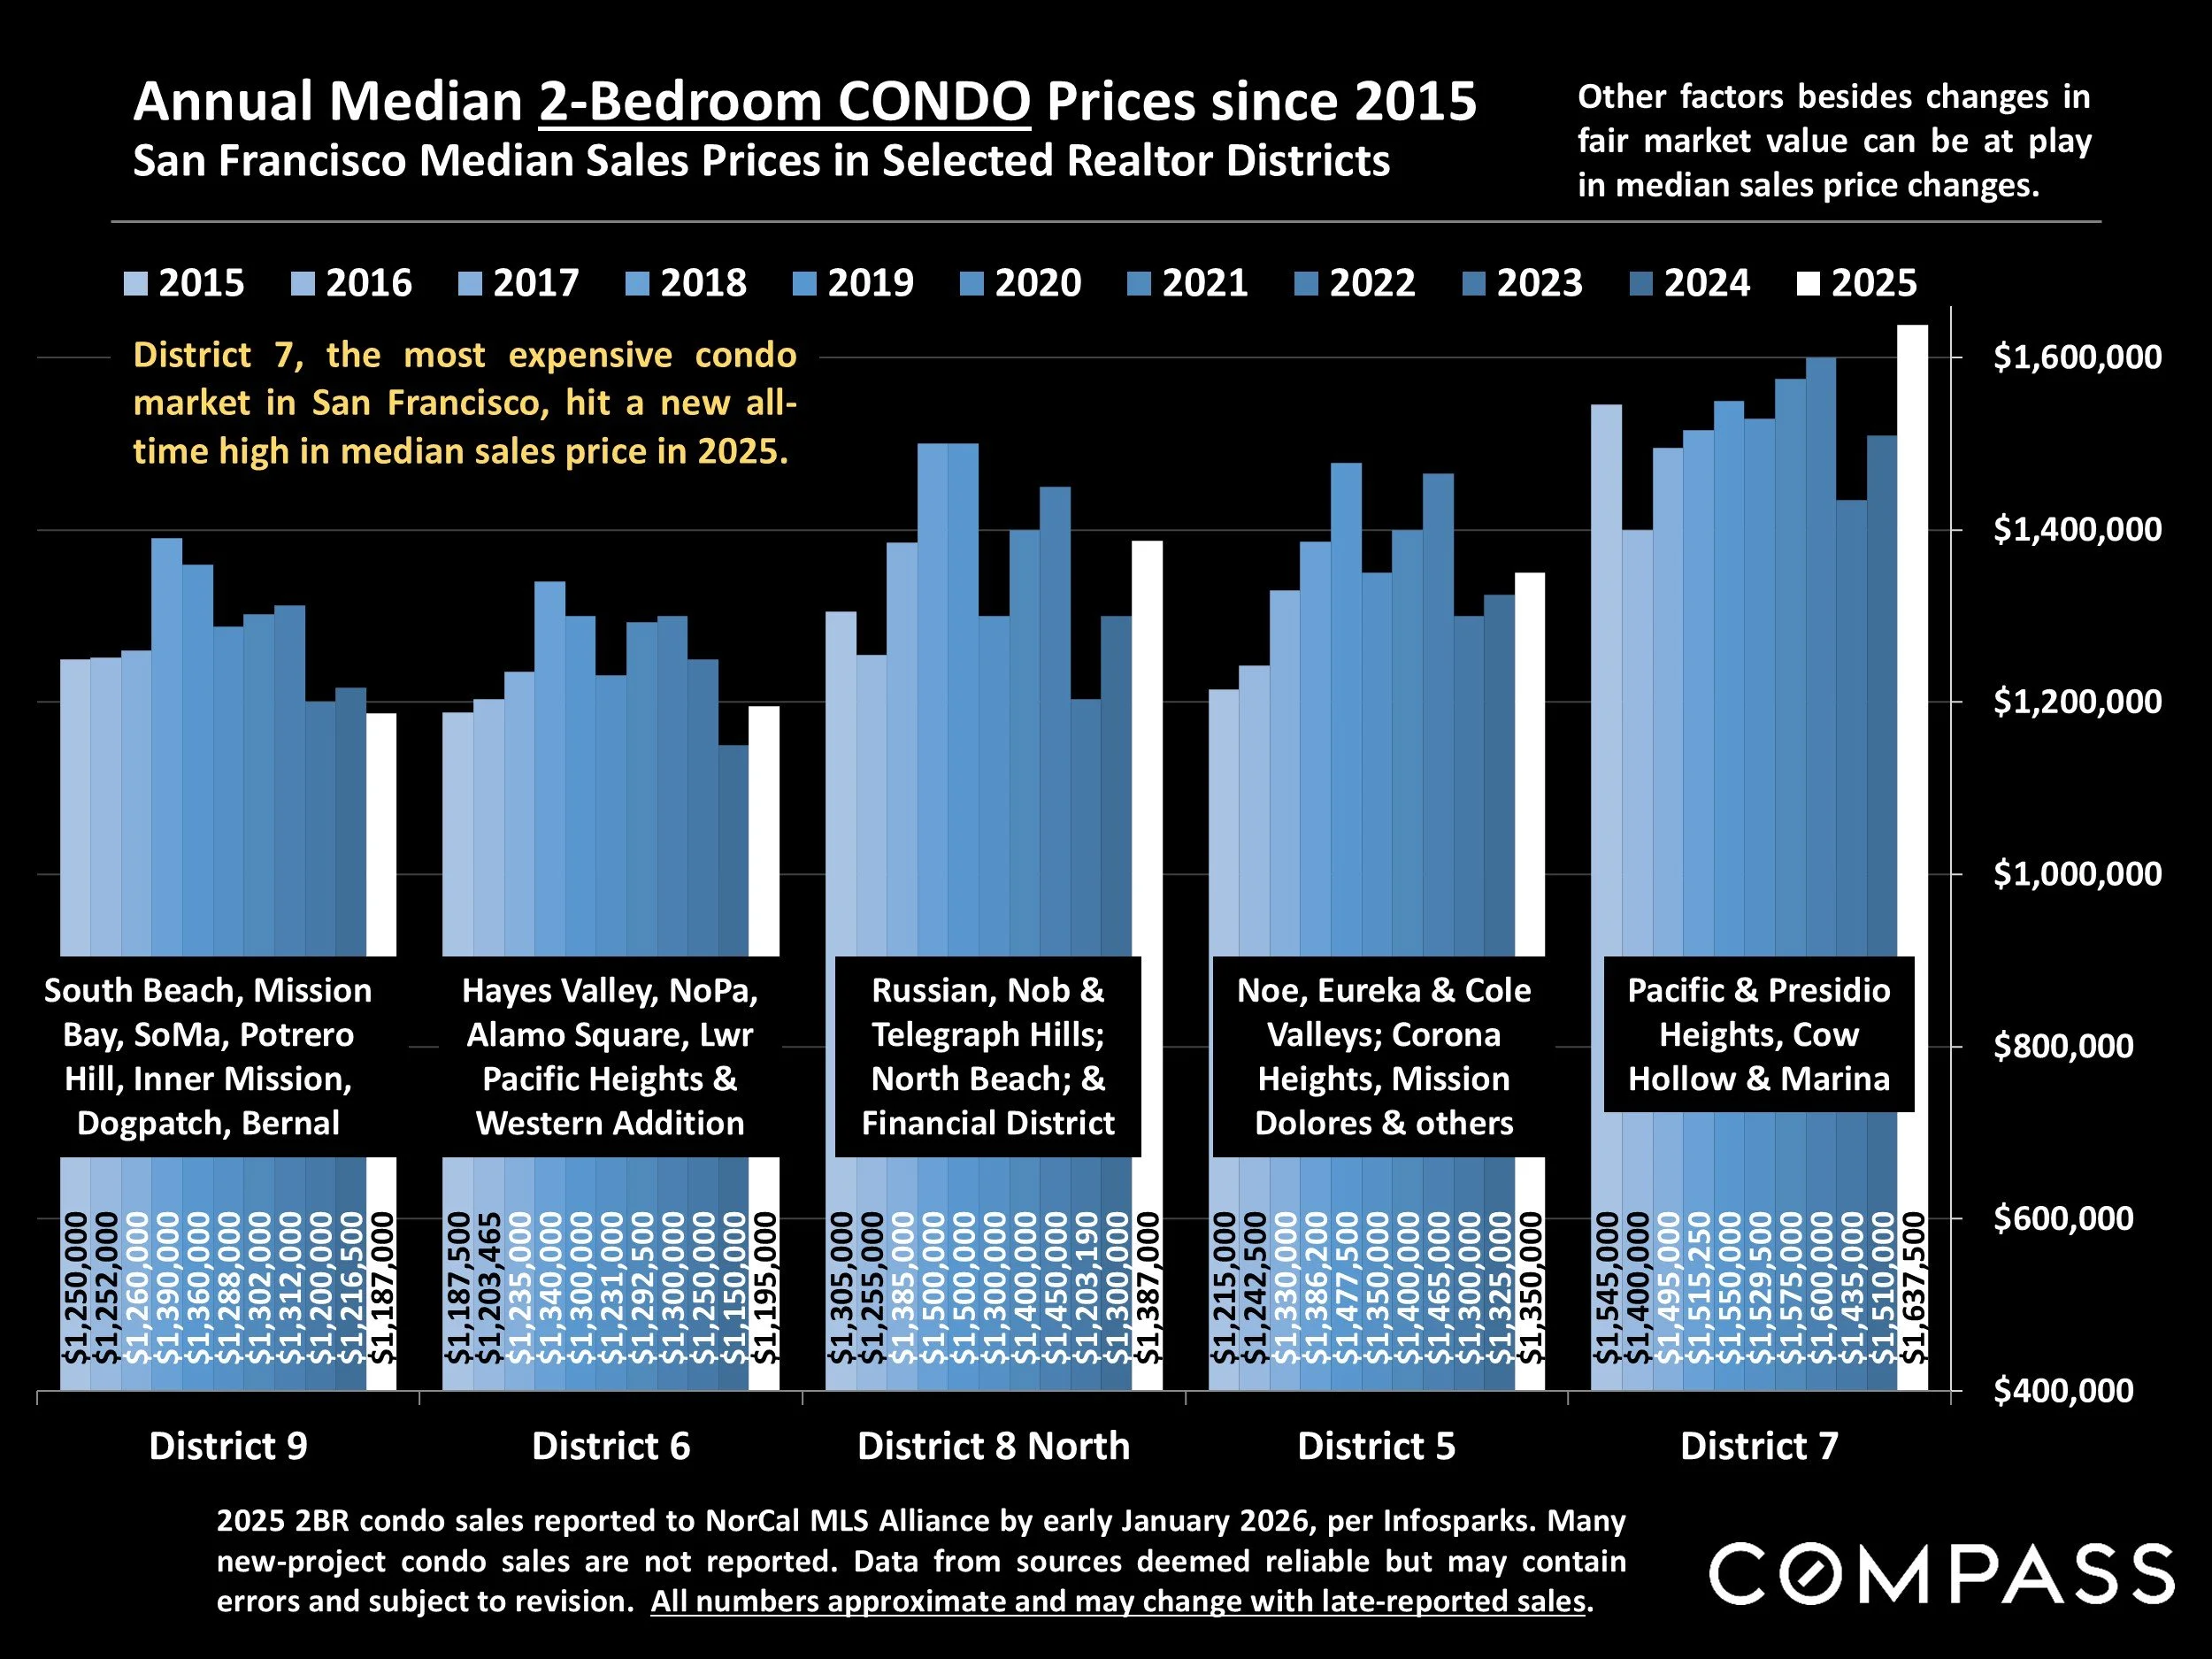
2025 2BR condo sales reported to NorCal MLS Alliance by early January 2026, per Infosparks. Many new-project condo sales are not reported. Data from sources deemed reliable but may contain errors and subject to revision. All numbers approximate and may change with late-reported sales.
District 7, the most expensive condo market in San Francisco, hit a new all-time high in median sales price in 2025.
Other factors besides changes in fair market value can be at play in median sales price changes.
Bay Area Median House Values by County
2025 Sales By Bedroom/Bath Count*
| 2 Bedroom, 1-2 Bath Houses | 3 Bedroom, 2 Bath Houses | ||||||
|---|---|---|---|---|---|---|---|
| County in alphabetical order | Median Sales Price | Median Square Footage | Median $/Sq.Ft | Median Sales Price | Median Square Footage | Median $/Sq.Ft | |
| Alameda County | $785,000 | 1067 sq.ft. | $735/sq.ft. | $1,125,000 | 1428 sq.ft. | $784/sq.ft. | |
| Contra Costa | $575,000 | 1019 sq.ft. | $561/sq.ft. | $725,000 | 1444 sq.ft. | $528/sq.ft. | |
| Marin County | $1,225,000 | 1226 sq.ft. | $976/sq.ft. | $1,370,000 | 1600 sq.ft. | $859/sq.ft. | |
| Monterey County | $780,000 | 1016 sq.ft. | $763/sq.ft. | $825,000 | 1467 sq.ft. | $573/sq.ft. | |
| Napa County | $787,000 | 1060 sq.ft. | $775/sq.ft. | $820,000 | 1447 sq.ft. | $597/sq.ft. | |
| San Francisco | $1,318,000 | 1188 sq.ft. | $1083/sq.ft. | $1,587,000 | 1575 sq.ft. | $1005/sq.ft. | |
| San Mateo County | $1,380,000 | 1080 sq.ft. | $1292/sq.ft. | $1,700,000 | 1510 sq.ft. | $1153/sq.ft. | |
| Santa Clara County | $1,250,000 | 1058 sq.ft. | $1197/sq.ft. | $1,725,000 | 1383 sq.ft. | $1249/sq.ft. | |
| Santa Cruz County | $855,000 | 1039 sq.ft. | $792/sq.ft. | $1,255,000 | 1600 sq.ft. | $758/sq.ft. | |
| Solano County | $445,000 | 1216 sq.ft. | $350/sq.ft. | $549,000 | 1429 sq.ft. | $388/sq.ft. | |
| Sonoma County | $695,000 | 1203 sq.ft. | $577/sq.ft. | $799,000 | 1518 sq.ft. | $532/sq.ft. |
| 4 Bedroom, 3 Bath Houses | 5+ Bedroom, 4+ Bath Houses, 3000+ sq.ft. | ||||||
|---|---|---|---|---|---|---|---|
| County in alphabetical order | Median Sales Price | Median Square Footage | Median $/Sq.Ft. | Median Sales Price | Median Sq.Ft./ Median Lot Size | Median $/Sq.Ft. | |
| Alameda County | $1,626,500 | 2195 sq.ft. | $739/sq.ft. | $2,750,000 | 3869 sq.ft./.25 acre | $694/sq.ft. | |
| Contra Costa | $1,075,000 | 2338 sq.ft. | $478/sq.ft. | $2,650,000 | 3983 sq.ft./.37 acre | $642/sq.ft. | |
| Marin County | $1,905,000 | 2502 sq.ft. | $793/sq.ft. | $3,772,500 | 4145 sq.ft./.45 acre | $939/sq.ft. | |
| Monterey County | $1,092,500 | 2298 sq.ft. | $471/sq.ft. | $3,850,000 | 5001 sq.ft./1.6 acres | $719/sq.ft. | |
| Napa County | $1,110,000 | 2307 sq.ft. | $511/sq.ft. | $4,000,000 | 4456 sq.ft./.54 acre | $941/sq.ft. | |
| San Francisco | $2,200,000 | 2276 sq.ft. | $974/sq.ft. | $5,500,000 | 4270 sq.ft./.07 acre | $1232/sq.ft. | |
| San Mateo County | $2,622,500 | 2310 sq.ft. | $1103/sq.ft. | $6,050,000 | 4545 sq.ft./.51 acre | $1375/sq.ft. | |
| Santa Clara County | $2,210,000 | 2204 sq.ft. | $1023/sq.ft. | $4,620,000 | 3991 sq.ft./.31 acre | $1158/sq.ft. | |
| Santa Cruz County | $1,550,000 | 2182 sq.ft. | $677/sq.ft. | $2,275,000 | 4122 sq.ft./1.13 acres | $616/sq.ft. | |
| Solano County | $700,500 | 2216 sq.ft. | $317/sq.ft. | $966,000 | 3680 sq.ft./.21 acre | $279/sq.ft. | |
| Sonoma County | $920,000 | 2268 sq.ft. | $423/sq.ft. | $2,055,000 | 3964 sq.ft./.79 acre | $513/sq.ft. |
Bay Area Median Condo & Townhouse Values
2025 Sales By Property Type & Bedroom/Bath Count*
| 2 BR, 2 BA Condos | 3 BR, 2-3 BA Townhouses | ||||||
|---|---|---|---|---|---|---|---|
| County in alphabetical order | Median Sales Price | Median Square Footage | Median $/Sq.Ft | Median Sales Price | Median Square Footage | Median $/Sq.Ft | |
| Alameda County | $600,000 | 1078 sq.ft. | $558/sq.ft. | $887,000 | 1519 sq.ft. | $608/sq.ft. | |
| Contra Costa | $549,500 | 1134 sq.ft. | $497/sq.ft. | $789,000 | 1555 sq.ft. | $524/sq.ft. | |
| Marin County | $705,000 | 1118 sq.ft. | $661/sq.ft. | $891,000 | 1598 sq.ft. | $561/sq.ft. | |
| Monterey County | $840,000 | 1229 sq.ft. | $642/sq.ft. | $1,010,000 | 1733 sq.ft. | $580/sq.ft. | |
| Napa County | $967,500 | 1052 sq.ft. | $929/sq.ft. | Too few sales | |||
| San Francisco | $1,258,000 | 1191 sq.ft. | $1051/sq.ft. | Too few sales | |||
| San Mateo County | $865,500 | 1185 sq.ft. | $742/sq.ft. | $1,485,000 | 1625 sq.ft. | $887/sq.ft. | |
| Santa Clara County | $780,000 | 1140 sq.ft. | $694/sq.ft. | $1,334,000 | 1571 sq.ft. | $841/sq.ft. | |
| Santa Cruz County | $772,500 | 1141 sq.ft. | $652/sq.ft. | $976,000 | 1531 sq.ft. | $635/sq.ft. | |
| Solano County | $360,000 | 1036 sq.ft. | $340/sq.ft. | $500,000 | 1480 sq.ft. | $319/sq.ft. | |
| Sonoma County | $417,000 | 1065 sq.ft. | $398/sq.ft. | $535,000 | 1324 sq.ft. | $386/sq.ft. |
*Sales reported to NorCal MLS Alliance in 2025 through mid-December 2025. Counties contain submarkets of widely varying values. “Fixer-uppers” excluded. Median values fluctuate for reasons besides changes in fair market value. Data from sources deemed reliable but may contain errors and subject to revision. Numbers approximate, and data constantly changes as new sales occur. Not all sales are reported to MLS.
Statistics are generalities, essentially summaries of widely disparate data generated by dozens, hundreds or thousands of unique, individual sales occurring within different time periods. They are best seen not as precise measurements, but as broad, comparative indicators, with reasonable margins of error. Anomalous fluctuations in statistics are not uncommon, especially in smaller, expensive market segments. Last period data should be considered estimates that may change with late-reported data. Different analytics programs sometimes define statistics – such as “active listings,” “days on market,” and “months supply of inventory” – differently: what is most meaningful are not specific calculations but the trends they illustrate. Most listing and sales data derives from the local or regional multi-listing service (MLS) of the area specified in the analysis, but not all listings or sales are reported to MLS and these won’t be reflected in the data. “Homes” signifies real-property, single-household housing units: houses, condos, co-ops, townhouses, duets and TICs (but not mobile homes), as applicable to each market. City/town names refer specifically to the named cities and towns or MLS-defined areas, unless otherwise delineated. Multi-county metro areas will be specified as such. Data from sources deemed reliable but may contain errors and subject to revision. All numbers to be considered approximate.
Many aspects of value cannot be adequately reflected in median and average statistics: curb appeal, age, condition, amenities, views, lot size, quality of outdoor space, “bonus” rooms, additional parking, quality of location within the neighborhood, and so on. How any of these statistics apply to any particular home is unknown without a specific comparative market analysis.
Median Sales Price is that price at which half the properties sold for more and half for less. It may be affected by seasonality, “unusual” events, or changes in inventory and buying trends, as well as by changes in fair market value. The median sales price for an area will often conceal an enormous variety of sales prices in the underlying individual sales.
Dollar per Square Foot is based upon the home’s interior living space and does not include garages, unfinished attics and basements, rooms built without permit, patios, decks or yards (though all those can add value to a home). These figures are usually derived from appraisals or tax records, but are sometimes unreliable (especially for older homes) or unreported altogether. The calculation can only be made on those home sales that reported square footage.
Compass is a real estate broker licensed by the State of California, DRE 01527235. Equal Housing Opportunity. This report has been prepared solely for information purposes. The information herein is based on or derived from information generally available to the public and/or from sources believed to be reliable. No representation or warranty can be given with respect to the accuracy or completeness of the information. Compass disclaims any and all liability relating to this report, including without limitation any express or implied representations or warranties for statements contained in, and omissions from, the report. Nothing contained herein is intended to be or should be read as any regulatory, legal, tax, accounting or other advice and Compass does not provide such advice. All opinions are subject to change without notice. Compass makes no representation regarding the accuracy of any statements regarding any references to the laws, statutes or regulations of any state are those of the author(s). Past performance is no guarantee of future results.