July 2022 Market Report: Continued Signs of a Cooling Market

Photo by Thom Milkovic on Unsplash
The impacts of this year’s severe economic headwinds – soaring inflation and interest rates, stock market declines, fears of recession – on Bay Area real estate markets are speeding up. The first effect was on buyer demand (fewer buyers, offers and listings into contract), leading to changes in supply (more homes for sale, more price reductions), which began to alter buyer and seller psychology and the balance of power between them. Especially after one of the longest, most dramatic upcycles in history, the psychology, circumstances and plans of individual buyers and sellers shift unevenly in the early months of a transition as they try to make sense of changing market realities. Eventually statistics based on closed sales – prices, appreciation rates, overbidding, days on market – slowly start to adjust. Generally speaking, closed sales are lagging indicators of what occurred in the economy and market weeks and months earlier.
If stock market prices are like a jet skier on a triple-espresso, home prices are like a giant cargo ship, which decelerates and turns slowly. It took a few months from when the big economic changes began, but the high year-over-year appreciation rates of recent years are now dropping fast in Bay Area markets – and in San Francisco, the rate turned slightly negative in June – though the degree of any actual, longer- term “correction” to prices, if it occurs, remains to be seen.
A correction is not a crash. The precipitating factor in the 2008 crash – tens of millions of households talked into home loans they couldn’t afford, forcing frantic sales during a recession – does not apply today. Indeed, mortgage payments as a percentage of income are close to all-time lows (and most homeowners’ mortgages are also at historically low rates). Outside the 2008 crash, market corrections over the last 4 decades typically ran from a simple flattening in appreciation, to price adjustments of 5% to 10% (relatively small compared to the appreciation rates which preceded them). It is far too early, with far too many factors at play, to make predictions.
An overheated market cooling or normalizing, slowing from an unsustainable rate of acceleration, does not necessarily imply a weak market by historical standards, even if the speed and scale of the change is startling. This report will review year-over-year changes in supply and demand, reflecting the significant adjustments occurring, but also longer-term trends to provide greater context to these recent changes.
Monthly data can be volatile, fluctuating according to a number of factors, including market seasonality. For example, in most Bay Area markets, it is not unusual for median sales prices to peak for the year in spring or early summer. It is best not to jump to definitive conclusions based on a few months of data, much less a single month’s: Longer-term data is more meaningful than short-term fluctuations.
Different regions and market segments are cooling at differing speeds and each region has unique conditions – and in the Bay Area, each home is relatively unique as well. But barring very special circumstances, markets across the Bay Area (and the country) can be expected to eventually move in roughly parallel directions because of the broad macroeconomic factors at play. Within this report is a link to a review of many of these factors. As of July 7, 2022, according to FHLMC, the average weekly mortgage rate for a 30-year fixed rate loan fell to 5.3% from 5.81% two weeks earlier.
Our reports are not intended to convince you regarding a course of action or to predict the future, but to provide, to the best of our ability, straightforward information and good-faith analysis to assist you in making your own informed decisions. Statistics should be considered very general indicators, and all numbers should be considered approximate. How they apply to any particular property is unknown without a specific comparative market analysis.
San Francisco Median House Price Trends
Median House Sales Prices, 2018 – Present, by Month

Median sales price is that price where half the homes sold for more and half for less. It is a very general statistic that disguises a wide range of prices in the underlying sales, and can be affected by other factors besides changes in fair market value. Monthly and seasonal fluctuations are common, and it is not unusual for median sales prices to peak for the year in spring. Longer-term trends are more meaningful than short-term changes.
San Francisco Year-over-Year Appreciation Rates since 2020
Y-o-Y Percentage Change in Monthly Median HOUSE Sales Price
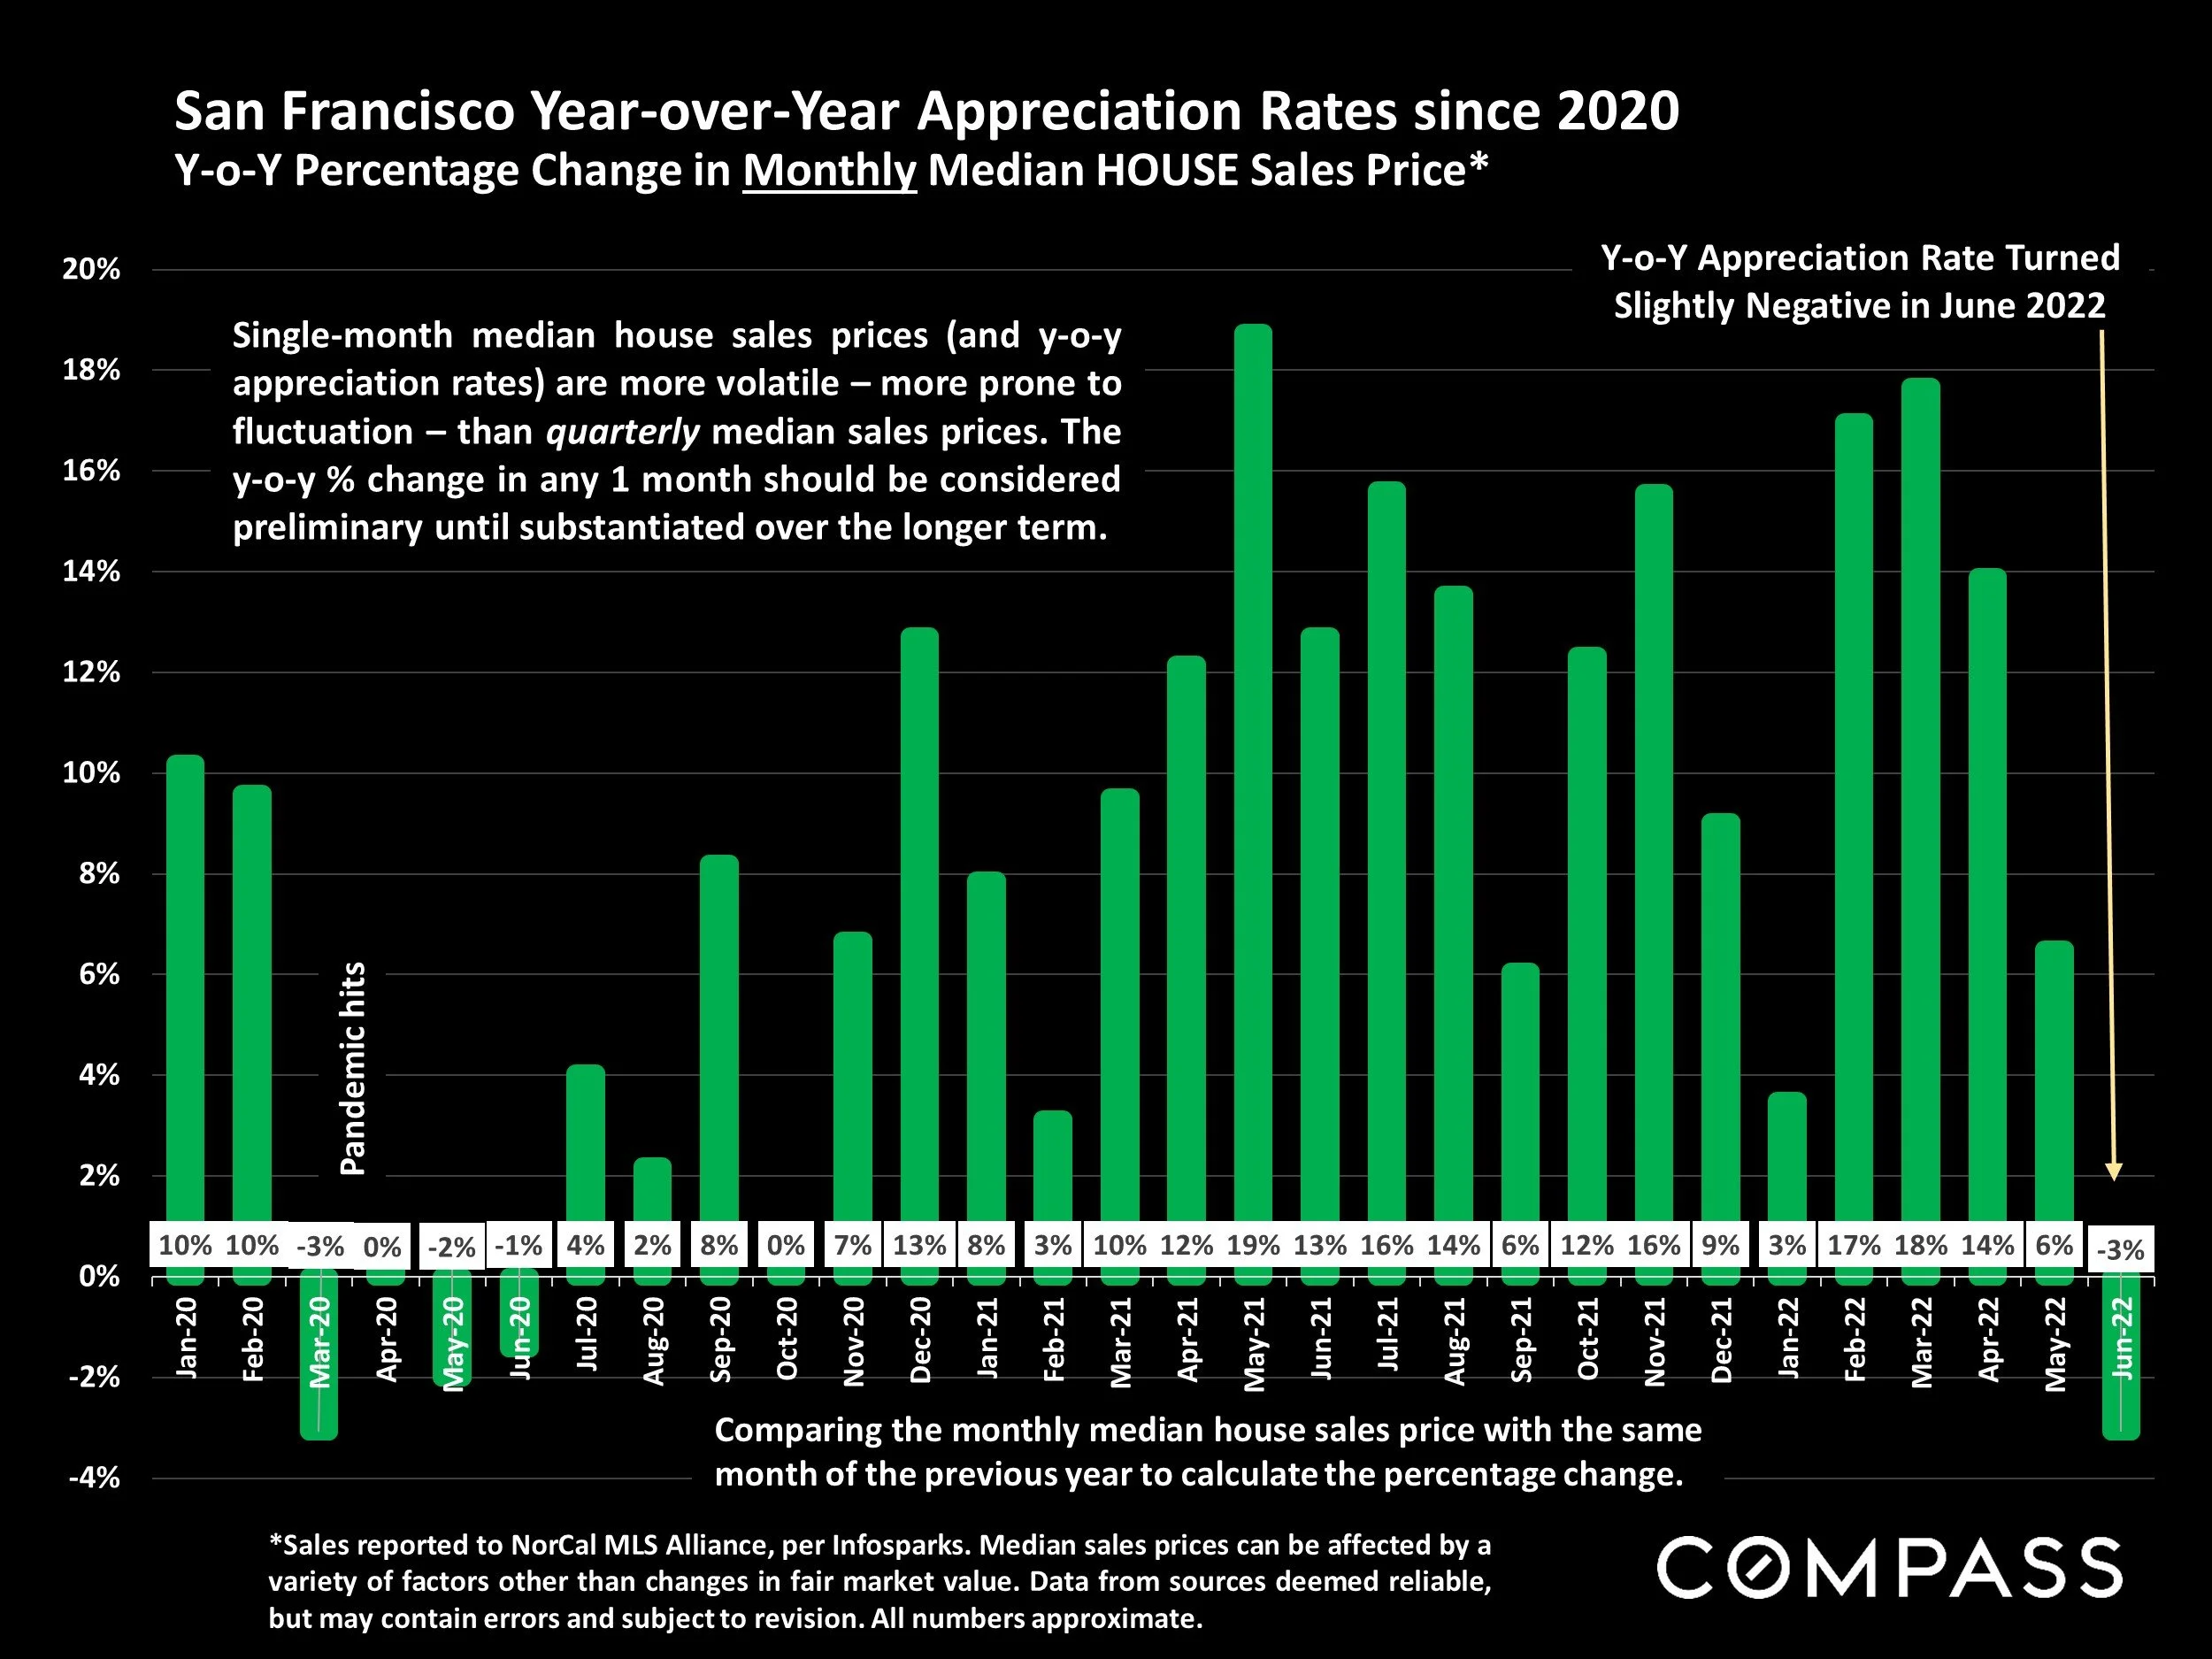
*Sales reported to NorCal MLS Alliance, per Infosparks. Median sales prices can be affected by a variety of factors other than changes in fair market value. Data from sources deemed reliable, but may contain errors and subject to revision. All numbers approximate.
Single-month median house sales prices (and y-o-y appreciation rates) are mor evolatile – more prone to fluctuation – than quarterly median sales prices. The y-o-y % change in any 1 month should be considered preliminary until substantiated over the longer term. The Y-o-Y appreciation rate turned slightly negative in June 2022, for the first time since the beginning of the pandemic.
Bay Area Year-over-Year Appreciation Rates since 2020
Y-o-Y Percentage Change in Monthly Median HOUSE Sales Price
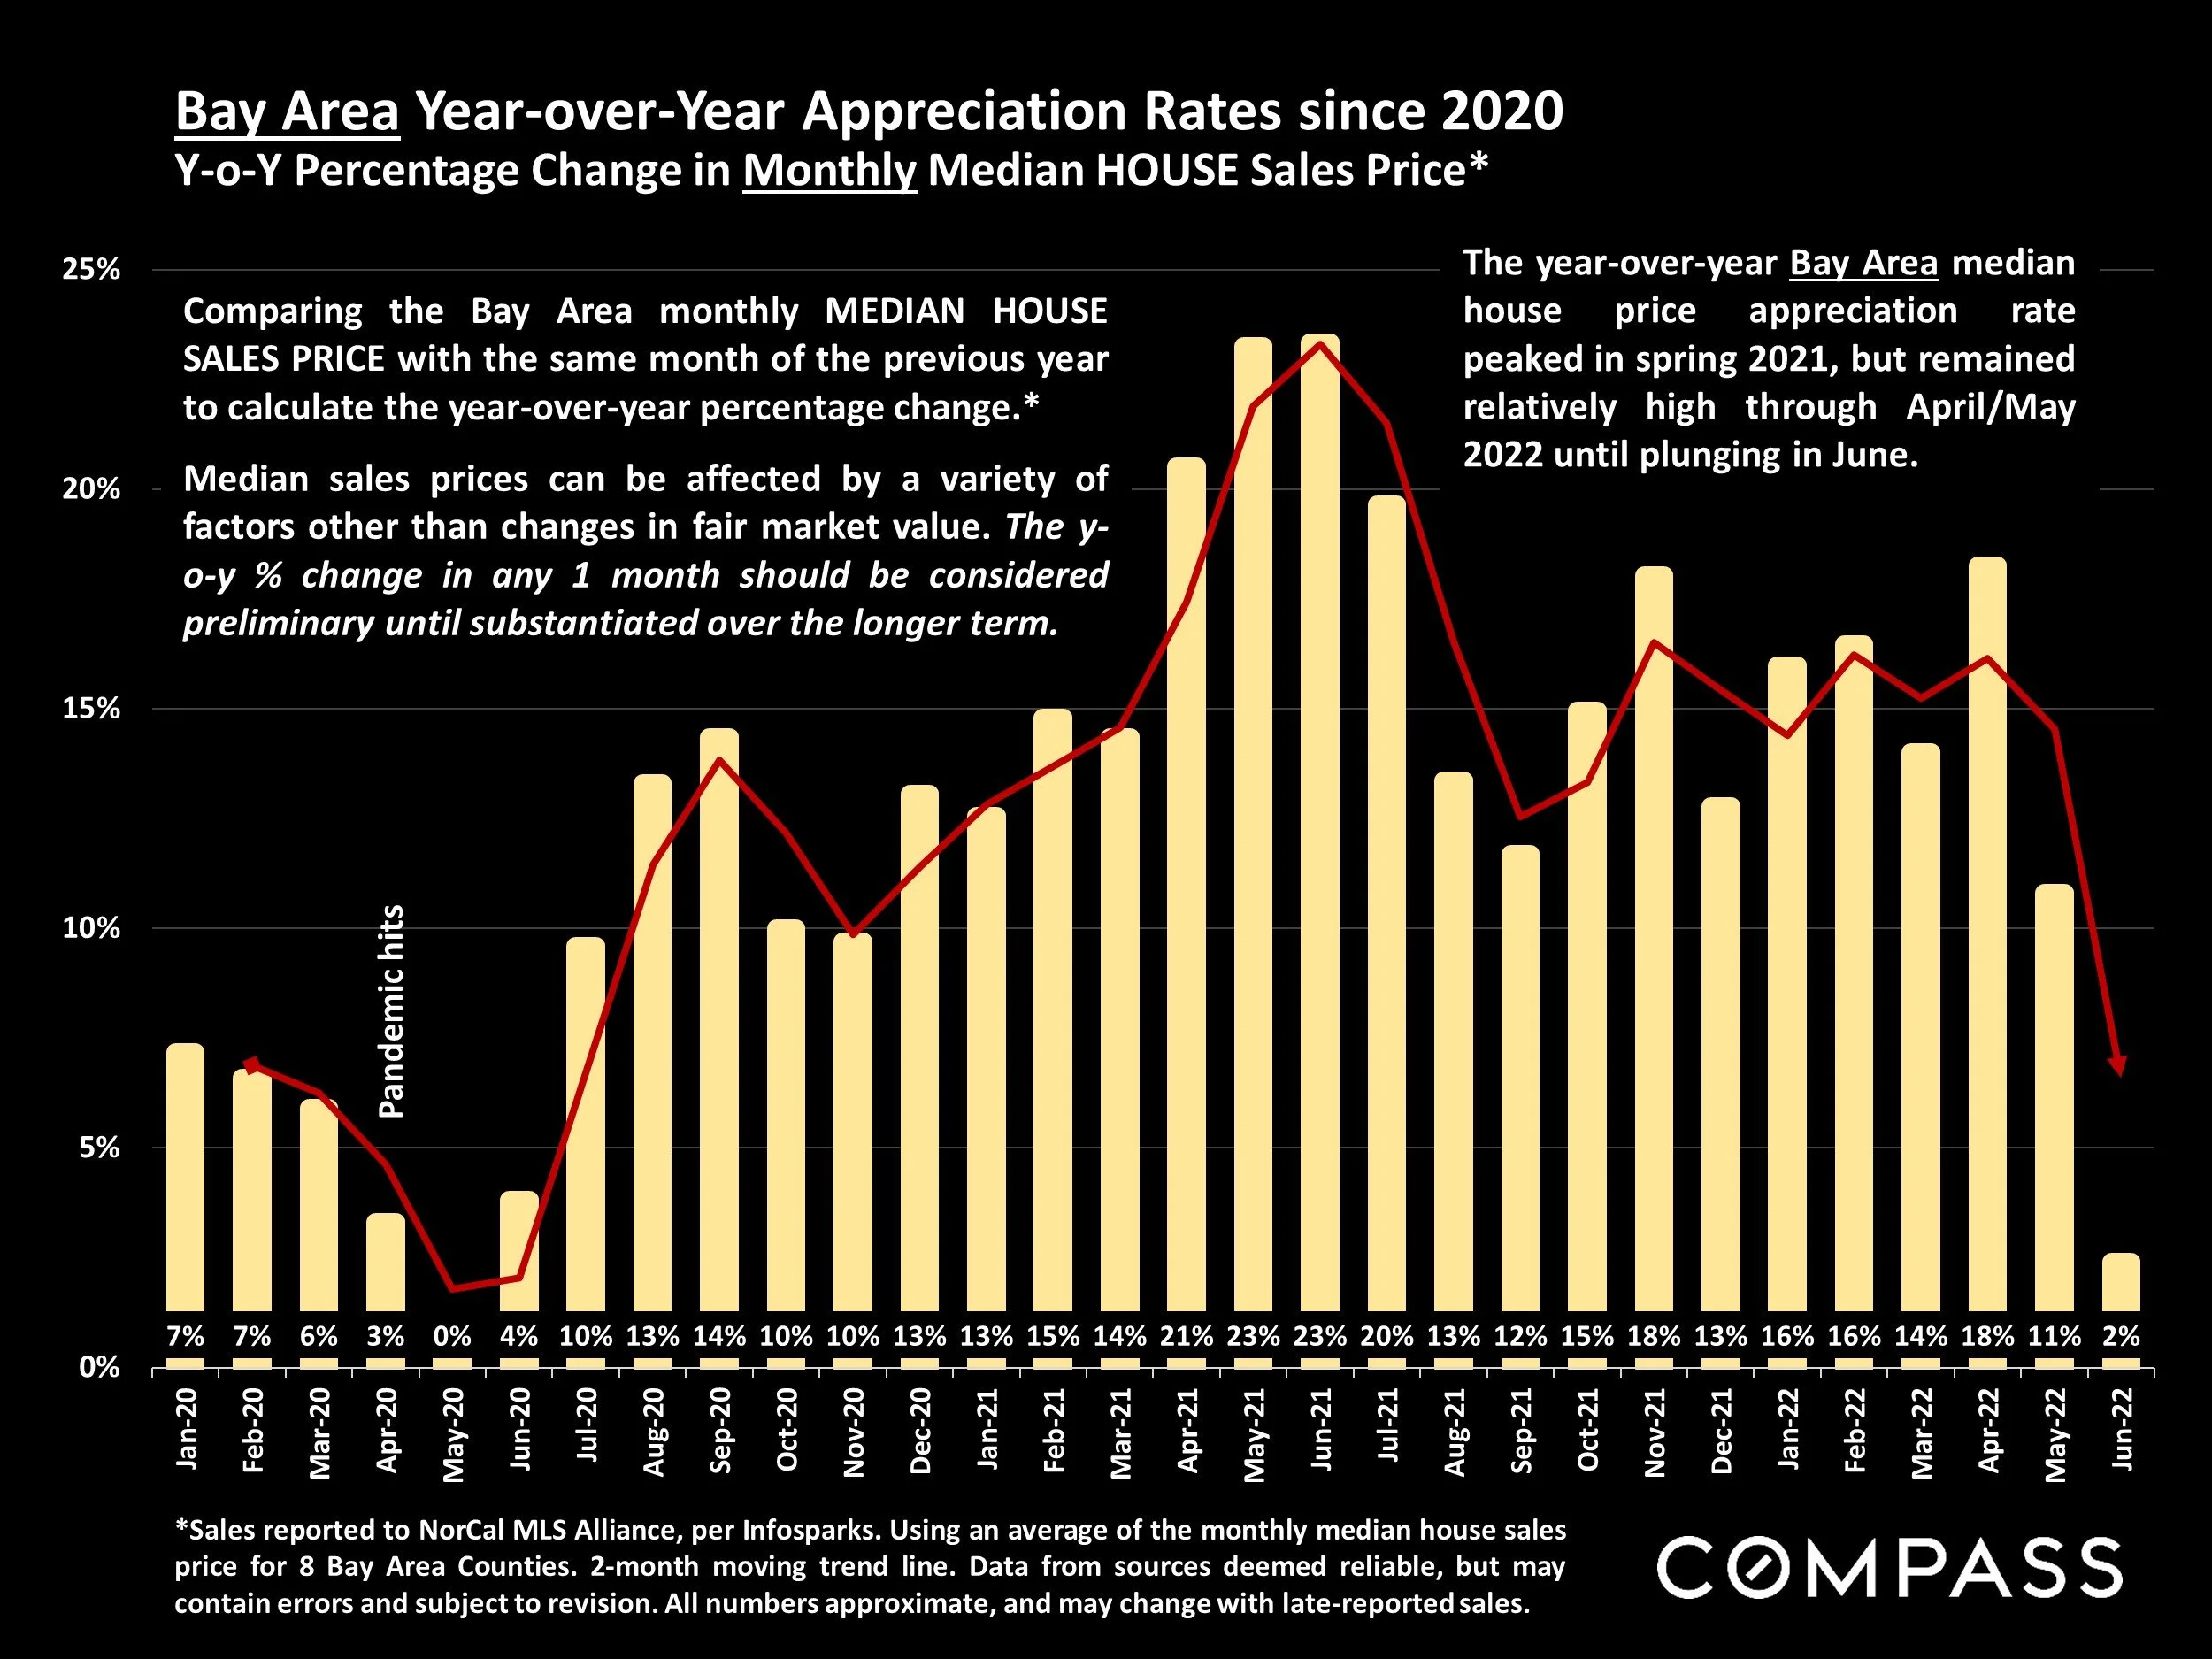
Sales reported to NorCal MLS Alliance, per Infosparks. Using an average of the monthly median house sales price for 8 Bay Area Counties. 2-month moving trendline. Data from sources deemed reliable, but may contain errors and subject to revision. All numbers approximate, and may change with late-reported sales.
Comparing the Bay Area monthly MEDIAN HOUSE SALES PRICE with the same month of the previous year to calculate the year-over-year percentage change.
Median sales prices can be affected by a variety of factors other than changes in fair market value. The y-o-y % change in any 1 month should be considered preliminary until substantiated over the longer term.
The year-over-year Bay Area median house price appreciation rate peaked in spring 2021, but remained relatively high through April/May 2022 until plunging in June.
San Francisco Median Condo Price Trends
Median Condo Sales Prices, 2018 – Present, by Month
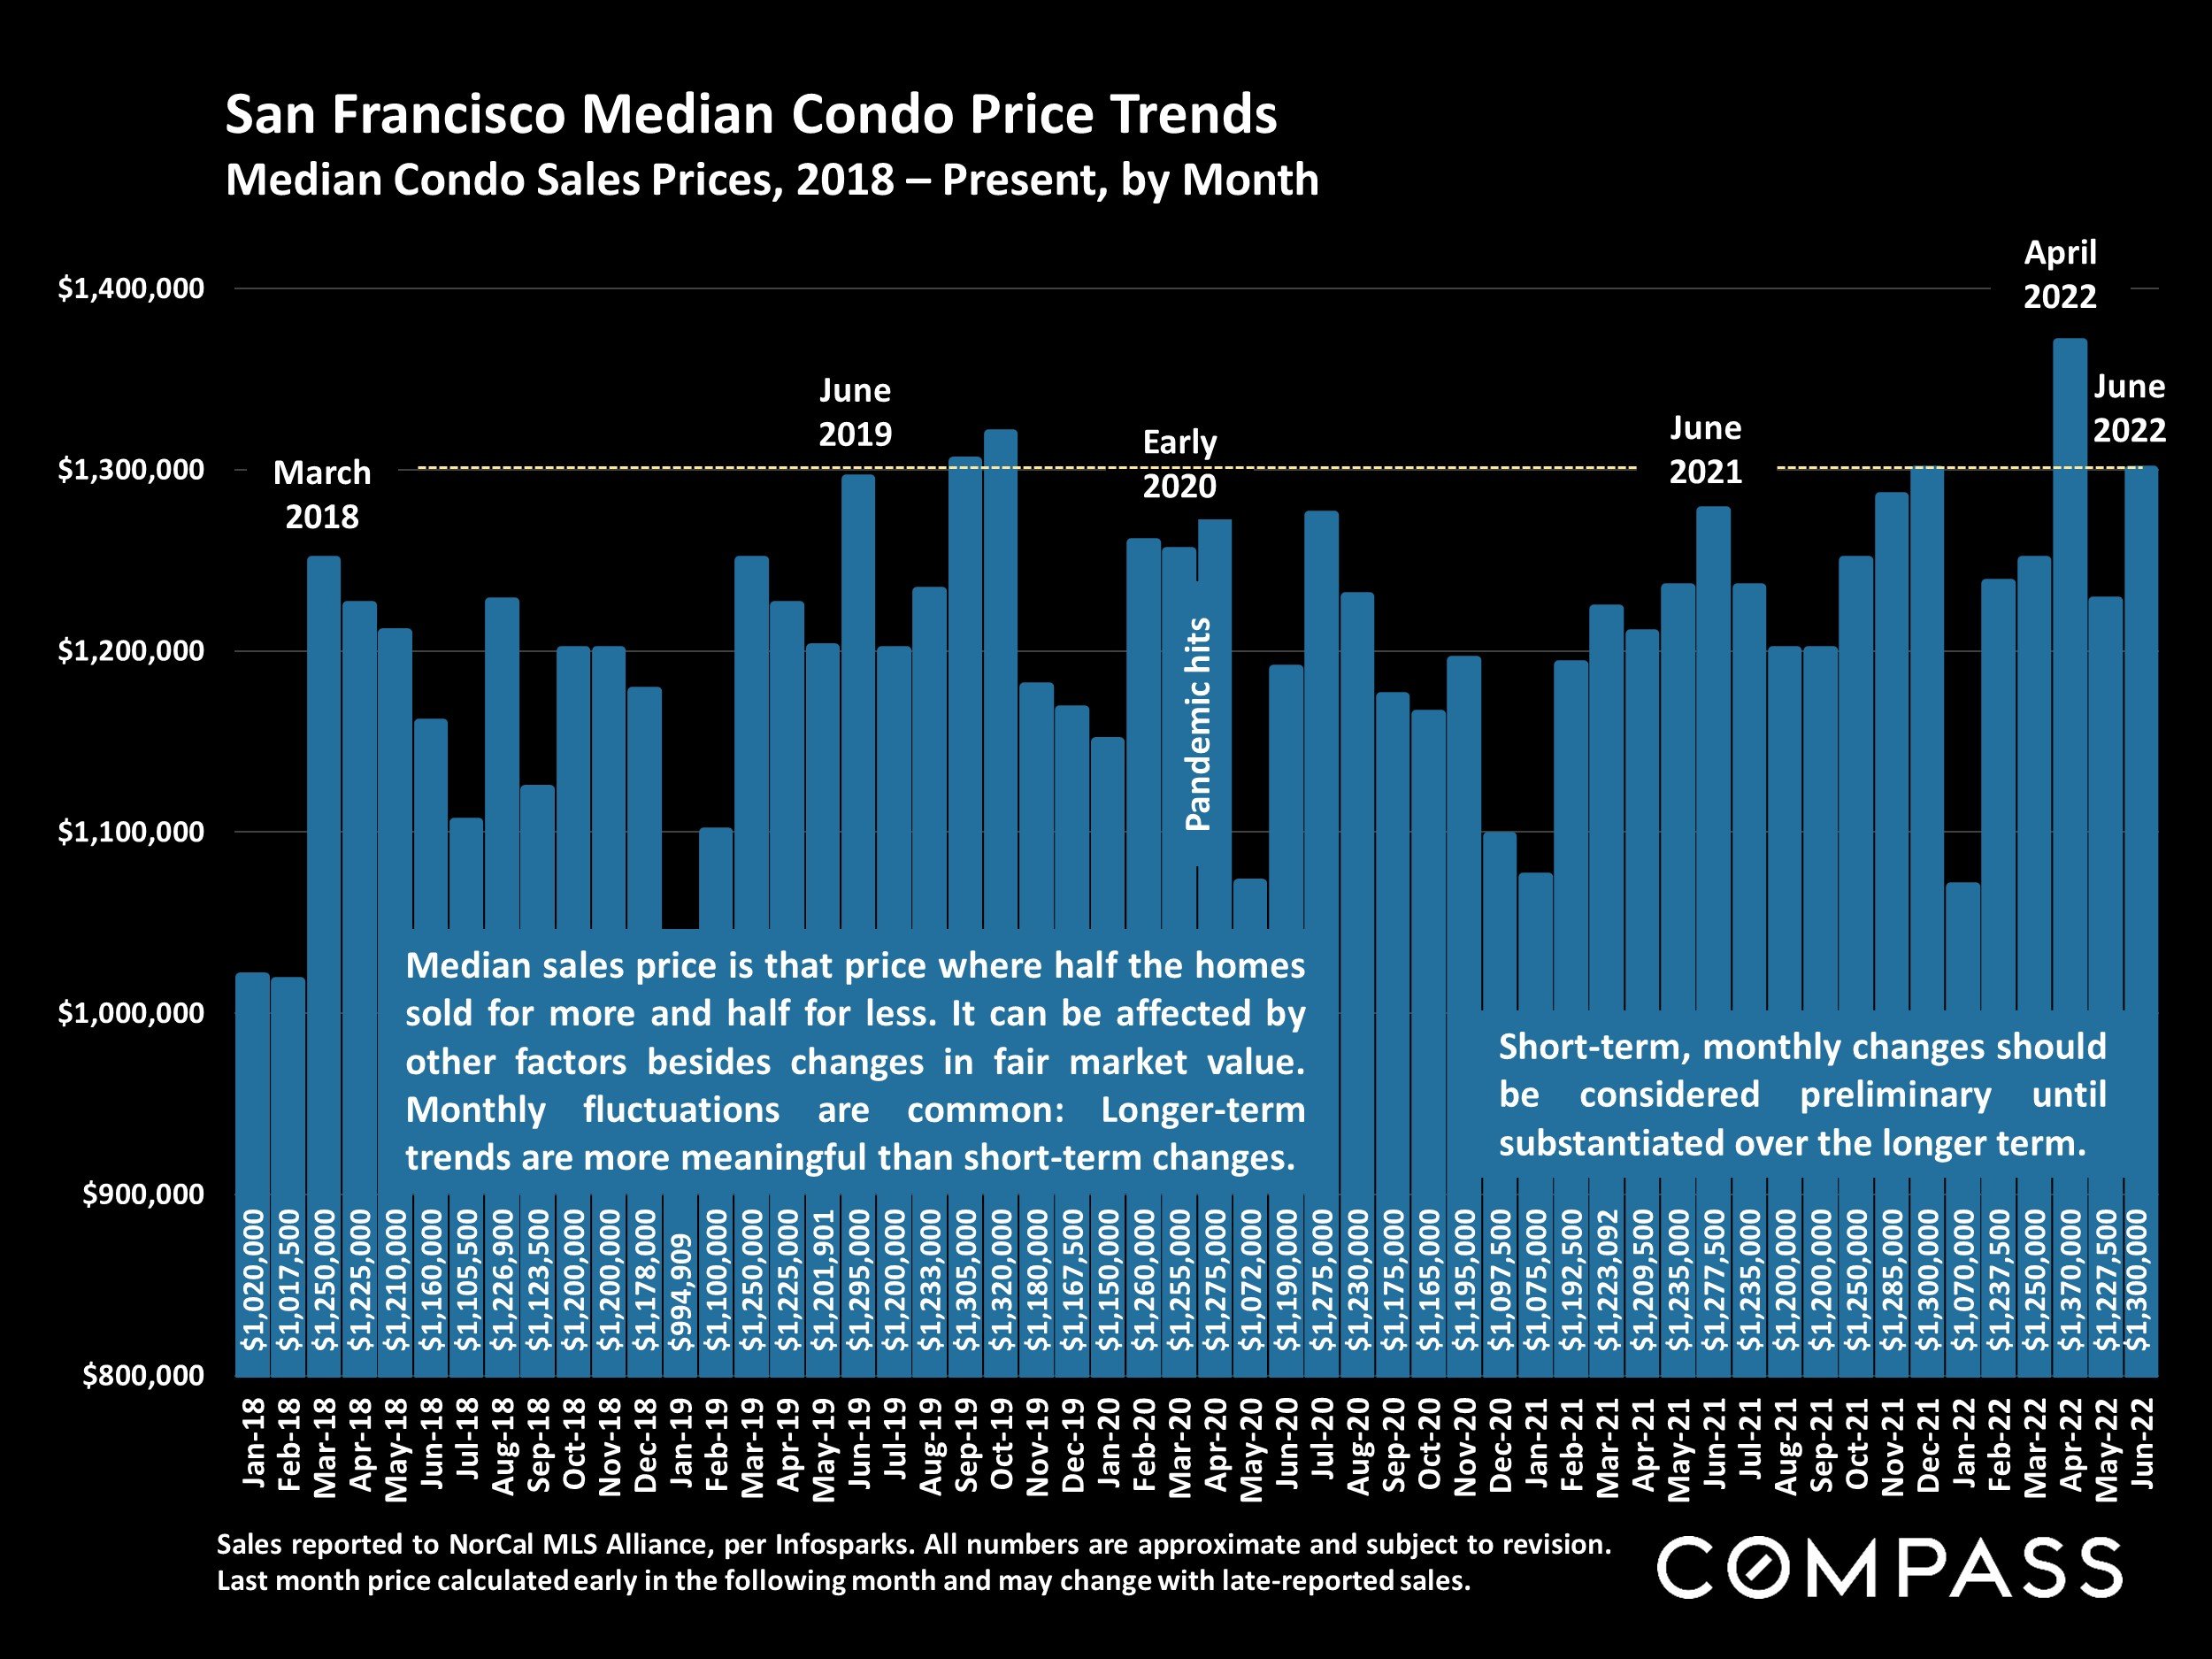
Sales reported to NorCal MLS Alliance, per Infosparks. All numbers are approximate and subject to revision. Last month price calculated early in the following month and may change with late-reported sales.
Median sales price is that price where half the homes sold for more and half for less. It can be affected by other factors besides changes in fair market value. Monthly and seasonal fluctuations are common, and longer-term trends are more meaningful than short-term changes.
New Listings Coming on Market
San Francisco Market Dynamics: Year-over-Year Comparison
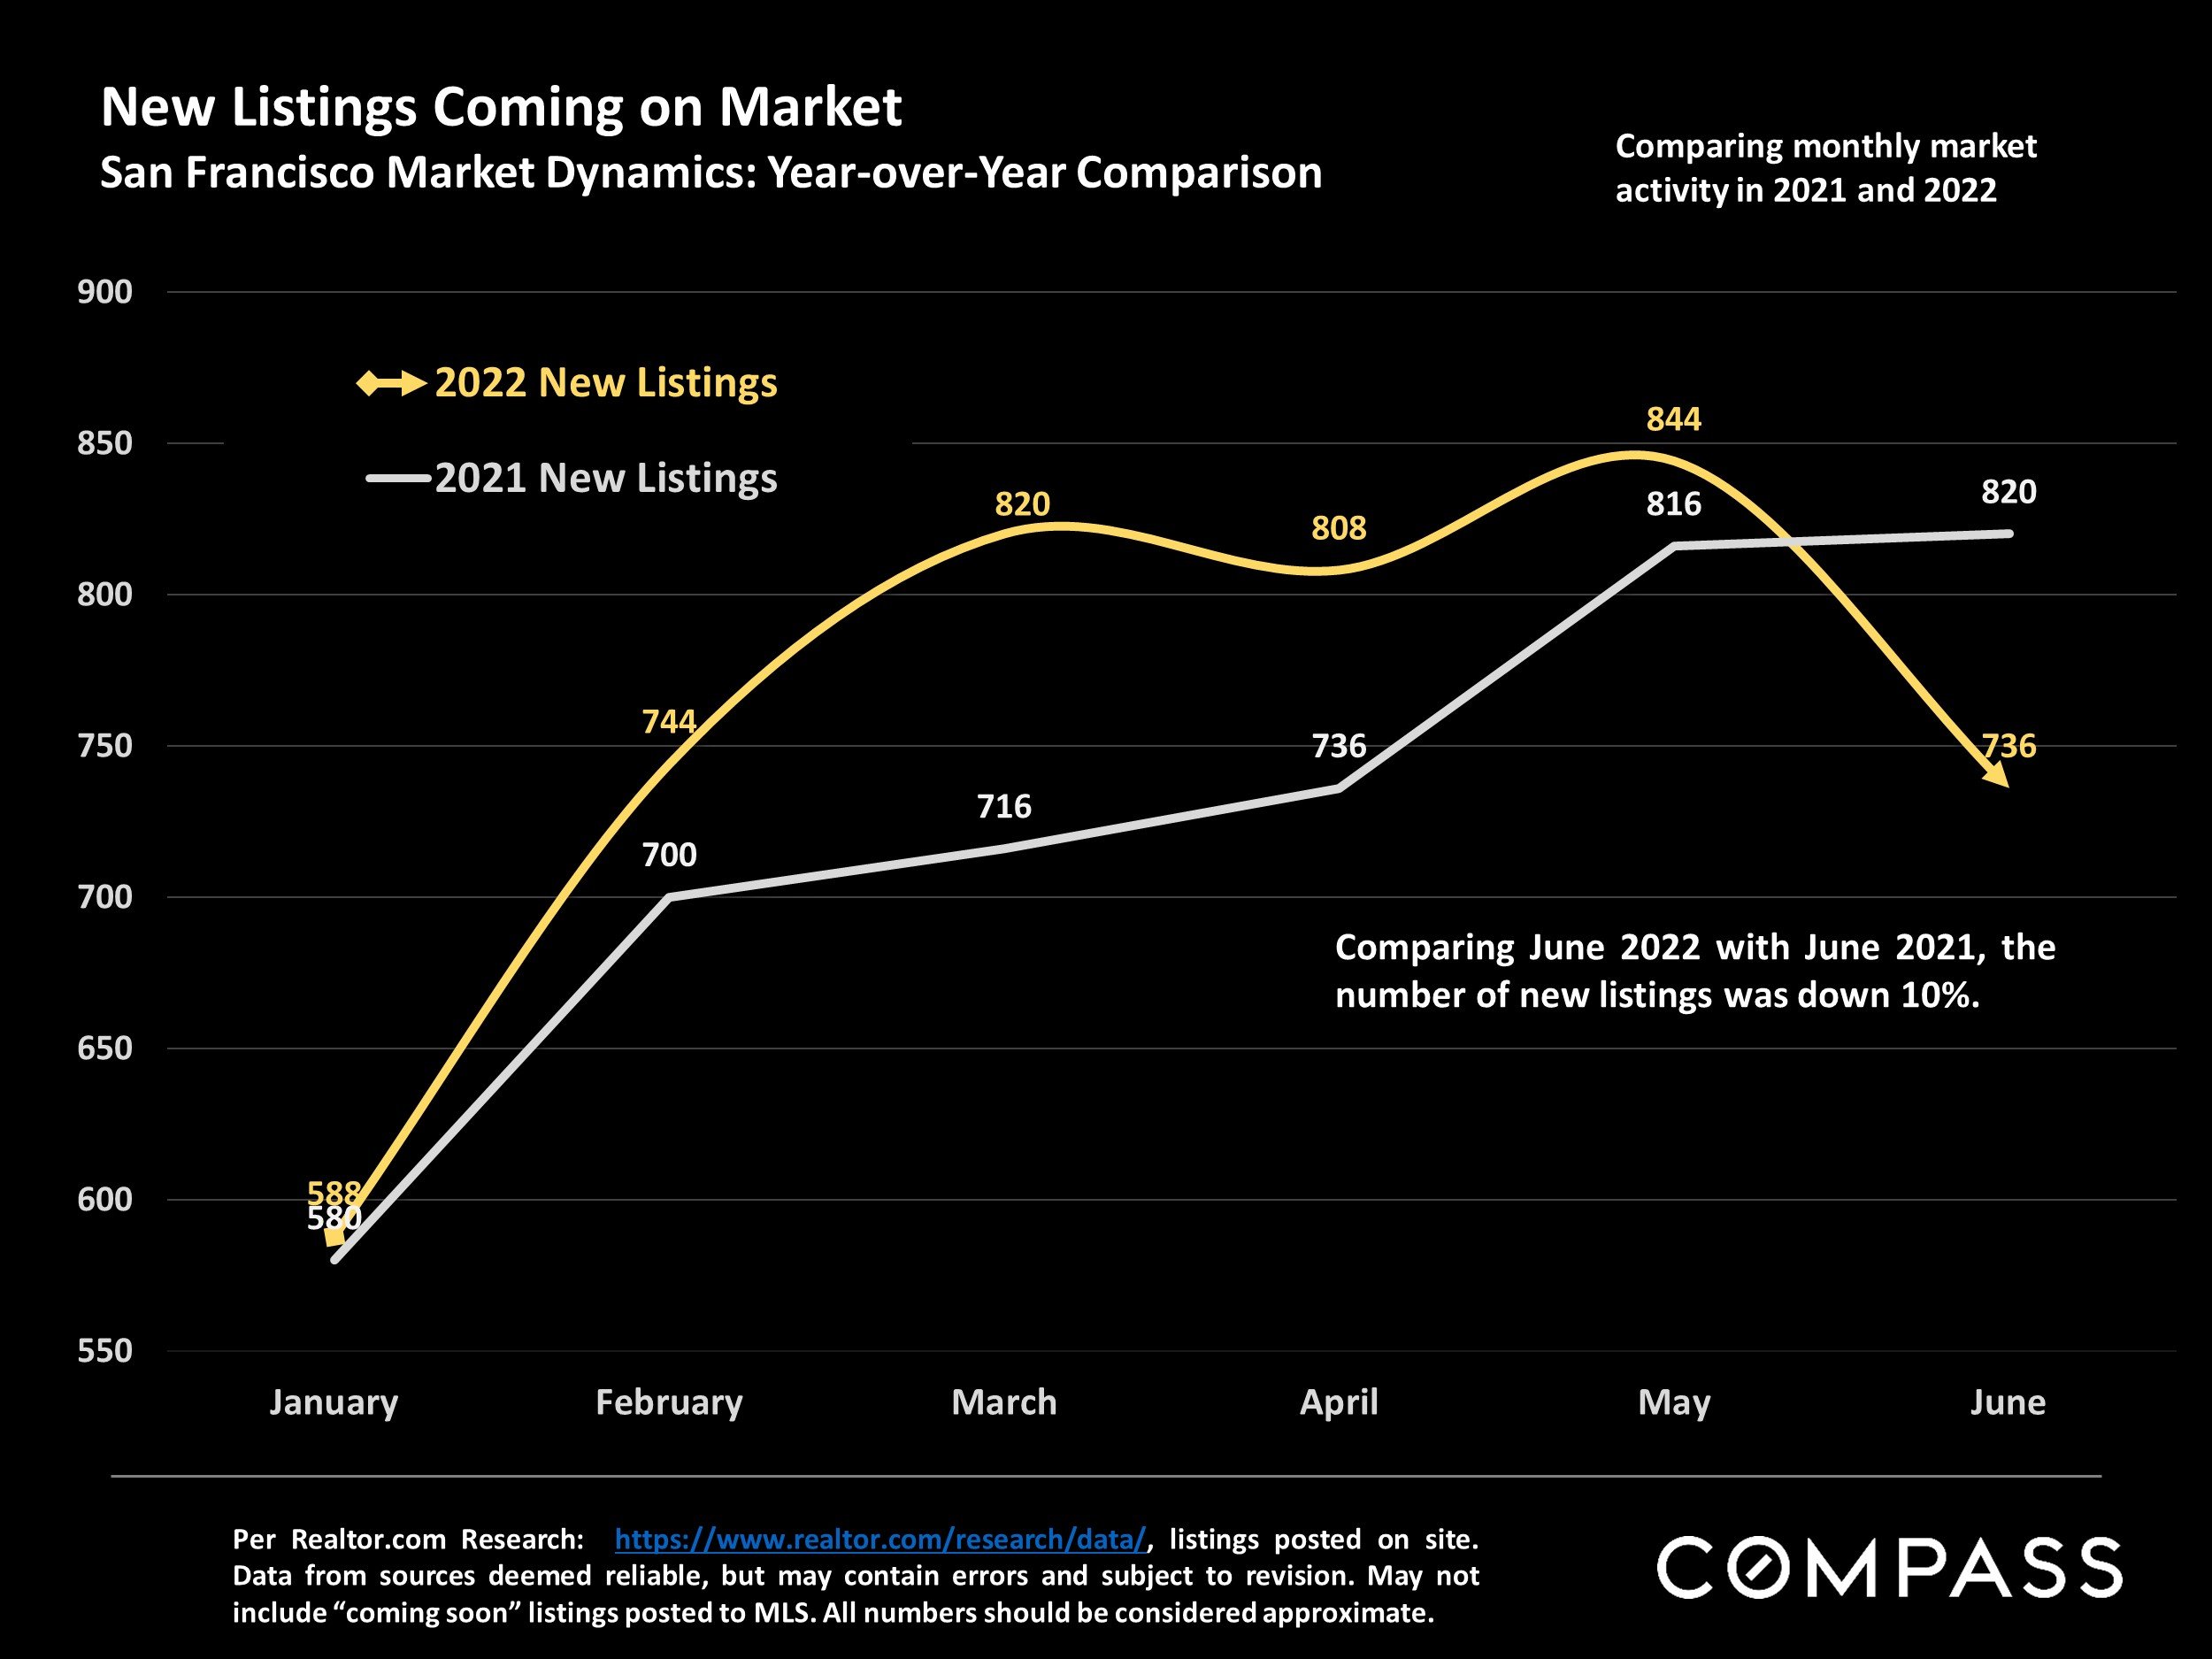
Per Realtor.com Research: https://www.realtor.com/research/data/, listings posted on site. Data from sources deemed reliable, but may contain errors and subject to revision. May not include “coming soon” listings posted to MLS. All numbers should be considered approximate.
Comparing June 2022 with June 2021, the number of new listings was down 10%.
Active Listings
San Francisco Market: Year-over-Year Comparison
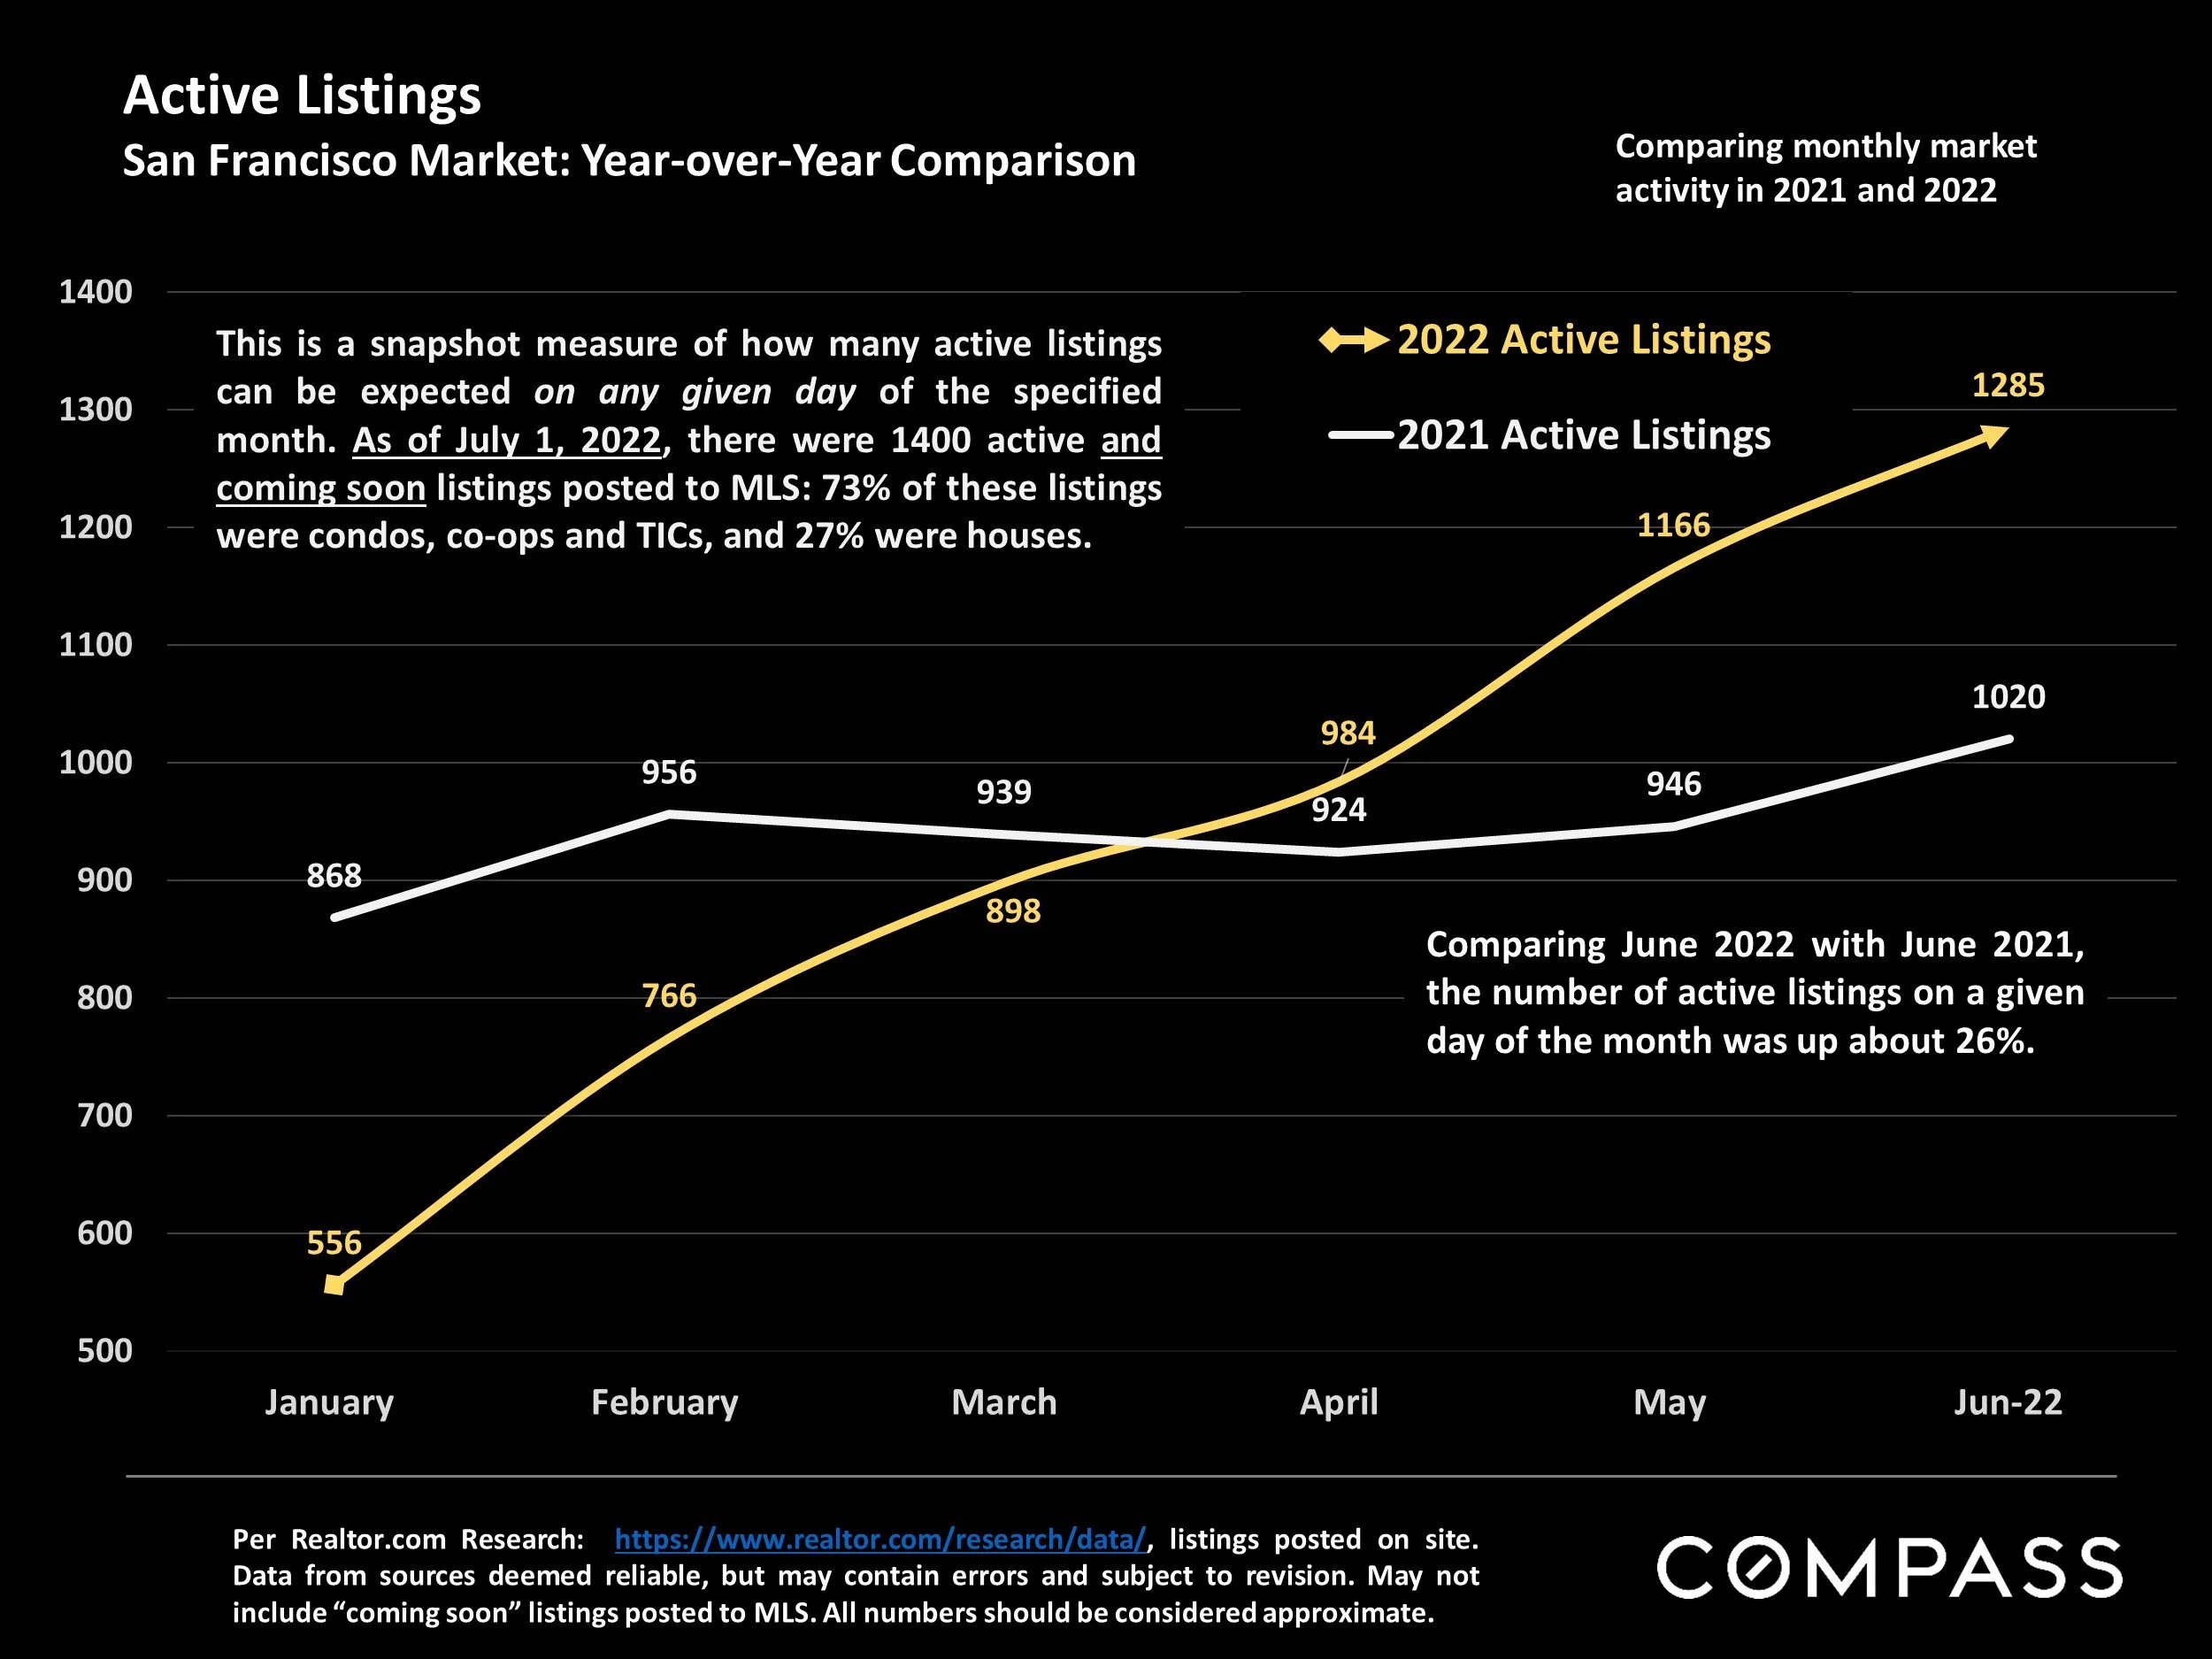
Per Realtor.com Research: https://www.realtor.com/research/data/, listings posted on site. Data from sources deemed reliable, but may contain errors and subject to revision. May not include “coming soon” listings posted to MLS. All numbers should be considered approximate.
This is a snapshot measure of how many active listings can be expected on any given day of the specified month. As of July 1, 2022, there were 1400 active and coming soon listings posted to MLS: 73% of these listings were condos, co-ops and TICs, and 27% were houses.
Comparing June 2022 with June 2021, the number of active listings on a given day of the month was up about 26%. This could be good news for buyers. Increased inventory combined with reduced demand can create a less competitive bidding environment.
Active Listings on Market – Longer-Term Trends
San Francisco Real Estate Market Dynamics & Seasonality

Per Realtor.com Research: https://www.realtor.com/research/data/, listings posted on site. Data from sources deemed reliable, but may contain errors and subject to revision. All numbers should be considered approximate.
This is a snapshot measure of how many active listings can be expected on any given day of the specified month. The number of active listings on a given day is affected by 1) how many new listings come on market, 2) how quickly buyers snap them up, 3) the sustained heat of the market over time, and 4) how many sellers pull their homes off the market without selling. The number typically ebbs and flows by season.
Price Reductions on Active Listings
San Francisco Market Dynamics: Year-over-Year Comparison
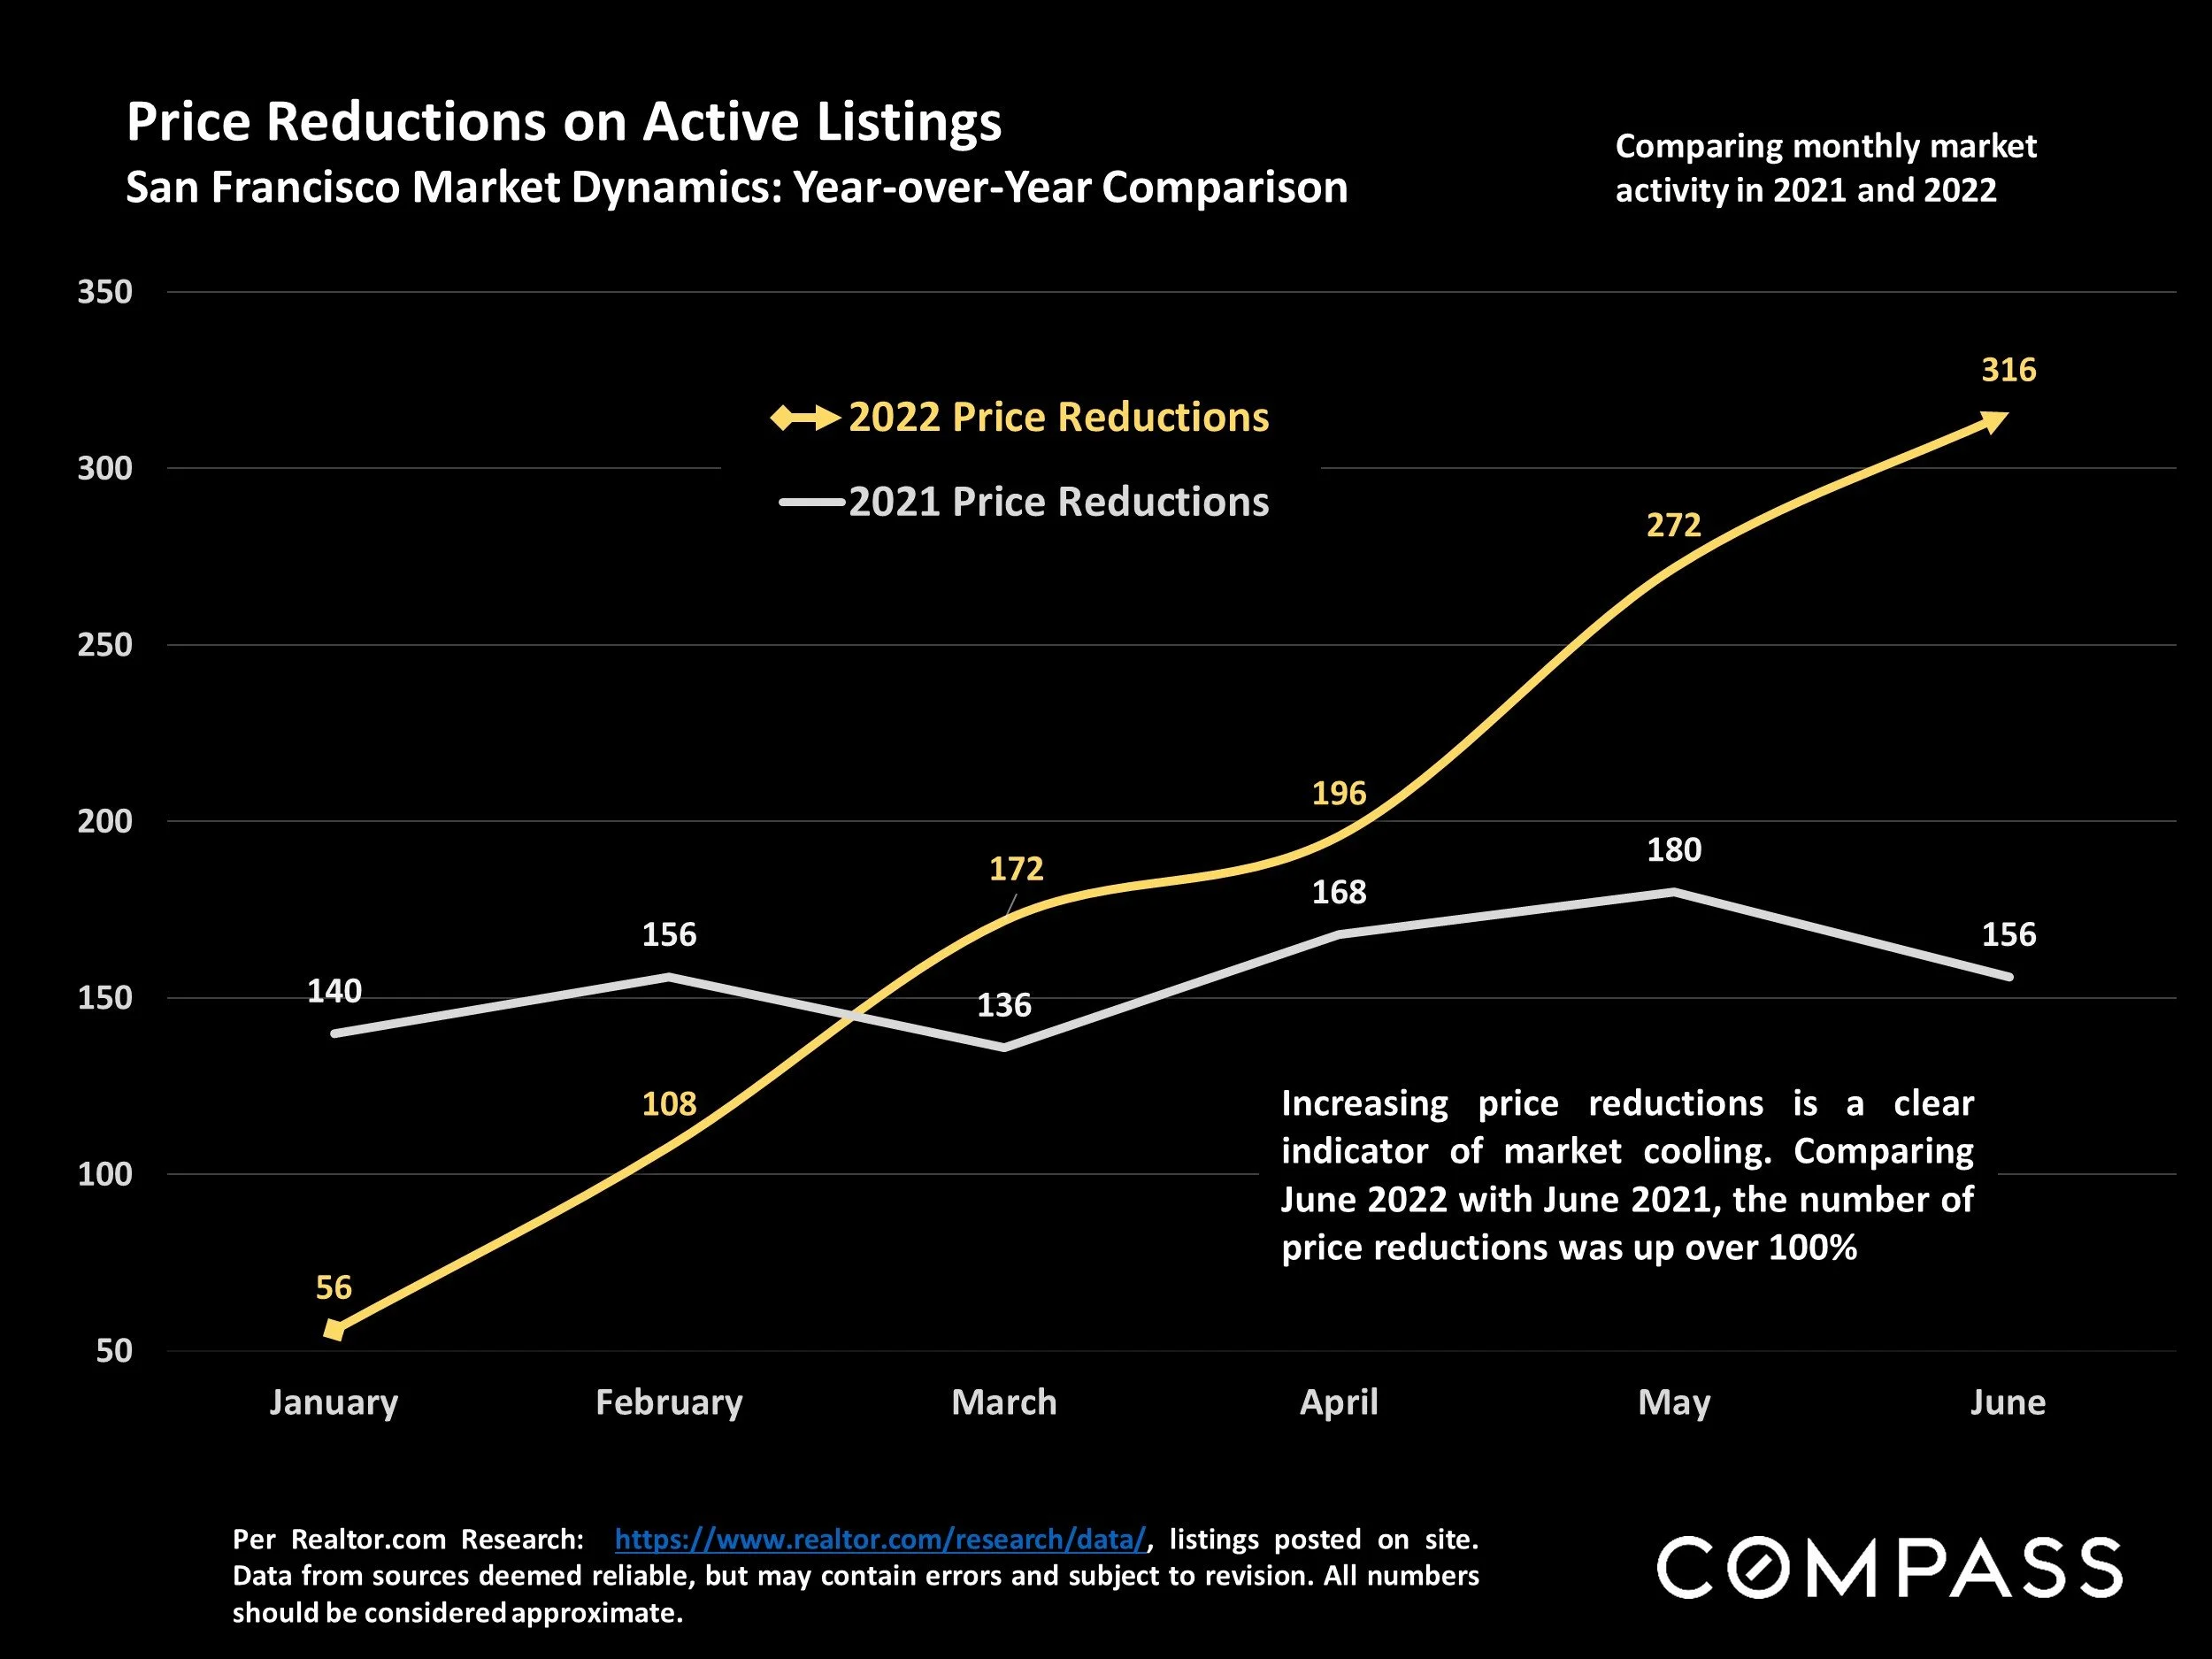
Per Realtor.com Research: https://www.realtor.com/research/data/, listings posted on site. Data from sources deemed reliable, but may contain errors and subject to revision. All numbers should be considered approximate.
Increasing price reductions is a clear indicator of market cooling. Comparing June 2022 with June 2021, the number of price reductions was up over 100%. Again, this is potentially good news for buyers.
Monthly Sales Volume
San Francisco Market Dynamics: Year-over-Year Comparison
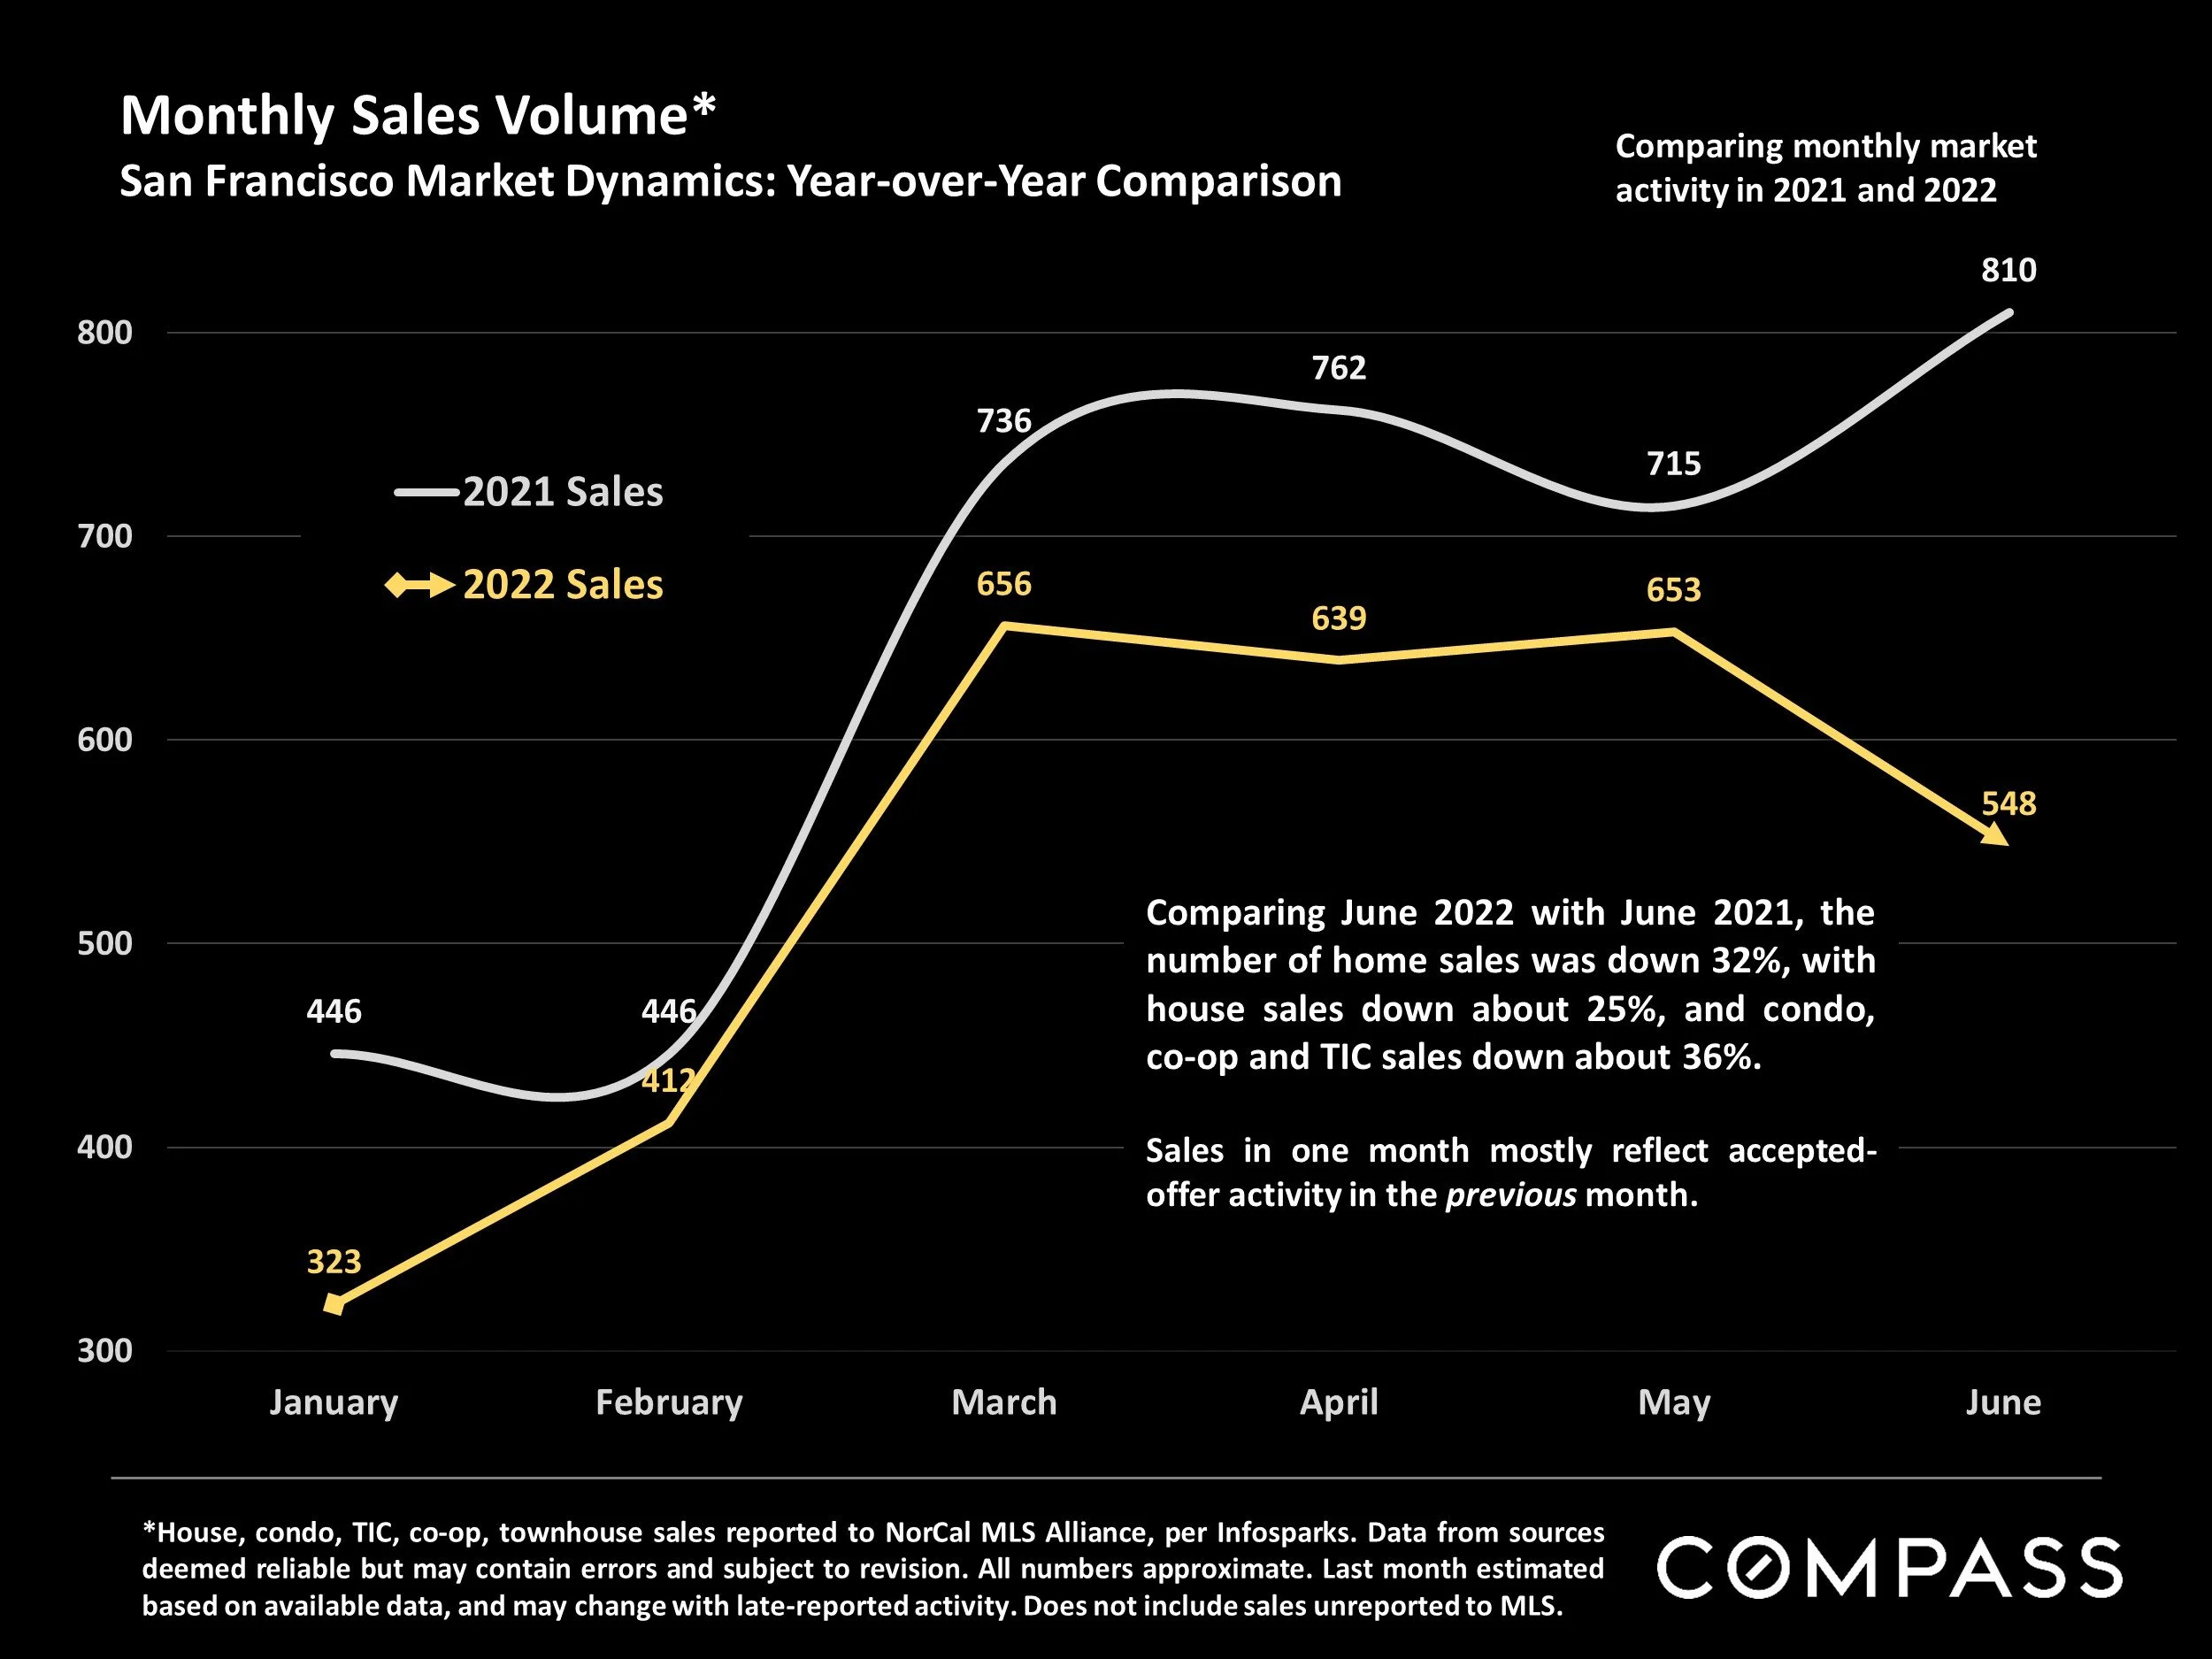
House, condo, TIC, co-op, townhouse sales reported to NorCal MLS Alliance, per Infosparks. Data from sources deemed reliable but may contain errors and subject to revision. All numbers approximate. Last month estimated based on available data, and may change with late-reported activity. Does not include sales unreported to MLS.
Comparing June 2022 with June 2021, the number of home sales was down 32%, with house sales down about 25%, and condo, co-op and TIC sales down about 36%.
Monthly Sales Volume – Longer-Term Trends
San Francisco Market Dynamics & Seasonality

House, condo, TIC, co-op sales reported to NorCal MLS Alliance, per Infosparks. Data from sources deemed reliable but may contain errors and subject to revision. All numbers approximate. Last month estimated based on data available early the next month, and may change with late reported sales.
As illustrated, sales volume usually ebbs and flows by season: Up in spring, down in summer, back up in fall, and way down in mid-winter.
Listings Accepting Offers (Going into Contract)
San Francisco Market Dynamics: Year-over-Year Comparison
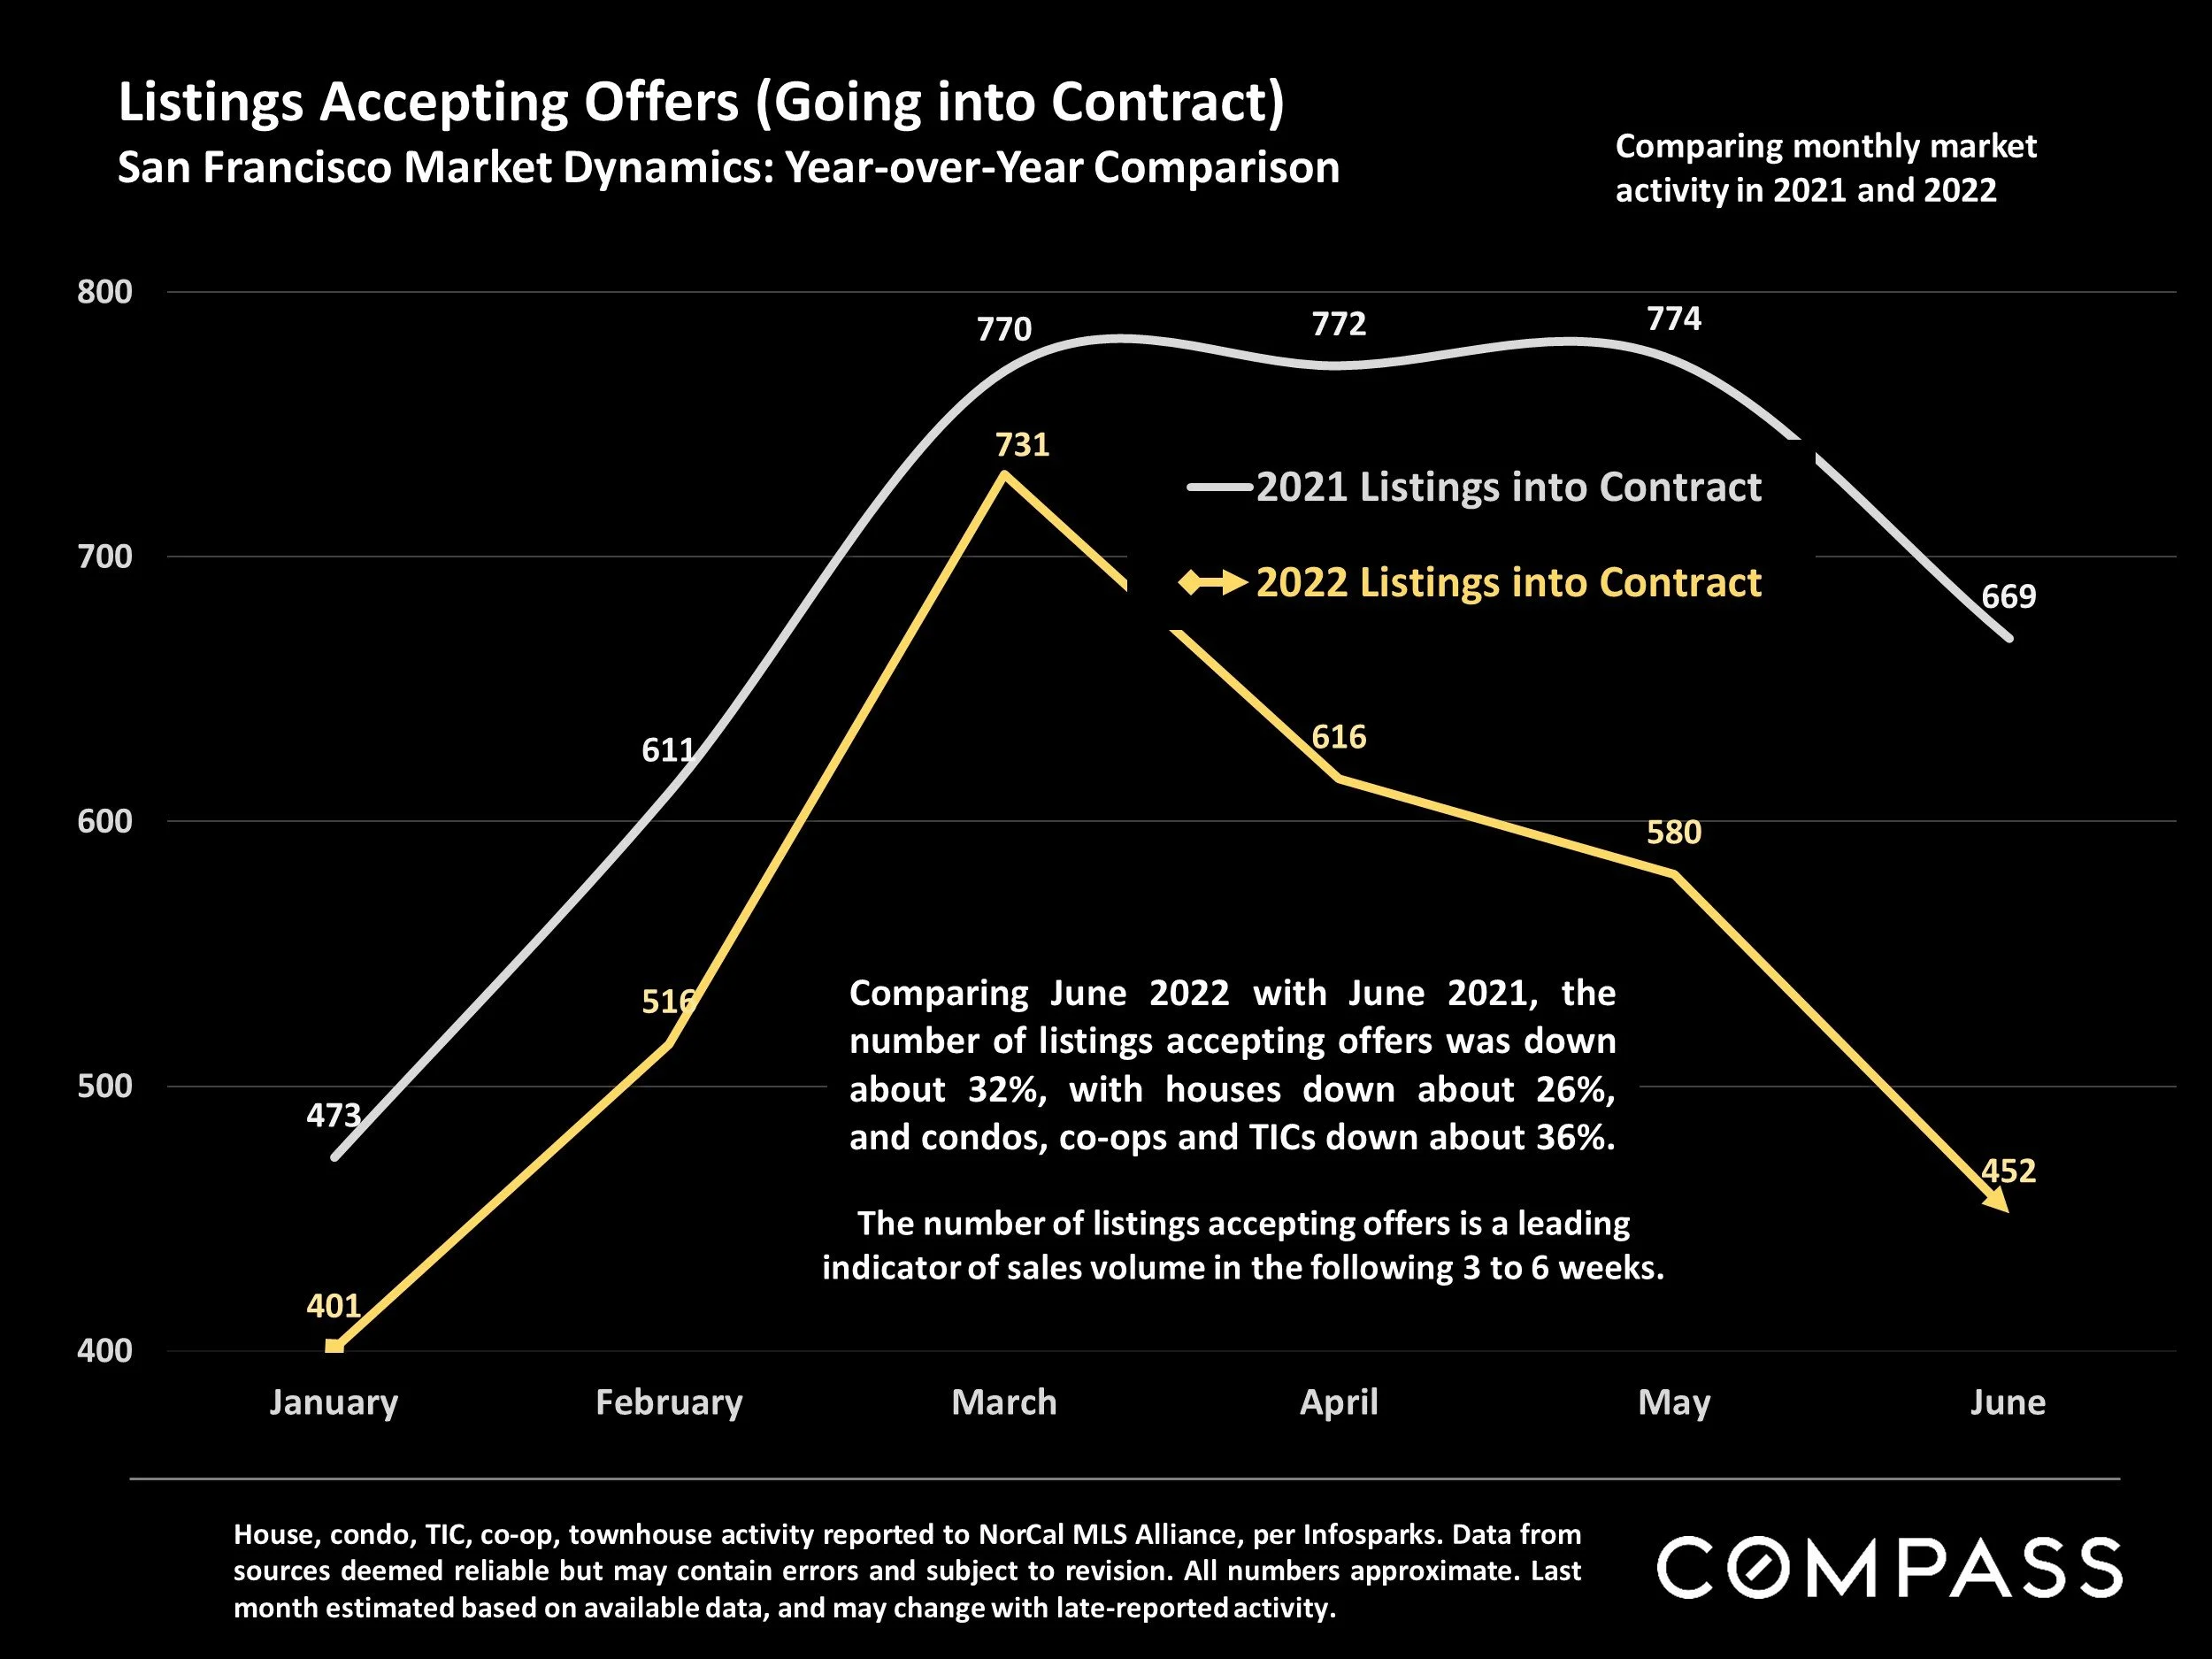
House, condo, TIC, co-op, townhouse activity reported to NorCal MLS Alliance, per Infosparks. Data from sources deemed reliable but may contain errors and subject to revision. All numbers approximate. Last month estimated based on available data, and may change with late-reported activity.
Comparing June 2022 with June 2021, the number of listings accepting offers was down about 32%, with houses down about 26%, and condos, co-ops and TICs down about 36%. The number of listings accepting offers is a leading indicator of sales volume in the following 3 to 6 weeks.
Listings Accepting Offers — Longer-Term Trends
San Francisco Market Dynamics & Seasonality
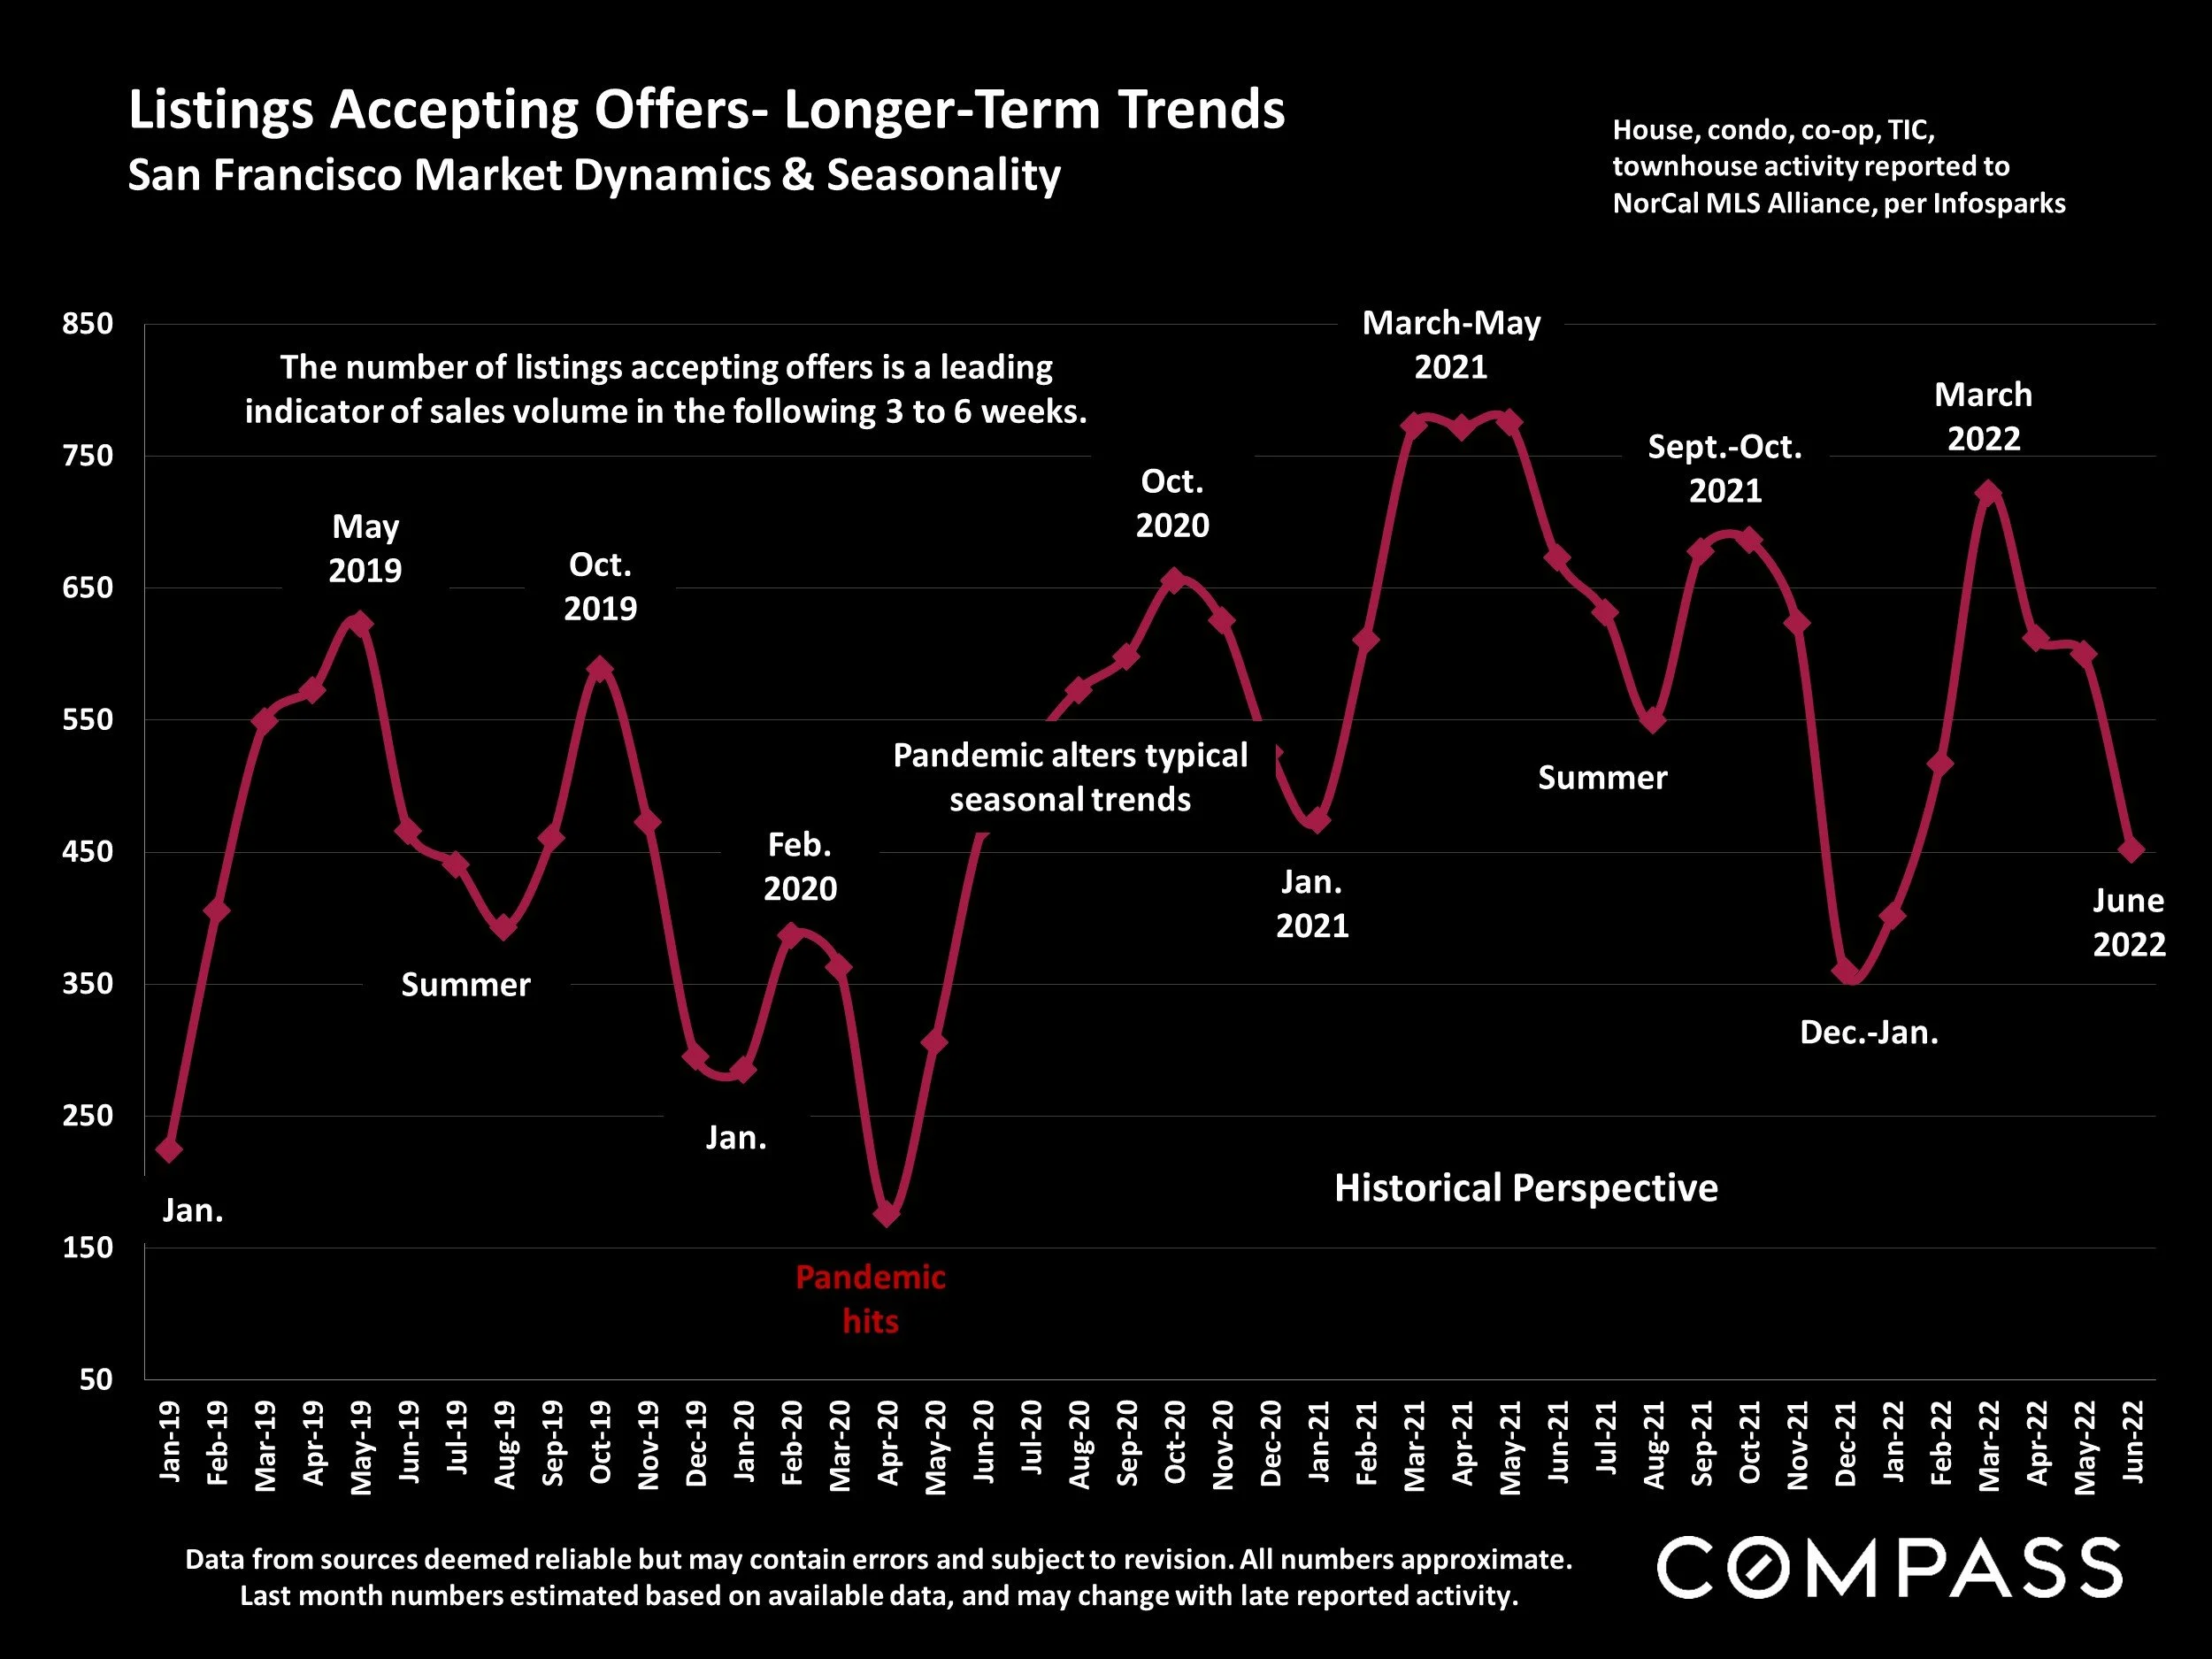
Data from sources deemed reliable but may contain errors and subject to revision. All numbers approximate. Last month numbers estimated based on available data, and may change with late reported activity.
The number of listings accepting offers is a leading indicator of sales volume in the following 3 to 6 weeks.
Higher-Price Home Sales Volume
San Francisco Market Dynamics: Sales $3 Million+
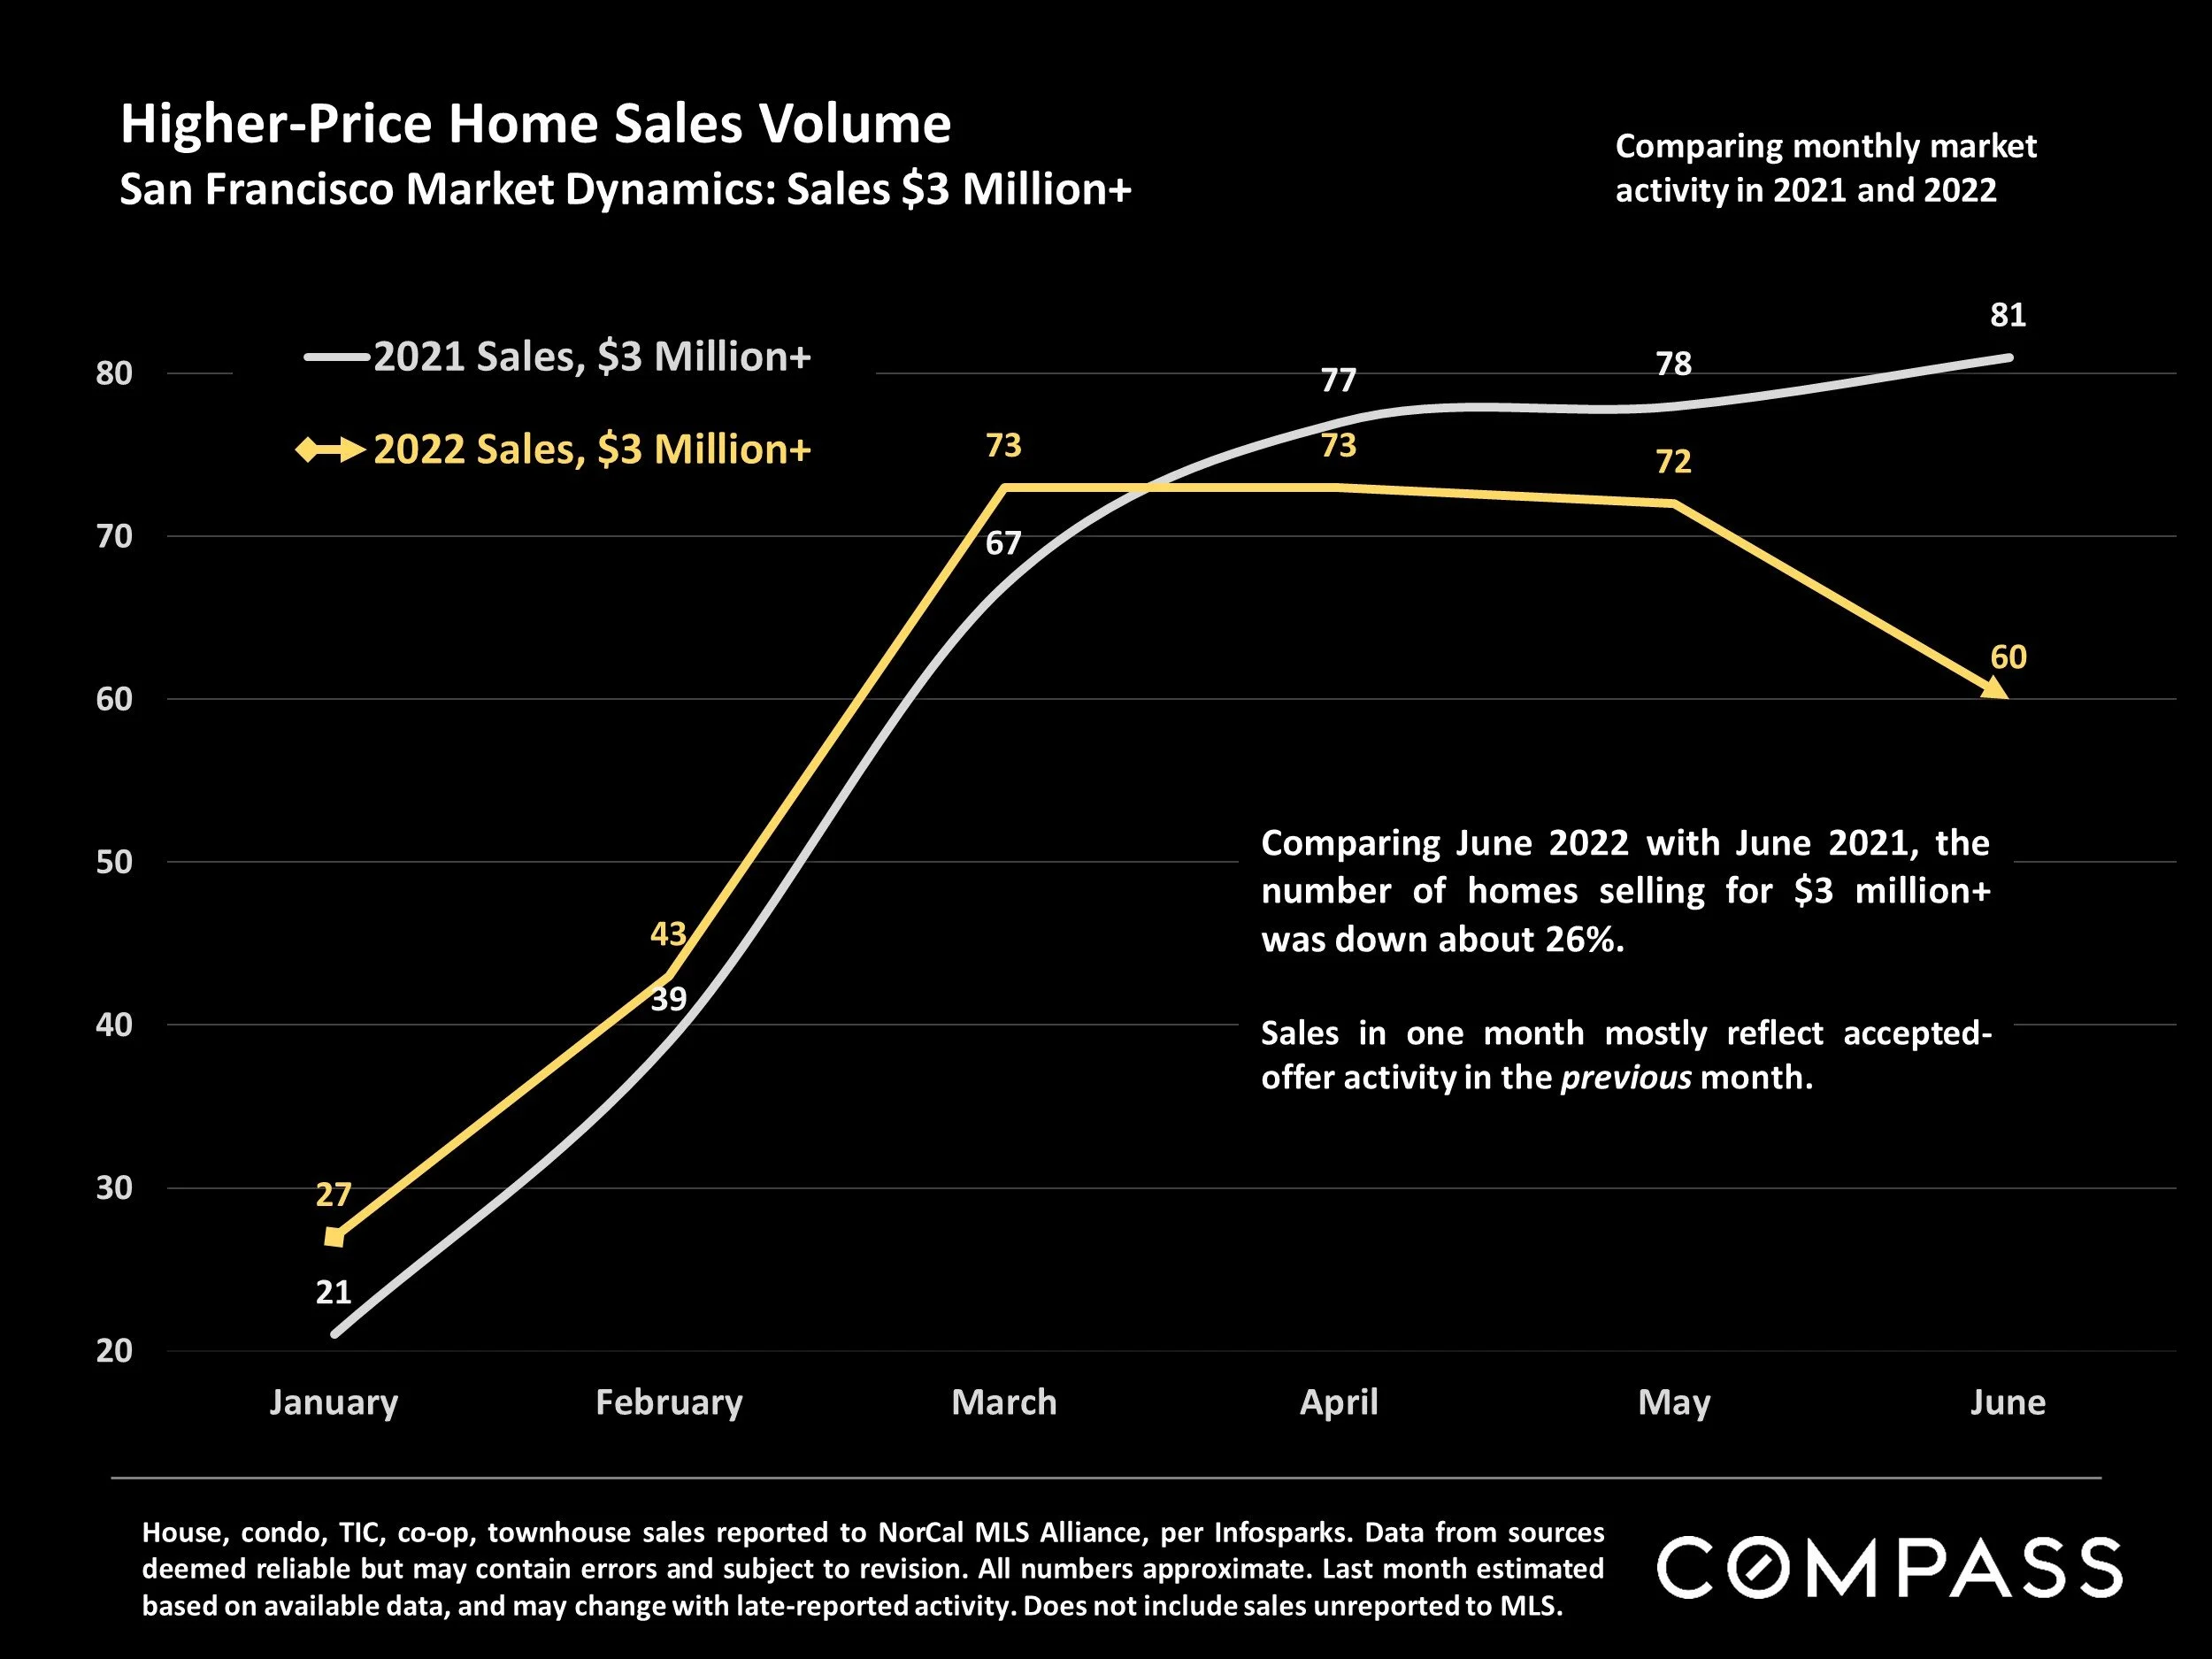
House, condo, TIC, co-op, townhouse sales reported to NorCal MLS Alliance, per Infosparks. Data from sources deemed reliable but may contain errors and subject to revision. All numbers approximate. Last month estimated based on available data, and may change with late-reported activity. Does not include sales unreported to MLS.
Comparing June 2022 with June 2021, the number of homes selling for $3 million+ was down about 26%. Sales in one month mostly reflect accepted-offer activity in the previous month.
Higher-Price Home Listings Accepting Offers
San Francisco Market Dynamics: Homes Priced $3 Million+

House, condo, TIC, co-op, townhouse sales reported to NorCal MLS Alliance, per Infosparks. Data from sources deemed reliable but may contain errors and subject to revision. All numbers approximate. Last month estimated based on available data, and may change with late-reported activity. Does not include sales unreported to MLS.
Comparing June 2022 with June 2021, the number of home listings priced $3 million+ accepting offers (going into contract) was down about 38%.
Average Sales Price to Original List Price Percentage
San Francisco Overbidding: Market Dynamics & Seasonality

Sales reported to NorCal MLS Alliance, per Infosparks. Data derived from sources deemed reliable, but may contain errors and subject to revision. All numbers approximate, and may change with late-reported sales.
Houses have much higher average overbidding percentages than condos. Both have seen declines since April 2022 – 6.5 points for houses, 2.6 points for condos. This statistic fluctuates by season, and is a lagging indicator of market activity 3-6 weeks earlier.
Average Days on Market
San Francisco Market Dynamics & Seasonality
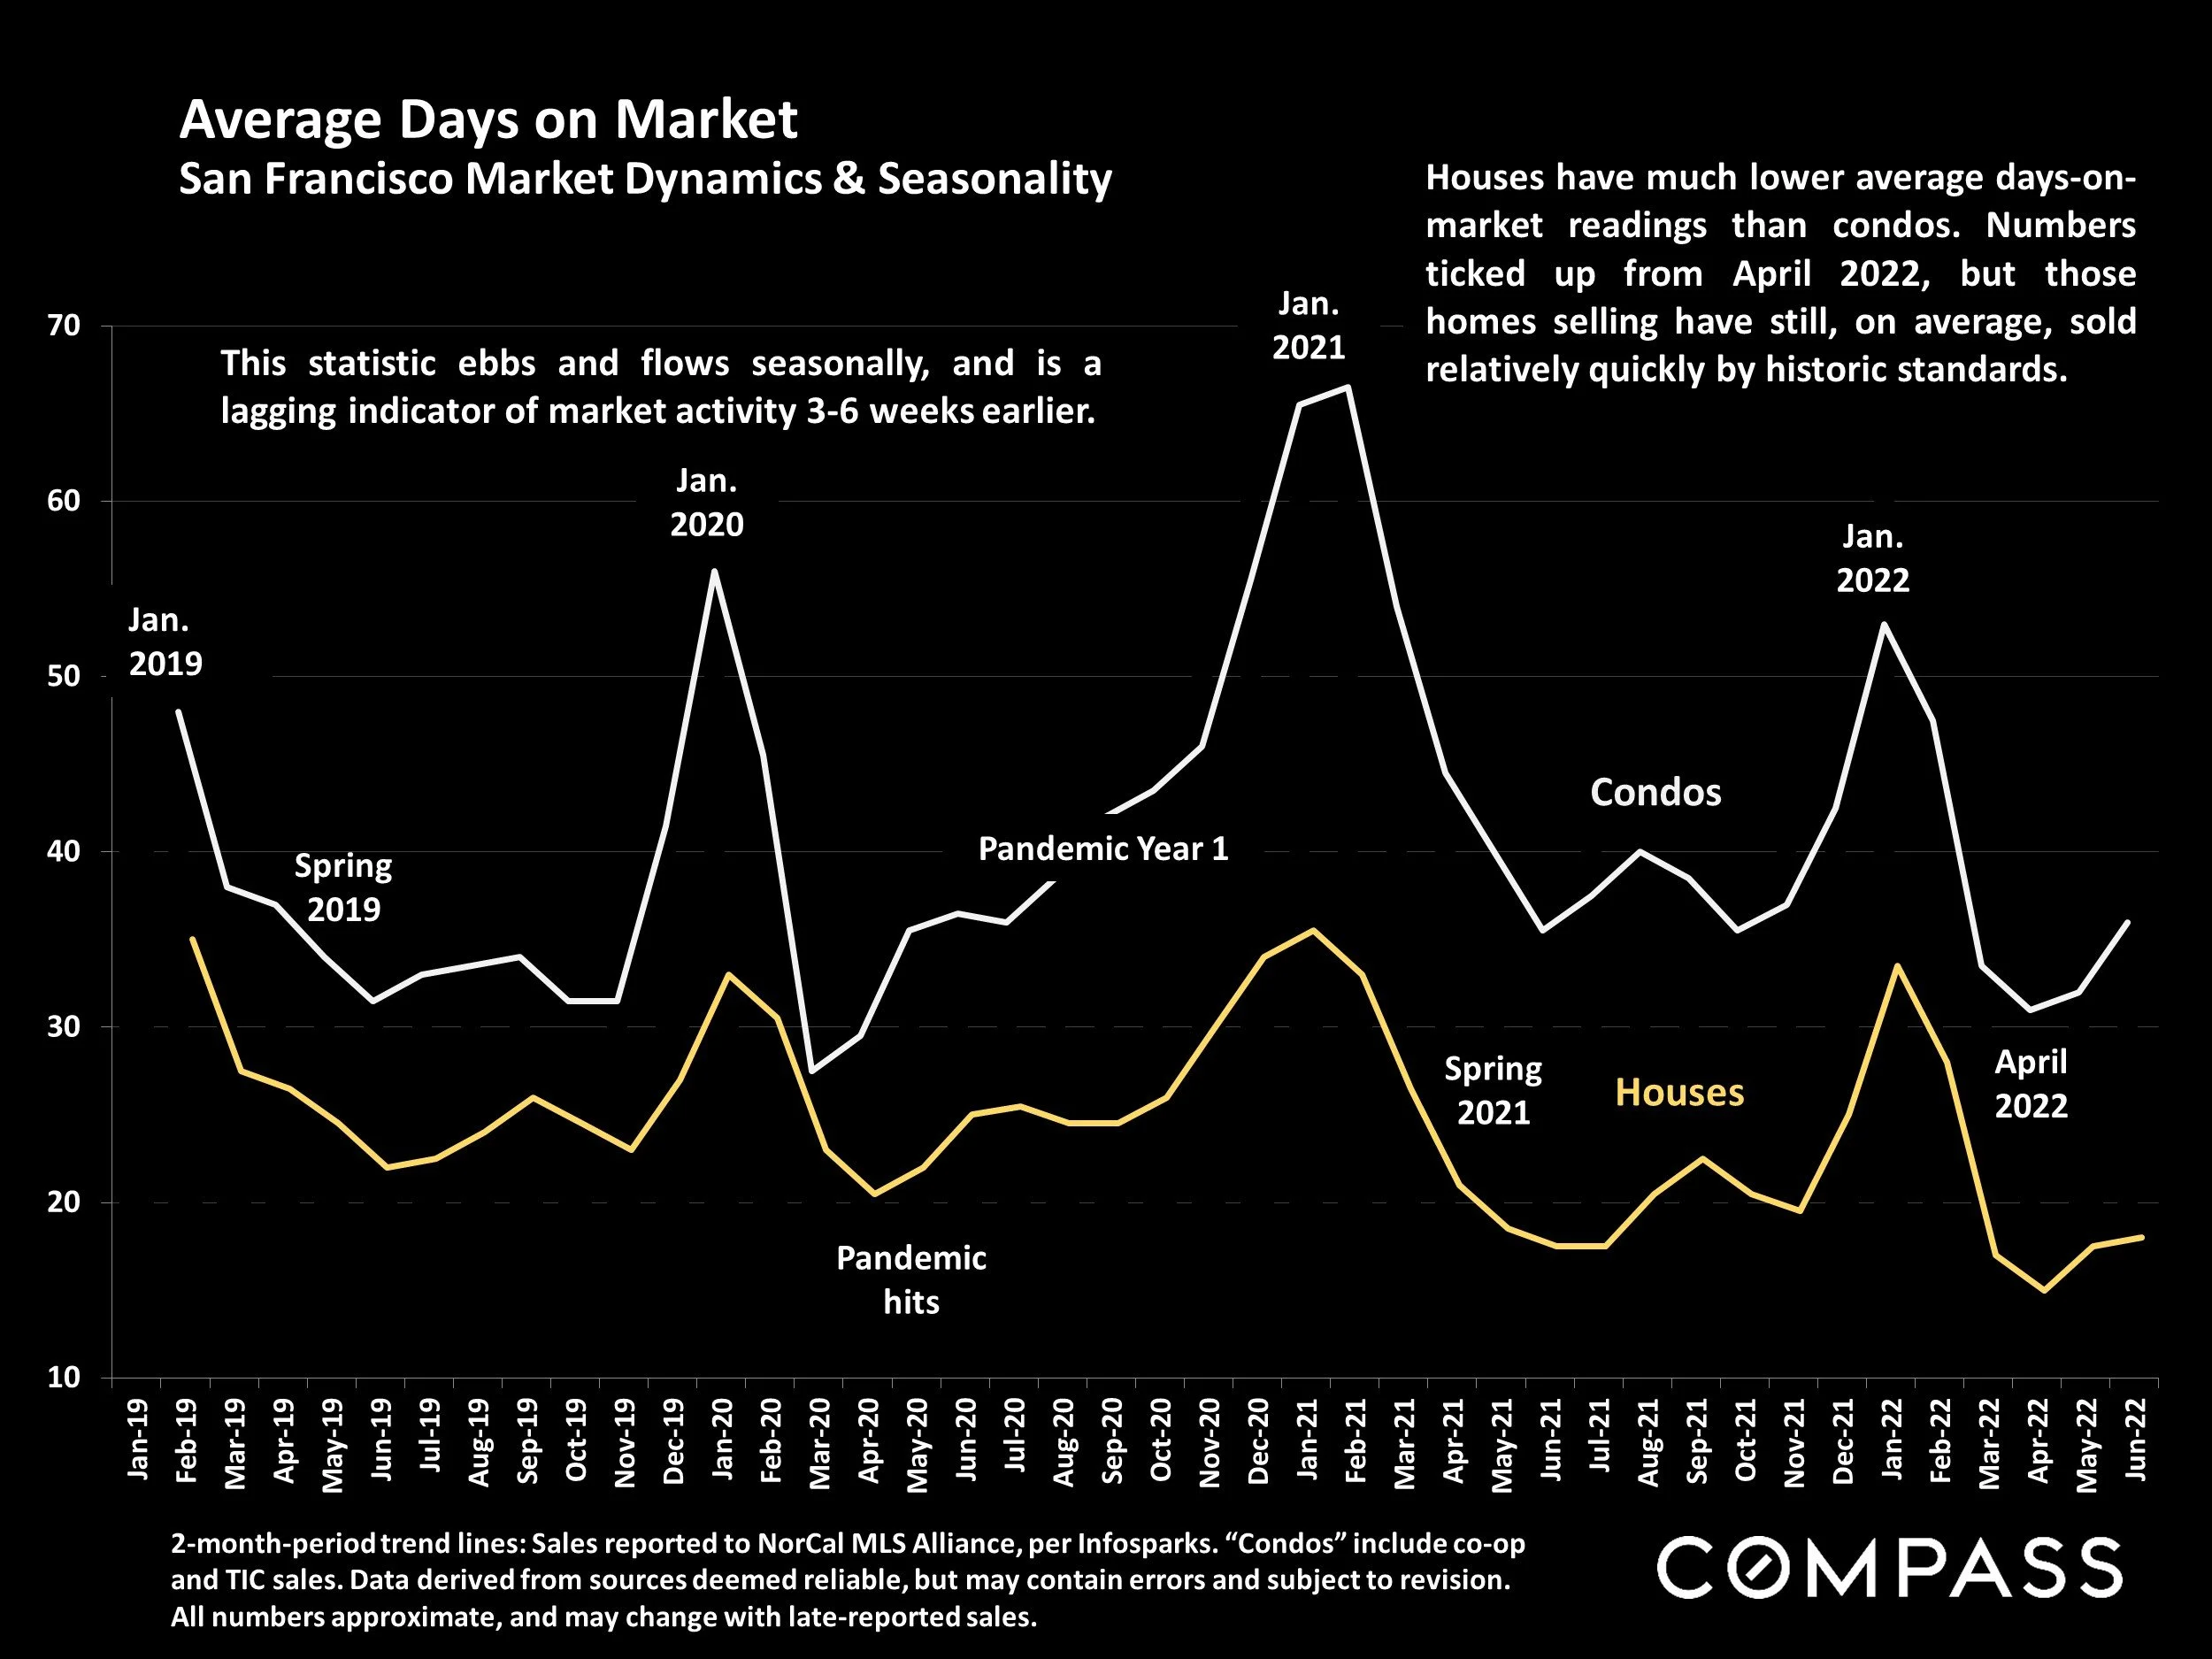
2-month-period trend lines: Sales reported to NorCal MLS Alliance, per Infosparks. “Condos” include co-op and TIC sales. Data derived from sources deemed reliable, but may contain errors and subject to revision. All numbers approximate, and may change with late-reported sales.
This statistic ebbs and flows seasonally, and is a lagging indicator of market activity 3-6 weeks earlier.
Houses have much lower average days-on-market readings than condos. Numbers ticked up from April 2022, but those homes selling have still, on average, sold relatively quickly by historic standards.
Statistics are generalities, essentially summaries of widely disparate data generated by dozens, hundreds or thousands of unique, individual sales occurring within different time periods. They are best seen not as precise measurements, but as broad, comparative indicators, with reasonable margins of error. Anomalous fluctuations in statistics are not uncommon, especially in smaller, expensive market segments. Last period data should be considered estimates that may change with late-reported data. Different analytics programs sometimes define statistics – such as “active listings,” “days on market,” and “months supply of inventory” – differently: what is most meaningful are not specific calculations but the trends they illustrate. Most listing and sales data derives from the local or regional multi-listing service (MLS) of the area specified in the analysis, but not all listings or sales are reported to MLS and these won’t be reflected in the data. “Homes” signifies real-property, single-household housing units: houses, condos, co-ops, townhouses, duets and TICs (but not mobile homes), as applicable to each market. City/town names refer specifically to the named cities and towns, unless otherwise delineated. Multi-county metro areas will be specified as such. Data from sources deemed reliable, but may contain errors and subject to revision. All numbers to be considered approximate.
Many aspects of value cannot be adequately reflected in median and average statistics: curb appeal, age, condition, amenities, views, lot size, quality of outdoor space, “bonus” rooms, additional parking, quality of location within the neighborhood, and so on. How any of these statistics apply to any particular home is unknown without a specific comparative market analysis.
Median Sales Price is that price at which half the properties sold for more and half for less. It may be affected by seasonality, “unusual” events, or changes in inventory and buying trends, as well as by changes in fair market value. The median sales price for an area will often conceal an enormous variety of sales prices in the underlying individual sales.
Dollar per Square Foot is based upon the home’s interior living space and does not include garages, unfinished attics and basements, rooms built without permit, patios, decks or yards (though all those can add value to a home). These figures are usually derived from appraisals or tax records, but are sometimes unreliable (especially for older homes) or unreported altogether. The calculation can only be made on those home sales that reported square footage.
Compass is a real estate broker licensed by the State of California, DRE 01527235. Equal Housing Opportunity. This report has been prepared solely for information purposes. The information herein is based on or derived from information generally available to the public and/or from sources believed to be reliable. No representation or warranty can be given with respect to the accuracy or completeness of the information. Compass disclaims any and all liability relating to this report, including without limitation any express or implied representations or warranties for statements contained in, and omissions from, the report. Nothing contained herein is intended to be or should be read as any regulatory, legal, tax, accounting or other advice and Compass does not provide such advice. All opinions are subject to change without notice. Compass makes no representation regarding the accuracy of any statements regarding any references to the laws, statutes or regulations of any state are those of the author(s). Past performance is no guarantee of future results.