July 2023 Market Report

July 4th Fireworks over SF Bay by Danny Li on Flickr. Used with permission.
Underlying market and economic dynamics in 2023 have been a mixed bag of often contrary and volatile factors – including downward-trending inflation; interest rates bouncing between 6% and 7%; unceasing uncertainty regarding what the Fed will do next; substantial rebounds in stock markets; bank, commercial real estate and debt-default crises; international political, economic and military conflicts; high-tech layoffs amid generally strong employment statistics; and a recovery in buyer demand, sales activity and home prices, but all 3 remaining significantly lower than the peak of the market in spring 2022. And within the city, market conditions often vary by property type (houses generally seeing higher demand), neighborhood (the downtown market remains relatively weak) and/or price segment within types and locations.
Ultimately, the market is defined by neither just demand nor supply, but by the balance between the two. As we’ve moved deeper into 2023, that balance has generally tilted to sellers’ advantage, with homes selling faster, with more offers, for higher prices. Part of this is due to seasonal dynamics: Spring is commonly the highest-demand, most active selling season of the year. But the contrast with the 2nd half of 2022, when demand and sales plunged, is more than seasonal. It also reflects a rebound in psychology, with many buyers deciding to move forward with their life plans.
For most Bay Area markets, summer has historically been a slower period after spring – with some regions, such as San Francisco, seeing a relatively short (6 to 8 week) spike up in activity in autumn before the big midwinter slowdown – but typical seasonal trends have been upended a few times in recent years. Certainly, a substantial amount of buying and selling will continue to occur in coming months, as well as variations in underlying economic conditions, which we will cover in detail in future reports.
San Francisco House Price Trends
Median House Sales Prices, 2012 – Present, by Quarter

As reported to NORCAL MLS® ALLIANCE, per Broker Metrics/Infosparks. All numbers are approximate and subject to revision. Last quarter may change with late reported sales.
Year over year, the Q2 2023 median house sales price was down about 20% from Q2 2022 (the market peak).
Median sales price is that price where half the homes sold for more and half for less. It is a very general statistic that disguises a wide range of prices in the underlying sales.
Seasonal fluctuations are common, and it’s not unusual for median sales prices to peak for the year in Q2. Longer-term trends are more meaningful than short-term changes.
San Francisco Condo Price Appreciation
Median Condo Sales Prices, 2012 – Present, by Quarter

Year over year, the Q2 2023 median condo sales price was down about 11.5% from Q2 2022 (the market peak).
Seasonal fluctuations are common. It is not unusual for median sales prices to peak for the calendar year in Q2. Different city districts often see varying median price trends.
San Francisco Home Value Trends since 2005
3-Month-Rolling House & Condo Median Dollar per Square Foot Values*

Until recently, median condo $/sq.ft. values (white line) were typically considerably higher than those for houses (yellow columns).
Median $/sq.ft. value is a very general statistic, disguising an enormous range of values in the underlying sales. It is often affected by other factors besides changes in fair market value. Seasonal fluctuations are common, which explain many of the regular ups and downs in this chart.
San Francisco Residential Market: Spring 2023
Market Dynamics by Price Segment & Property Type
Market segments with strongest demand dynamics highlighted
| Price Segment/Property Type | Spring 2023 - 3 Months Sales* | Year-over-Year % Change | Supply of Inventory** | Average Days on Market* | % of Sales Over List Price* | Avg. Sales Price to List Price %* |
|---|---|---|---|---|---|---|
| Under $1,000,000 | 357 sales | -13% | 3.1 months | 60 days | 31% | 98% |
| $1,000,000 - $1,999,999 | 625 sales | -33% | 2.4 months | 36 days | 56% | 104% |
| $2,000,000 - $2,999,999 | 138 sales | -65% | 3.9 months | 35 days | 58% | 105% |
| $3,000,000 - $4,999,999 | 75 sales | -54% | 3.4 months | 46 days | 41% | 99% |
| $5,000,000 - $7,499,999 | 17 sales | -56% | 8.4 months | 46 days | 42% | 99% |
| $7,500,000+ | 10 sales | -38% | 10 months | 92 days | 0% | 84% |
| Houses | 515 sales | -35% | 2 months | 30 days | 62% | 107% |
| Condos | 584 sales | -42% | 4 months | 56 days | 37% | 98% |
| TICs | 92 sales | -31% | 3 months | 45 days | 37% | 98% |
| Co-ops | 10 sales | -47% | N/A | 73 days | 20% | 97% |
*Sales reported to NorCal MLS Alliance, March 1 - May 31, 2023. Y-o-Y change in sales compared to same period of 2022. “Average Days on Market” until acceptance of offer for sold listings. “Avg. Sales Price to LP%”: 100% = an average sales price at original list price. **Months Supply of Inventory measures the approximate time required to sell the inventory of listings on market at current rate of sale; lower readings signify higher buyer demand as compared to the supply of homes for sale.
Data calculations per NorCal MLS Alliance Stats function, Broker Metrics or Infosparks - deemed reliable, but may contain errors and subject to revision. Not all listings or sales are posted to MLS. All numbers approximate. Sales statistics can be affected by outlier data and can change quickly.
San Francisco HOUSE Price Trends – Selected District Markets
Median House Sales Prices, by Quarter, Q2 2020 – Q2 2023
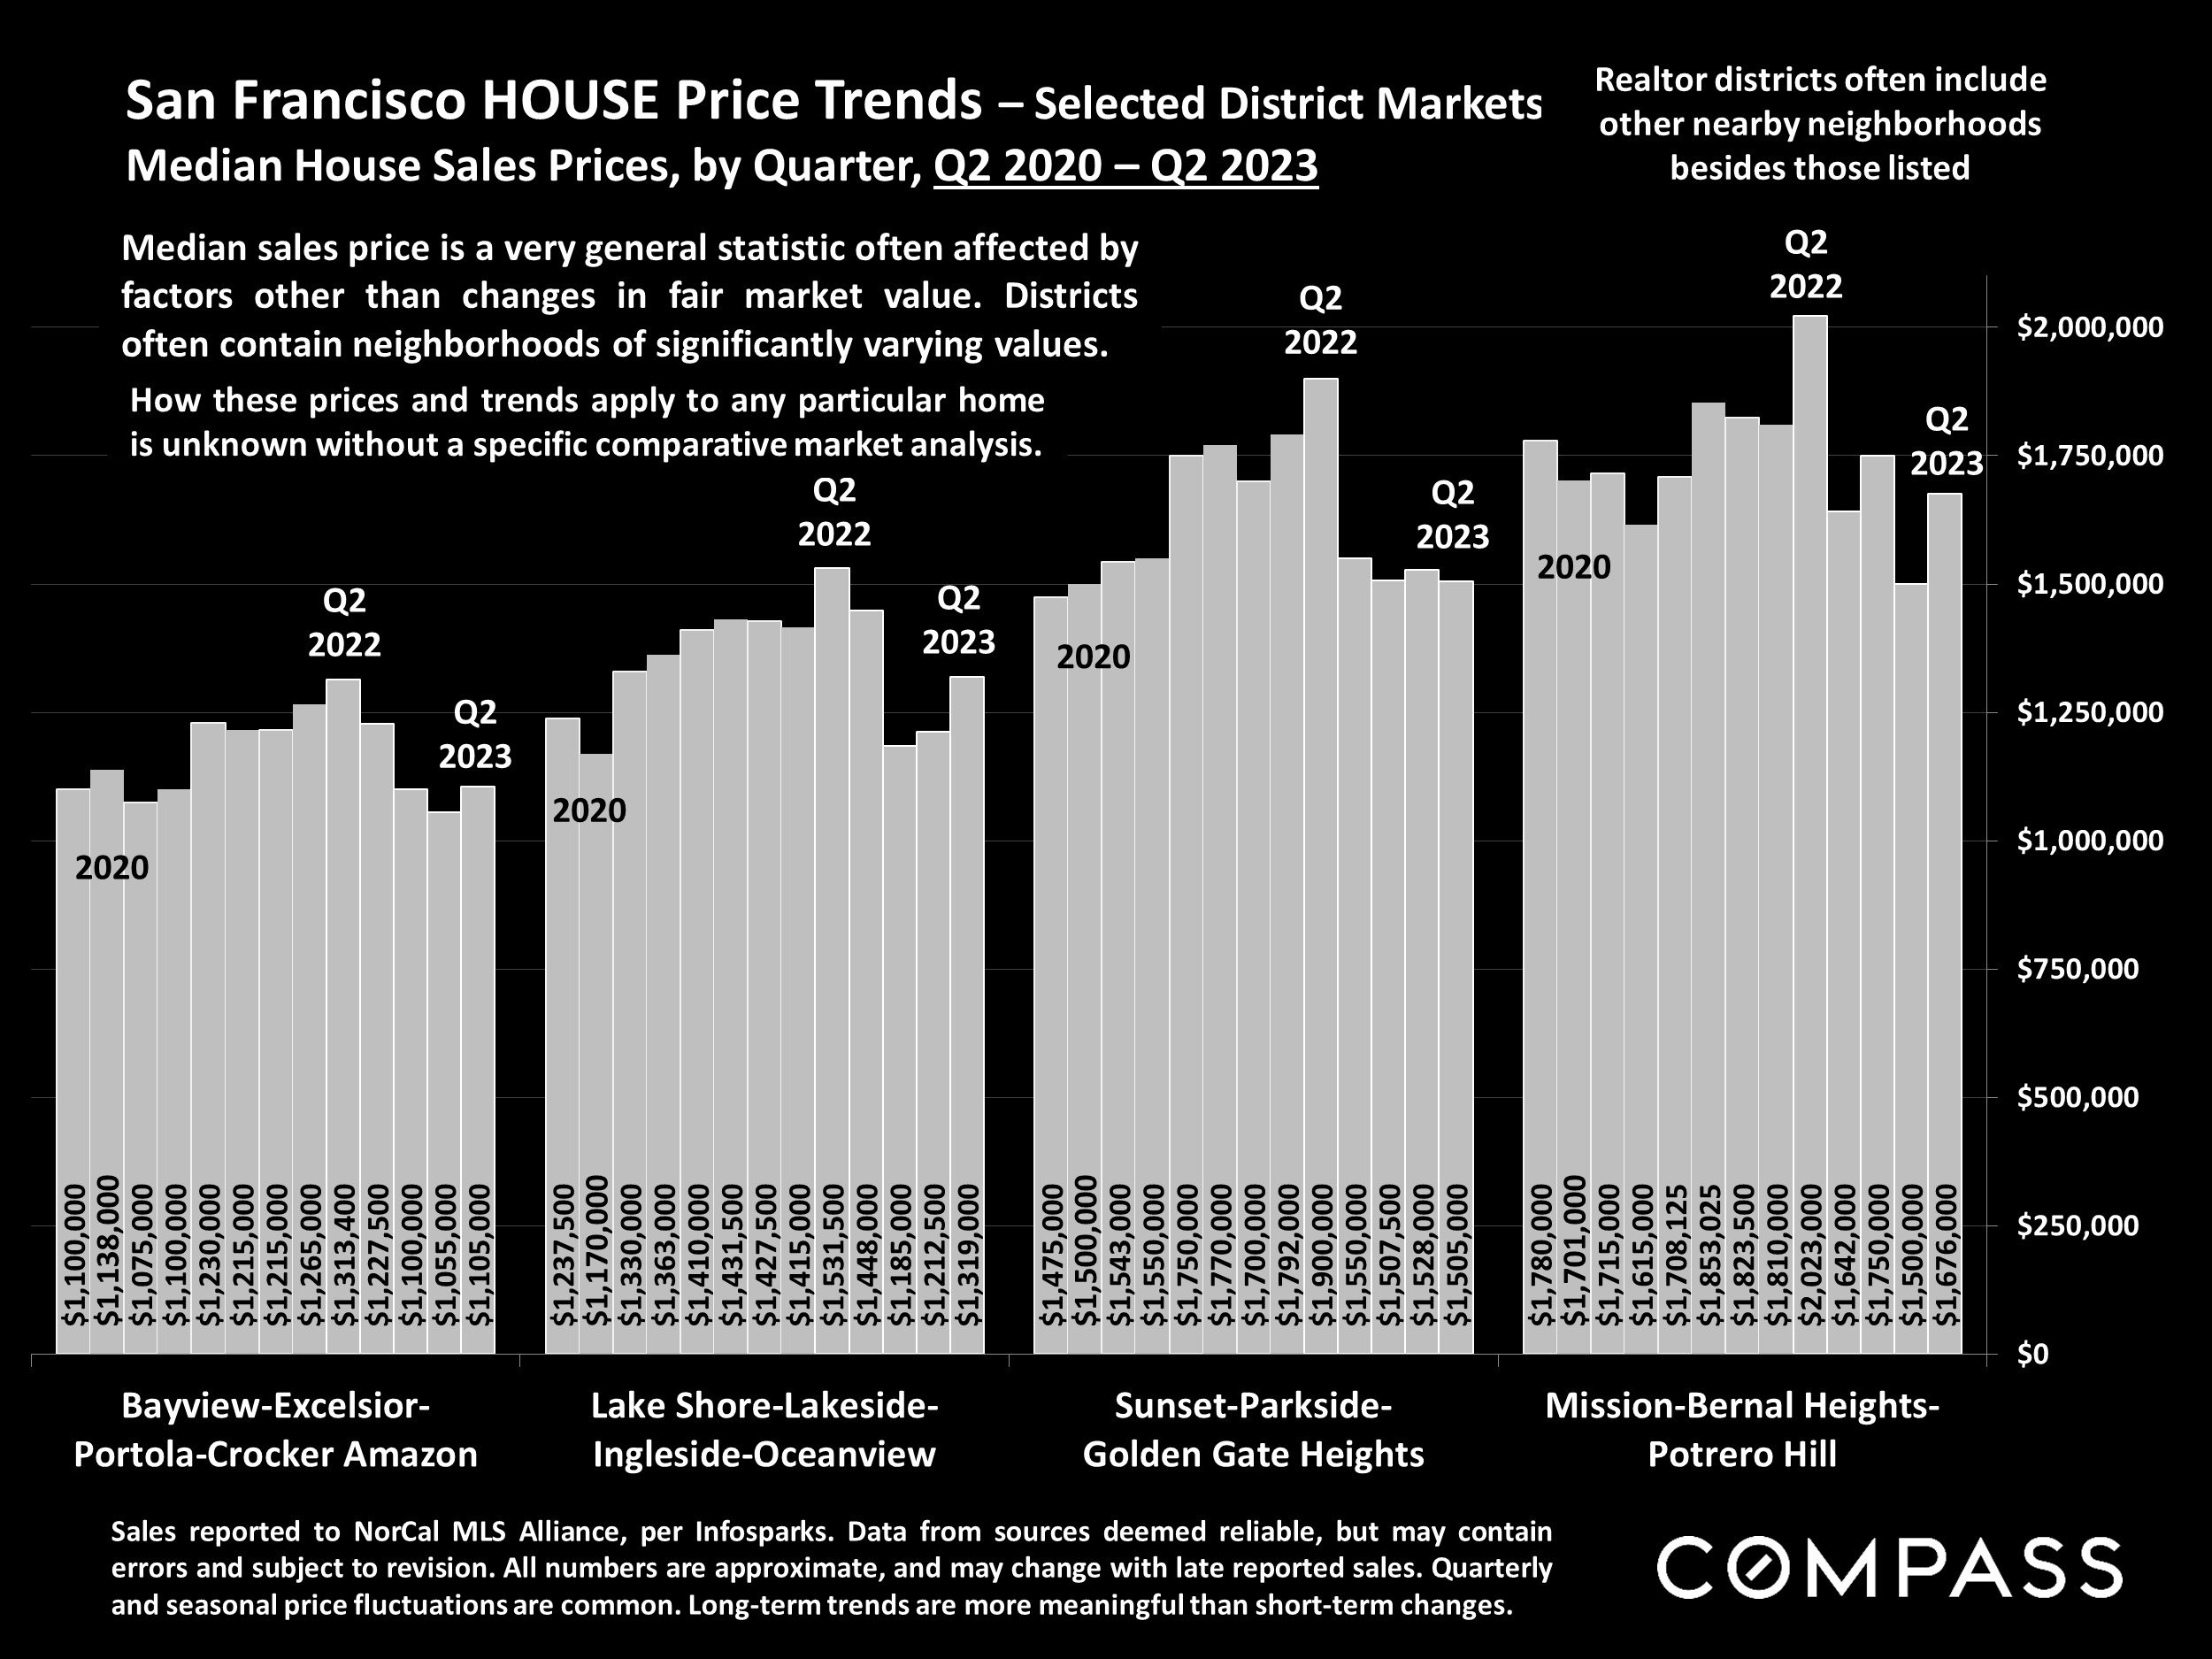

Sales reported to NorCal MLS Alliance, per Infosparks. Data from sources deemed reliable, but may contain errors and subject to revision. All numbers are approximate, and may change with late reported sales. Quarterly and seasonal price fluctuations are common. Long-term trends are more meaningful than short-term changes.
San Francisco CONDO Price Trends – Selected Districts
Median 2 & 3 BR Condo Sales Prices, by Quarter, Q2 2020 – Q2 2023
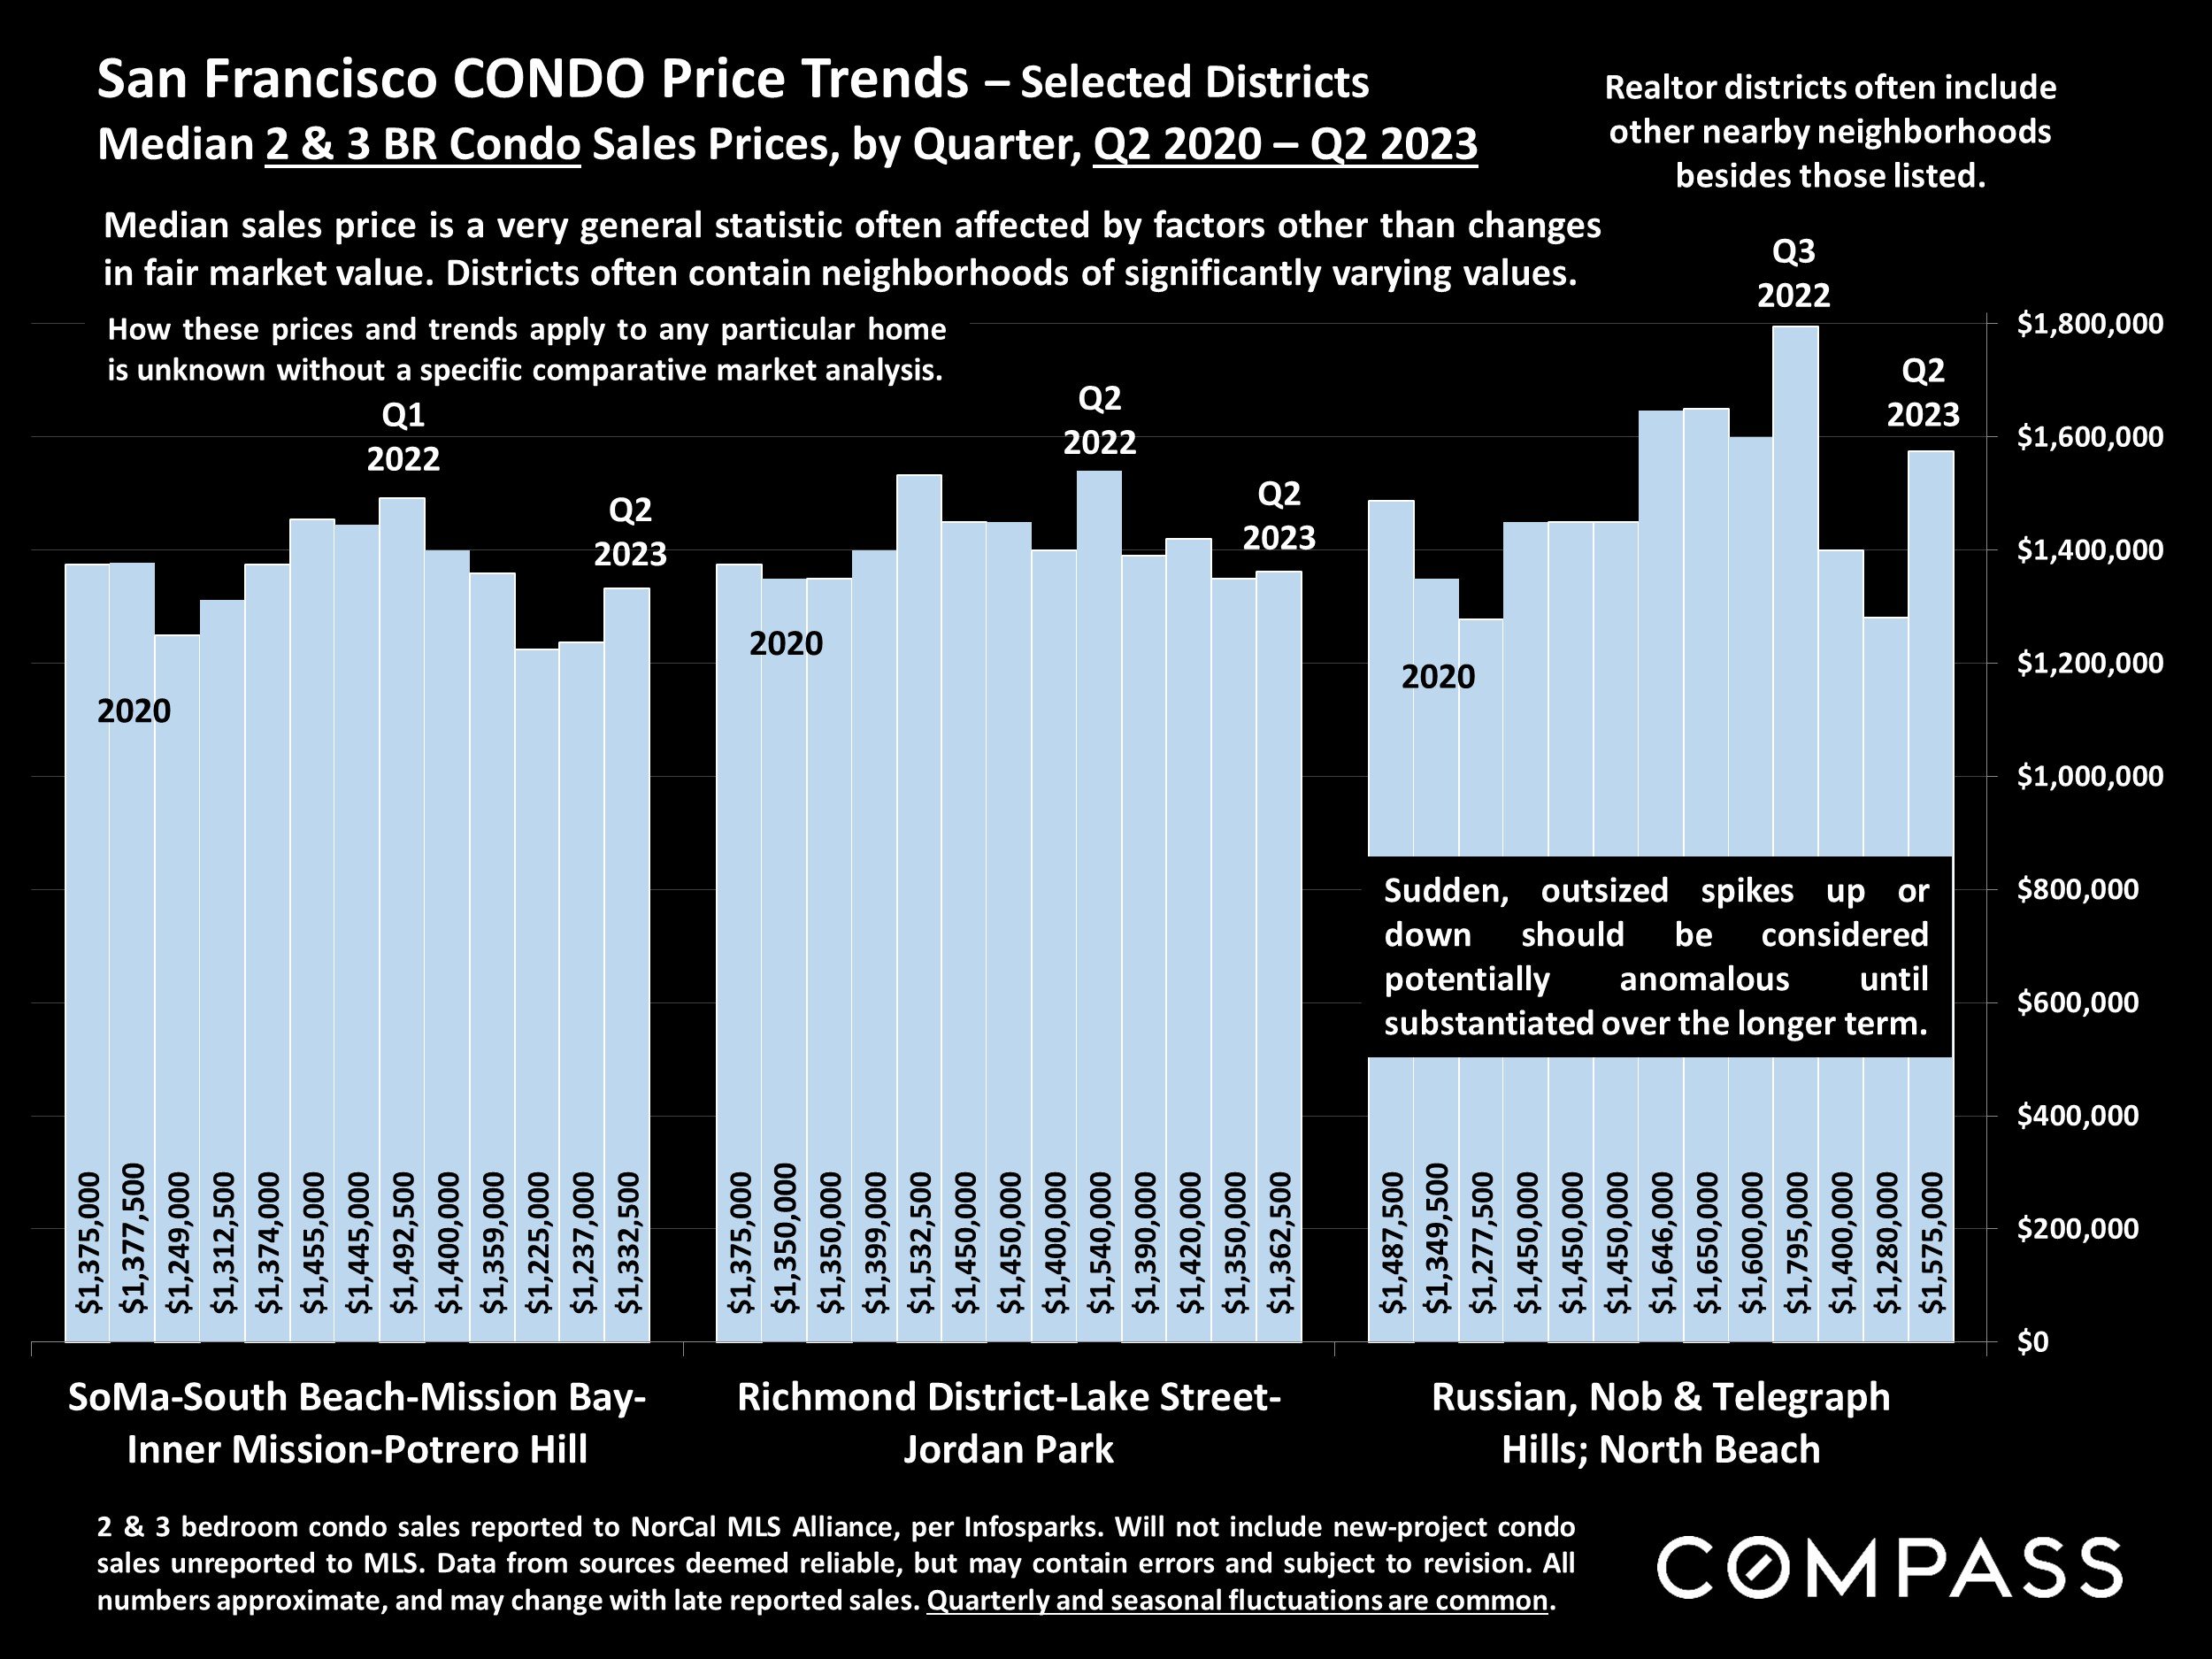

2 & 3 bedroom condo sales reported to NorCal MLS Alliance, per Infosparks. Data from sources deemed reliable, but may contain errors and subject to revision. All numbers are approximate, and may change with late reported sales. Quarterly and seasonal fluctuations are common.
Realtor districts often include other nearby neighborhoods besides those listed.
Median sales price is a very general statistic often affected by factors other than changes in fair market value. Districts often contain neighborhoods of significantly varying values. How these prices and trends apply to any particular home is unknown without a specific comparative market analysis.
San Francisco Luxury HOUSE Market
House Sales of $4,000,000+, by District, 12 Months Sales*

* 12 months sales and pending sales reported to NorCal MLS Alliance by 6/15/23 (plus a few media-reported non-MLS sales). Not all luxury home sales are reported to MLS. Neighborhood groupings correspond to SF Realtor districts, which often include adjacent neighborhoods not listed. Data from sources deemed reliable but may contain errors and subject to revision. All numbers approximate.
There were 12 house sales of $10 million+ reported during the 12-month period, and 4 sales of $20 million+.*
San Francisco Luxury Condo, Co-op & TIC Market
Sales Prices of $2.5 Million+, by District, 12 Months Sales*
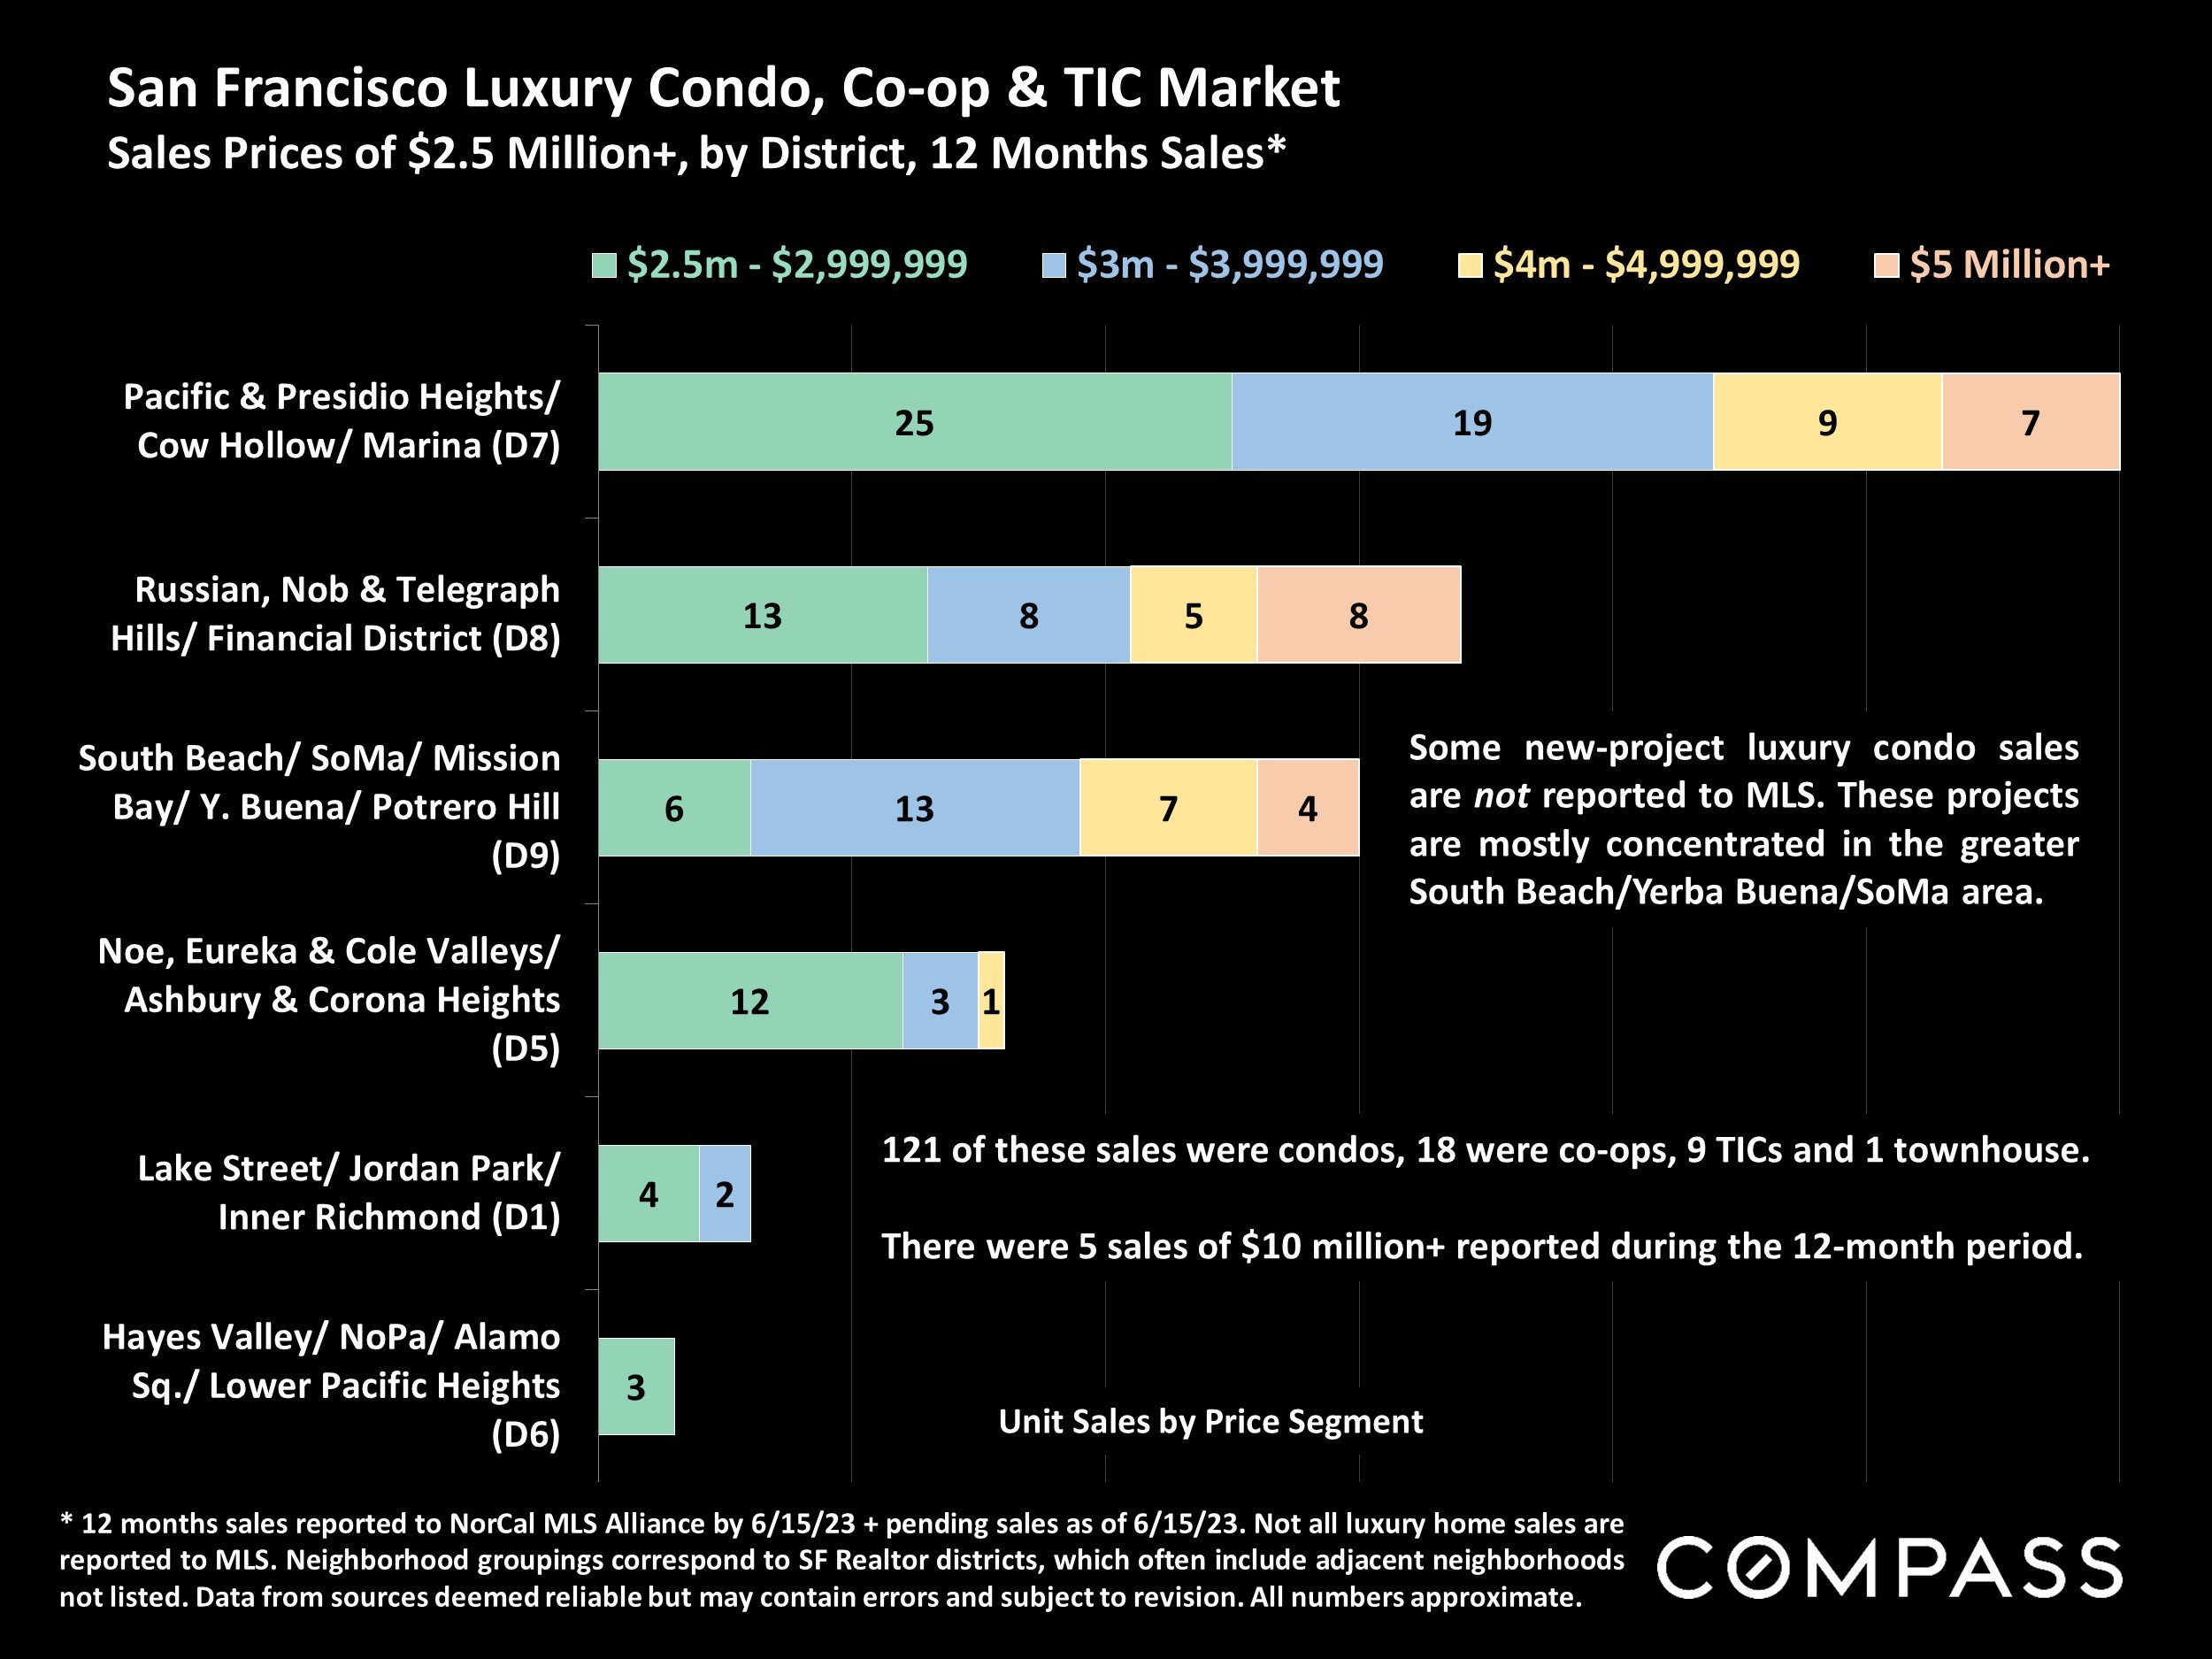
* 12 months sales reported to NorCal MLS Alliance by 6/15/23 + pending sales as of 6/15/23. Not all luxury home sales are reported to MLS. Neighborhood groupings correspond to SF Realtor districts, which often include adjacent neighborhoods not listed. Data from sources deemed reliable but may contain errors and subject to revision. All numbers approximate.
121 of these sales were condos, 18 were co-ops, 9 TICs and 1 townhouse. There were 5 sales of $10 million+ reported during the 12-month period.
Some new-project luxury condo sales are not reported to MLS. These projects are mostly concentrated in the greater South Beach/Yerba Buena/SoMa area.
Average Days on Market – Speed of Sale
San Francisco Market Dynamics & Seasonality

Sales reported to NorCal MLS Alliance, per Infosparks. Data derived from sources deemed reliable, but may contain errors and subject to revision. All numbers approximate, and may change with late-reported sales.
Measuring how long it takes for sold listings to accept offers. Houses have significantly lower average days-on-market readings than condos, but both have been falling.
This statistic ebbs and flows seasonally, and is a lagging indicator of market conditions.
Overbidding List Prices in San Francisco
Percentage of Home Sales Closing over List Price, since 2018

Sales data reported to NORCAL MLS® ALLIANCE, per Infosparks. Reflecting the percentage of sales closing at sales prices over the final list prices. Data from sources deemed reliable, but may contain errors and subject to revision. All numbers are approximate, and may change with late-reported sales.
By property type, the % selling over list price in June 2023 for houses was 70%, and for condos, co-ops and TICs, 37%.
Average Sales Price to Original List Price Percentage
San Francisco Over/Under Bidding: Market Dynamics & Seasonality

Sales reported to NorCal MLS Alliance, per Infosparks. Data derived from sources deemed reliable, but may contain errors and subject to revision. All numbers approximate, and may change with late-reported sales.
On average, SF houses are selling well above asking price, and condos slightly below. This statistic fluctuates by season, and is a lagging indicator of market activity 3-6 weeks earlier.
San Francisco Housing*
Total Housing Units: 414,581
Occupancy Rate: 85%. Vacancies are concentrated in rental units.
Highest % of studio and 1-BR units in Bay Area.
Highest % of 1-person households in Bay Area.
Multi-unit buildings make up 66% of total units – the highest % in the Bay Area – which include condos, co-ops, TICs, rental apartments, university & social housing.
40% of SF housing units are owner-occupied and 60% are tenant occupied: By far the highest tenant ratio in the Bay Area.
19% of SF households have children under the age of 18 (the lowest ratio in the Bay Area), and 81% of households include no children.
*“Total Housing Units” census estimate as of 7/1/22. Other data per U.S. census 2021, ACS 1-year estimates for occupied housing. Percentages usually rounded to nearest half or full percentage point. Data from sources deemed reliable, but may contain errors and subject to revision. All numbers approximate.
| Housing Units by Bedroom Count | |
|---|---|
| No bedrooms | 13% |
| 1 bedroom | 25% |
| 2-3 bedrooms | 50% |
| 4+ bedrooms | 12% |
| Housing Units by Room Count | |
|---|---|
| 1 room | 11% |
| 2-3 rooms | 29% |
| 4-5 rooms | 22% |
| 6-7 rooms | 17% |
| 8+ rooms | 11% |
| Units by Building Type | |
|---|---|
| Single family dwellings | 34% |
| 2-4 unit buildings | 20% |
| 5-9 unit buildings | 9% |
| 10+ unit buildings | 37% |
| Household Size | |
|---|---|
| 1-person | 37% |
| 2-person | 34% |
| 3-person | 12% |
| 4+-person | 17% |
| Era of Construction | |
|---|---|
| 1939 or earlier | 44% |
| 1940-1959 | 18% |
| 1960-1979 | 15% |
| 1980-1999 | 10% |
| 2000-2021 | 13% |
San Francisco County Population Changes
Age Distribution, U.S. Census Estimates*
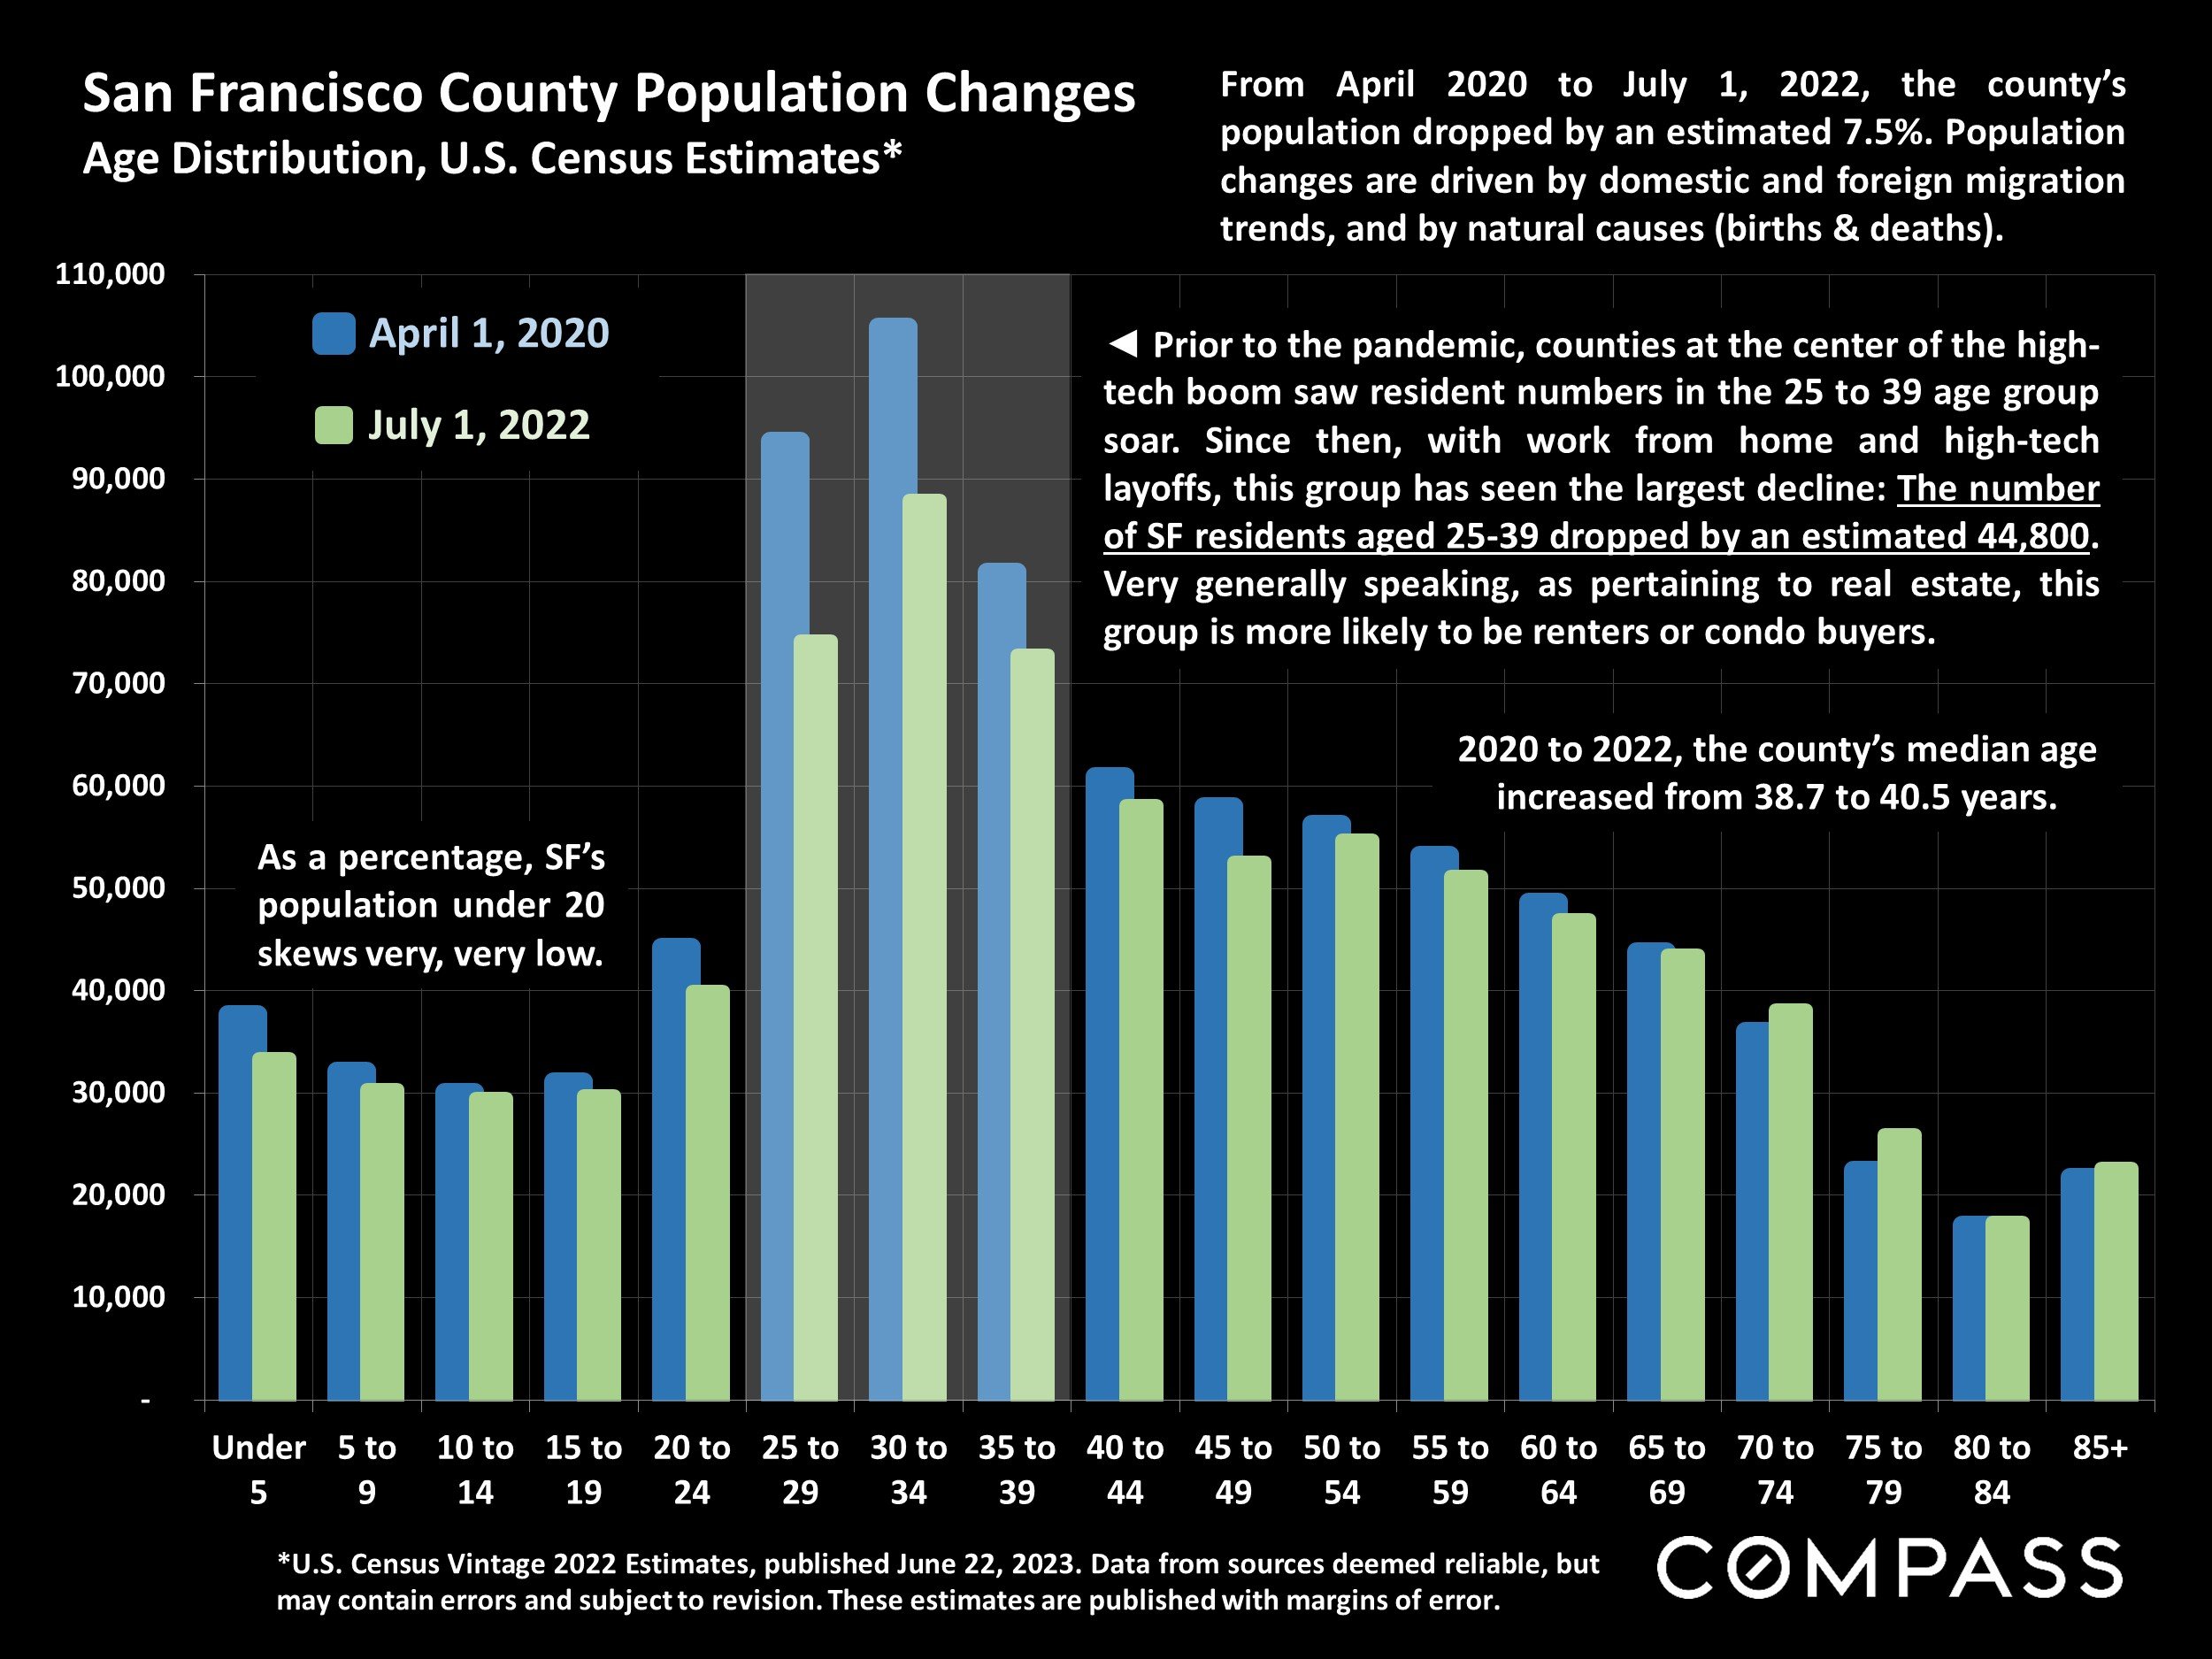
*U.S. Census Vintage 2022 Estimates, published June 22, 2023. Data from sources deemed reliable, but may contain errors and subject to revision. These estimates are published with margins of error.
From April 2020 to July 1, 2022, the county’s population dropped by an estimated 7.5%. Population changes are driven by domestic and foreign migration trends, and by natural causes (births & deaths).
Prior to the pandemic, counties at the center of the high-tech boom saw resident numbers in the 25 to 39 age group soar. Since then, with work from home and high-tech layoffs, this group has seen the largest decline: The number of SF residents aged 25-39 dropped by an estimated 44,800. 2020 to 2022, the county’s median age increased from 38.7 to 40.5 years. Very generally speaking, as pertaining to real estate, this group is more likely to be renters or condo buyers.
New Listings Coming on Market
San Francisco Market Dynamics & Seasonality

Per Realtor.com Research: https://www.realtor.com/research/data/, listings posted on site. Data from sources deemed reliable, but may contain errors and subject to revision. May not include “coming-soon” listings. All numbers should be considered approximate.
Year over year, the new-listing volume in June 2023 was down 32%.
San Francisco Homes Market
Active & Coming-Soon Listings on 1st of Month*

* Houses, condos, co-ops, TICs, townhouses: Active/Coming-Soon listings posted to NorCal MLS Alliance. Does not include new-project condos not listed on MLS. Data from sources deemed reliable, but may contain errors and subject to revision. All numbers approximate. The # of active listings changes constantly.
Of the listings for sale on July 1, 29%were houses, and 71% were condos, co-ops, TICs & townhouses.*
The # of active listings on a given day is affected by 1) the # of new listings coming on market, 2) how quickly buyers put them into contract, 3) the sustained heat of the market over time, and 4) sellers pulling their homes off the market without selling.
Active Listings on Market – Longer-Term Trends
San Francisco Market Dynamics & Seasonality

Per Realtor.com Research: https://www.realtor.com/research/data/, house and condo listings posted on site. May not include coming-soon listings. Data from sources deemed reliable, but may contain errors and subject to revision. All numbers approximate.
The number of active listings on a given day is affected by 1) how many new listings come on market, 2) how quickly buyers snap them up, 3) the sustained heat of the market over time, and 4) how many sellers pull their homes off the market without selling. The number typically ebbs and flows by season.
This is a snapshot measure of how many active listings can be expected on any given day of the specified month.
Listings Pending Sale (in Contract, Offer Accepted)
San Francisco Market Dynamics & Seasonality

Per Realtor.com Research: https://www.realtor.com/research/data/, house and condo listings posted on site. Data from sources deemed reliable, but may contain errors and subject to revision. All numbers are approximate.
This is a snapshot measure of how many pending listings can be expected on any given day of the specified month.
It’s not unusual for activity to slow in summer, before picking up again for an autumn spike in sales.
The # of listings going into contract measures buyer demand, but is also deeply impacted by the supply of new listings available to buy.
Monthly Home Sales Volume
San Francisco Market Dynamics & Seasonality

Sales of houses, condos, townhouses reported to NorCal MLS Alliance, per Infosparks. Data from sources deemed reliable but may contain errors and subject to revision. Last month estimated based on available information and may change with late reported sales. All numbers approximate.
March-June sales in 2023 were down about 35% from the same period of 2022. The decline in the number of new listings was one factor.
Sales in one month mostly reflect accepted-offer activity in the previous month.
San Francisco Higher-Price Home Sales
Homes Selling for $3 Million+
Houses, condos, co-ops, townhouses, TICs

Sales reported to NorCal MLS Alliance, per Infosparks. Does not include sales unreported to MLS: Not all sales are reported. Data from sources deemed reliable but may contain errors and subject to revision. All numbers approximate, and may change with late-reported activity.
March-June sales of $3m+ in 2023 were down about 48%from the same period of 2022.
As of early July, there were 151 active listings priced $3m+.
The number of higher-price sales typically ebbs and flows dramatically by season, with spring usually the biggest selling season, and mid-winter the slowest. Sales usually follow the time of offers being accepted by 3 to 5 weeks.
Bay Area Ultra-Luxury Market: Homes of $10 Million+
by Bay Area County, 1st Half 2023: Listings, Sales & Listings Pending Sale*

* 2023 active/coming-soon listings, residential sales + listings pending sale reported to NorCal MLS Alliance by 6/30/23. Not all luxury listings and sales are posted to or reported to MLS. Numbers may change with late reported sales. Some pending sale listings may not close sale. Data from sources deemed reliable, but may contain errors and subject to revision. All numbers approximate.
This chart compares the number of active/coming-soon listings on the market as of 6/30/2023 priced $10 million+, to the number of$10m+ home sales recorded YTD 2023 + those $10m+ listings currently reported as pending sale (in contract) – in those Bay Area Counties that see significant activity in this price segment.
For homes of $20 million+ as of 6/30/23, there were 30 active/coming-soon listings on the market, and 8 reported sales so far in 2023: 3 in Atherton, 2 each in San Francisco and Woodside, and 1 in the City of Monterey. There is 1 listing pending sale in Carmel.
Price Reductions on Active Listings
San Francisco Market Dynamics & Seasonality

Per Realtor.com Research: https://www.realtor.com/research/data/, listings posted to site. Data from sources deemed reliable, but may contain errors and subject to revision. All numbers approximate.
The number of price reductions typically ebbs and flows by season, but can also be affected by specific events in the economy and the market. It’s not unusual for price reductions to peak in October before the mid-winter holiday slowdown begins in mid-November.
Number of Housing Units Permitted (3-Month Moving Average)
San Francisco, Through May 2023

Chart from “Status of the San Francisco Economy: June 2023” as published by the Offices of the Controller and Economic Analysis, for the City & County of San Francisco. Data source: U.S. Department of Housing & Urban Development
The number of new housing units permitted in San Francisco crashed in spring 2023.
Statistics are generalities, essentially summaries of widely disparate data generated by dozens, hundreds or thousands of unique, individual sales occurring within different time periods. They are best seen not as precise measurements, but as broad, comparative indicators, with reasonable margins of error. Anomalous fluctuations in statistics are not uncommon, especially in smaller, expensive market segments. Last period data should be considered estimates that may change with late-reported data. Different analytics programs sometimes define statistics – such as “active listings,” “days on market,” and “months supply of inventory” – differently: what is most meaningful are not specific calculations but the trends they illustrate. Most listing and sales data derives from the local or regional multi-listing service (MLS) of the area specified in the analysis, but not all listings or sales are reported to MLS and these won’t be reflected in the data. “Homes” signifies real-property, single-household housing units: houses, condos, co-ops, townhouses, duets and TICs (but not mobile homes), as applicable to each market. City/town names refer specifically to the named cities and towns, unless otherwise delineated. Multi-county metro areas will be specified as such. Data from sources deemed reliable, but may contain errors and subject to revision. All numbers to be considered approximate.
Many aspects of value cannot be adequately reflected in median and average statistics: curb appeal, age, condition, amenities, views, lot size, quality of outdoor space, “bonus” rooms, additional parking, quality of location within the neighborhood, and so on. How any of these statistics apply to any particular home is unknown without a specific comparative market analysis.
Median Sales Price is that price at which half the properties sold for more and half for less. It may be affected by seasonality, “unusual” events, or changes in inventory and buying trends, as well as by changes in fair market value. The median sales price for an area will often conceal an enormous variety of sales prices in the underlying individual sales.
Dollar per Square Foot is based upon the home’s interior living space and does not include garages, unfinished attics and basements, rooms built without permit, patios, decks or yards (though all those can add value to a home). These figures are usually derived from appraisals or tax records, but are sometimes unreliable (especially for older homes) or unreported altogether. The calculation can only be made on those home sales that reported square footage.
Compass is a real estate broker licensed by the State of California, DRE 01527235. Equal Housing Opportunity. This report has been prepared solely for information purposes. The information herein is based on or derived from information generally available to the public and/or from sources believed to be reliable. No representation or warranty can be given with respect to the accuracy or completeness of the information. Compass disclaims any and all liability relating to this report, including without limitation any express or implied representations or warranties for statements contained in, and omissions from, the report. Nothing contained herein is intended to be or should be read as any regulatory, legal, tax, accounting or other advice and Compass does not provide such advice. All opinions are subject to change without notice. Compass makes no representation regarding the accuracy of any statements regarding any references to the laws, statutes or regulations of any state are those of the author(s). Past performance is no guarantee of future results.