The Bay Area housing market is the center of national attention this summer. AI-driven wealth has offset persistently higher mortgage rates, pushing demand in a handful of neighborhoods to dramatic levels.
The most intense competition is concentrated in San Francisco itself. In June, 44 homes in the city sold for at least $1 million over asking. Sales in San Francisco, San Mateo, and Marin are running well above last year's pace.
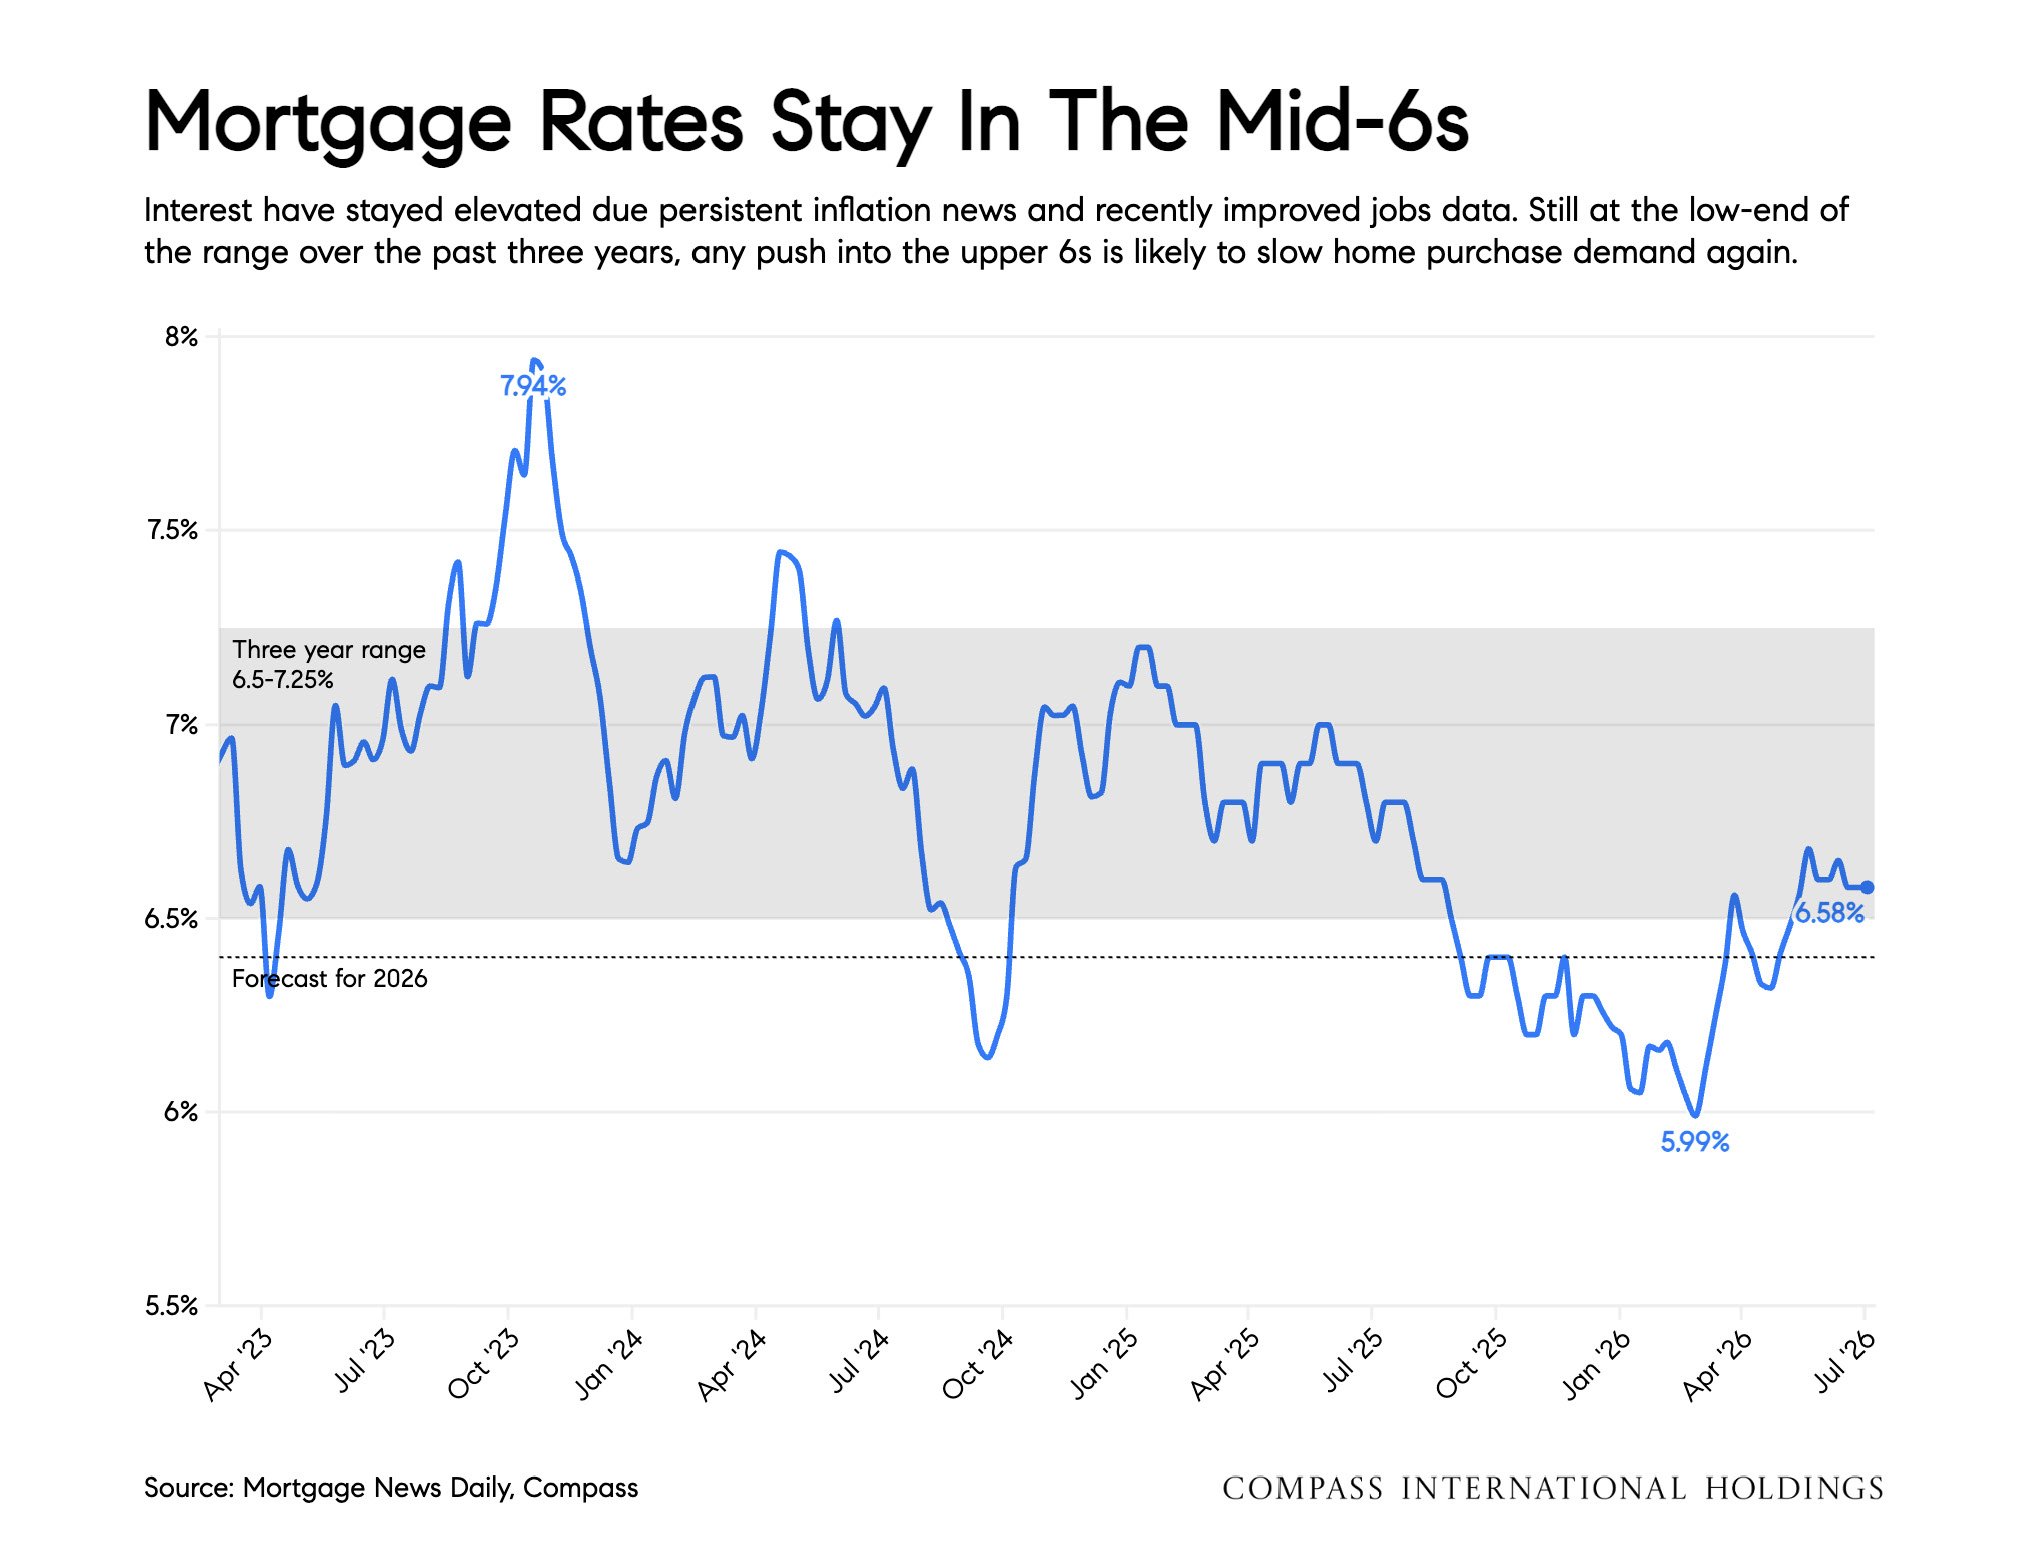
Other parts of the Bay Area are more exposed to AI's other edge: jobs, inflation, and rates. Most buyers need a mortgage, and rates have stayed elevated — though still below last year's level. Nationally, inflation remains well above what policymakers and bond markets are comfortable with, driven by energy costs, government spending, and quite possibly the AI investment boom itself. Mortgage rates spent another month near 6.5%.
Santa Clara County is feeling a different edge: Bay Area tech companies have cut 58,000 jobs so far in 2026, and in the South Bay, inventory is climbing while average sale prices trail last year.
In many ways, the Bay Area is leading the nation's housing story in both directions — new wealth pulling the top of the market to record heights, while job insecurity and high rates weigh on buyers further down. It's always worth watching the Bay Area markets closely as we often signal where the rest of the country is headed next.
Al Boom Hits San Francisco Home Sales
In June, 44 transactions in San Francisco closed at least $1 million above the final ask pnce.
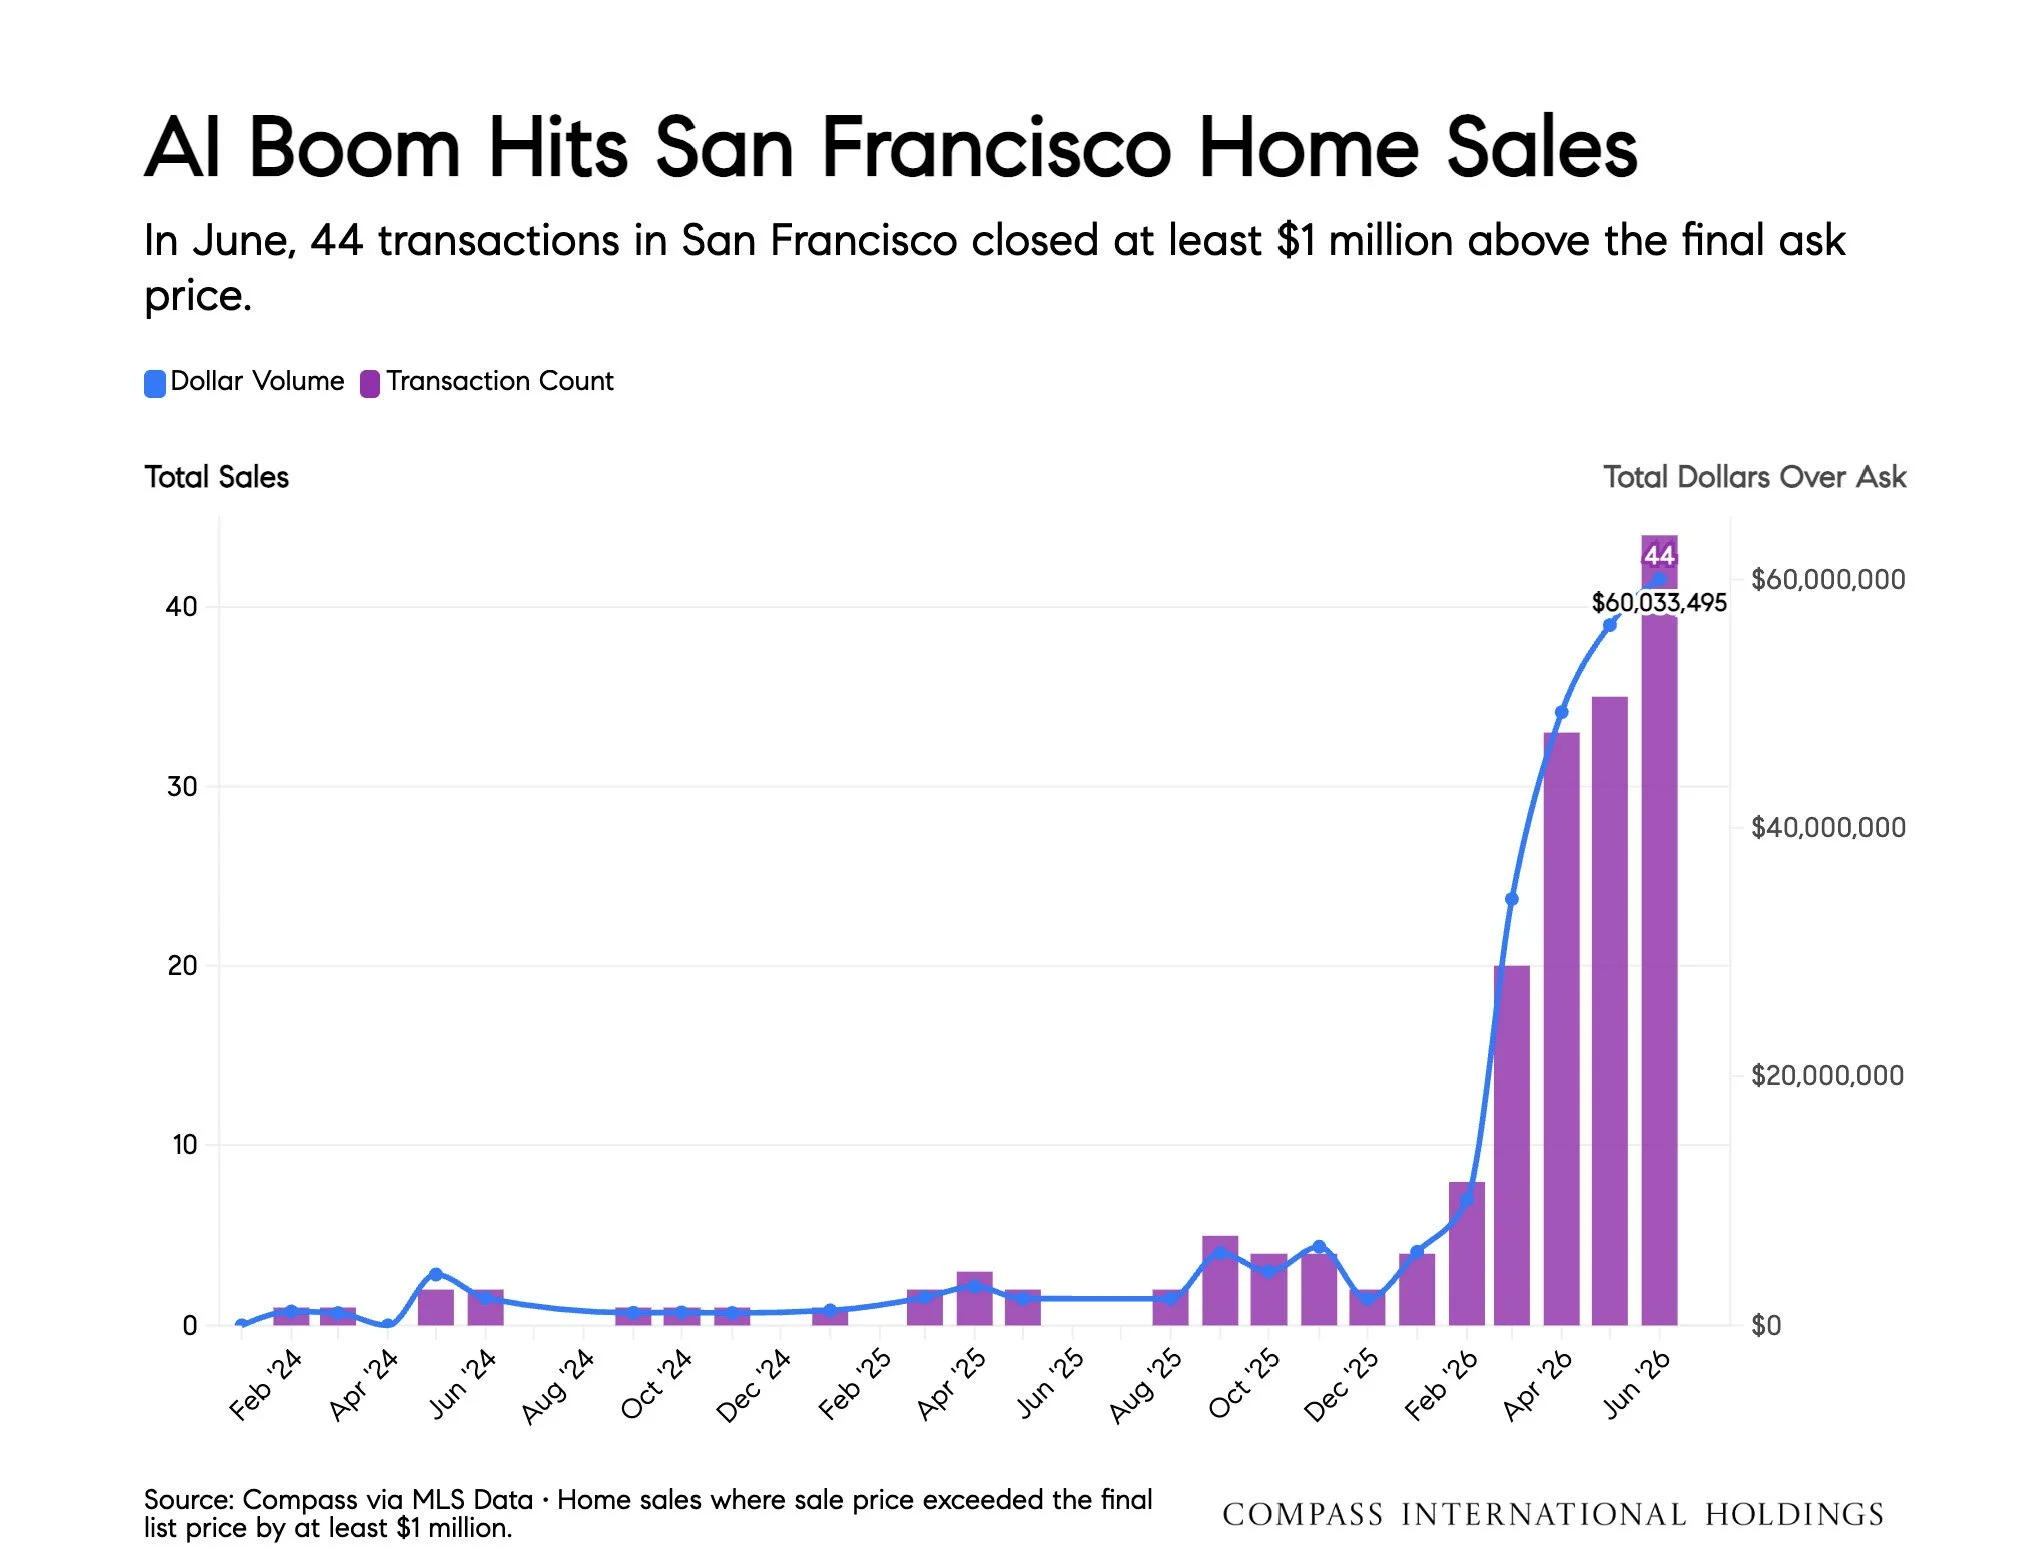
Source: Compass via MLS Data· Home sales where sale price exceeded the final list price by at least $1 million.
Where The Money is Concentrating
San Francisco home sales at least $1 million over the asking price. The pace of those closing at least $1 million over ask illustrates the most desirable neighborhoods.
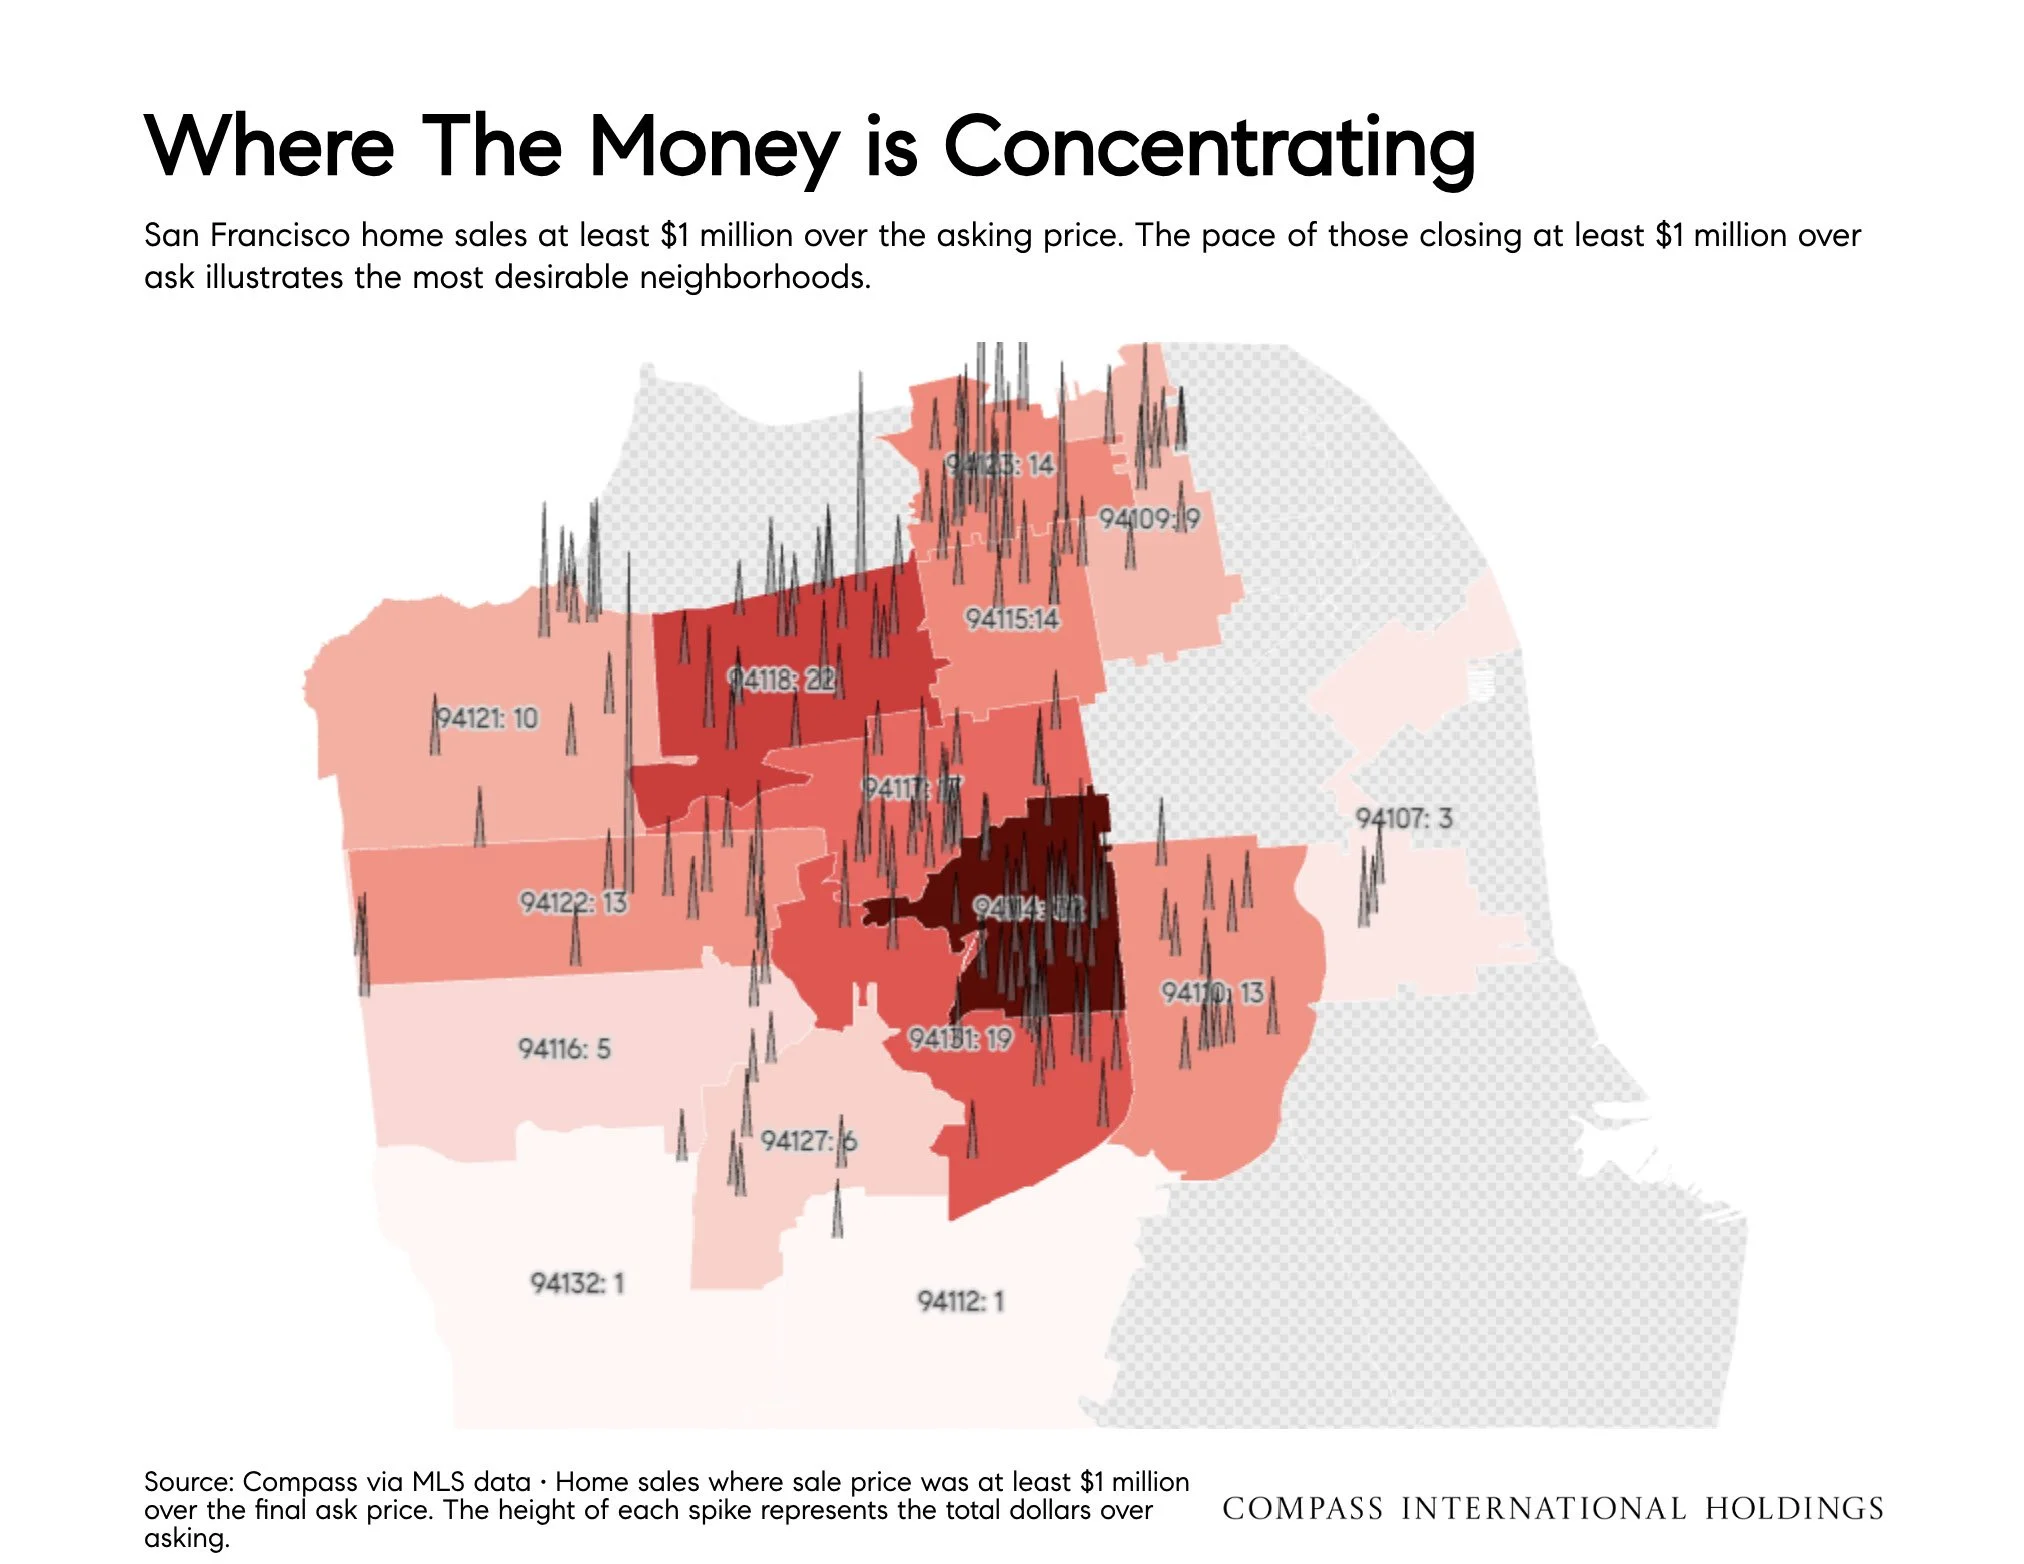
Source: Compass via MLS data • Home sales where sale price was at least $1 million over the final ask price. The height of each spike represents the total dollars over asking.
Mortgage Rates Stay In The Mid-6s
Interest have stayed elevated due persistent inflation news and recently improved jobs data. Still at the low-end of the range over the past three years, any push into the upper 6s is likely to slow home purchase demand again.
Source: Mortgage News Daily, Compass
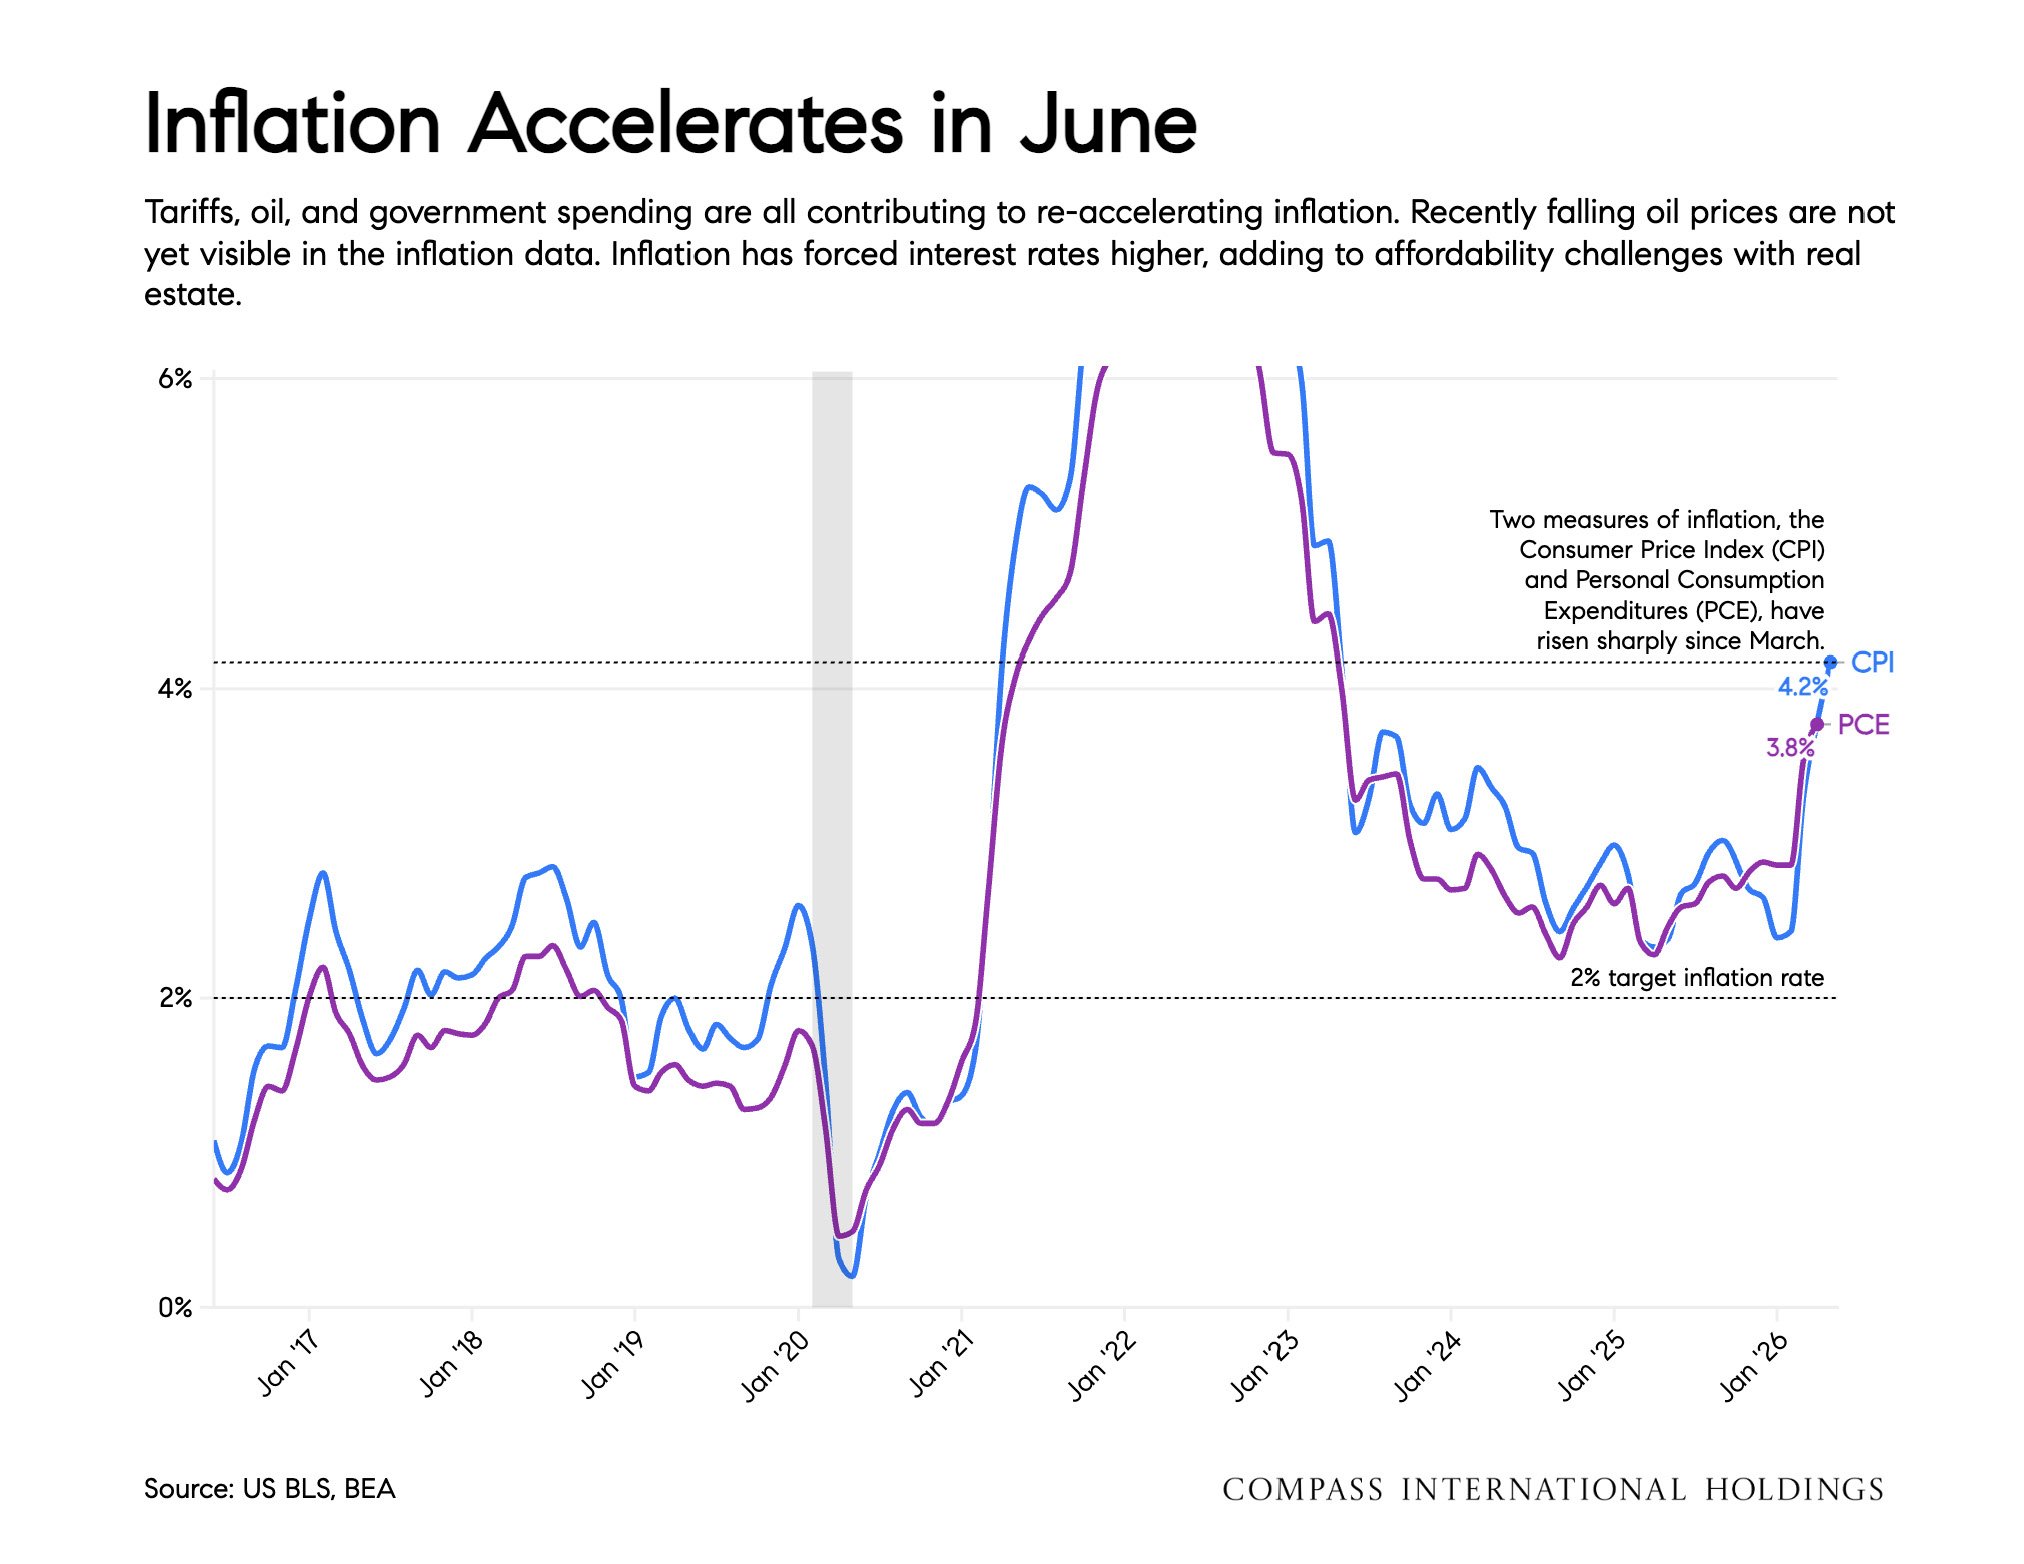
Inflation Accelerates in June
Tariffs, oil, and government spending are all contributing to re-accelerating inflation. Recently falling oil prices are not yet visible in the inflation data. Inflation has forced interest rates higher, adding to affordability challenges with real estate.
Source: US BLS, BEA
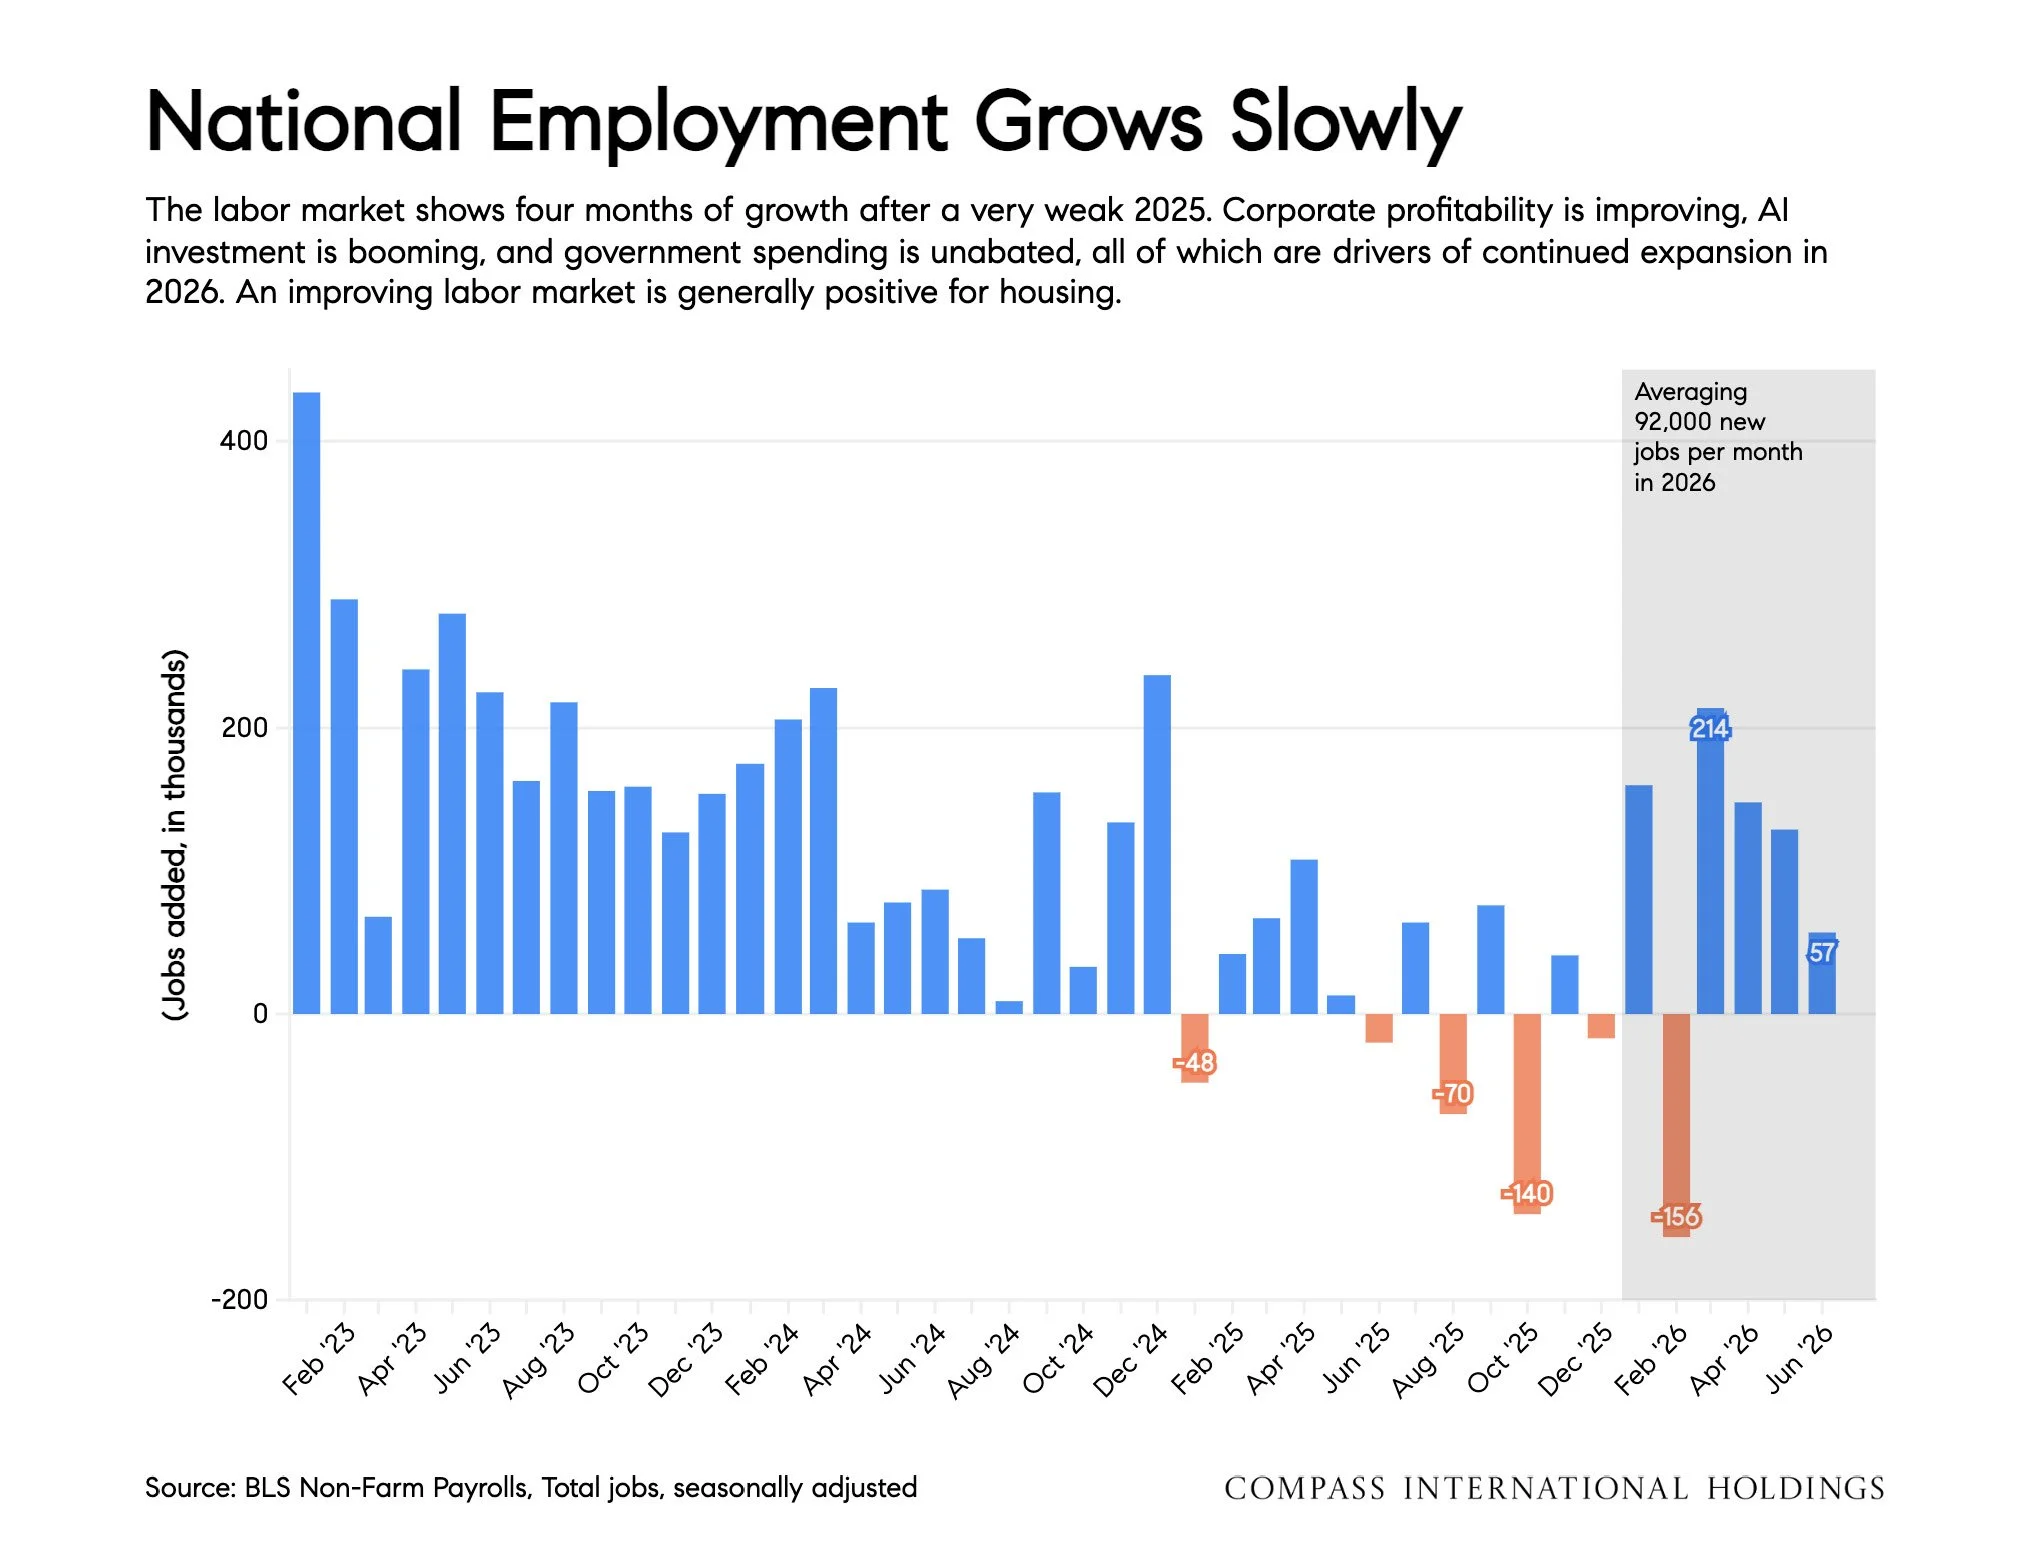
National Employment Grows Slowly
The labor market shows four months of growth after a very weak 2025. Corporate profitability is improving, Al investment is booming, and government spending is unabated, all of which are drivers of continued expansion in 2026. An improving labor market is generally positive for housing.
Source: BLS Non-Farm Payrolls, Total jobs, seasonally adjusted
Bay Area Job Growth Slows Again
While the most recent 12 months have been mildly positive for job growth in the Bay Area, the most recent two months report a weakening job market again.
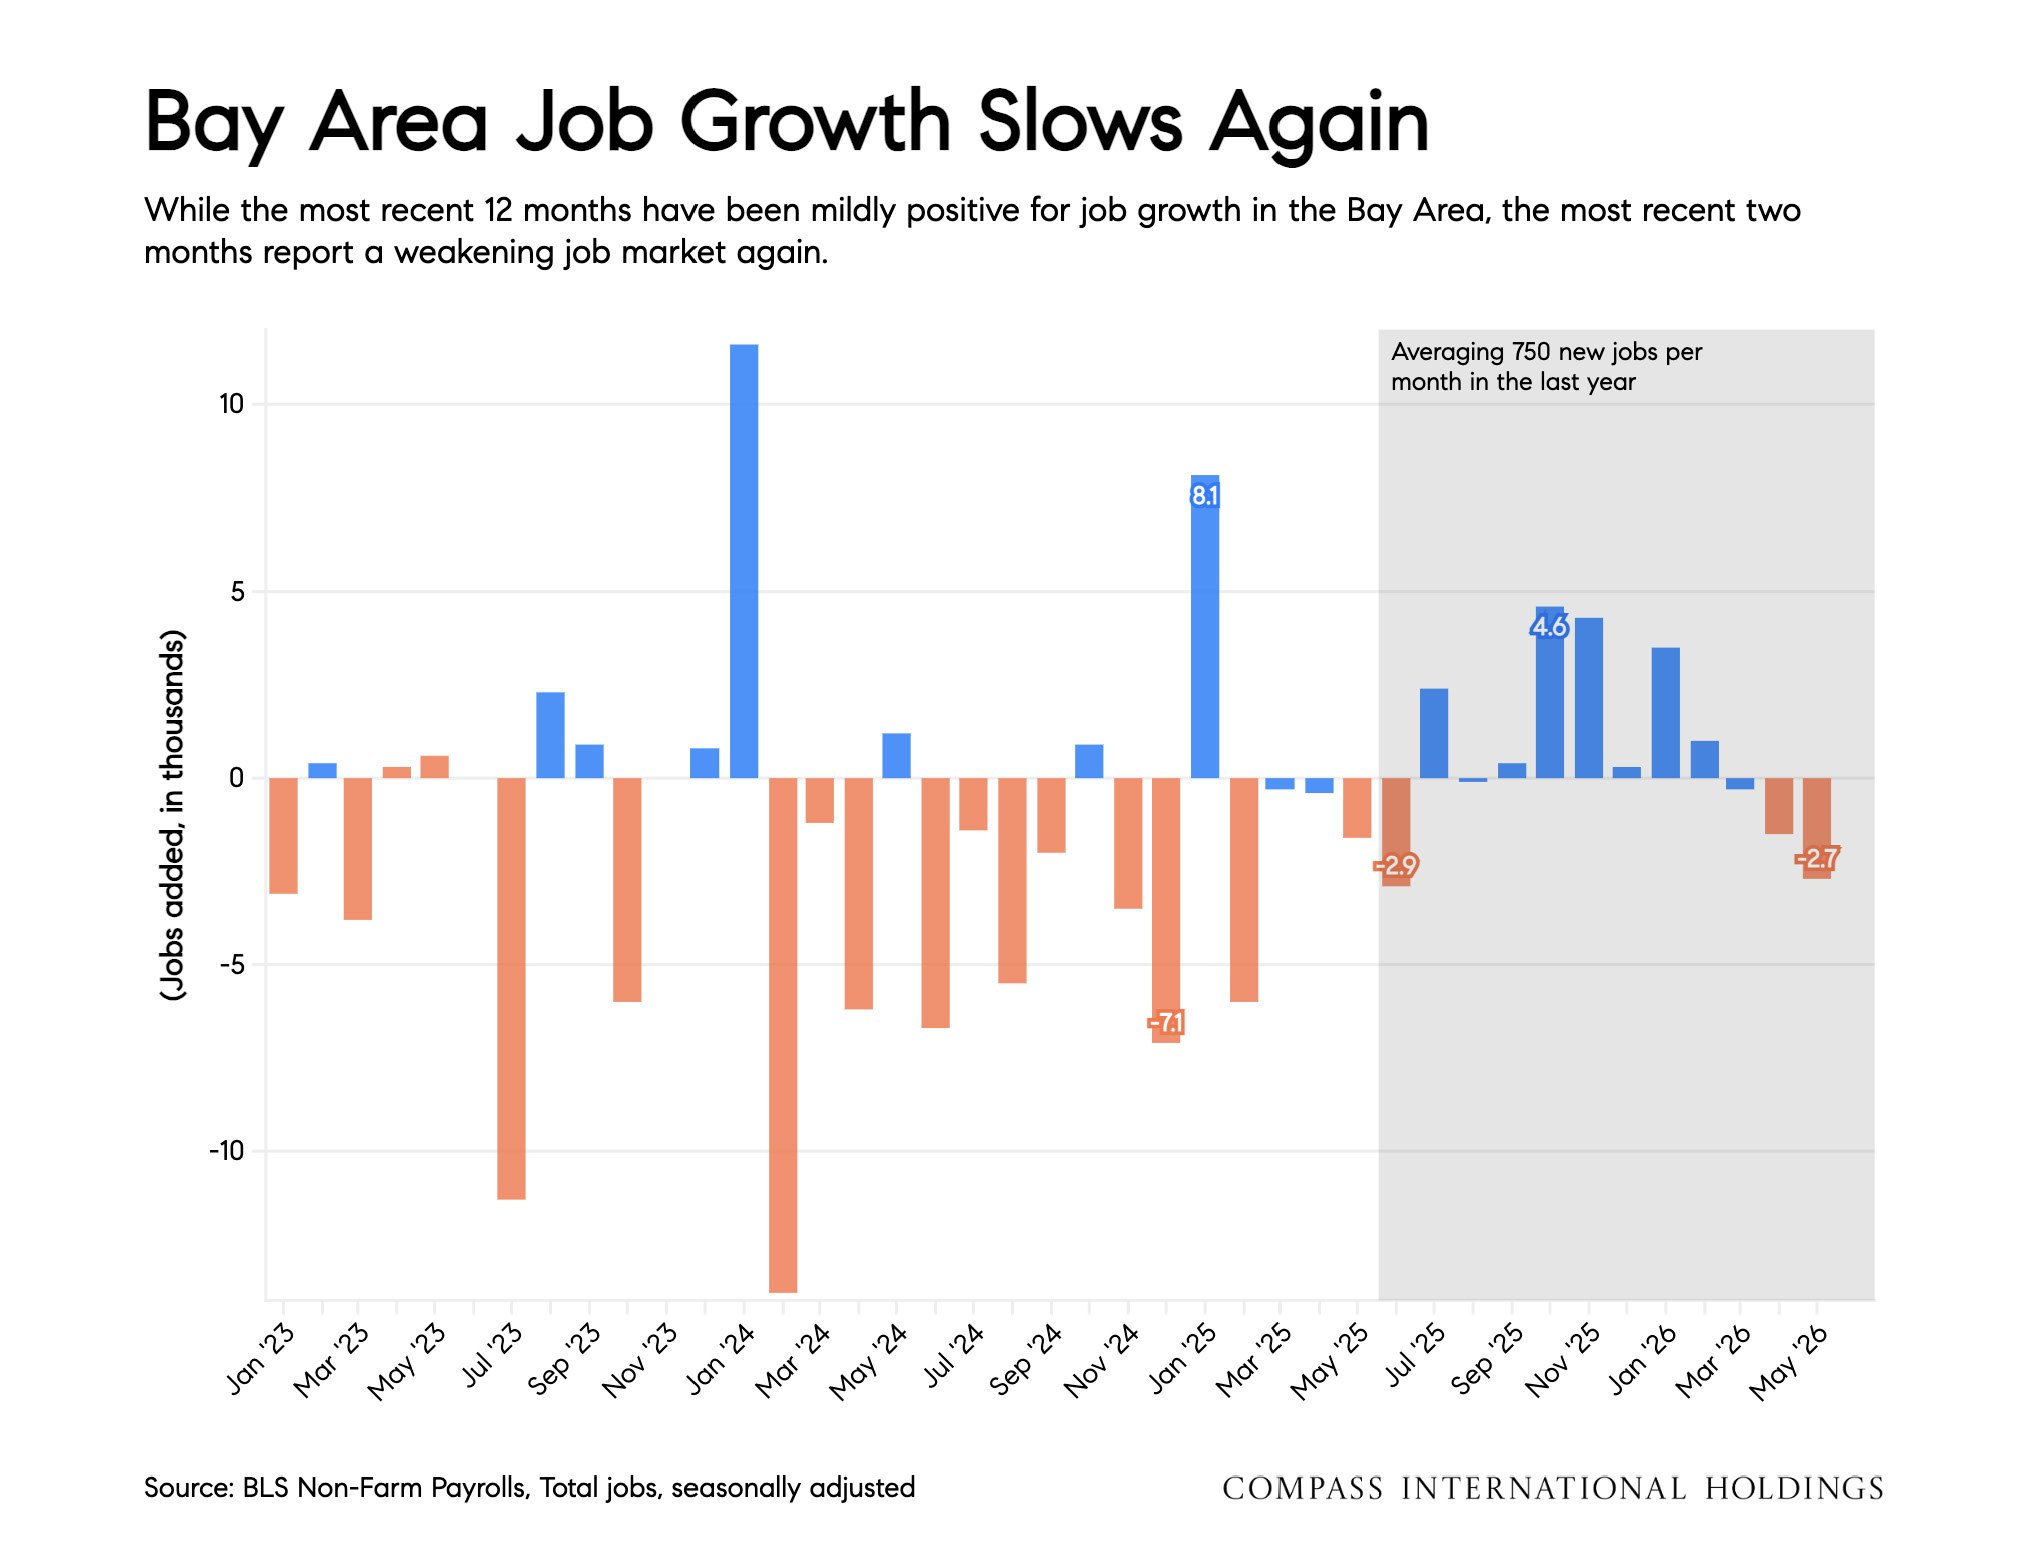
Source: BLS Non-Farm Payrolls, Total jobs, seasonally adjusted
June Unemployment Declined
Headline Unemployment (U3) has moved lower since November. The June numbers defied expectations and dropped to 4.2%. Continued low unemployment implies very few distressed home sales but also generally holds interest rates higher.
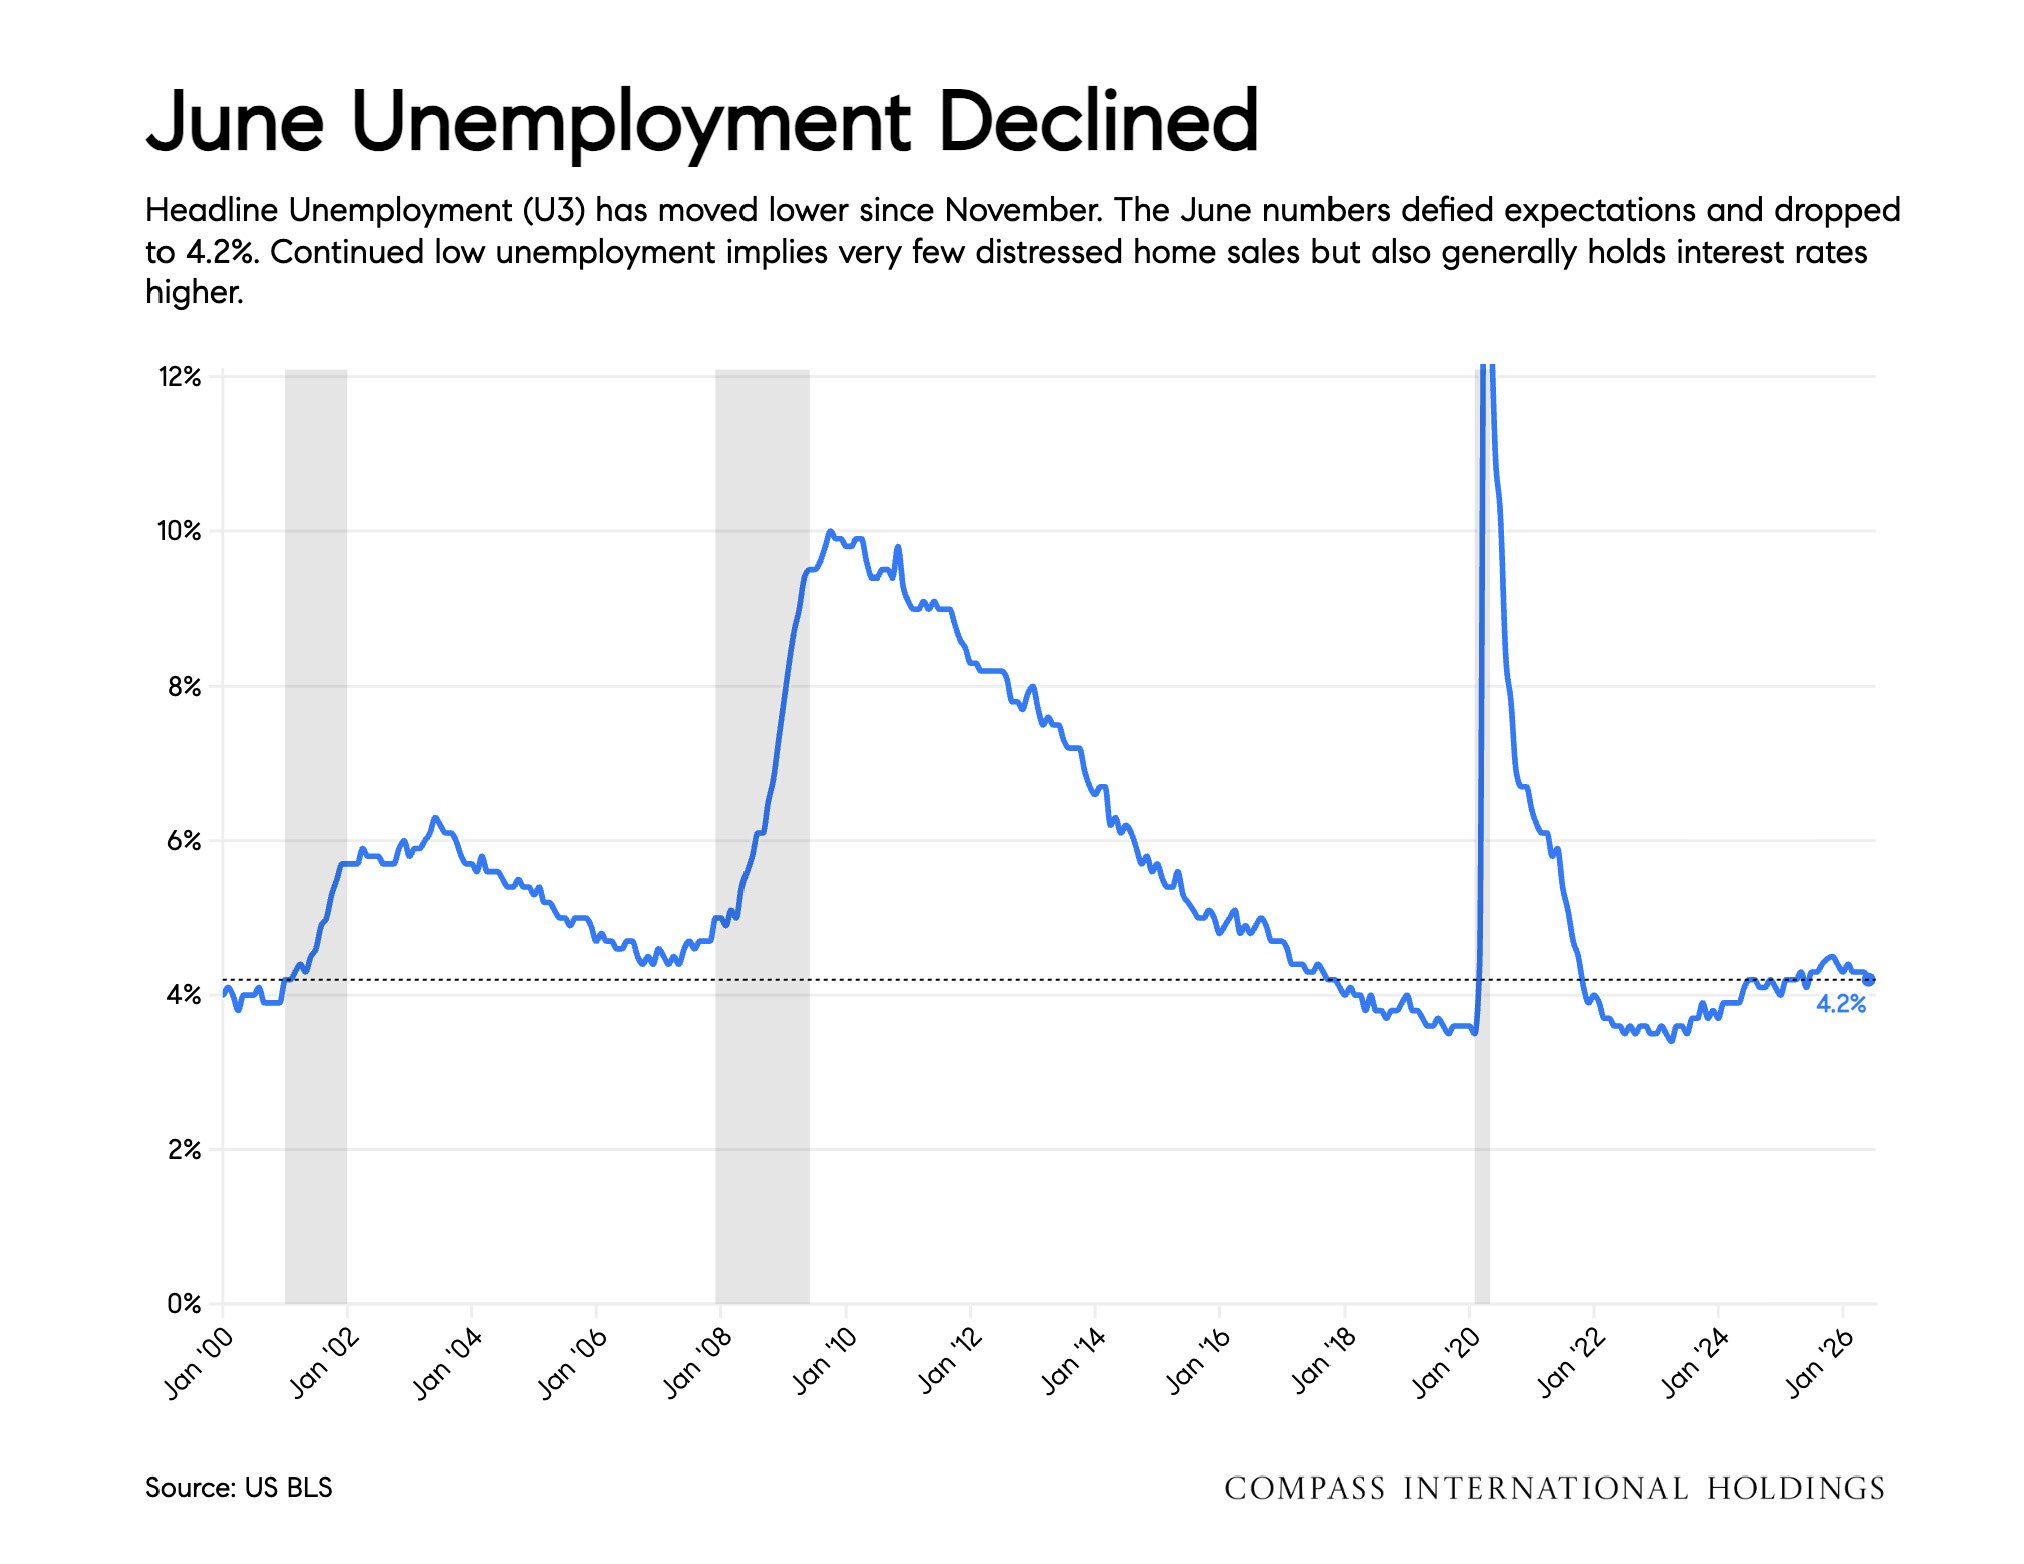
Source: US BLS
Wealth Effect Drives Home Purchase Demand
With stock markets near all time highs, a powerful "wealth effect" is created for potential homebuyers. The opposite effect was felt in 2025 after tariffs slowed the economy and ate up business profits. This wealth effect has had dramatic results in the Bay Area with Al related market boom and IPOs in the pipeline.
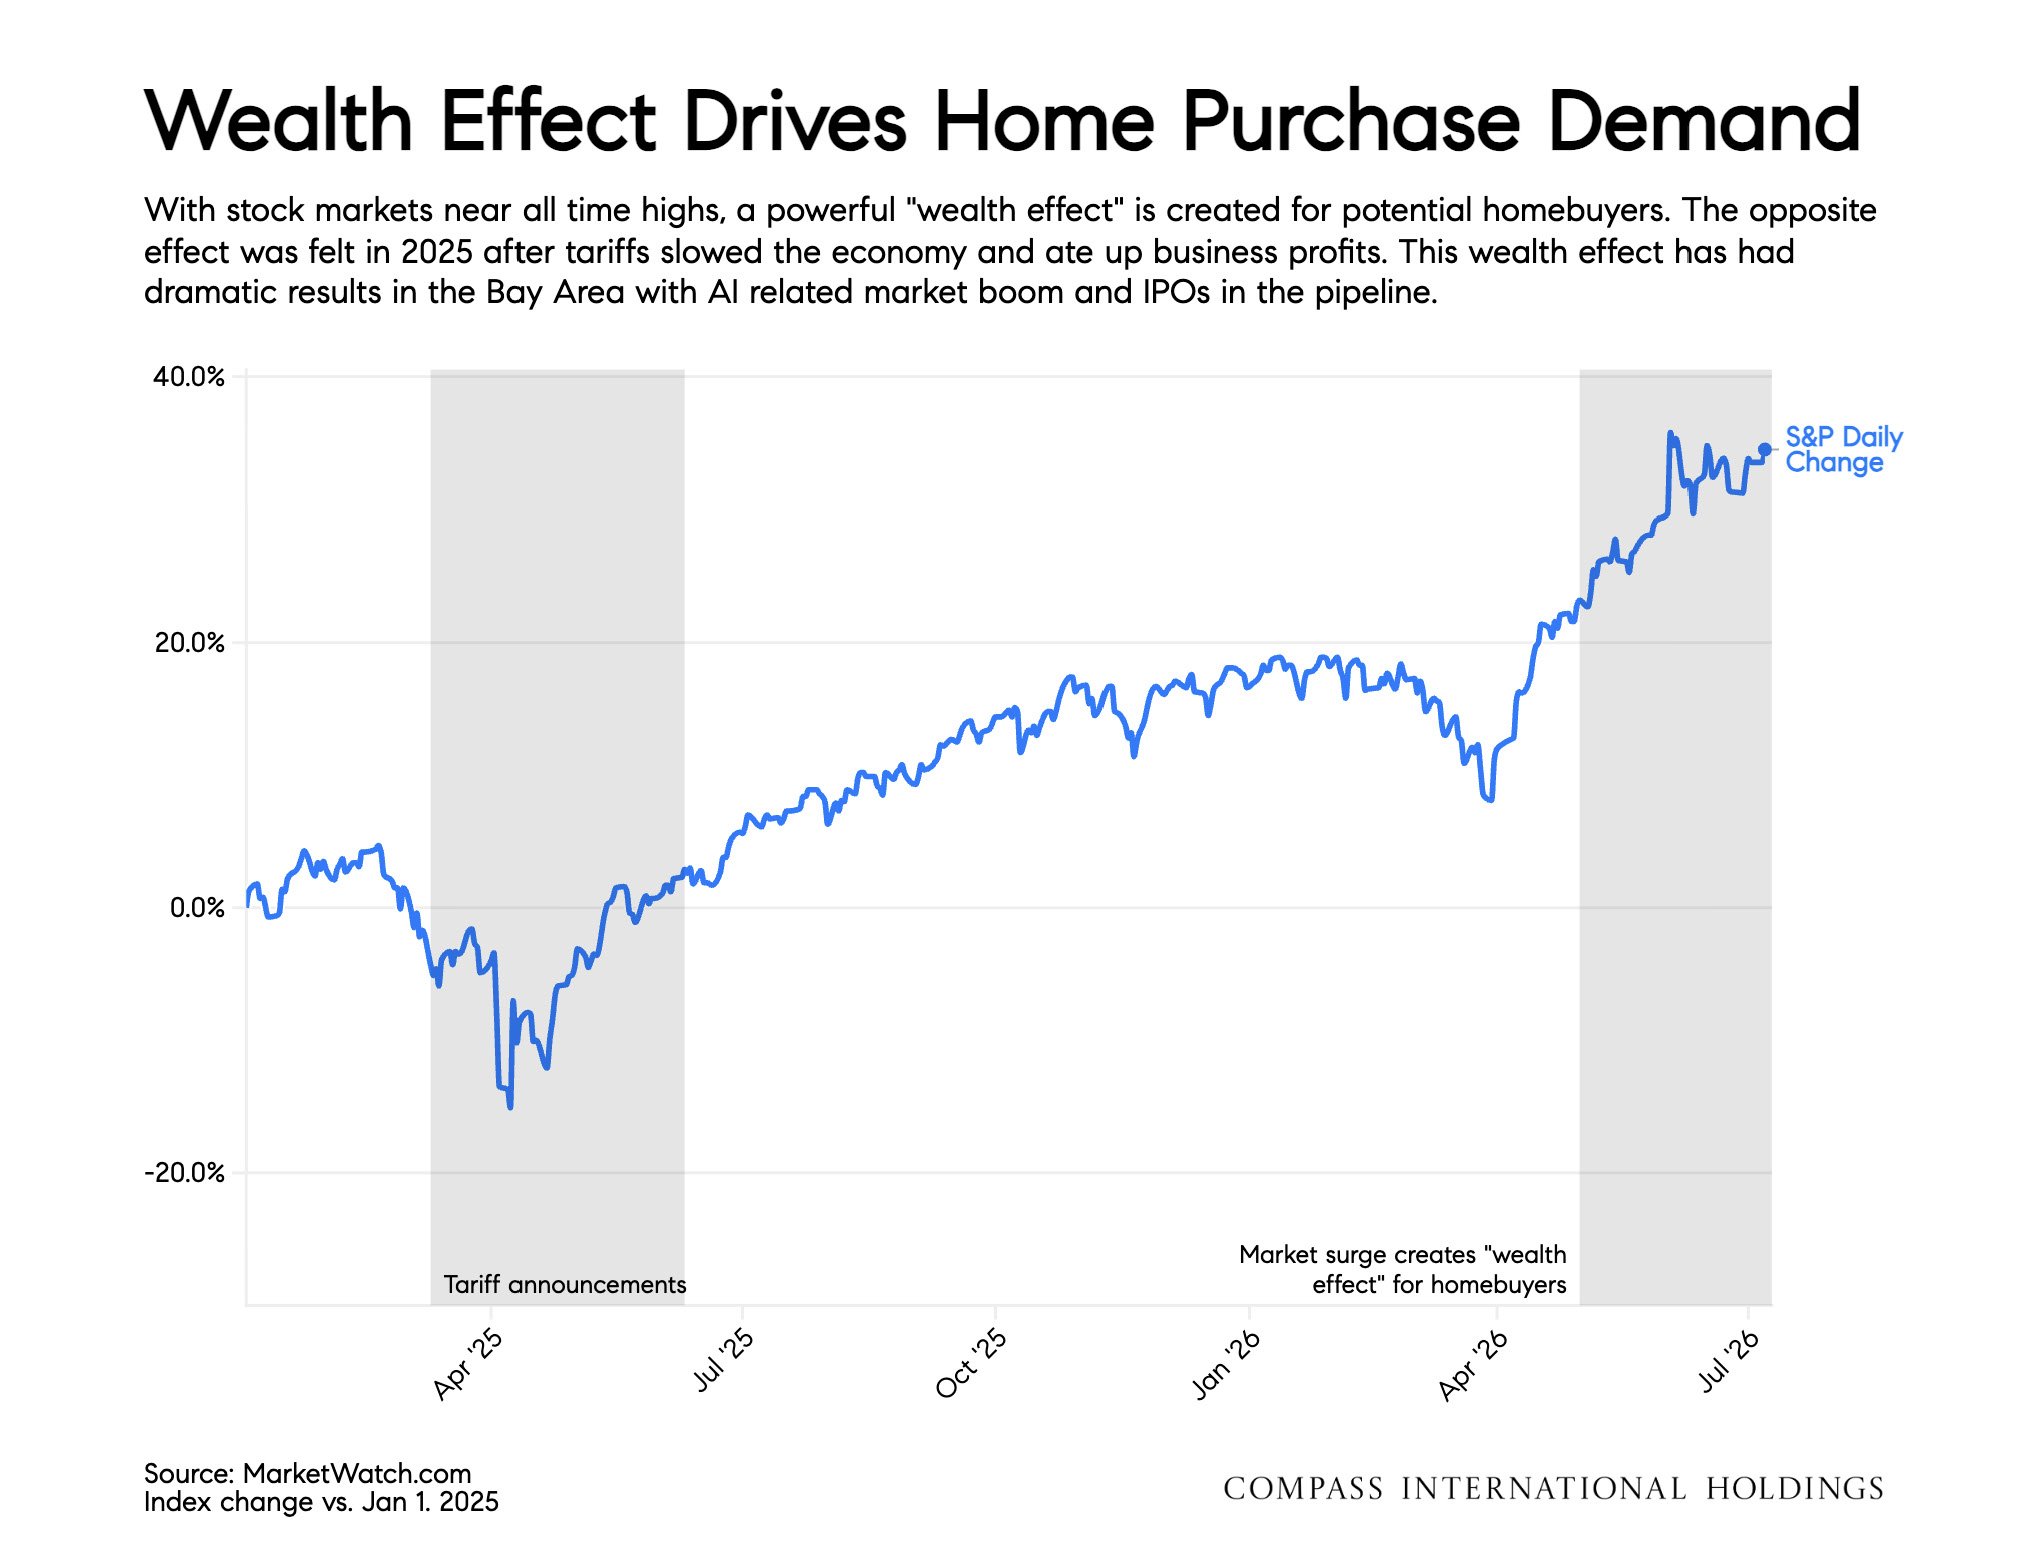
Source: MarketWatch.com Index change vs. Jan 1. 2025
Bay Area Sales Price Growth is Accelerating
According to the Case Shiller Index, nationally home prices are only 0.8% above last year. San Francisco prices have recently swung positive while other Western US cities show prices falling compared to last year.
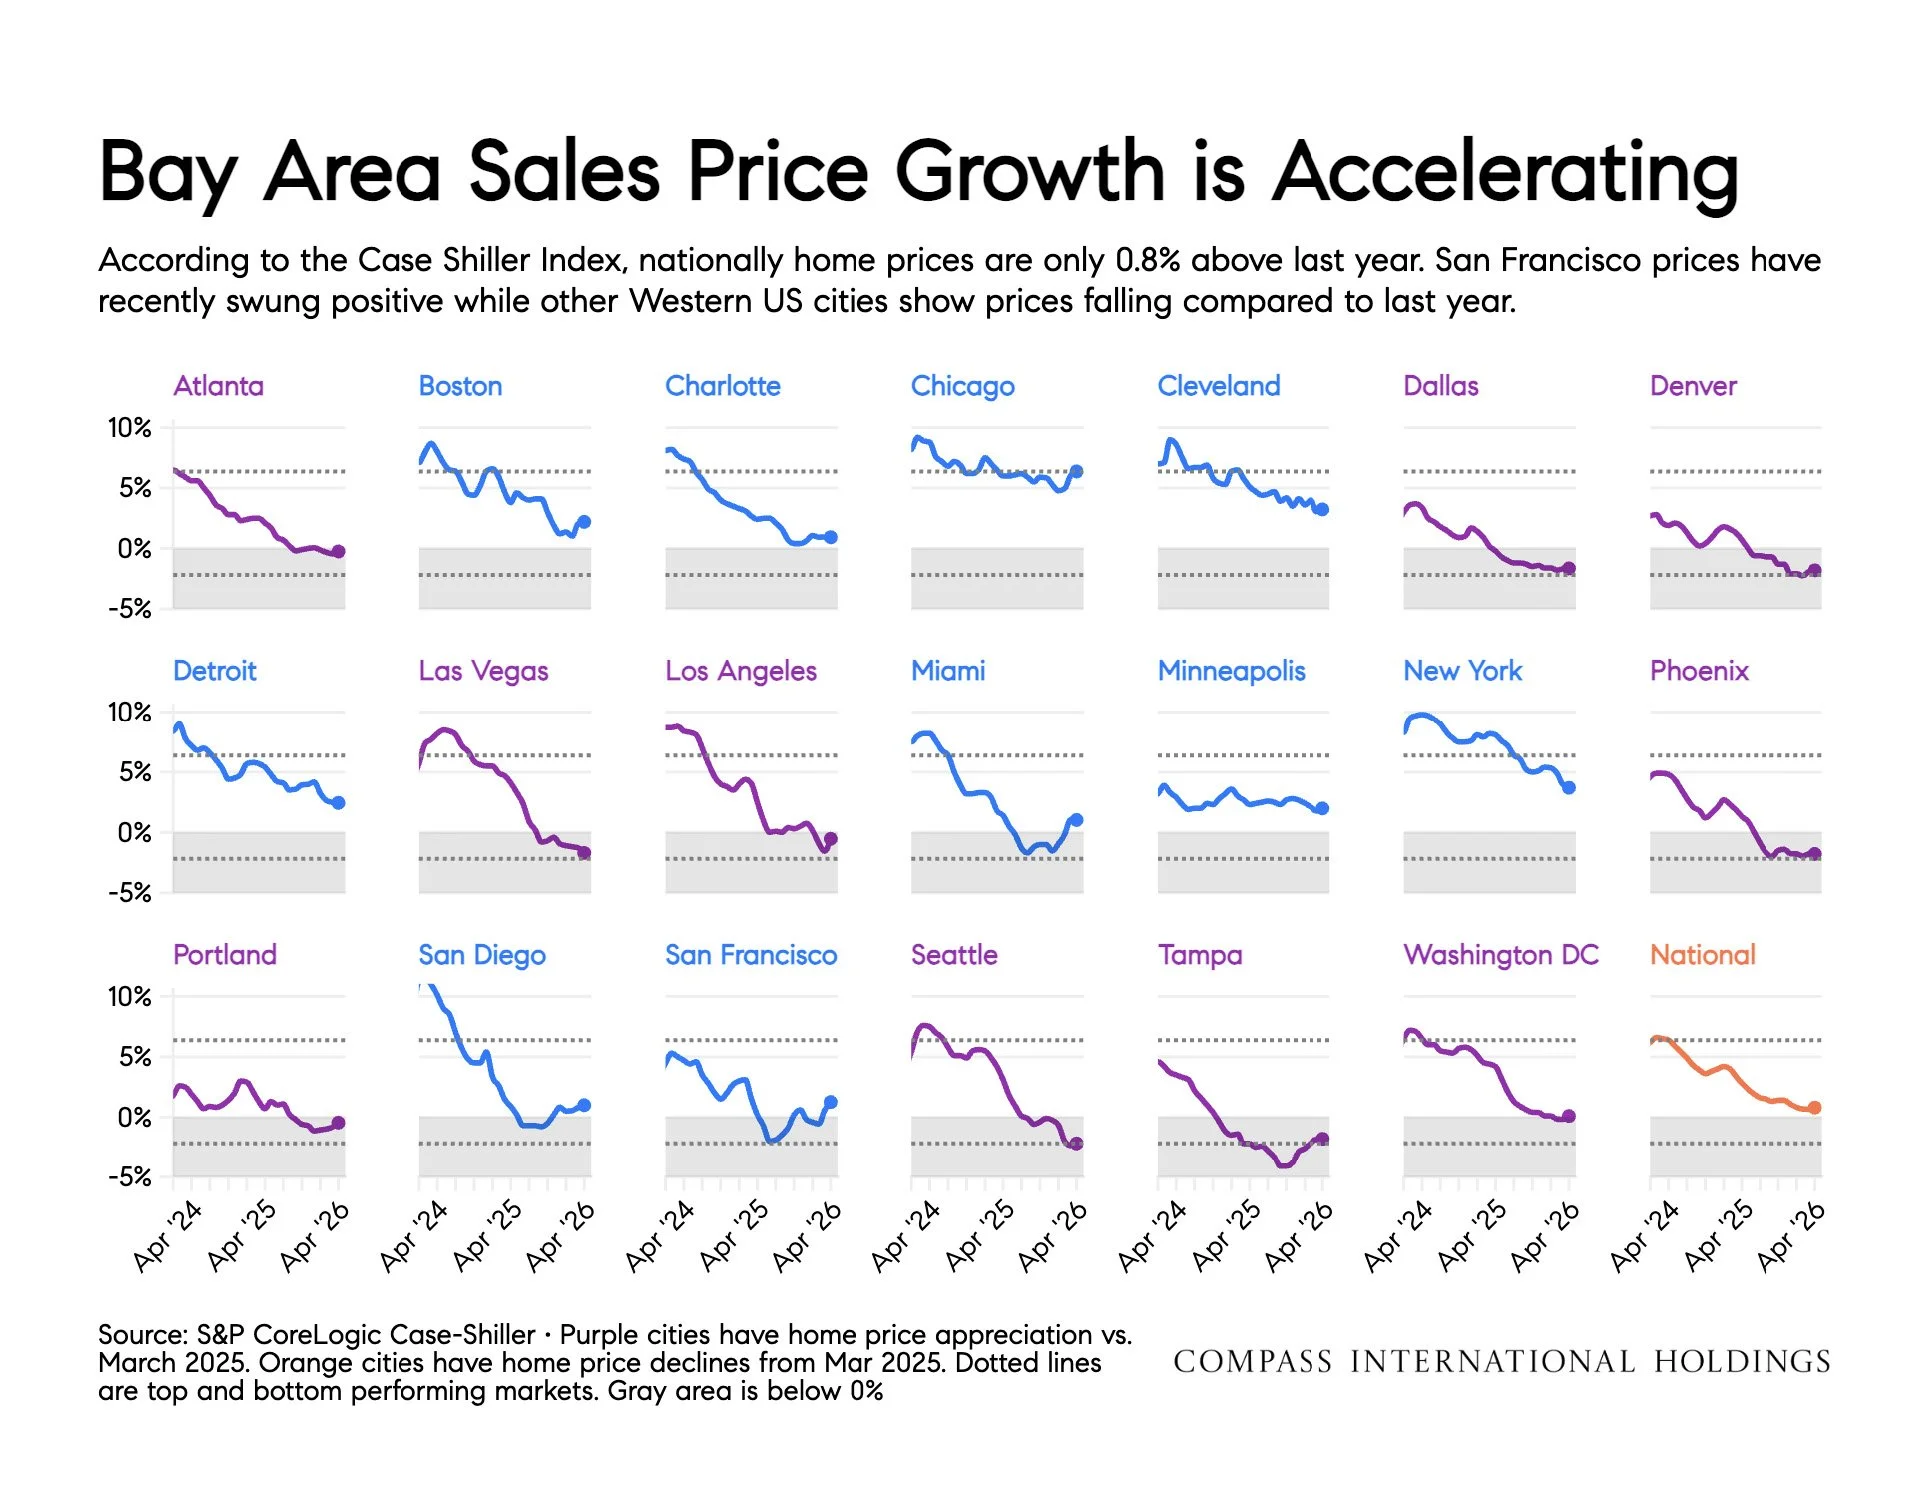
Source: S&P CoreLogic Case-Shiller • Purple cities have home price appreciation vs. 2025. Orange cities have home price declines from March 2025. Dotted lines are top and bottom performing markets. Gray area is below 0%.
Bay Area Migration Sources & Destinations
In 2025, inbound migration to the Bay Area resumed for the first time in many years. Seattle and Austin are net inbound to San Francisco. Lower cost of living cities remain popular destinations for outbound movers.
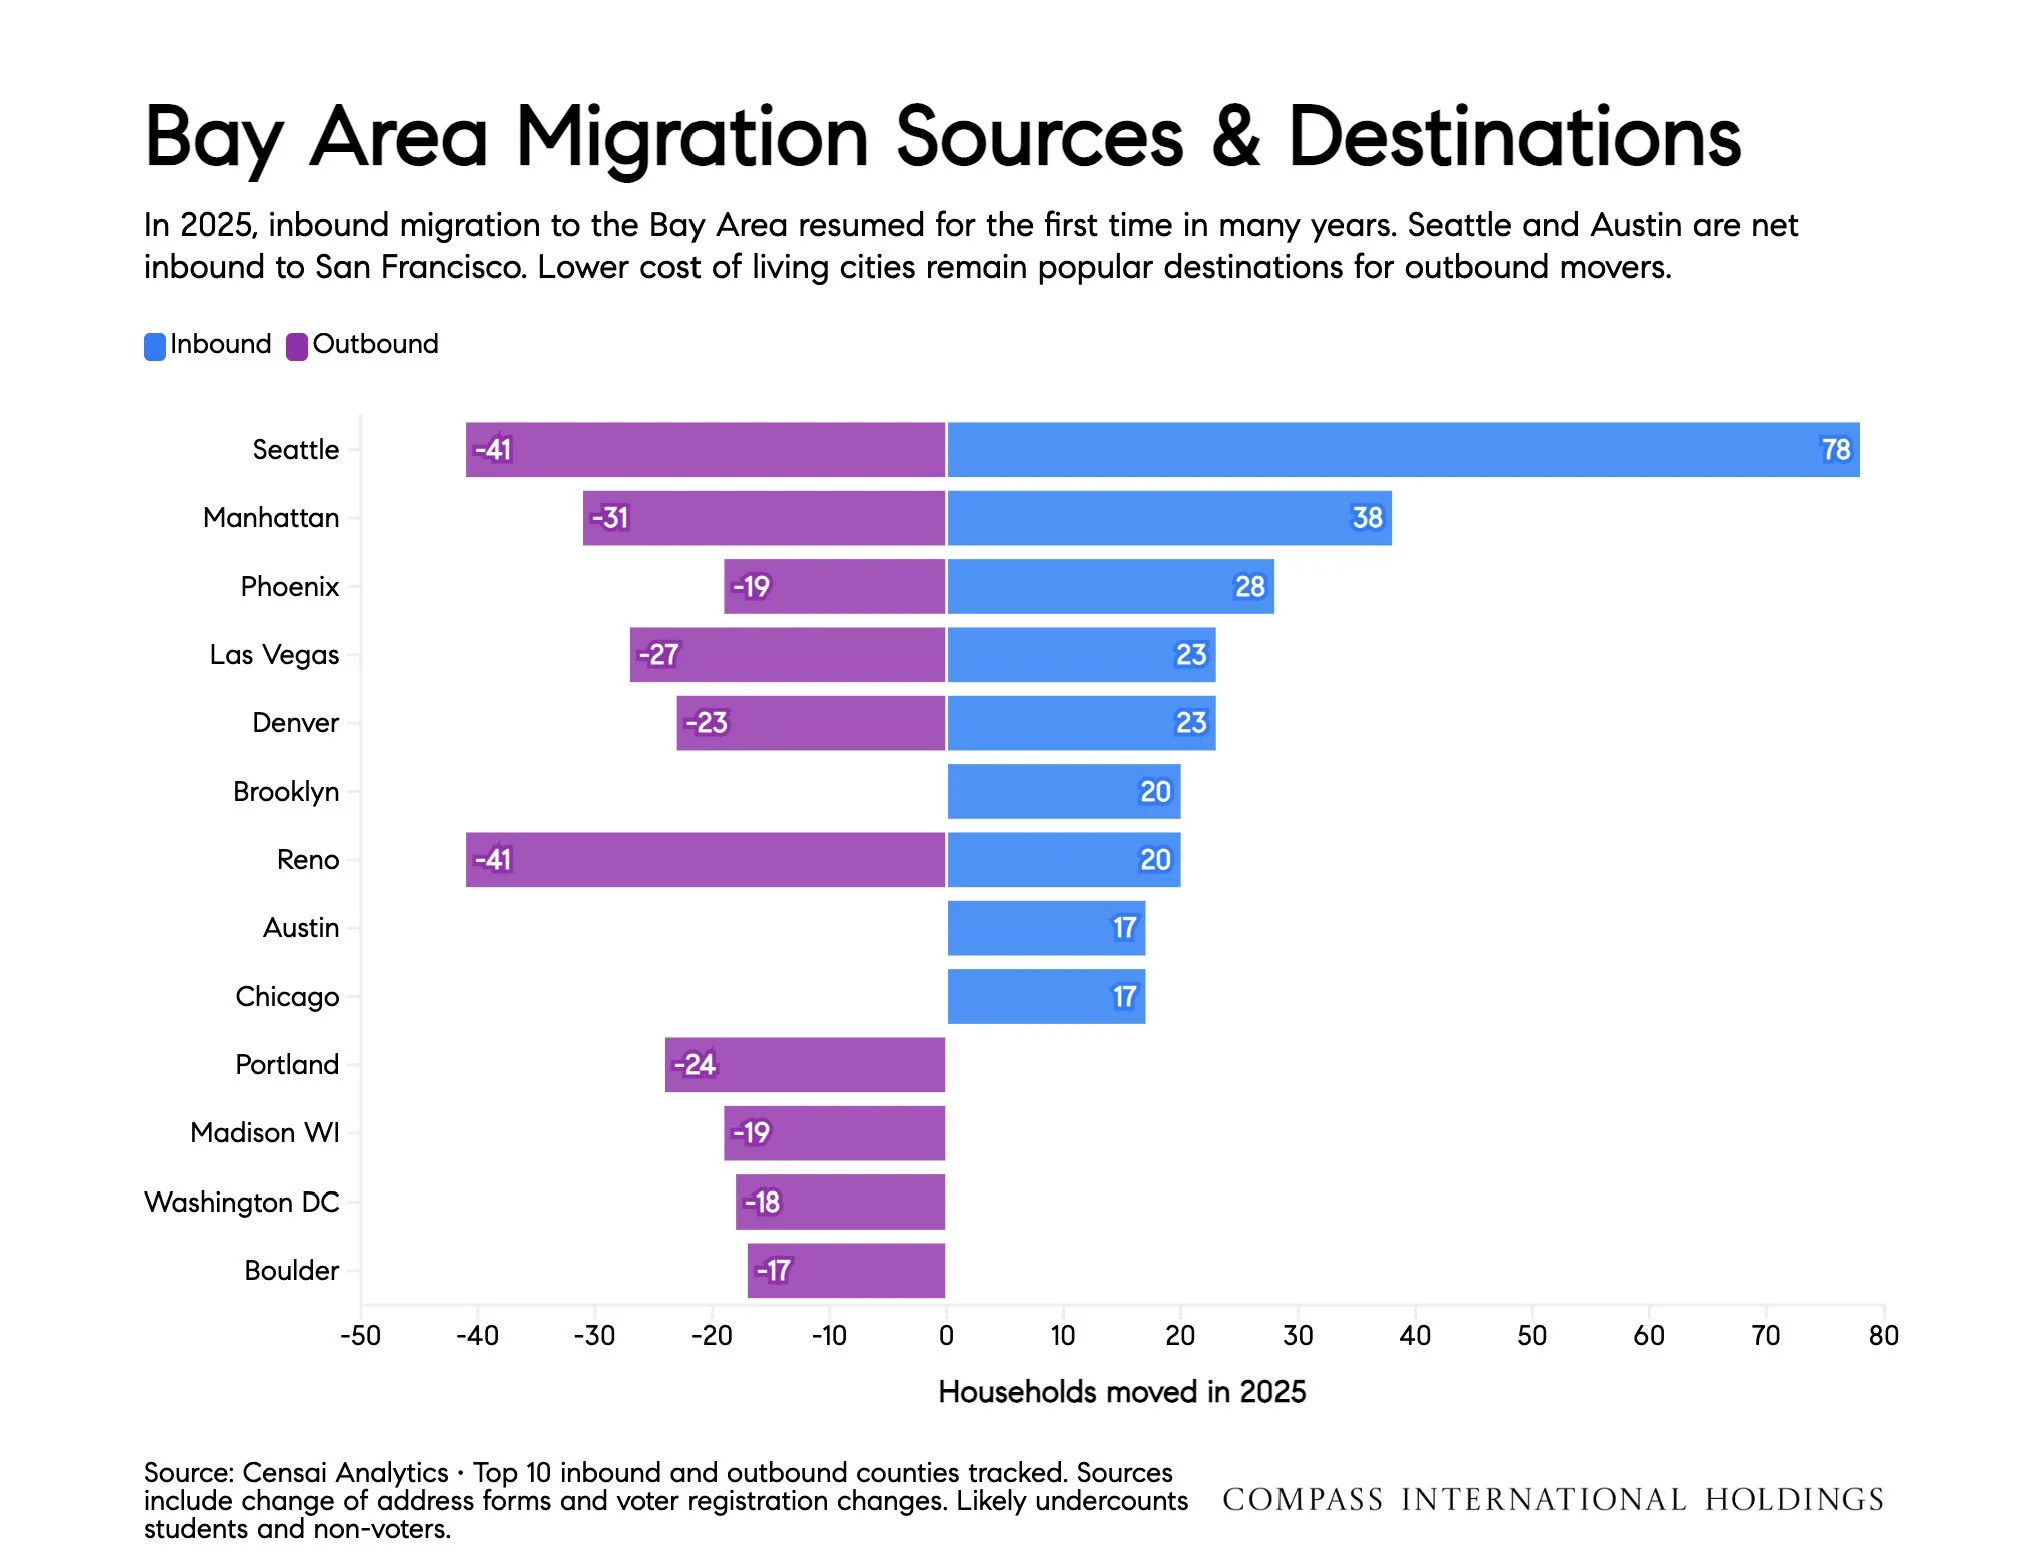
Source: Censai Analytics • Top 10 inbound and outbound counties tracked. Sources include change of address forms and voter registration changes. Likely undercounts students and non-voters.
Expensive and Cheap Mortgages
More mortgages now carry a 6-plus% rate than under 3%. Homeowners with very cheap mortgage payments are reluctant to ever sell, so inventory remains tight and sales are fewer than normal. Over time, fewer homeowners are locked-in to ultra low rates and home sales will grow.
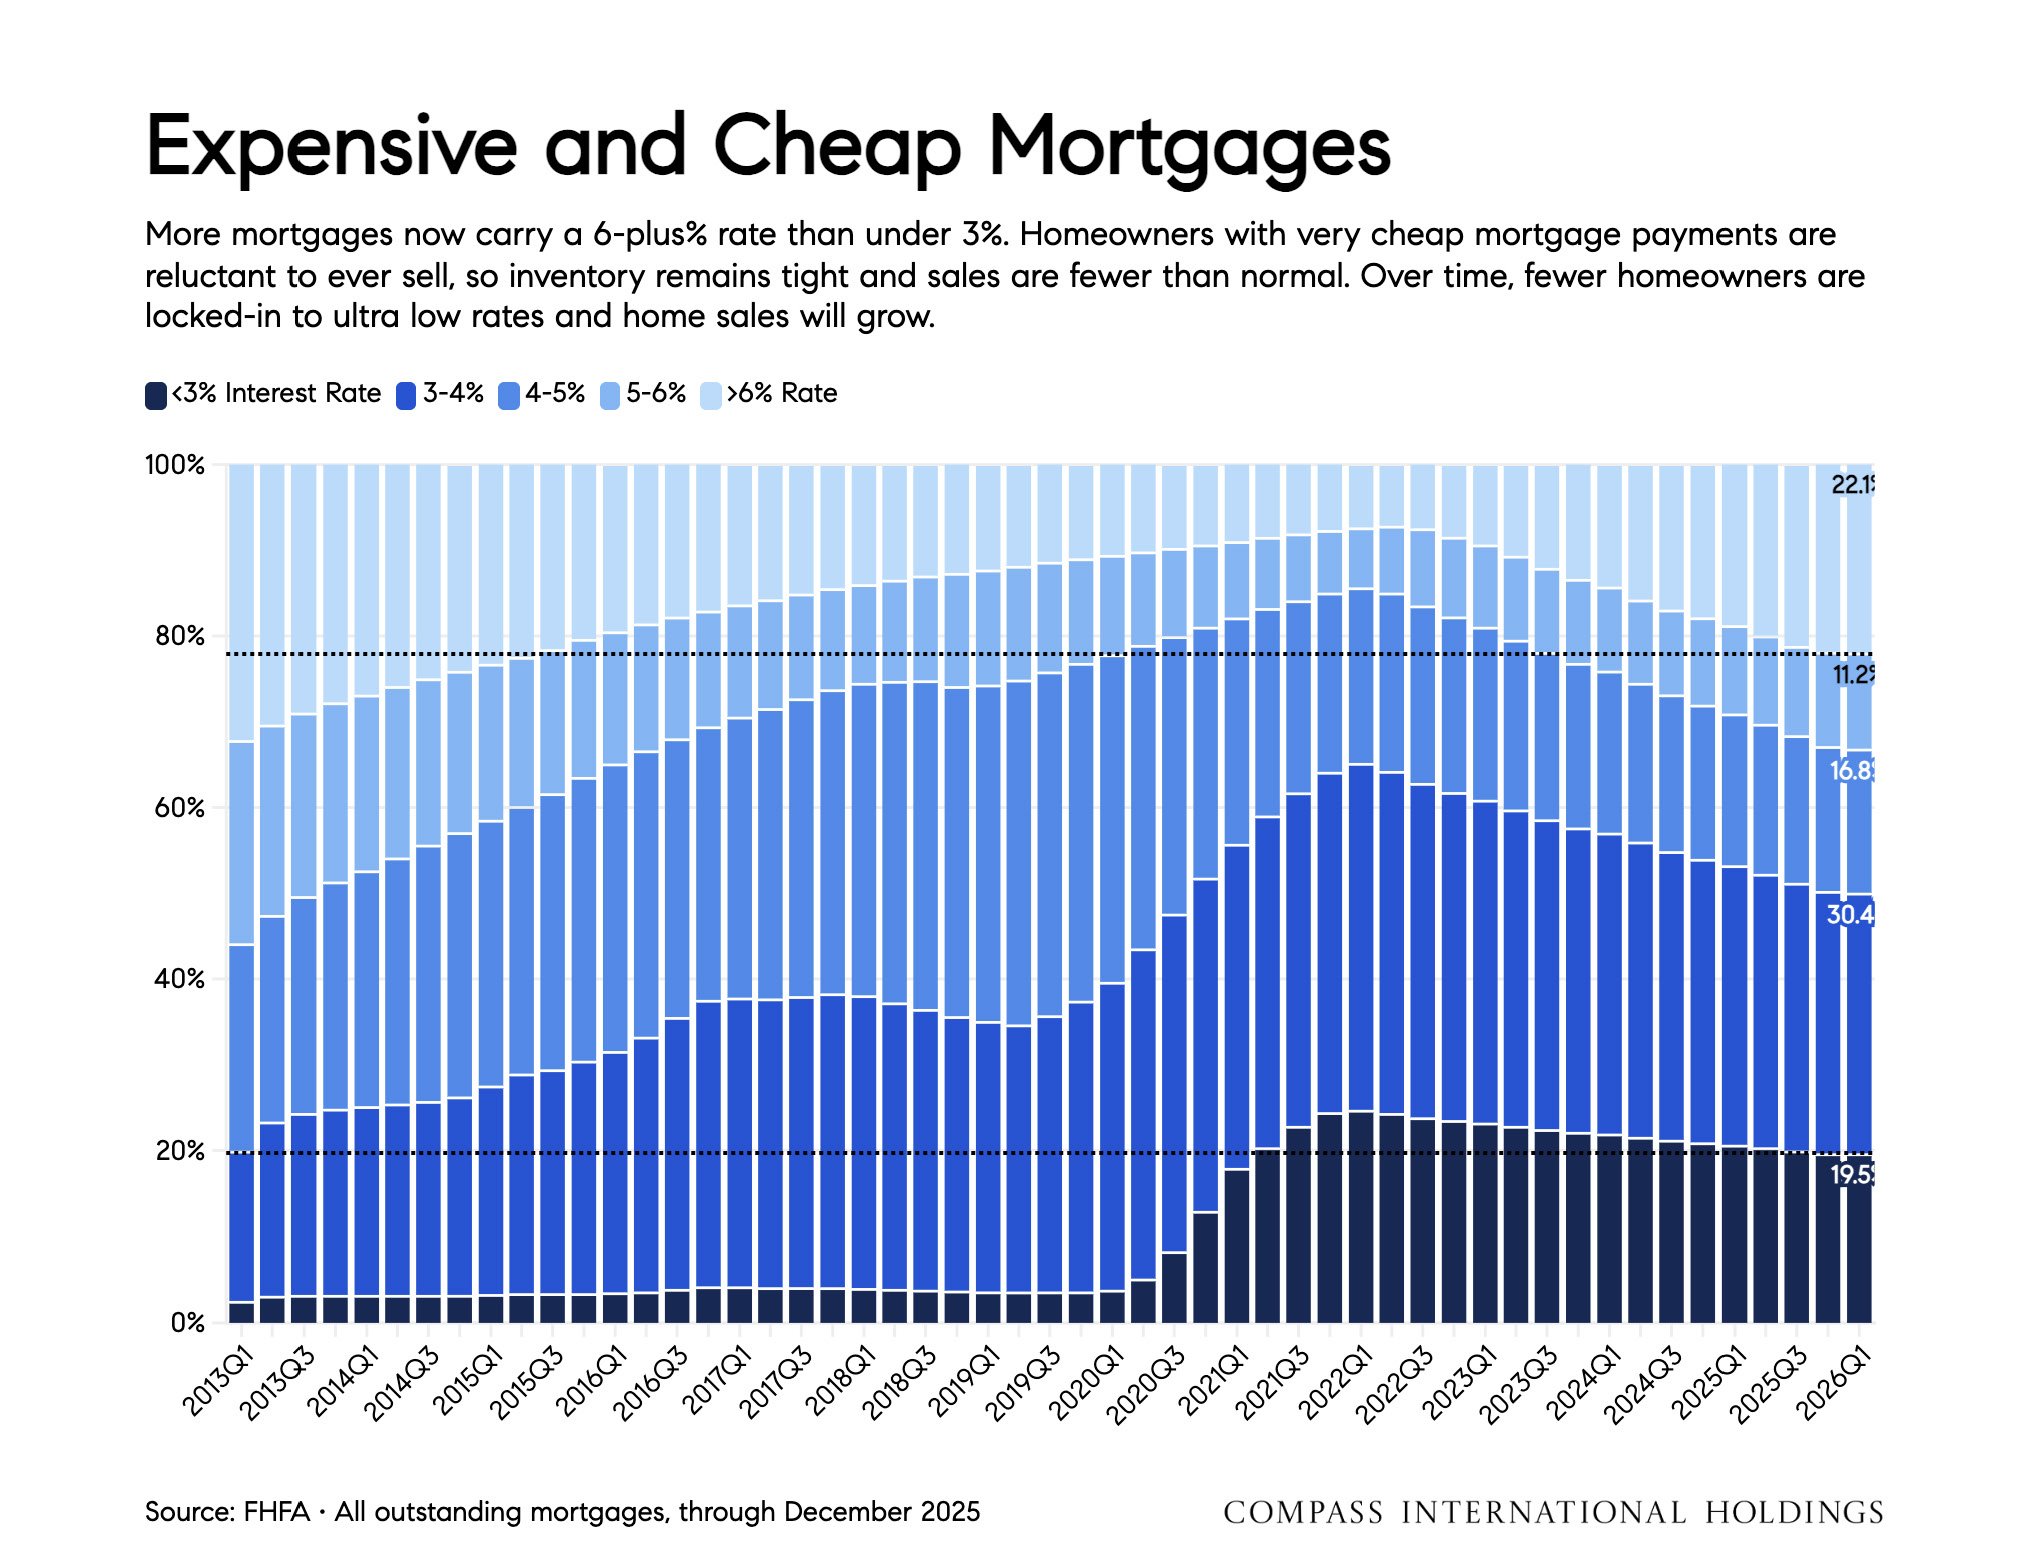
Source: FHFA • All outstanding mortgages, through December 2025
San Francisco Market
Report created in good faith using public and proprietary data from sources deemed reliable but may contain errors and is subject to revision. Data is pulled at the end of the month, and last-period figures may still be preliminary due to late-reported activity. All numbers are approximate and may change, including Private Exclusive sales and other transactions not publicly reported at the time of publication.
San Francisco Recap
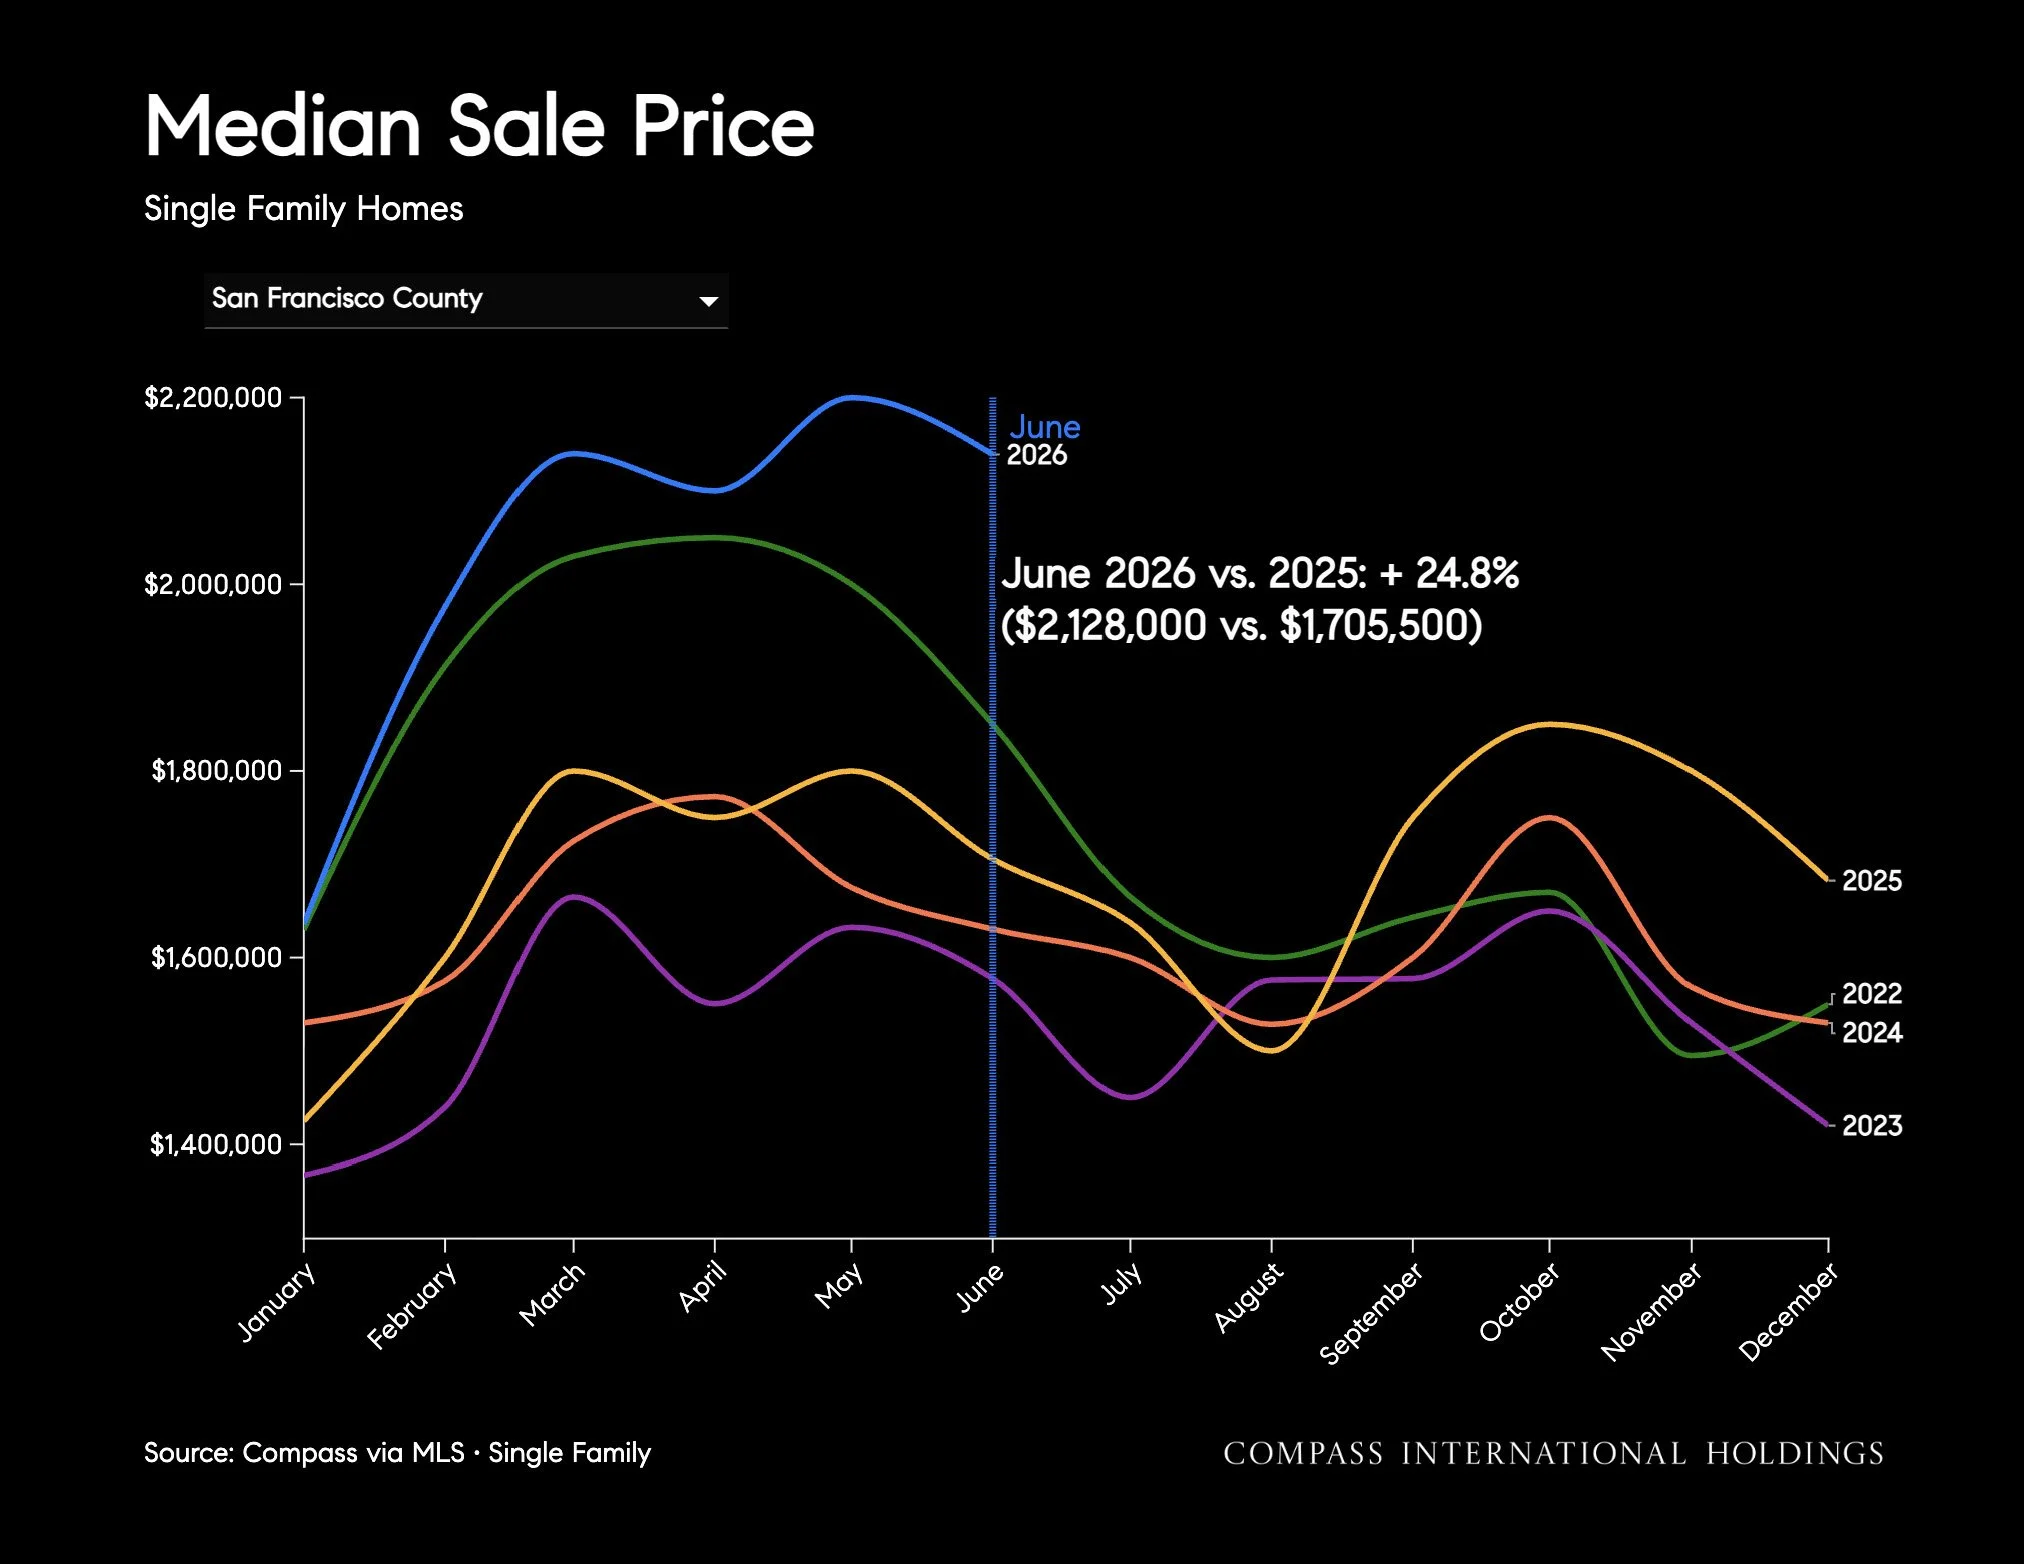
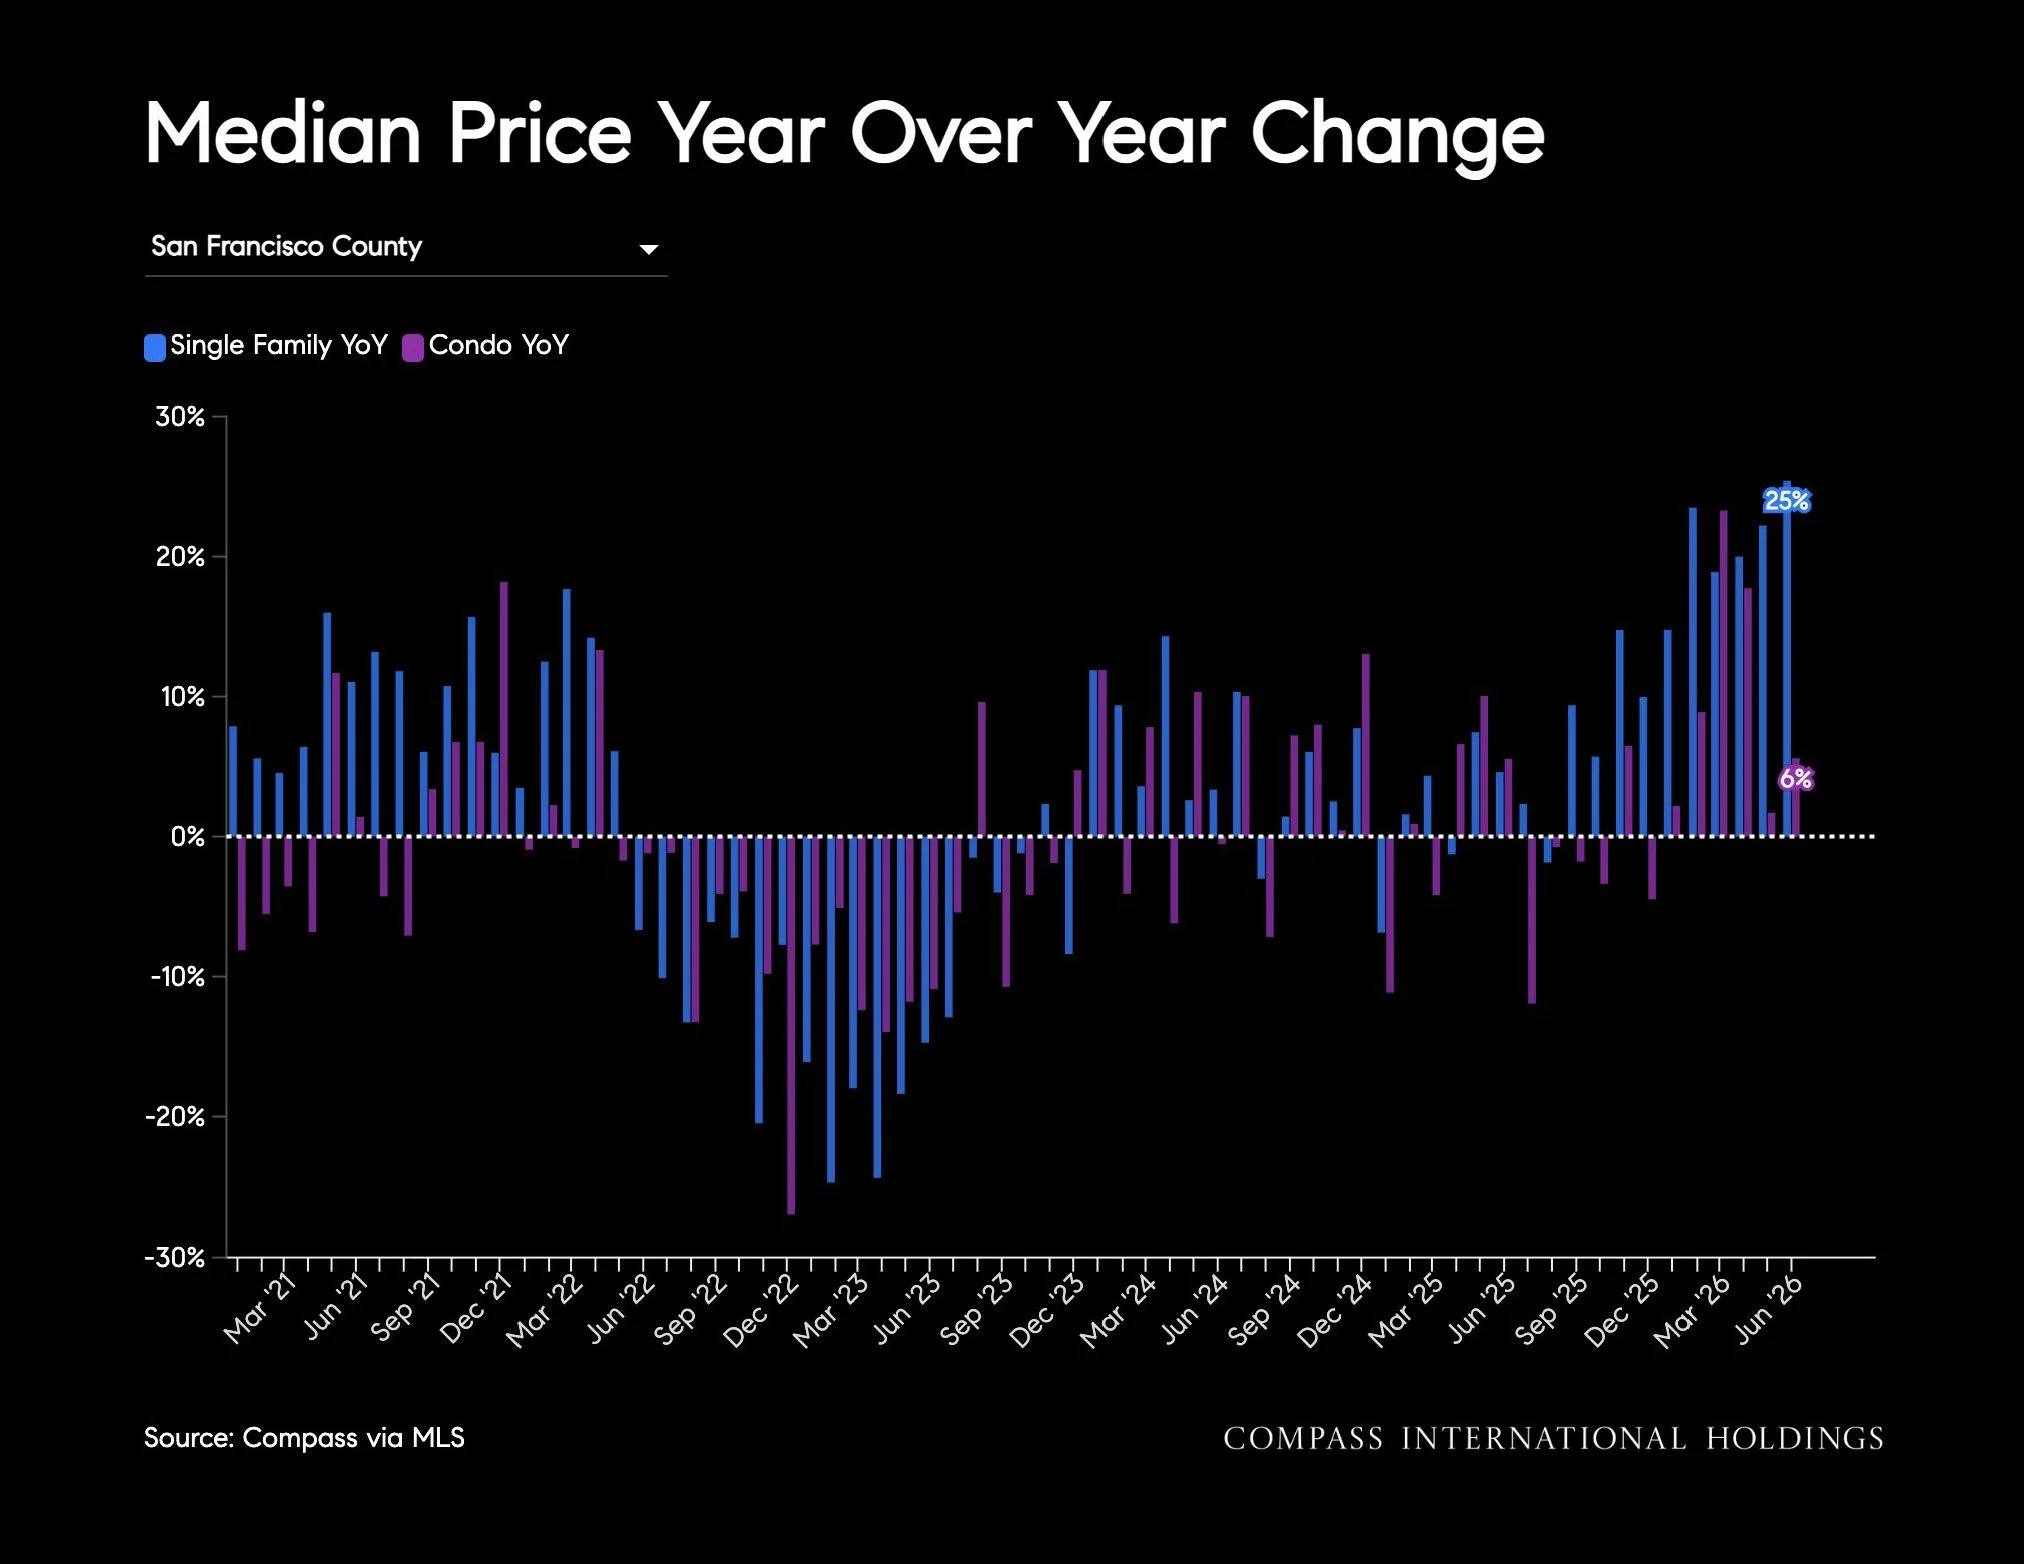
San Francisco's single-family housing market is continuing to break away from the post-pandemic correction and has entered a period of strong price appreciation. The median single-family home price reached new highs of $2,128,000 in June 2026, an increase of 24.8% from $1,705,500 in June 2025. Prices are also 15.0% above the June 2022 median of $1,850,000. June's median price came in 3.3% lower than May's median of $2,200,000, in line with seasonal summer cooling trends.
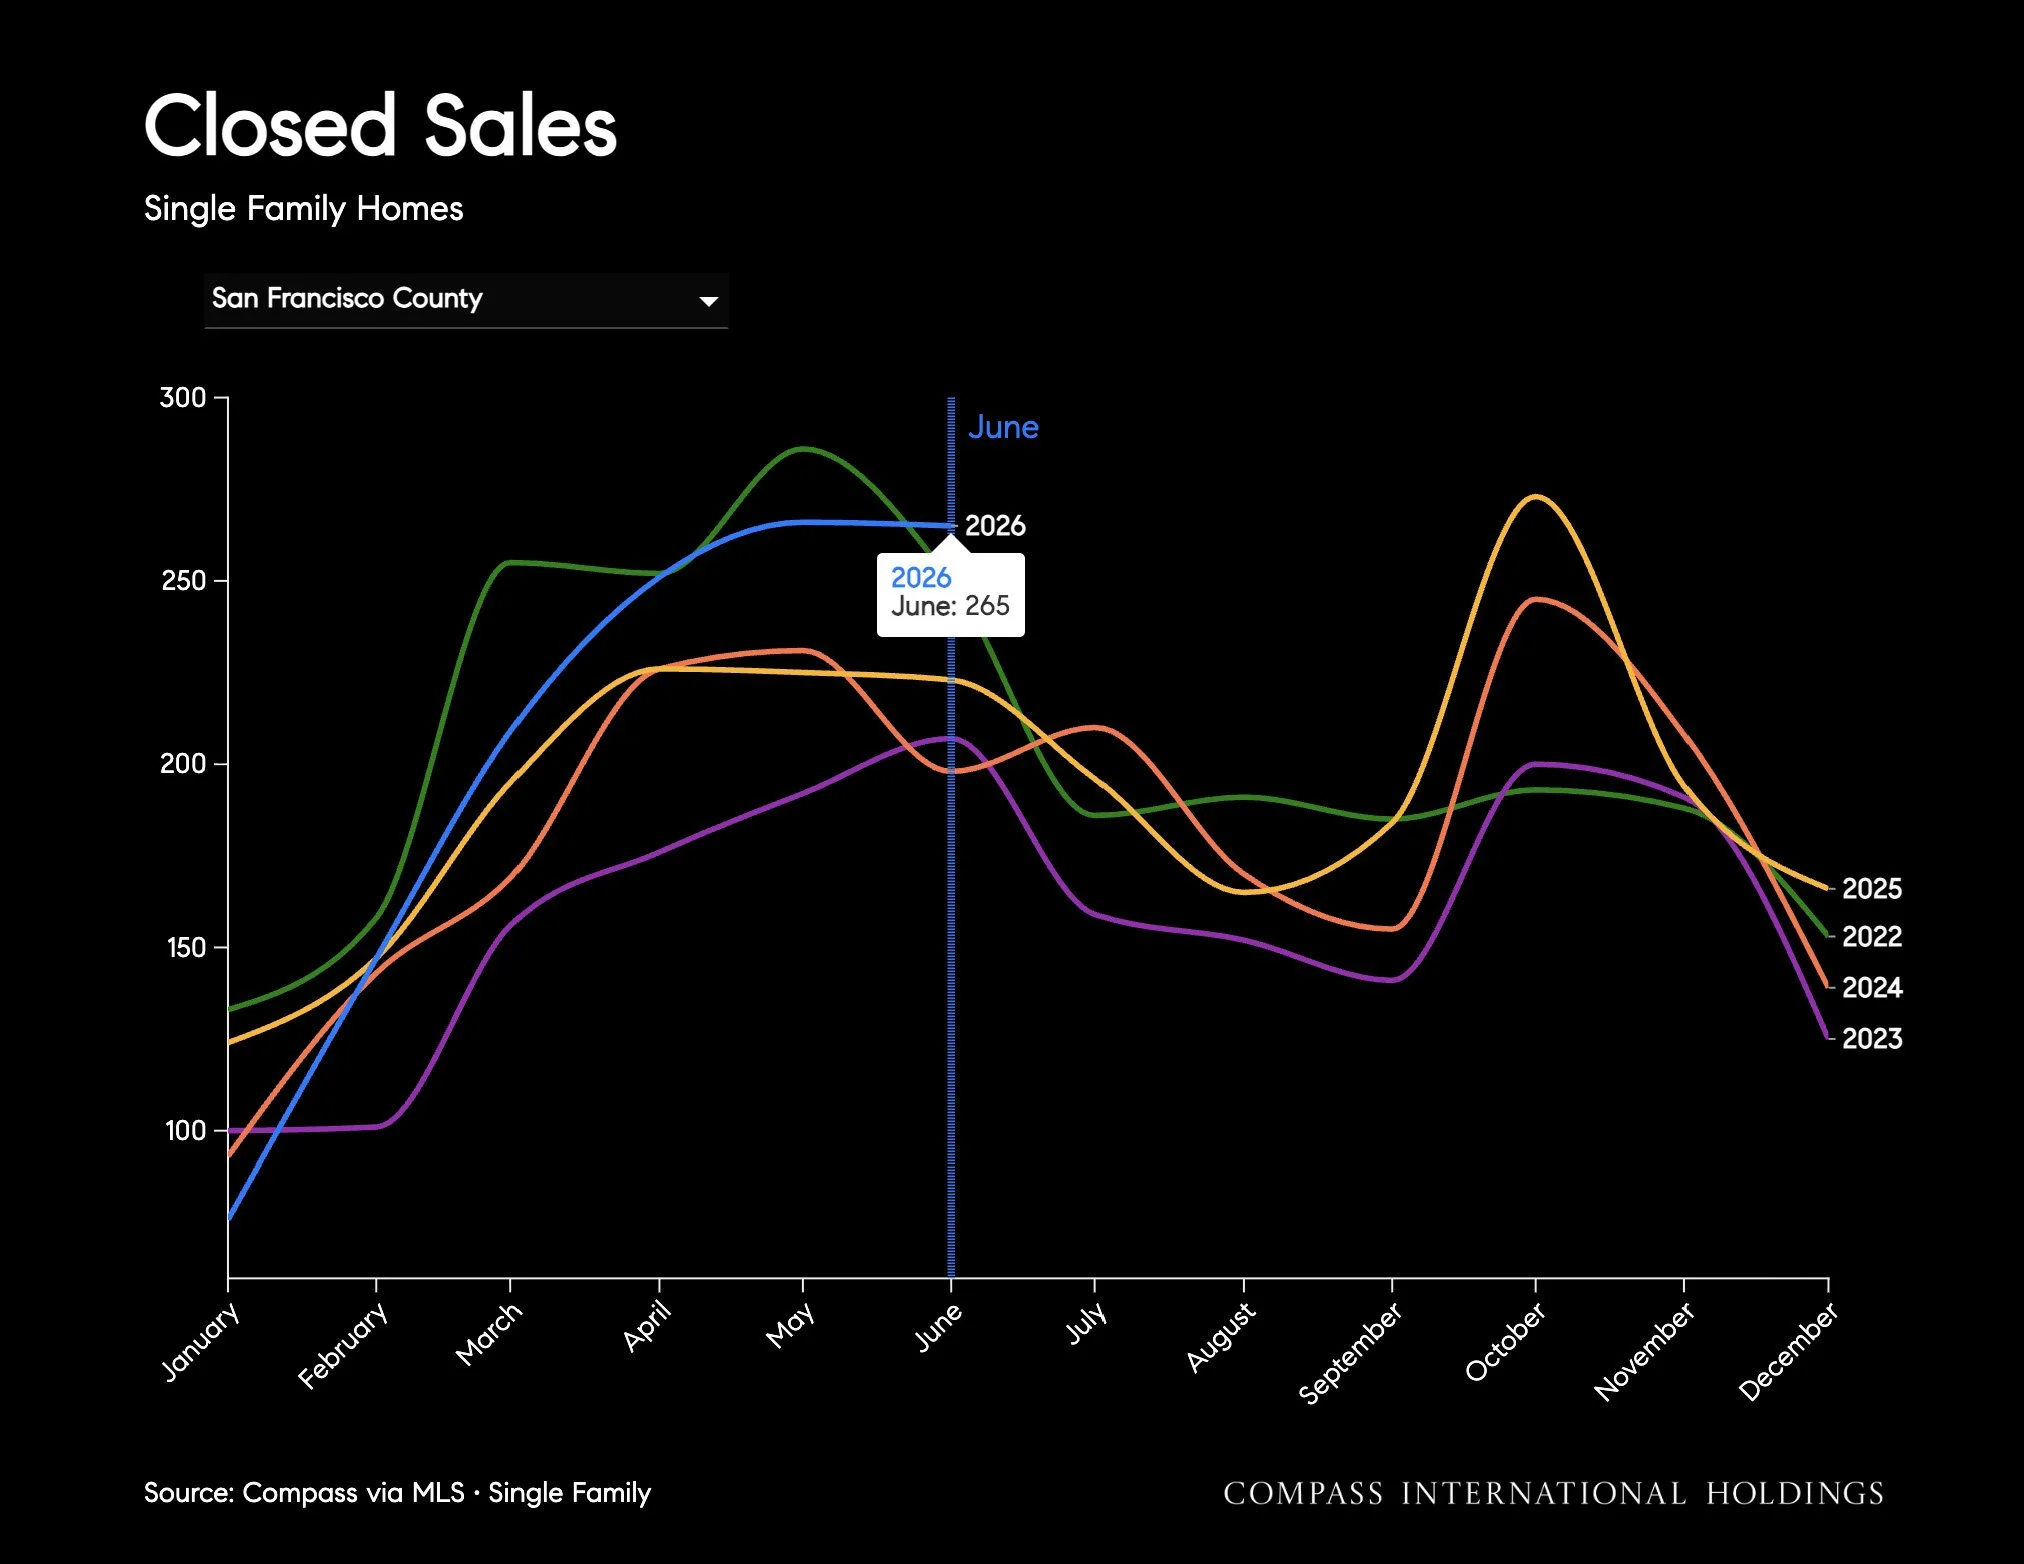
There were 232 single-family home sales in June, up 4.0% from 223 sales in June 2025. While activity remains below the 250 sales recorded in June 2022, it is stronger than the transaction levels seen in 2023 and 2024, suggesting that demand has remained resilient despite elevated home prices.
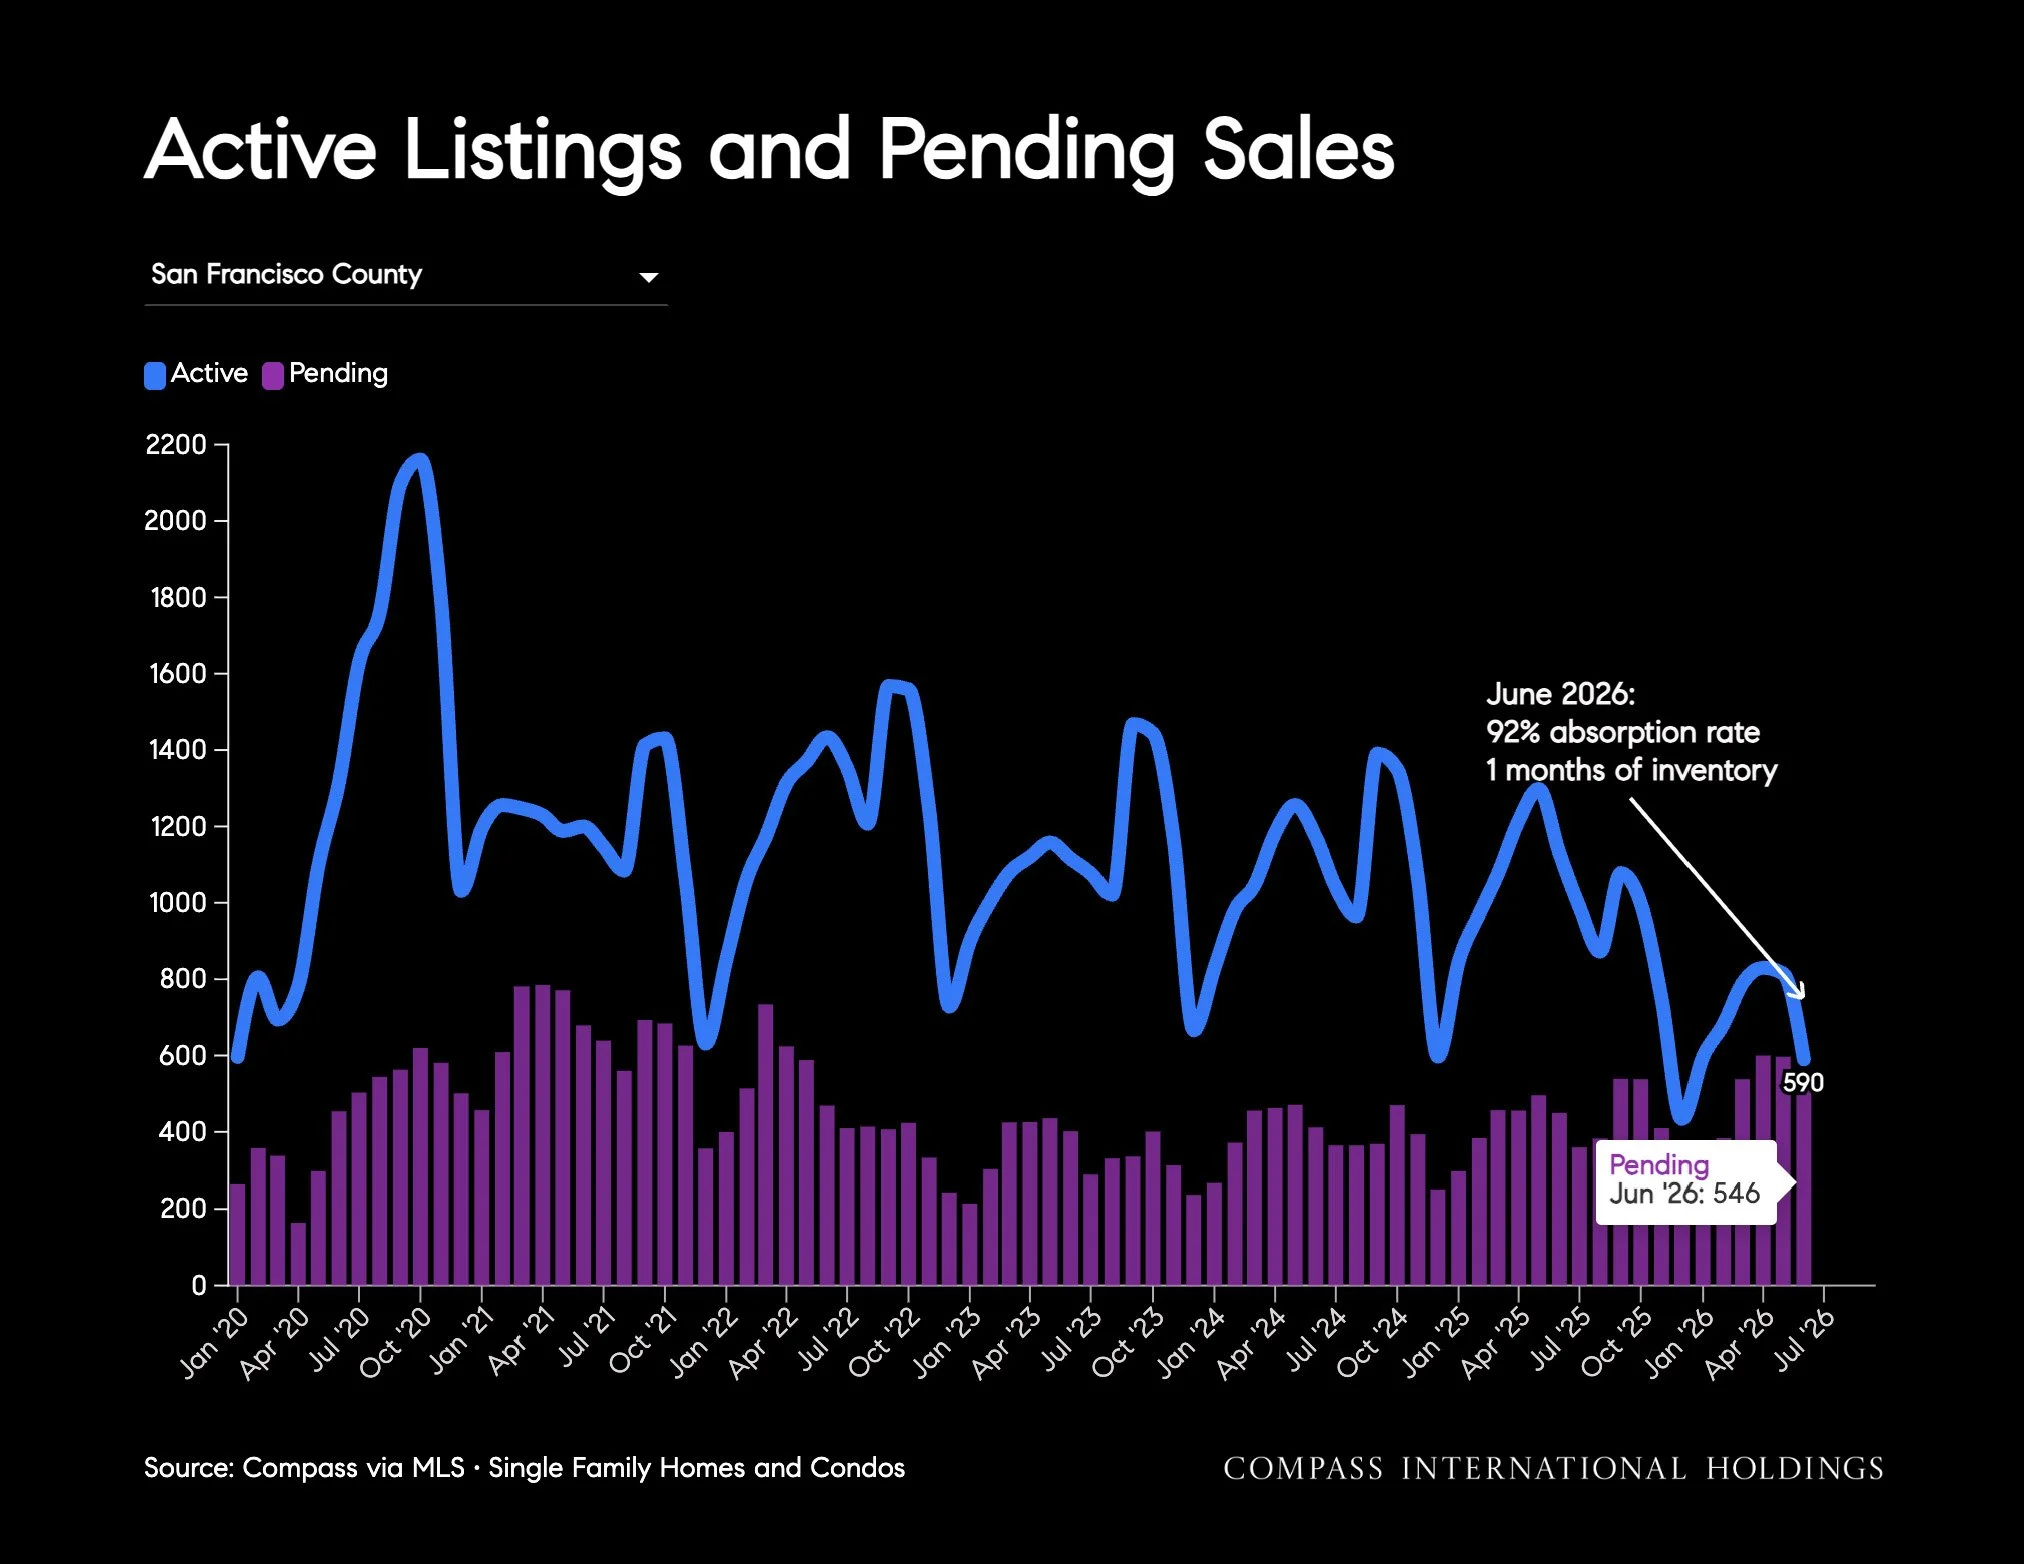
One of the clearest explanations for this appreciation is the severe shortage of available inventory and inflow of money from the Al boom. At the end of June, there were just 590 active listings (single-family homes and condos combined), while 546 properties were under contract. This equates to an absorption rate of approximately 92%, meaning nearly as many homes were pending sale as were actively available. Put another way, the market had just over one month of inventory, which is exceptionally tight supply for this time of year. This is the highest absorption rate and lowest level of inventory that we have observed during the summer market since 2020, underscoring the intensity of buyer competition.
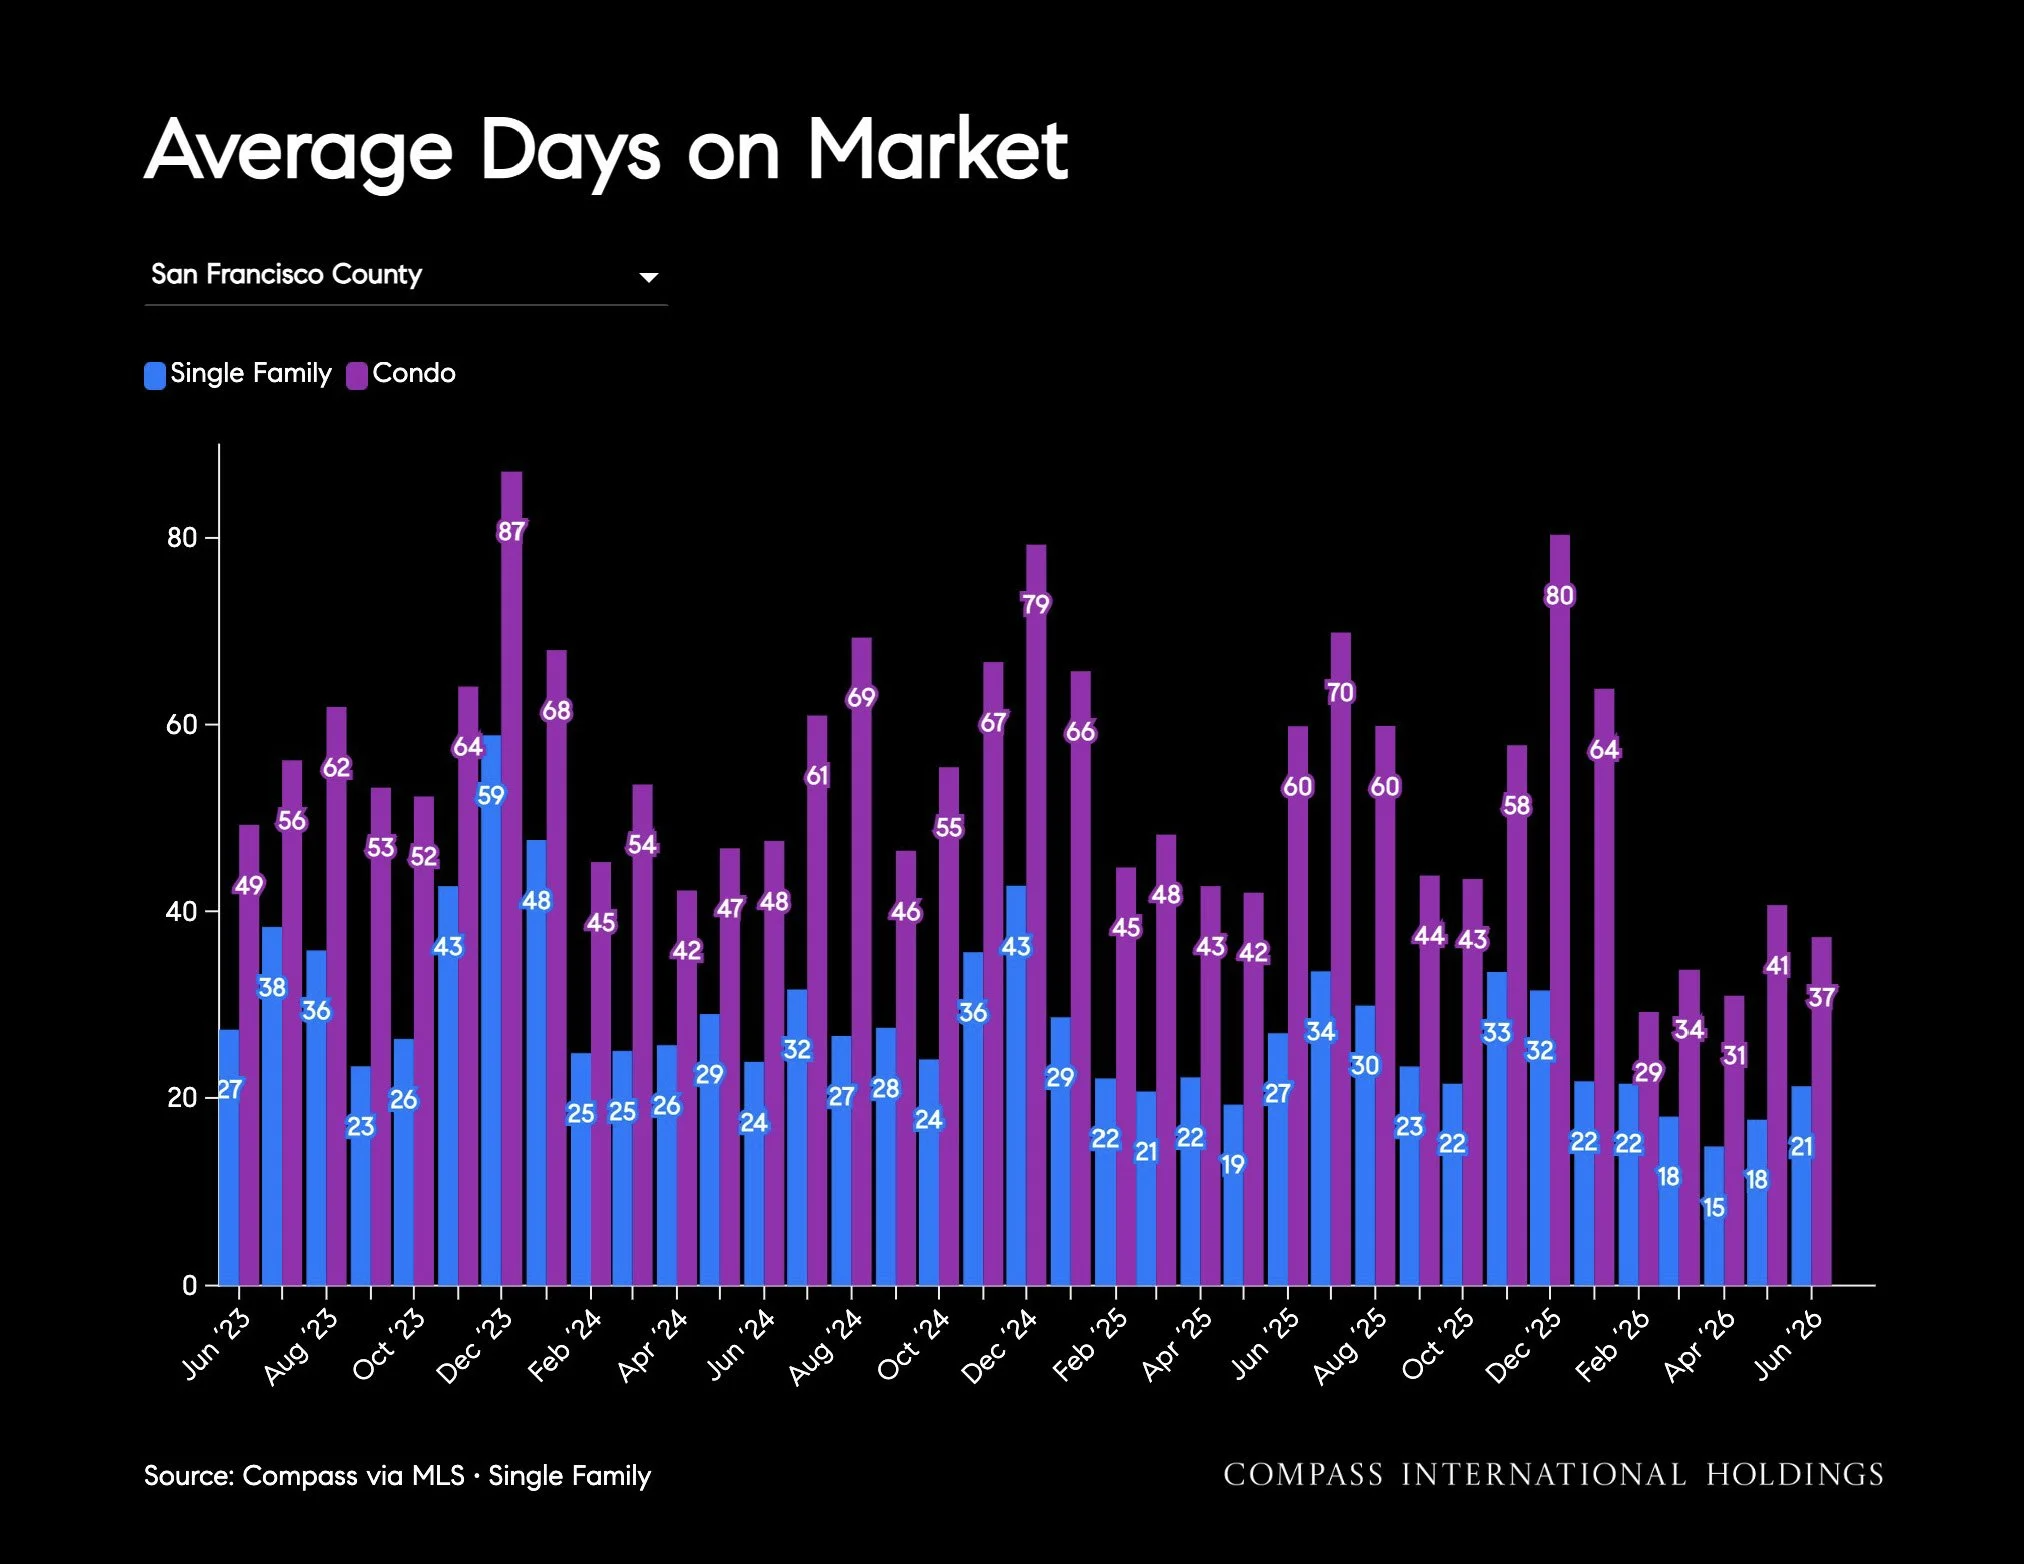
Homes also continue to sell quickly. Single-family homes averaged 21 days on market in June, while condos averaged 37 days. Condo Days on Market improved from 41 days in May and have fallen dramatically from 60 days in June 2025, a 38.3% reduction in time on market. Single-family homes spent slightly longer on the market than in May (21 days versus 18 days), but they continue to sell much faster than last June, when the average was 27 days.
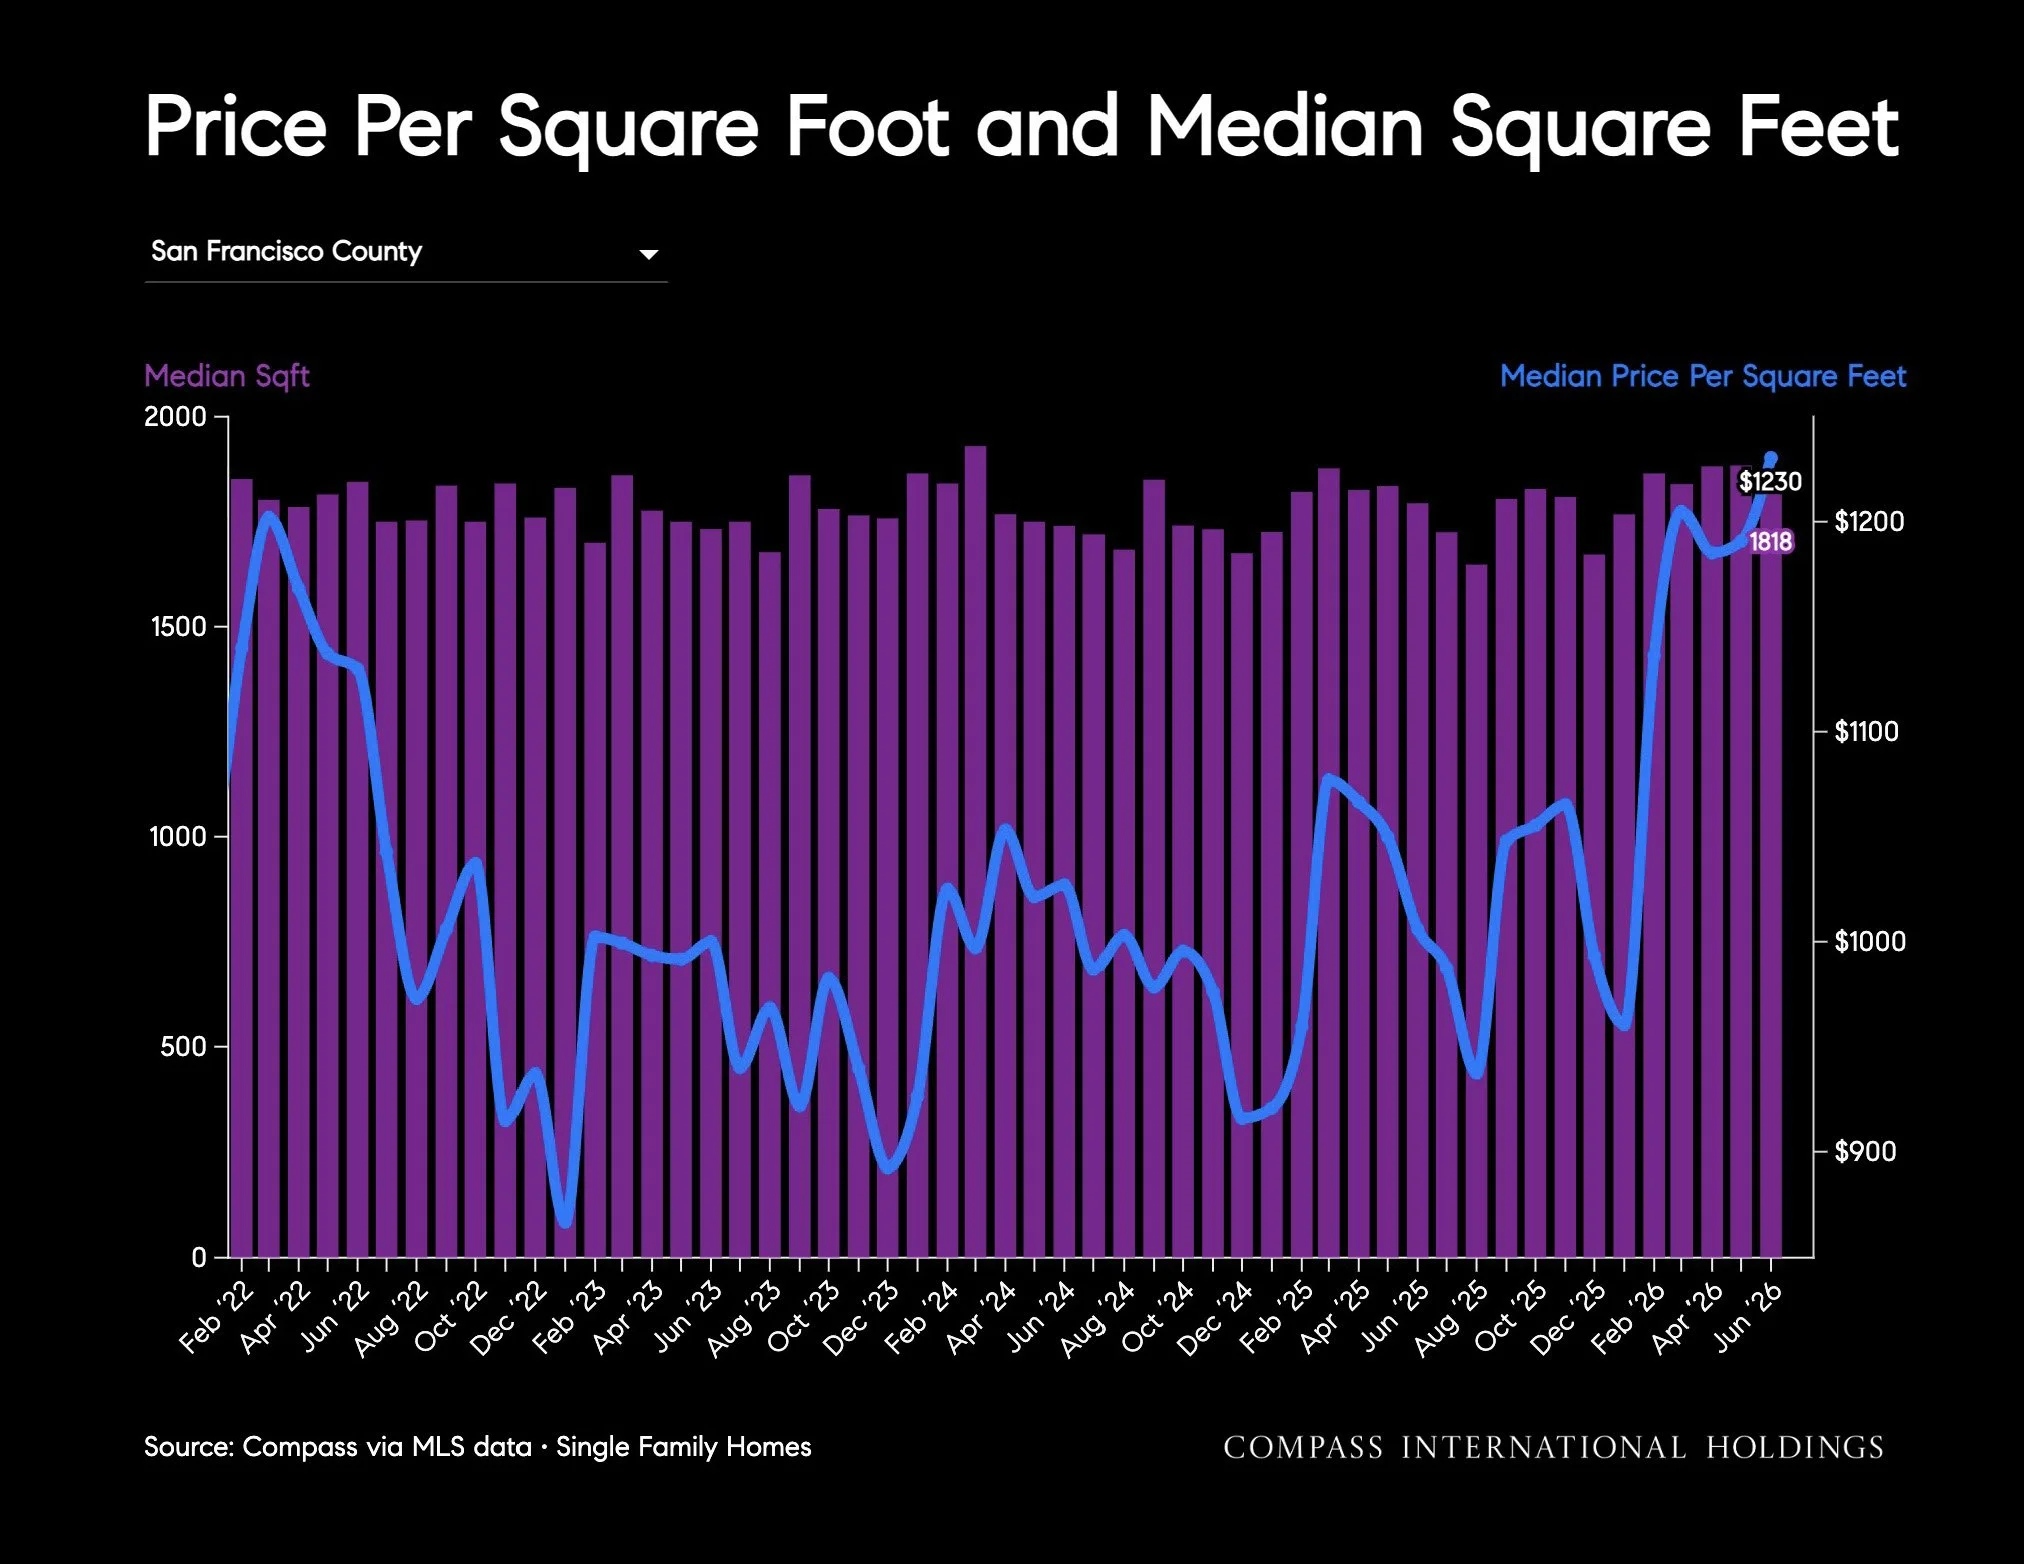
Pricing strength is also evident on a price-per-square-foot basis. The median price per square foot reached $1,230 in June, up 22.3% from $1,006 one year ago. Prices have increased 28% since January, when the median price per square foot was $961. The median size of homes selling has also increased. This suggests that a greater share of larger homes is trading hands, supporting what many agents are reporting in the field: Demand for larger, high-end homes continues to outpace available supply, contributing to what could be described as a "mansion shortage."
Home Price Change vs 2025
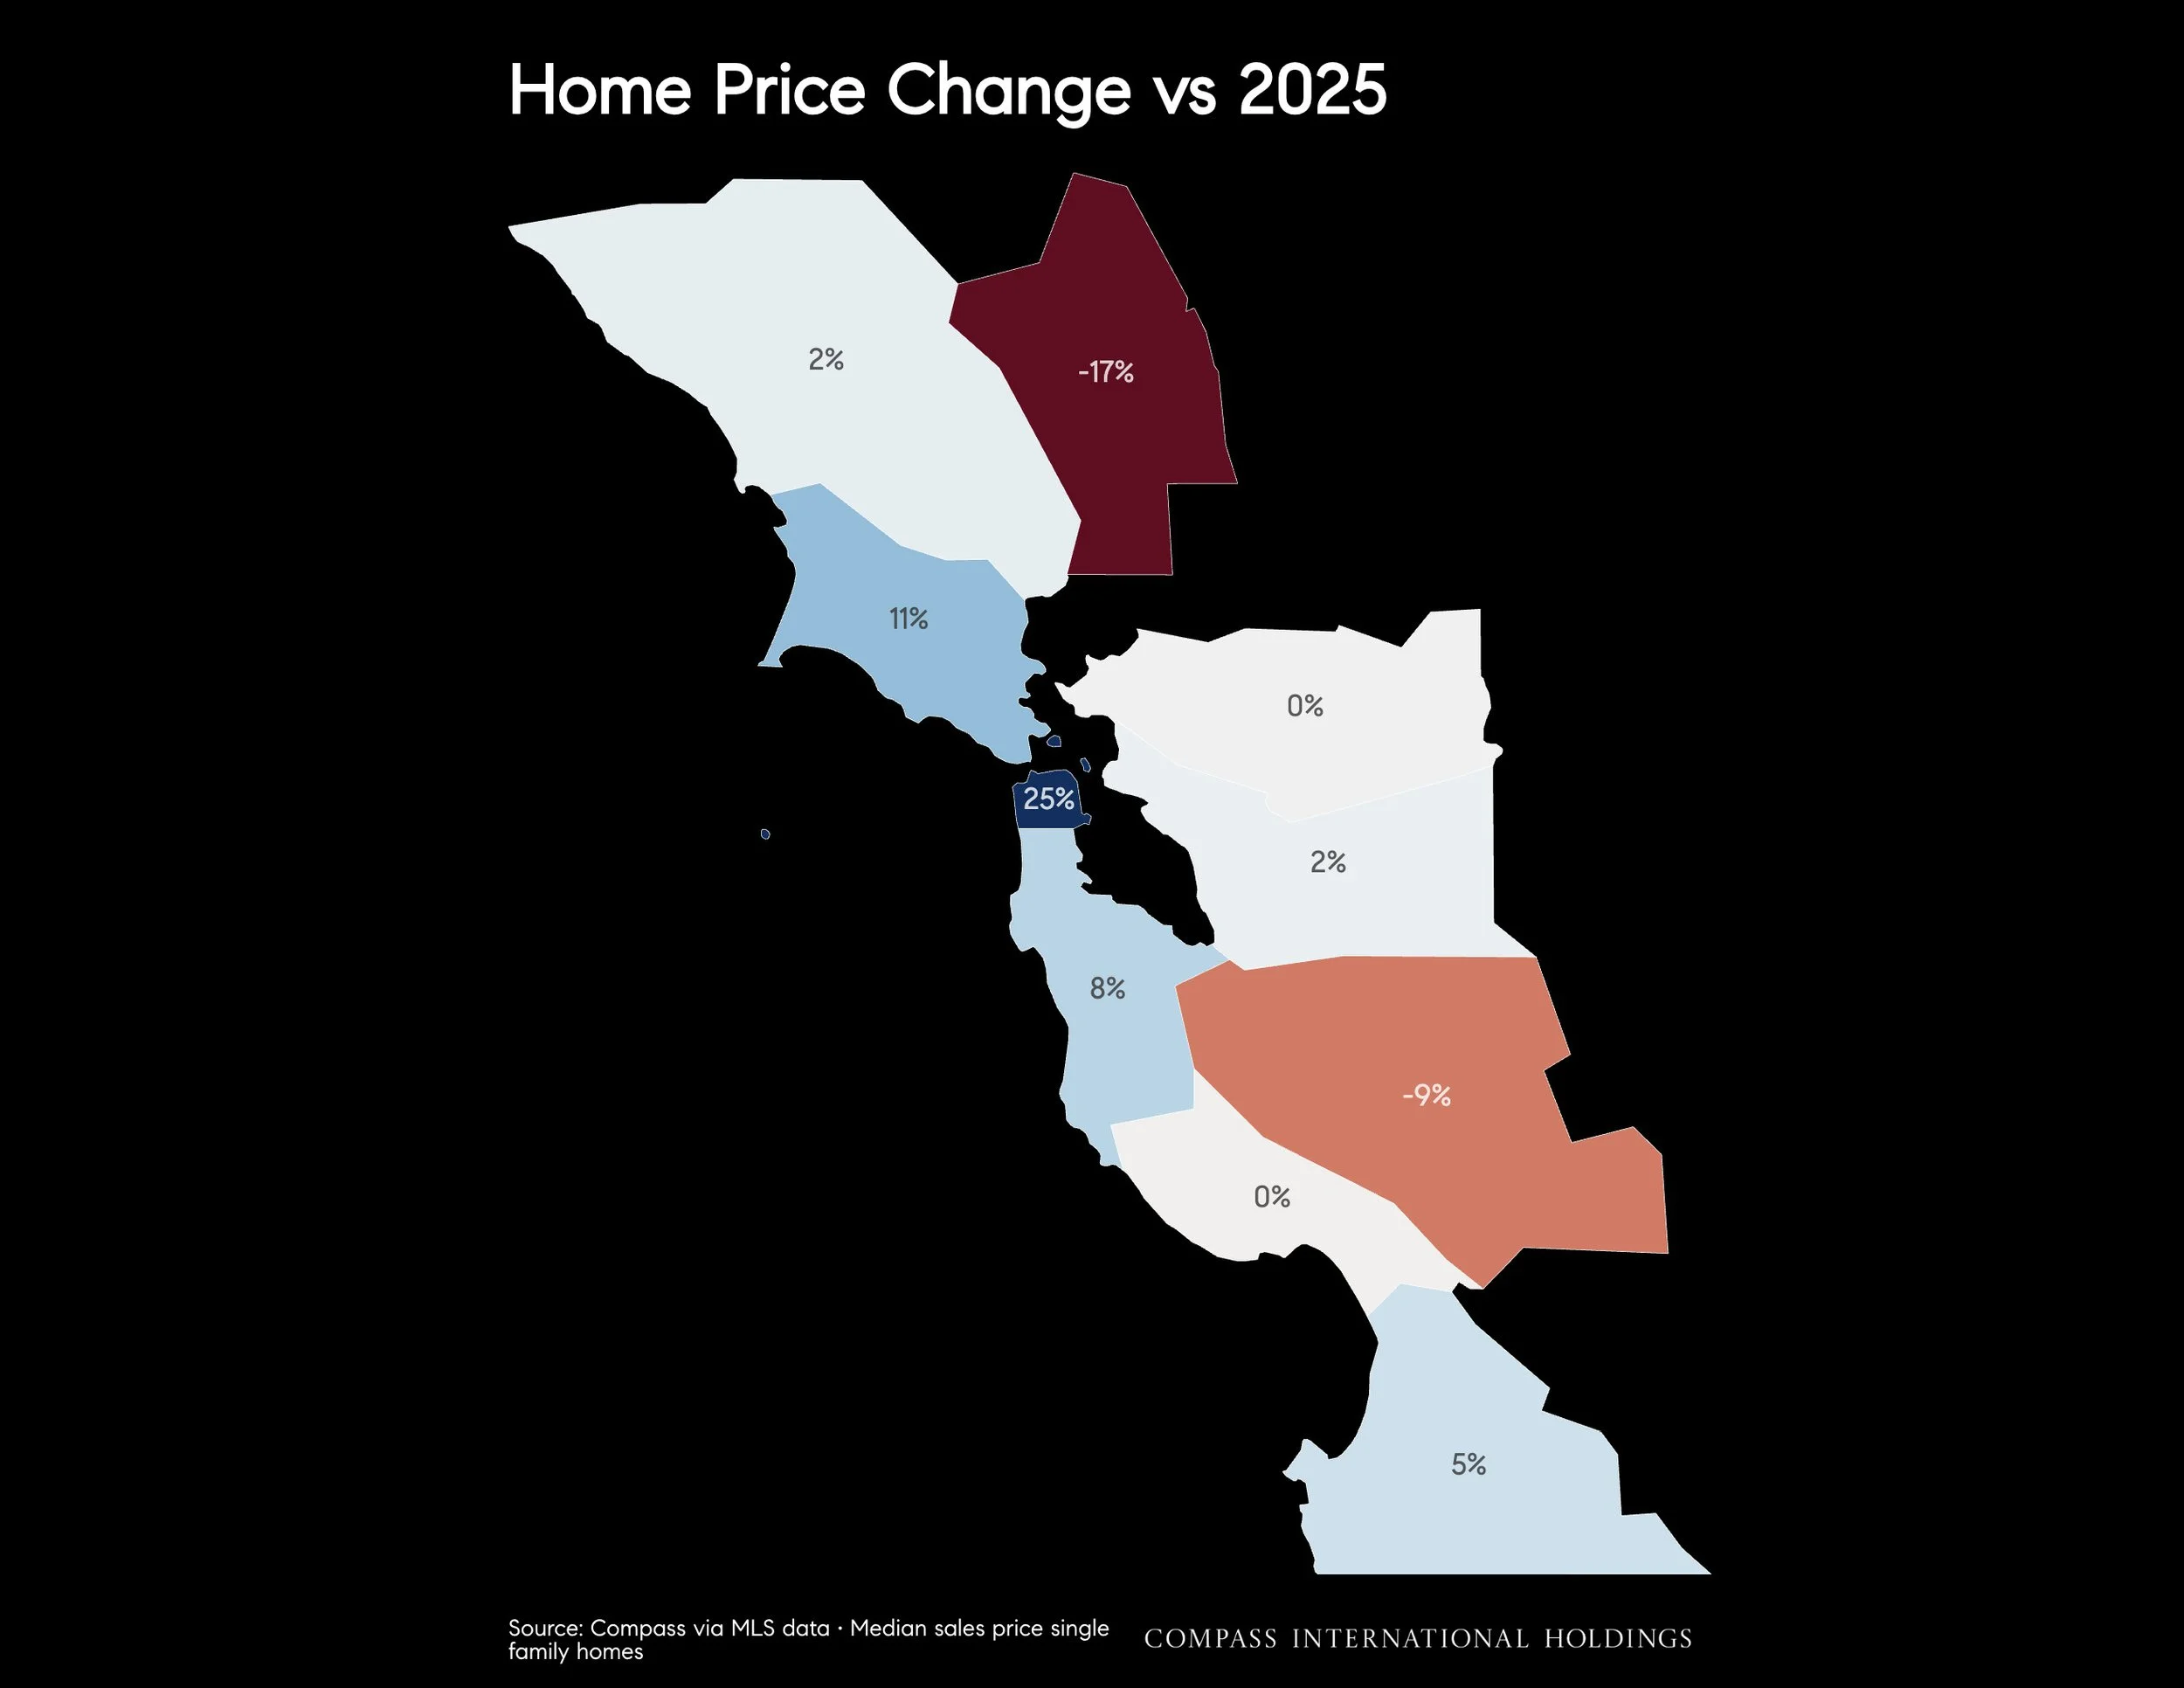
Source: Compass via MLS data • Median sales price single family homes
Home Price Changes Over Time
Median sales prices in Santa Clara have decreased by 9.3% compared to this same time last year.
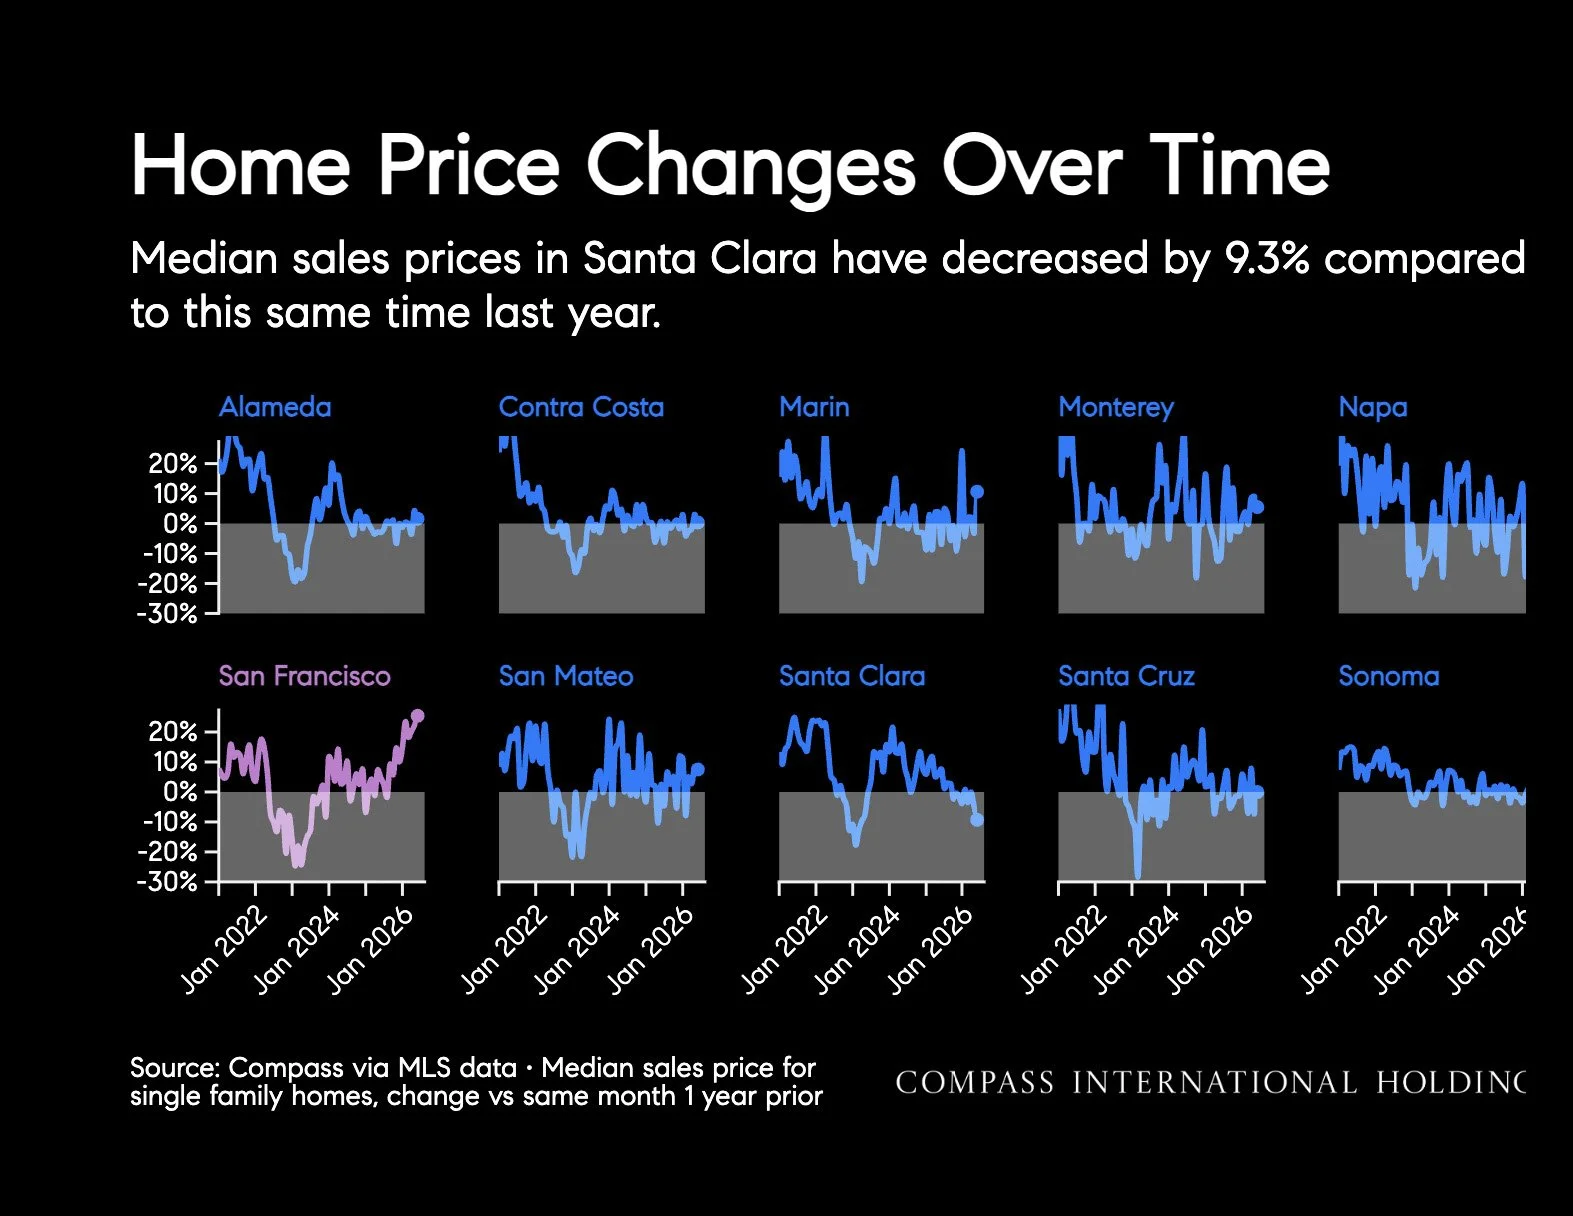
Source: Compass via MLS data • Median sales price for single family homes, change vs same month 1 year prior
Median Sale Price: Single Family Homes
Single family homes
Source: Compass via MLS • Single Family
Closed Sales: Single Family Homes
Single family homes
Source: Compass via MLS • Single Family
Active Listings and Pending Sales
Source: Compass via MLS • Single Family Homes and Condos
Median Price Year Over Year Change
Source: Compass via MLS
Price Per Square Foot and Median Square Feet
Source: Compass via MLS data • Single Family Homes
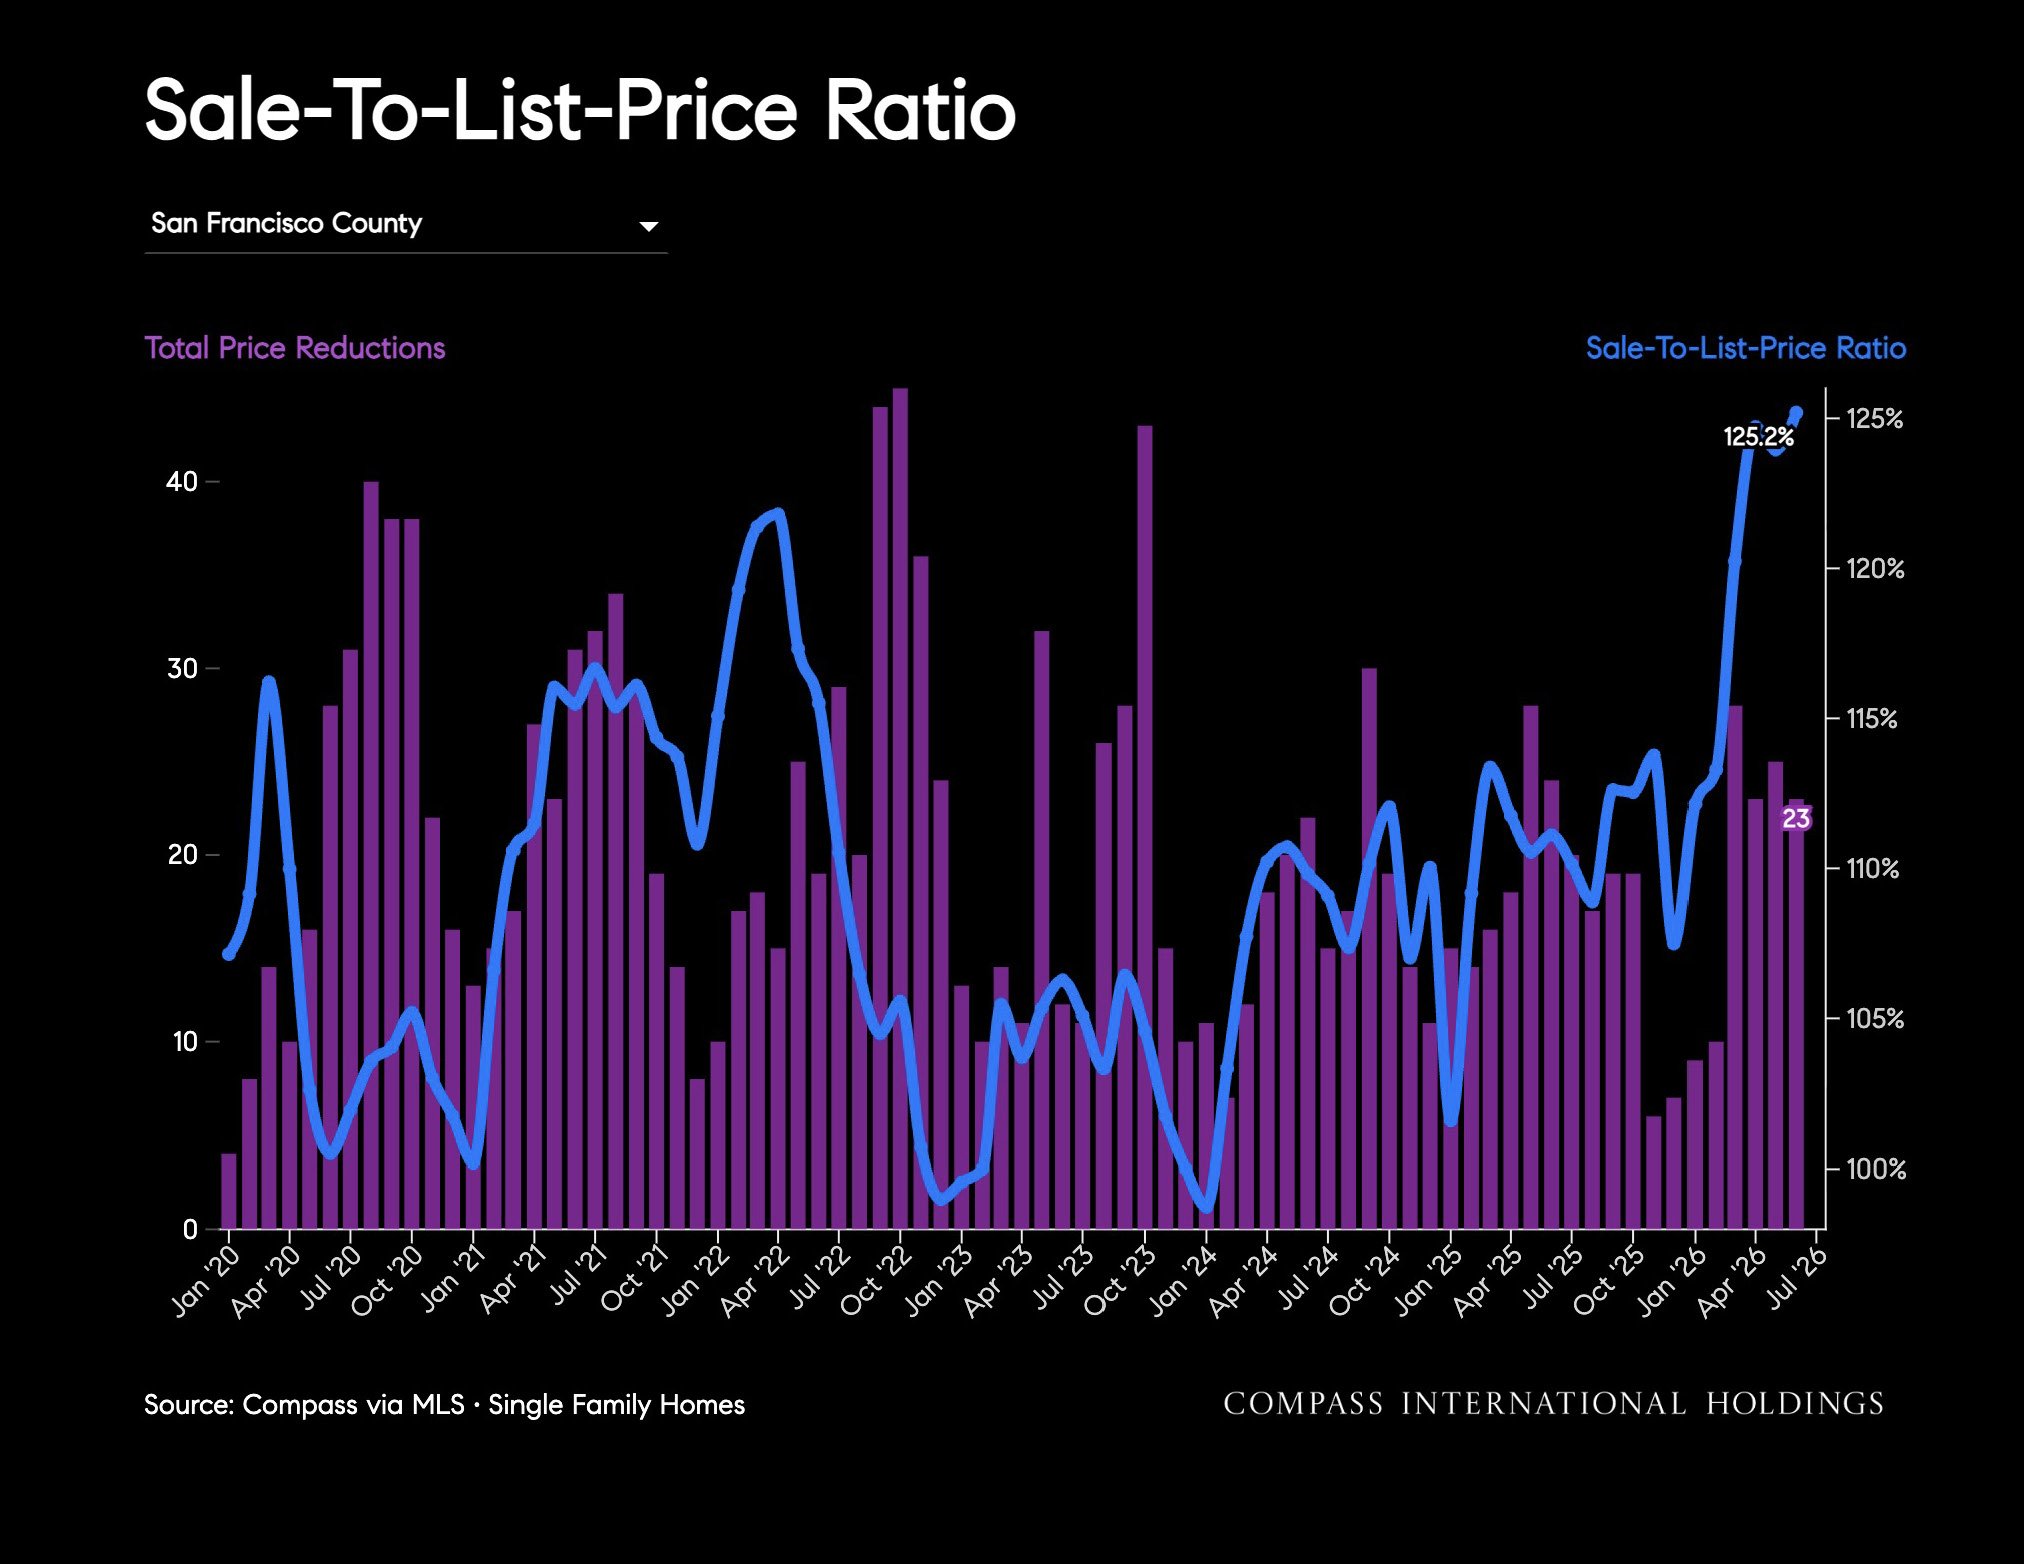
Sale-To-List-Price Ratio
Source: Compass via MLS • Single Family Homes
Average Days on Market
Source: Compass via MLS • Single Family
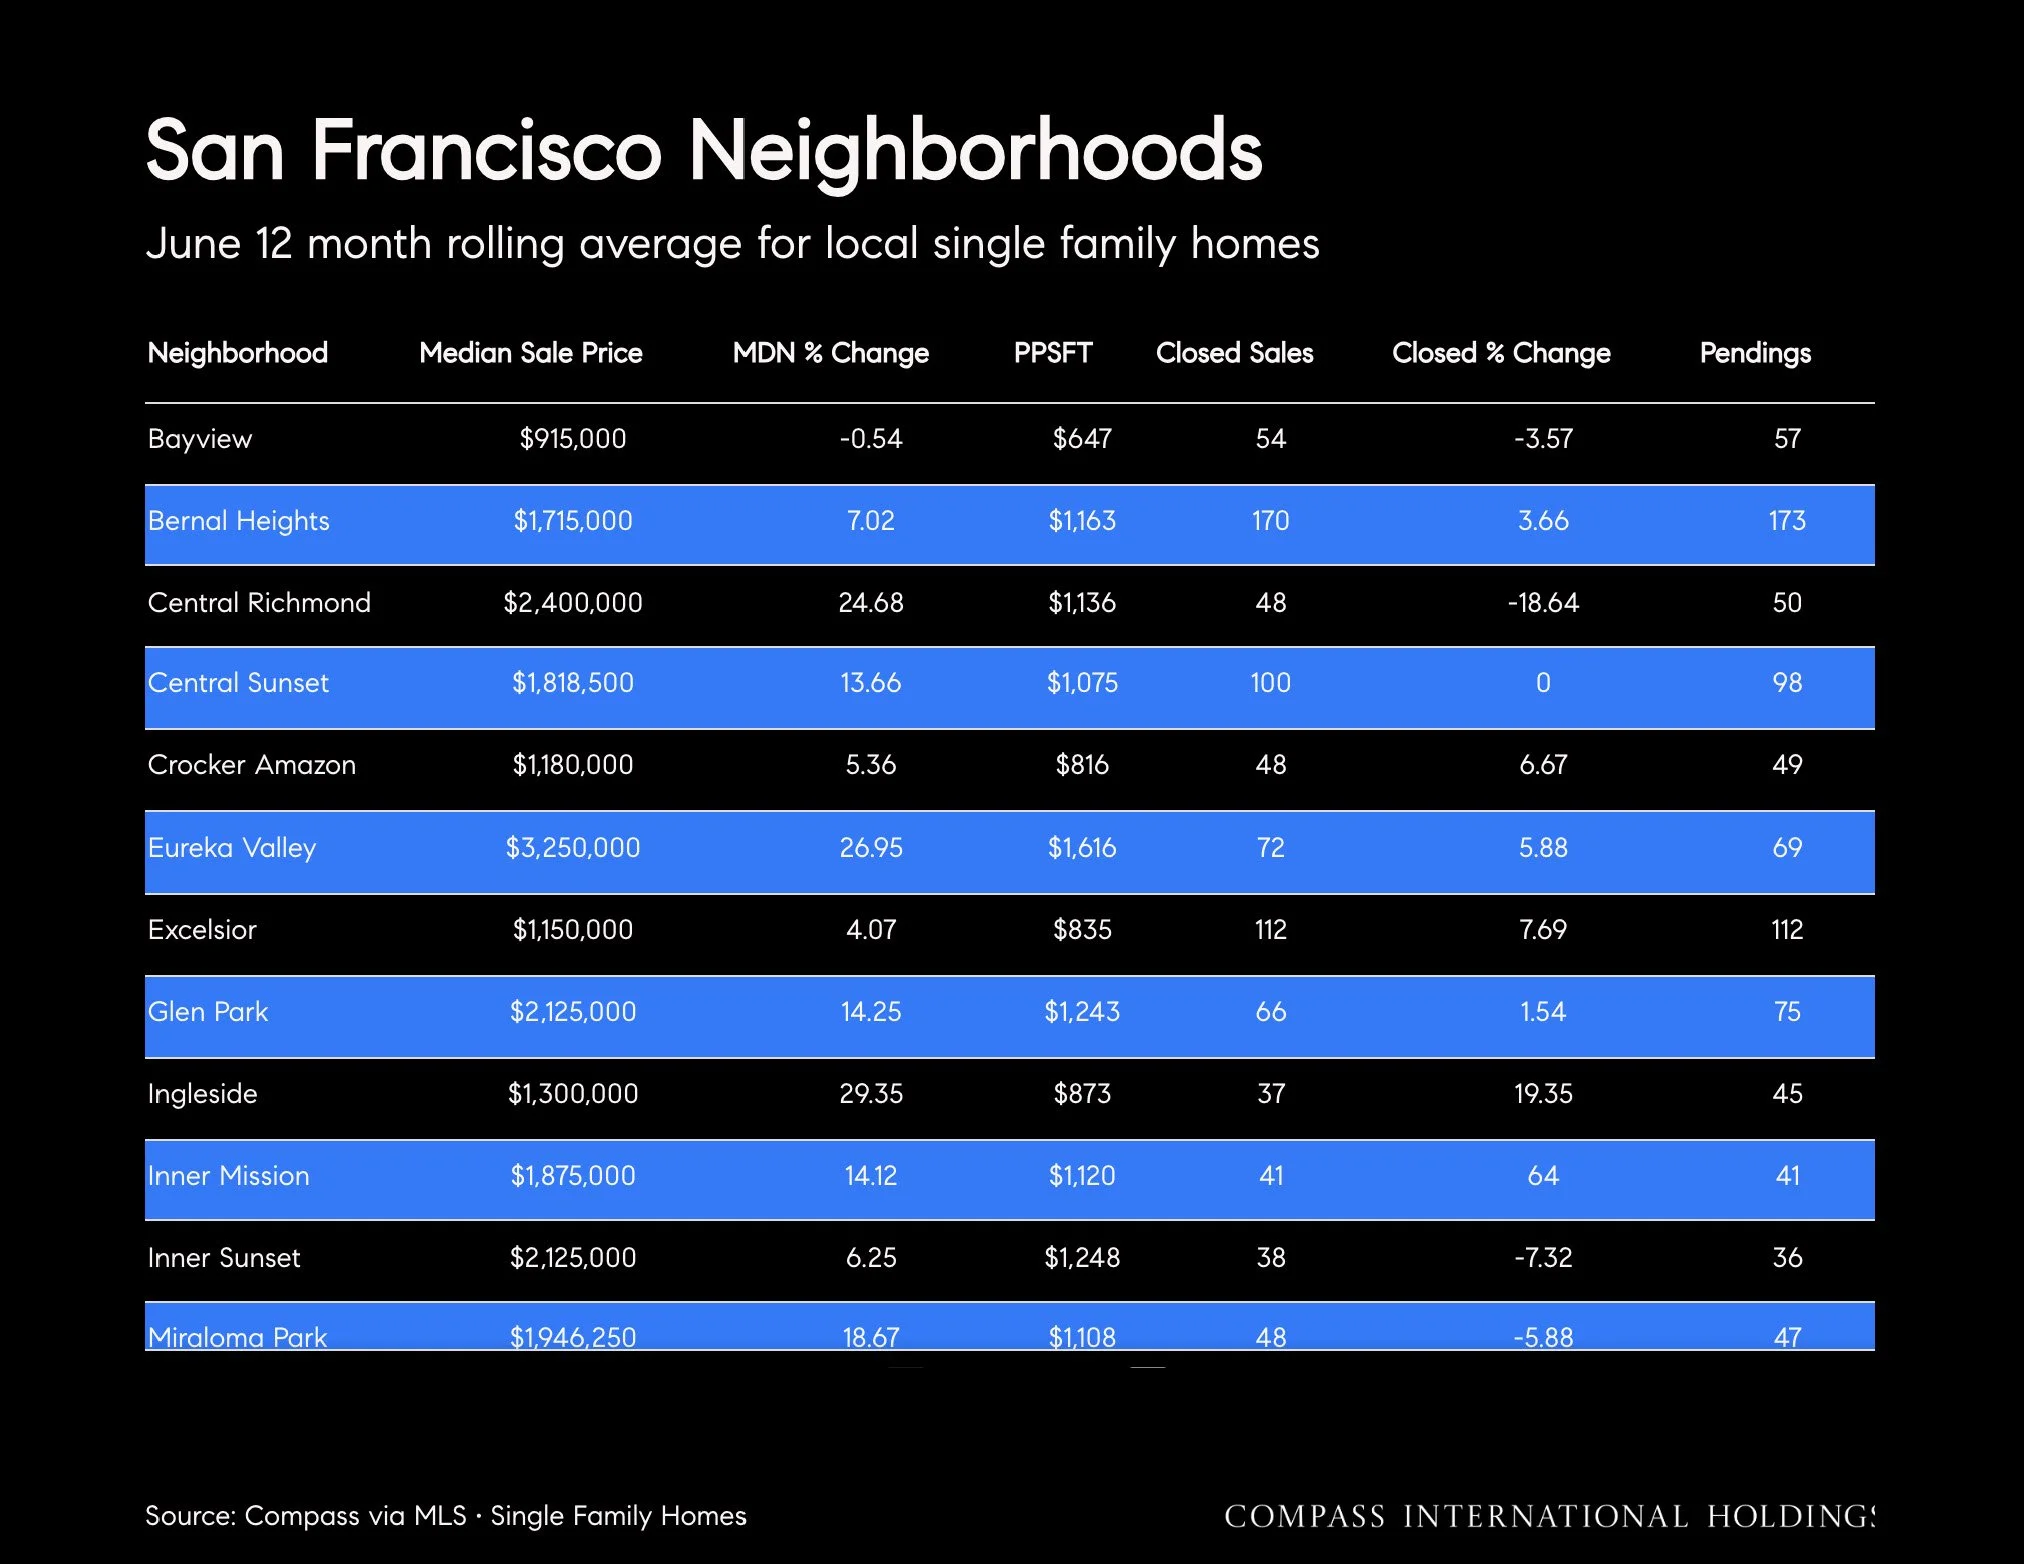
San Francisco Neighborhoods
June 12 month rolling average for local single family homes
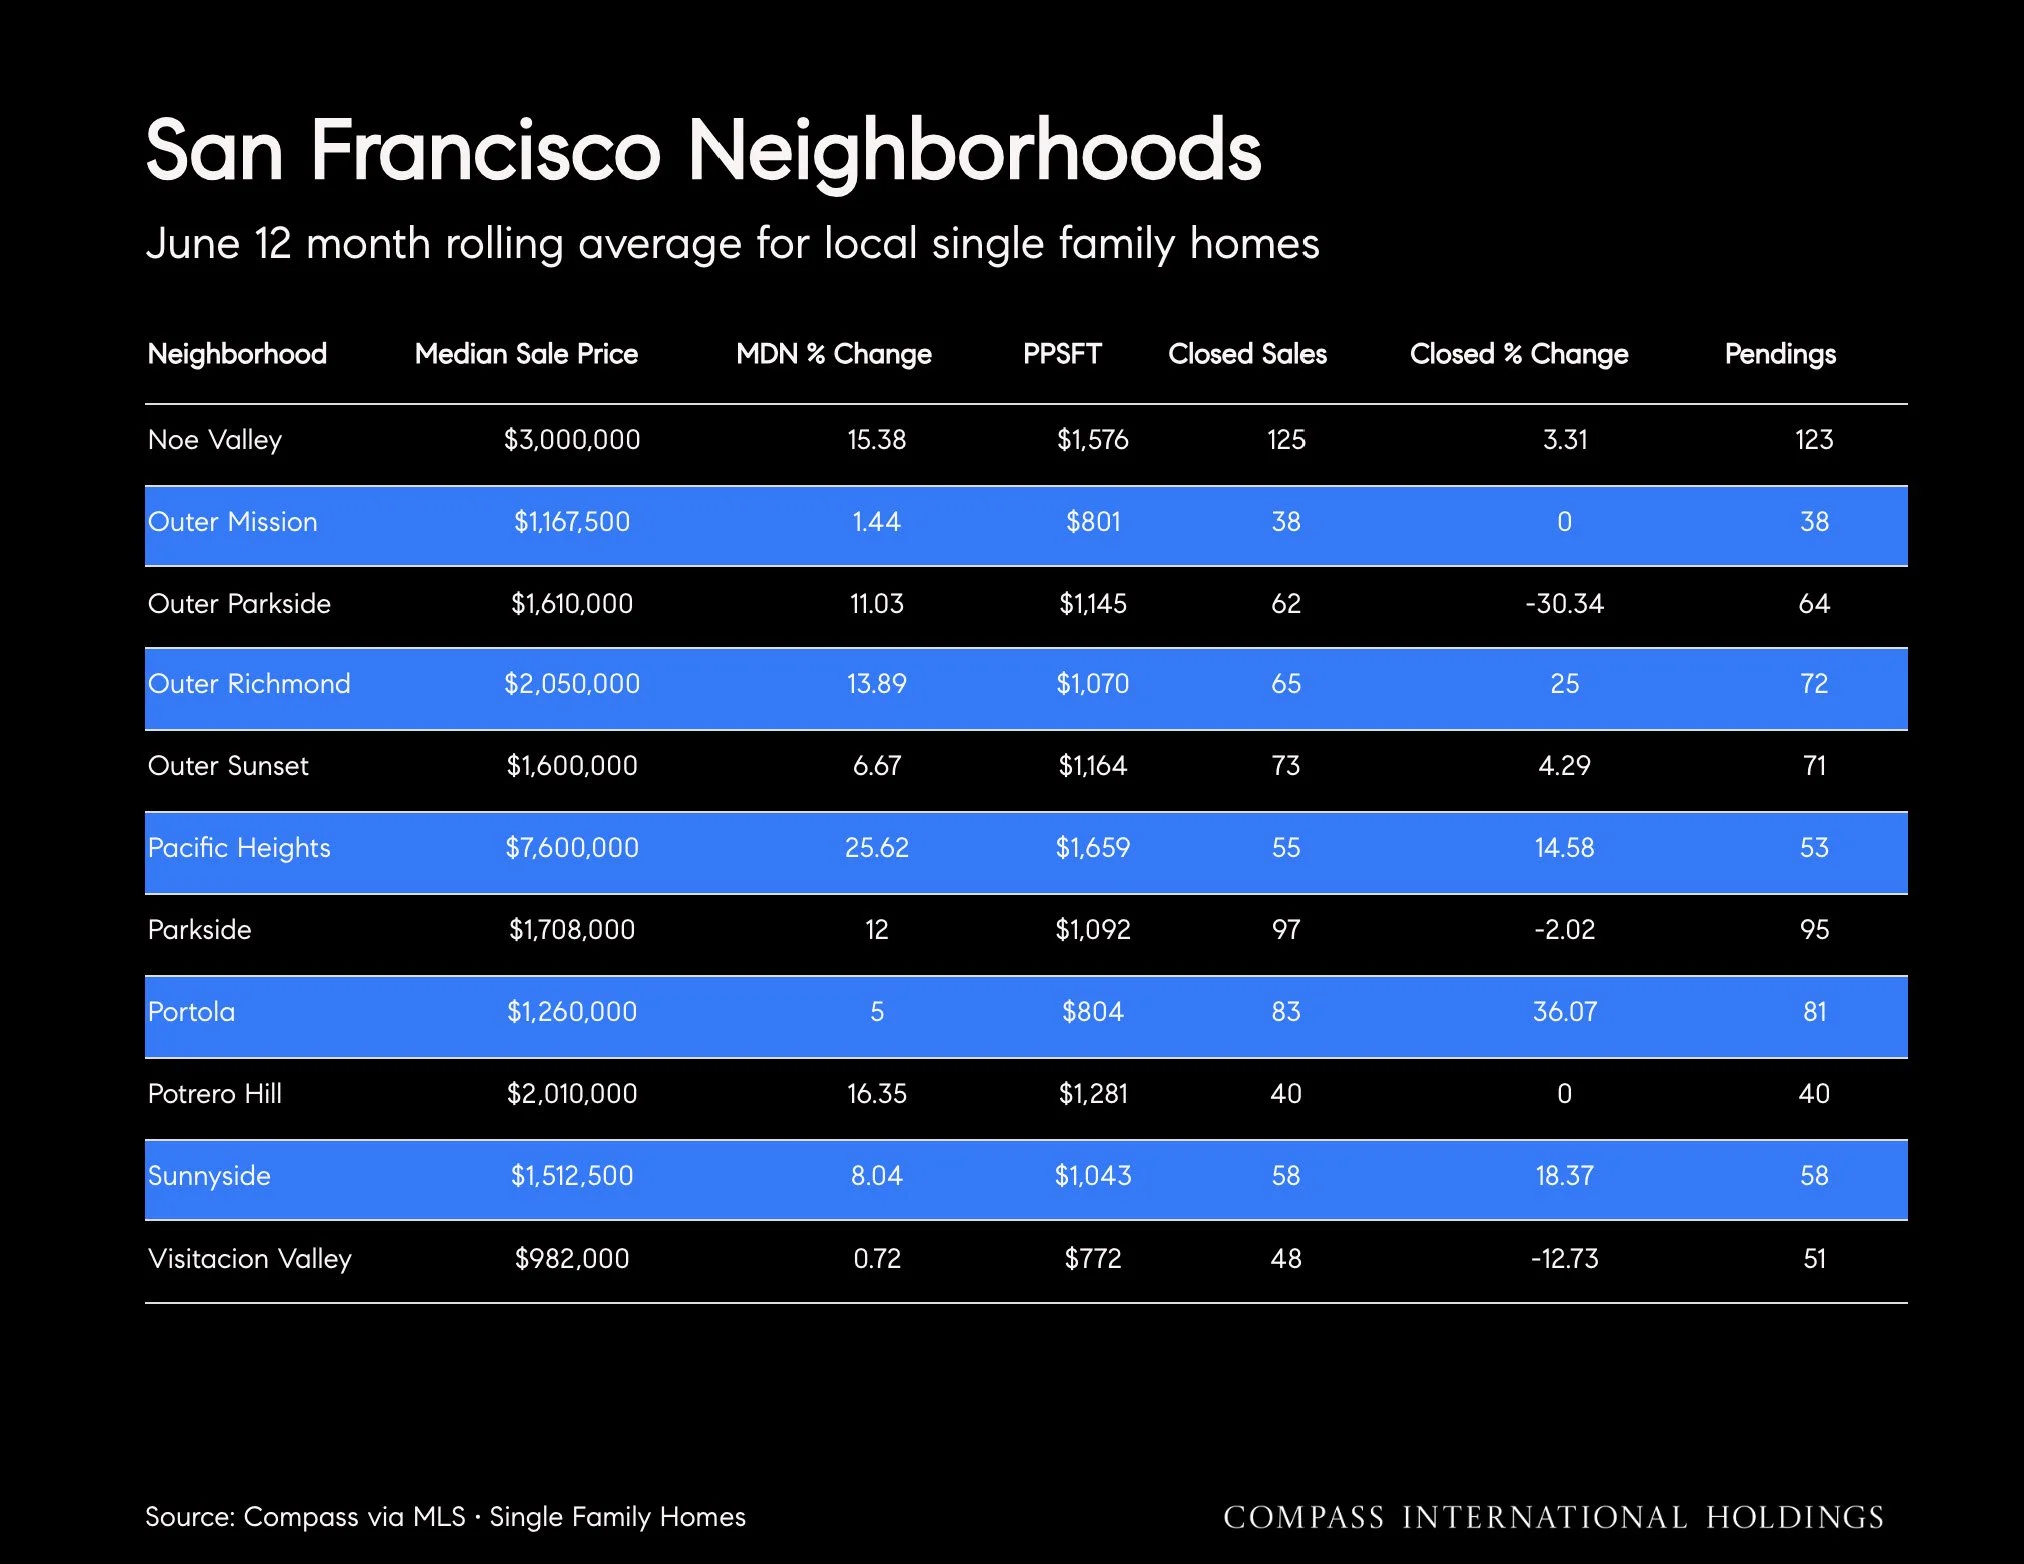
Source: Compass via MLS • Single Family Homes
Close Sales: Condos
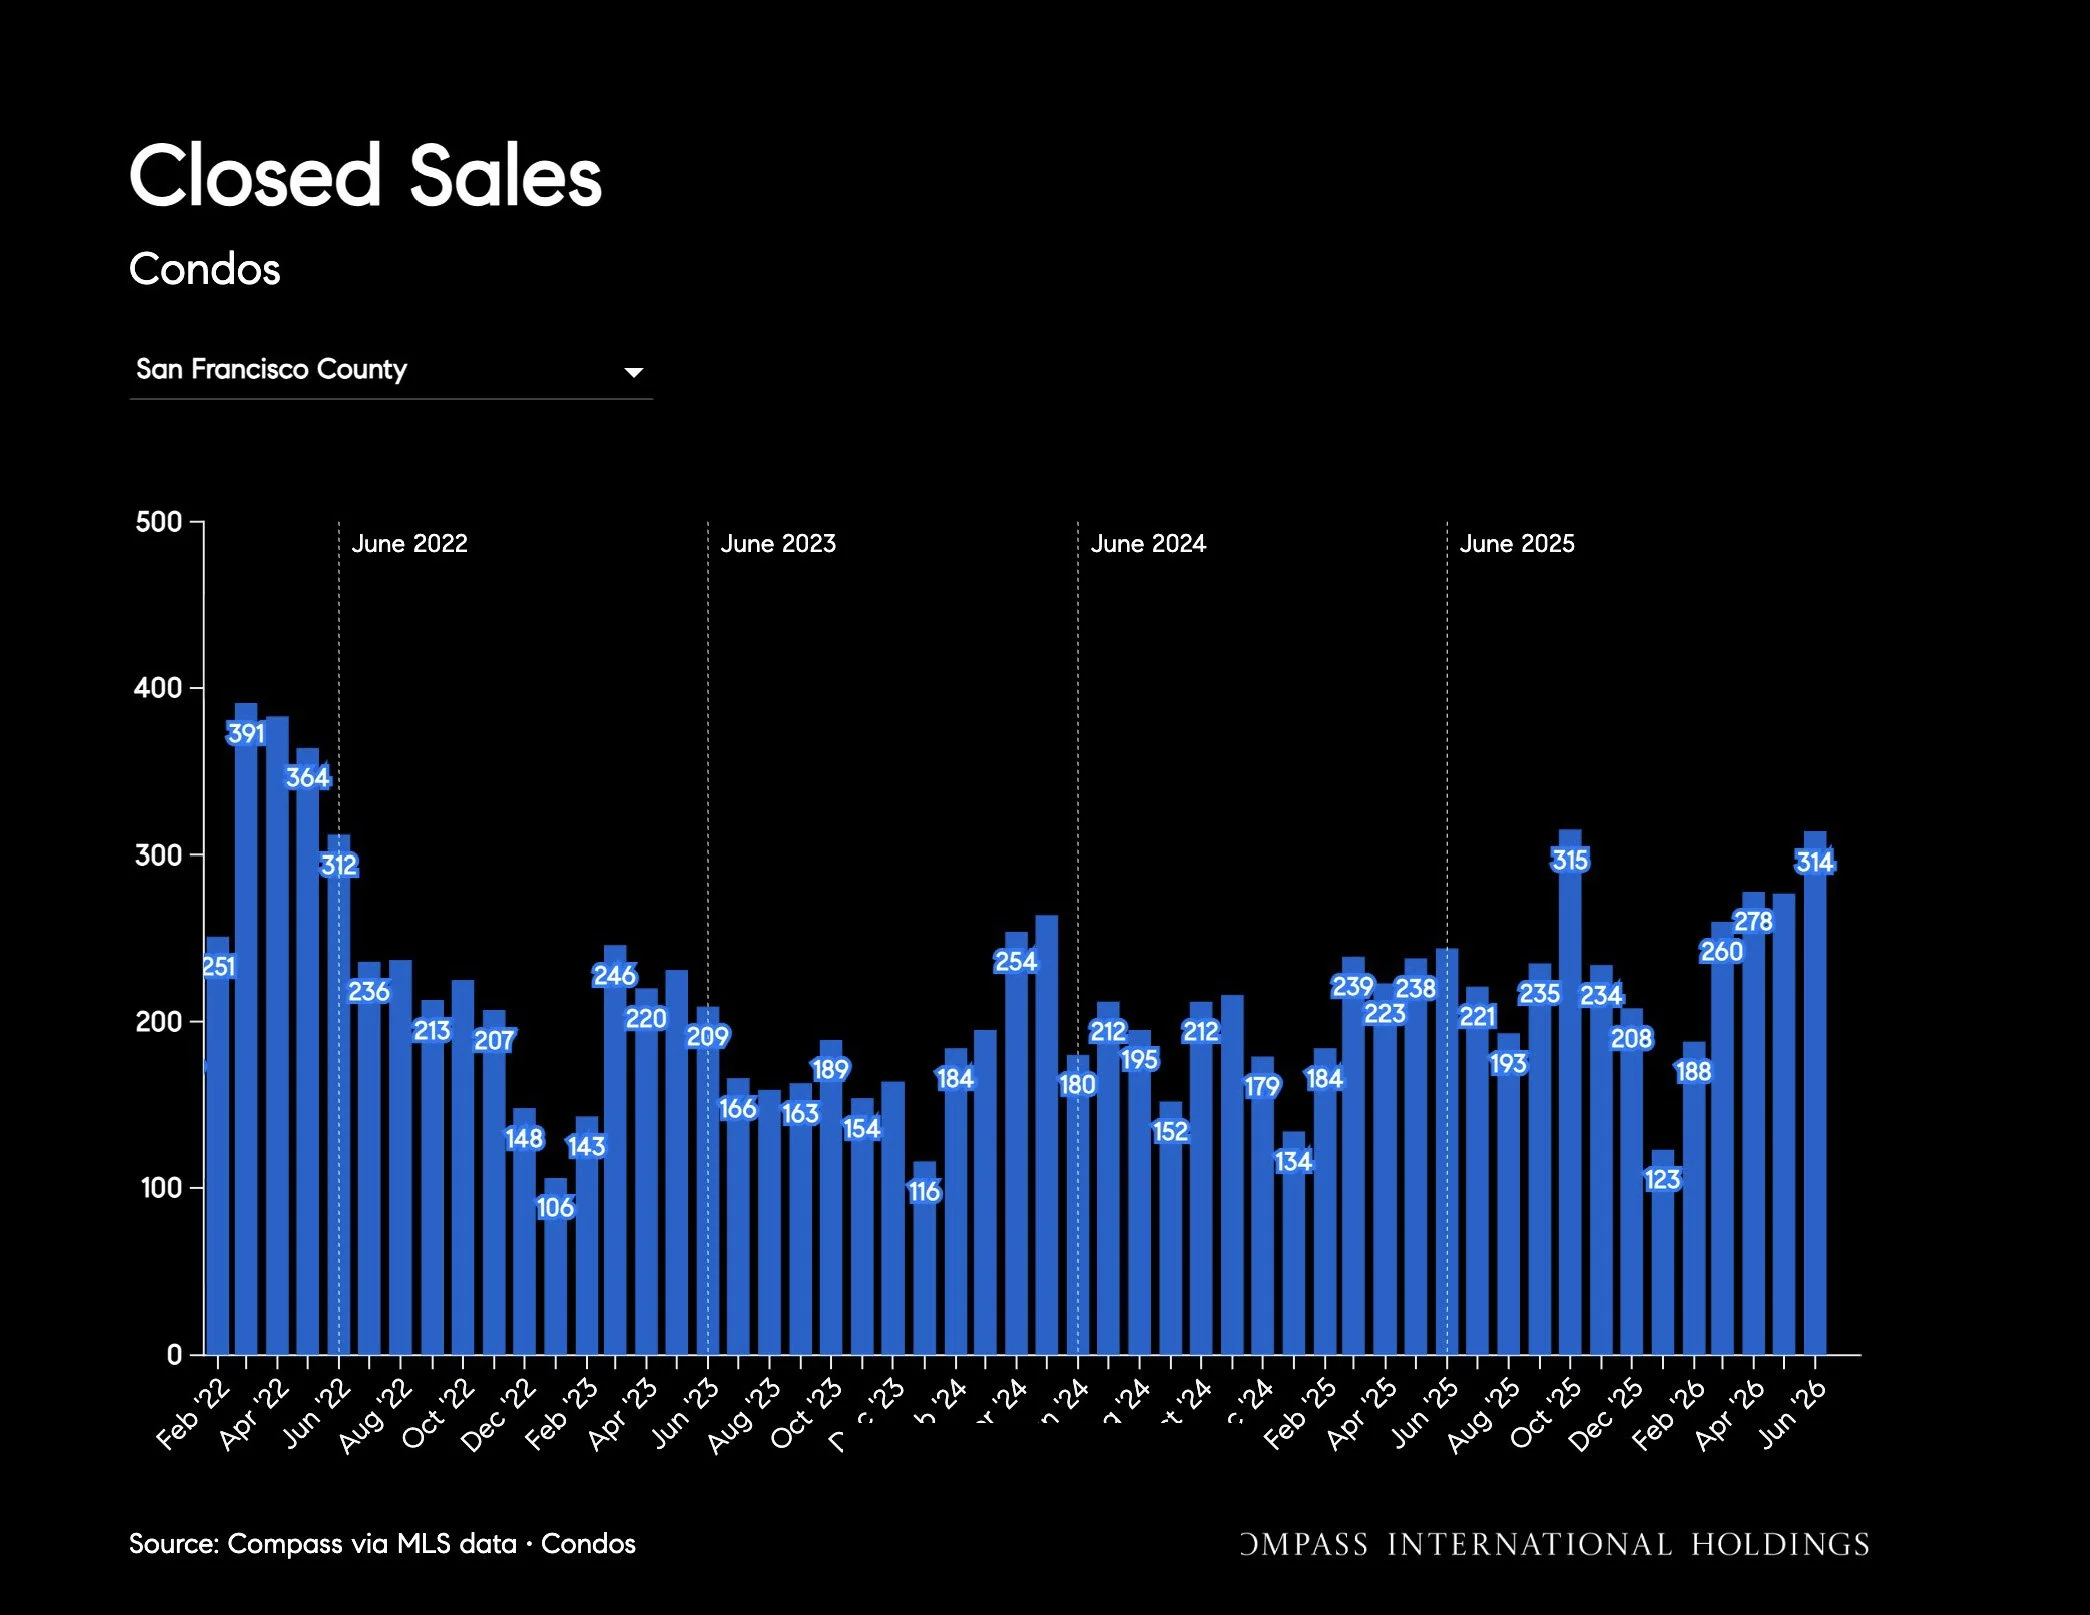
Source: Compass via MLS data • Condos
Median Sale Price: Condos
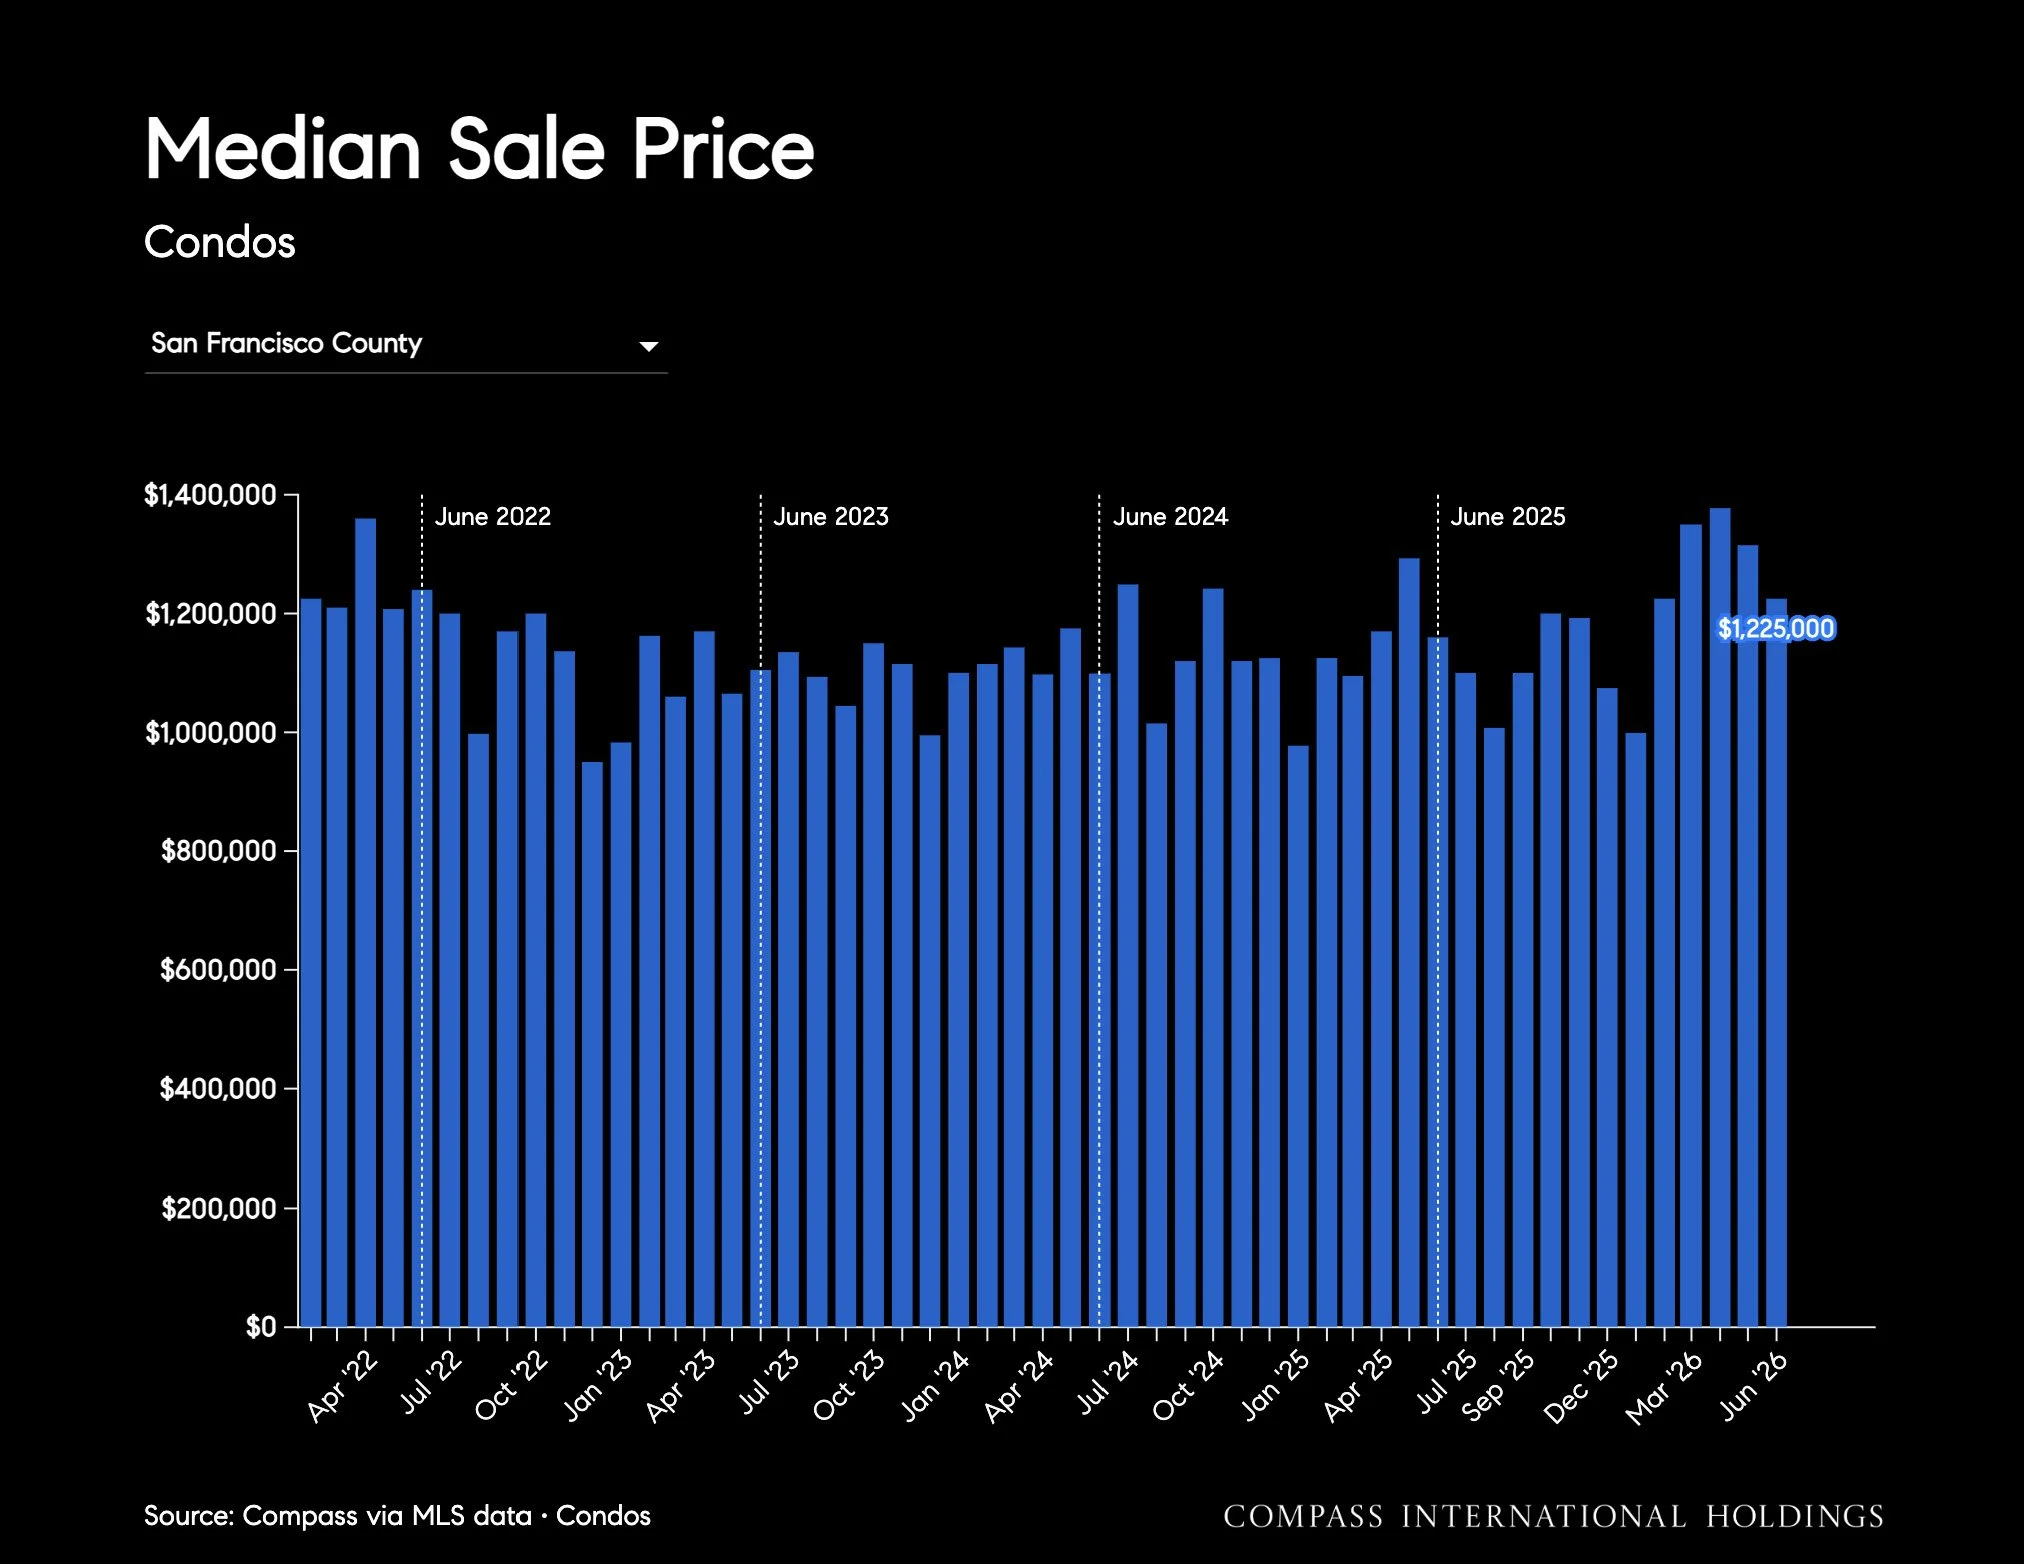
Source: Compass via MLS data • Condos
Price Per Square Foot and Median Square Feet: Condos
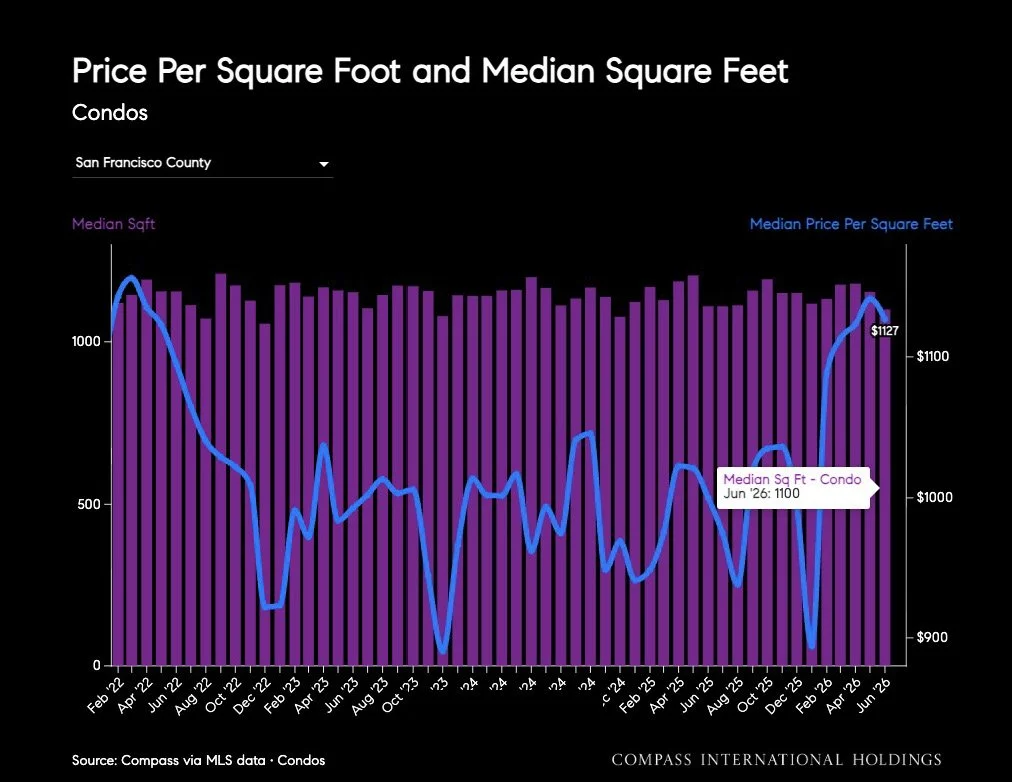
Source: Compass via MLS data • Condos
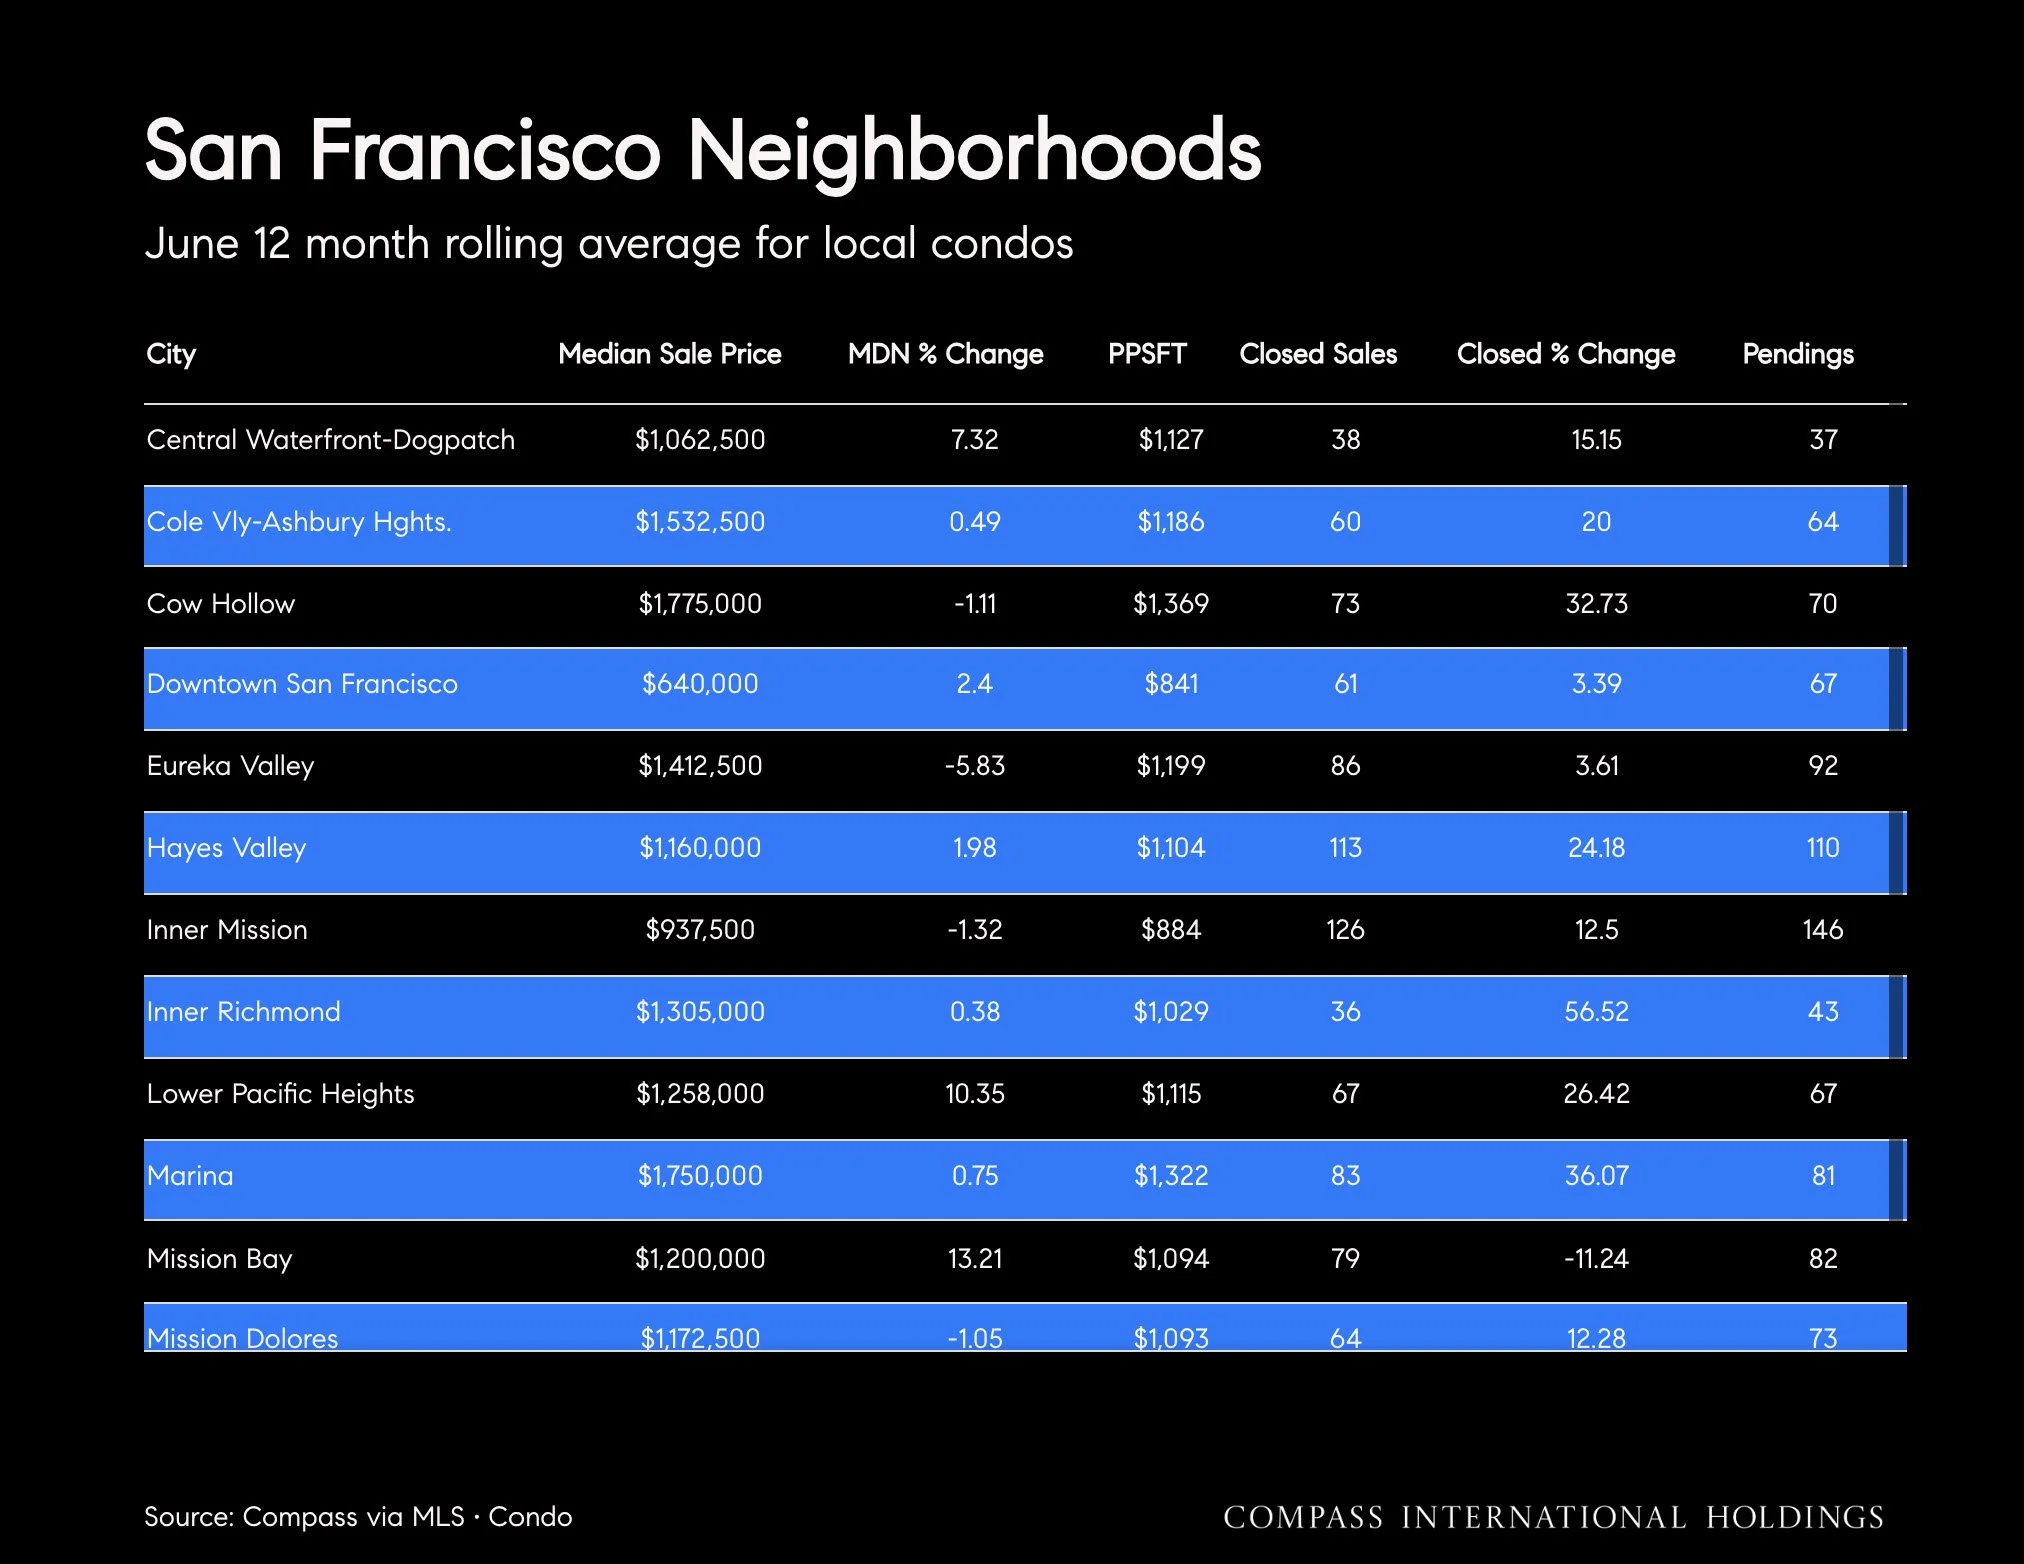
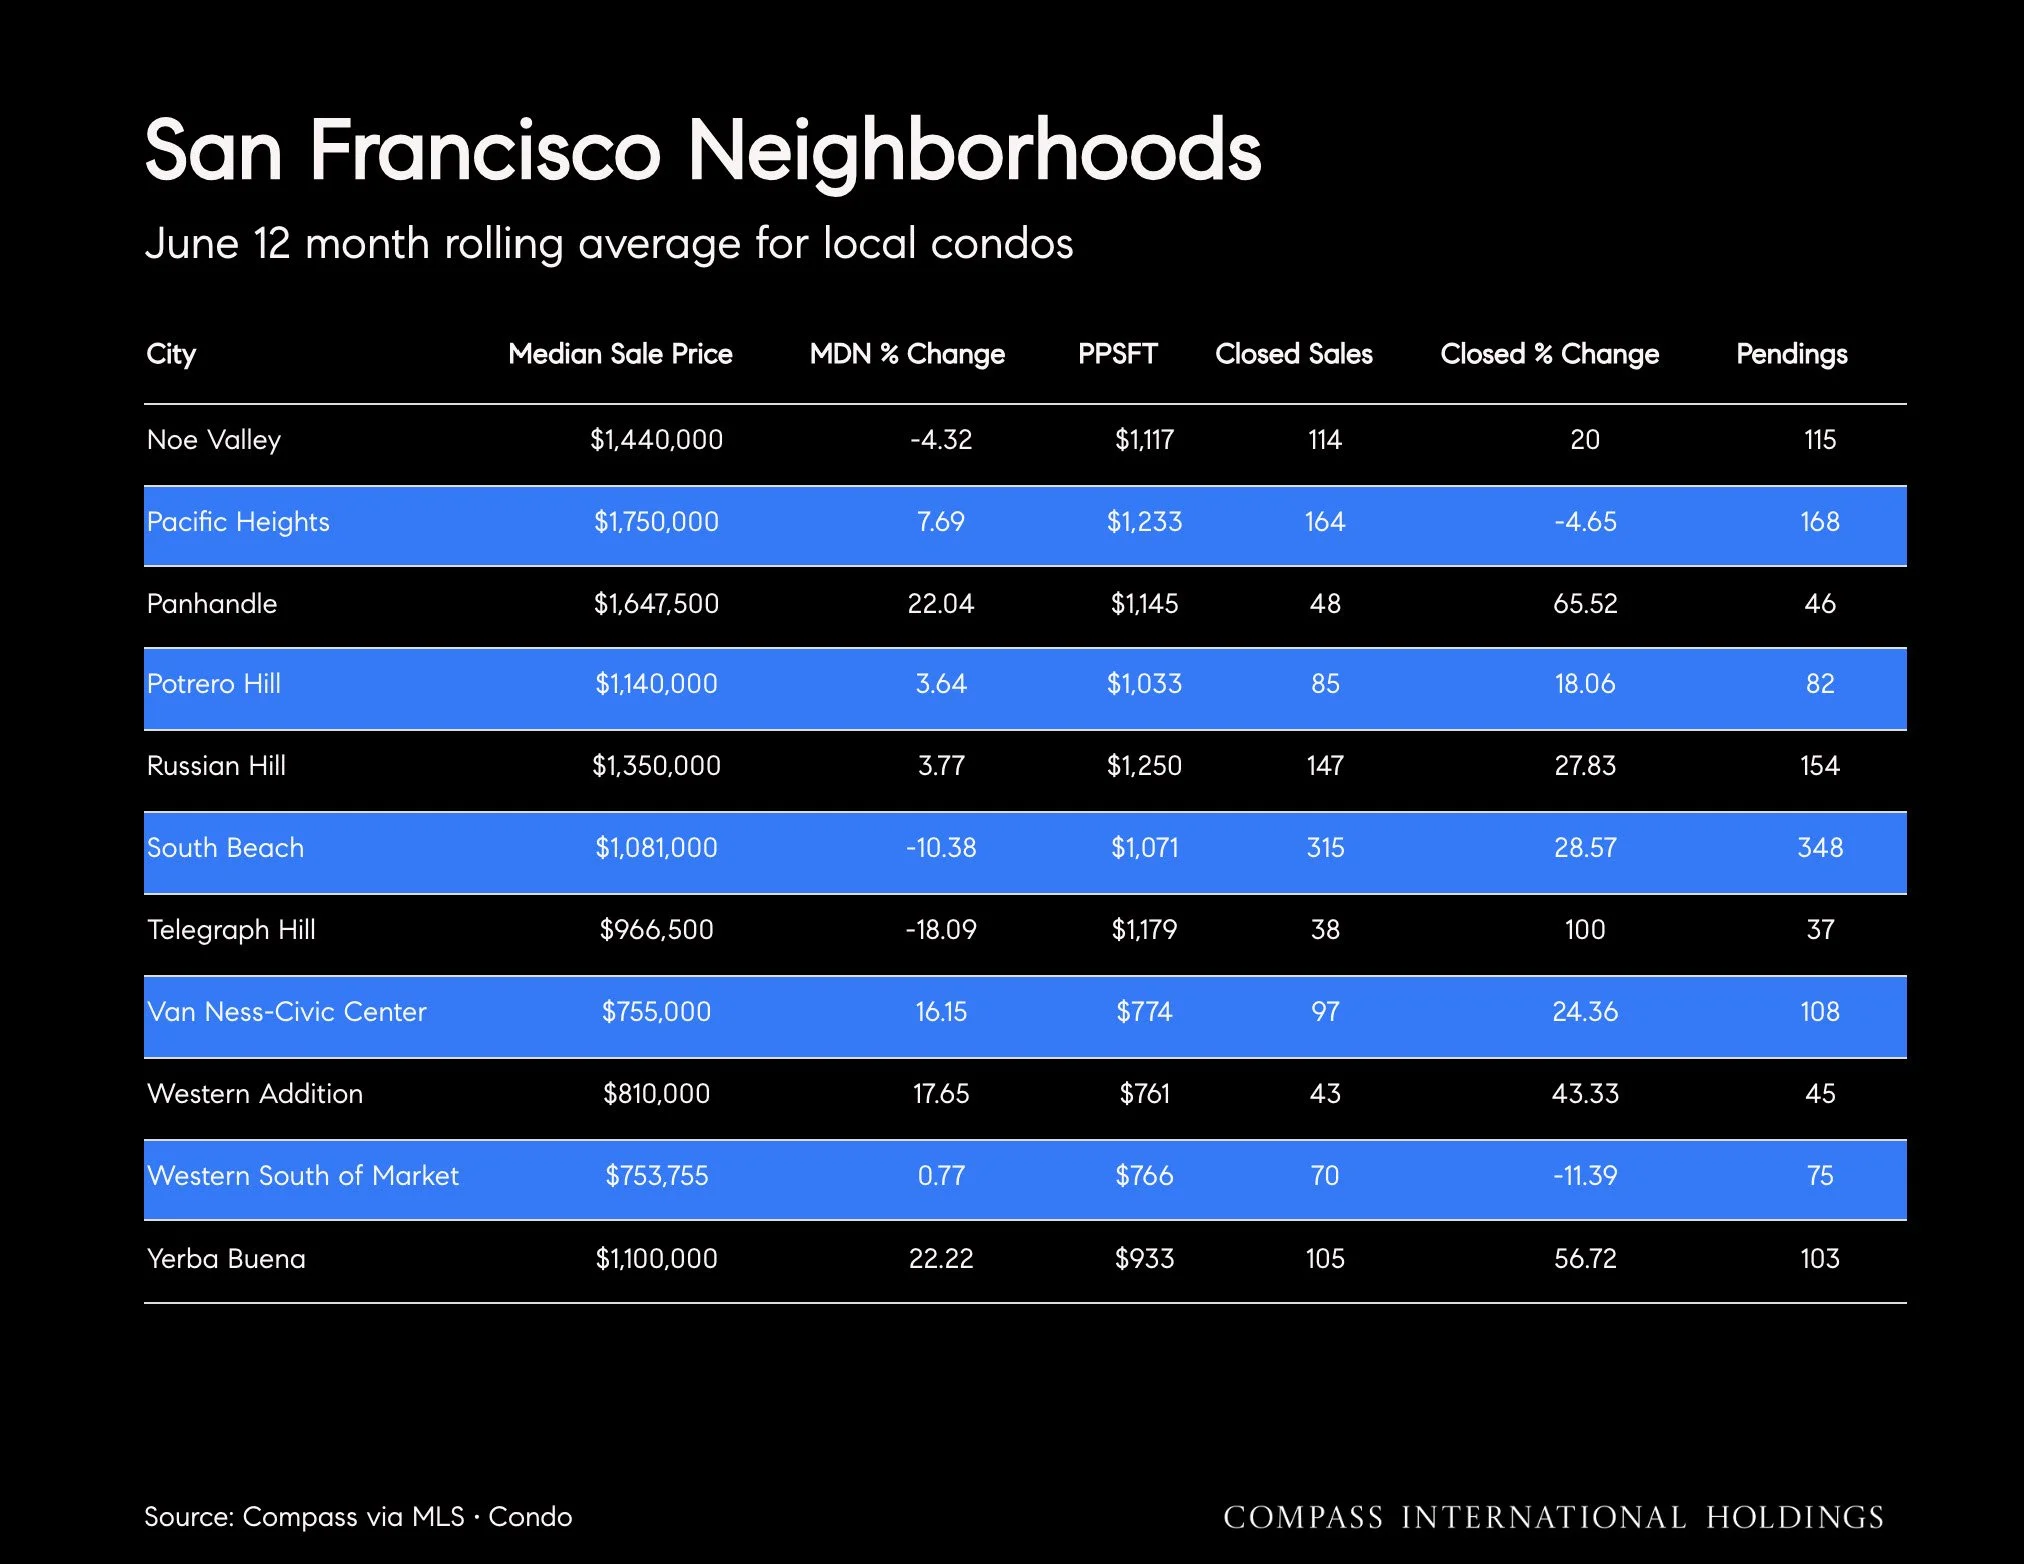
San Francisco Neighborhoods
June 12-month rolling average for local condos