June 2023 Market Report

Recapping the Spring 2023 Market
Median home sales prices have begun to recover from mid-winter lows, though remaining far below peak prices hit in spring 2022.
The SF house market continues to be substantially stronger than the condo market, and the condo market in the downtown/South of Market/Civic Center area – affected by a number of economic and social factors – is considerably weaker than condo markets in the rest of the city.
The number of new listings coming on market and the number of home sales over the past 12 months were the lowest since both plunged after the pandemic first struck. New listing and sales volumes have risen from their nadirs in mid-winter, but remain historically low. Average days on market dropped considerably in 2023 as buyer demand recovered, and the percentage of home sales closing over asking price increased. The average house sale is now, once again, selling well above its original asking price. The average condo sale is selling slightly below list price.
Luxury home sales remain well down from peaks seen at the height of the pandemic boom, but significantly up from late 2022.
With bank crises, fed actions, inflation readings, and U.S. debt-default fears, interest rates have been volatile in 2023, with significant ups and downs. As of early June, 30-year, fixed-rate mortgages are running about a quarter percent below 7% (but rates can change quickly).
The 1st and 4th largest insurers of CA homes, State Farm and Allstate, have announced they will no longer write new policies in the state due to rising claims costs. It is too early to quantify the exact financial, political and market effects of their actions, or if other insurers will follow suit. Similar issues have come up in other states, such as Florida and Louisiana, and occurred with earthquake insurance in CA in the mid-1990’s, leading to the creation of CA Earthquake Authority.
San Francisco HOUSE Price Trends since 1990
Monthly Median House Sales Prices, 3-Month Rolling
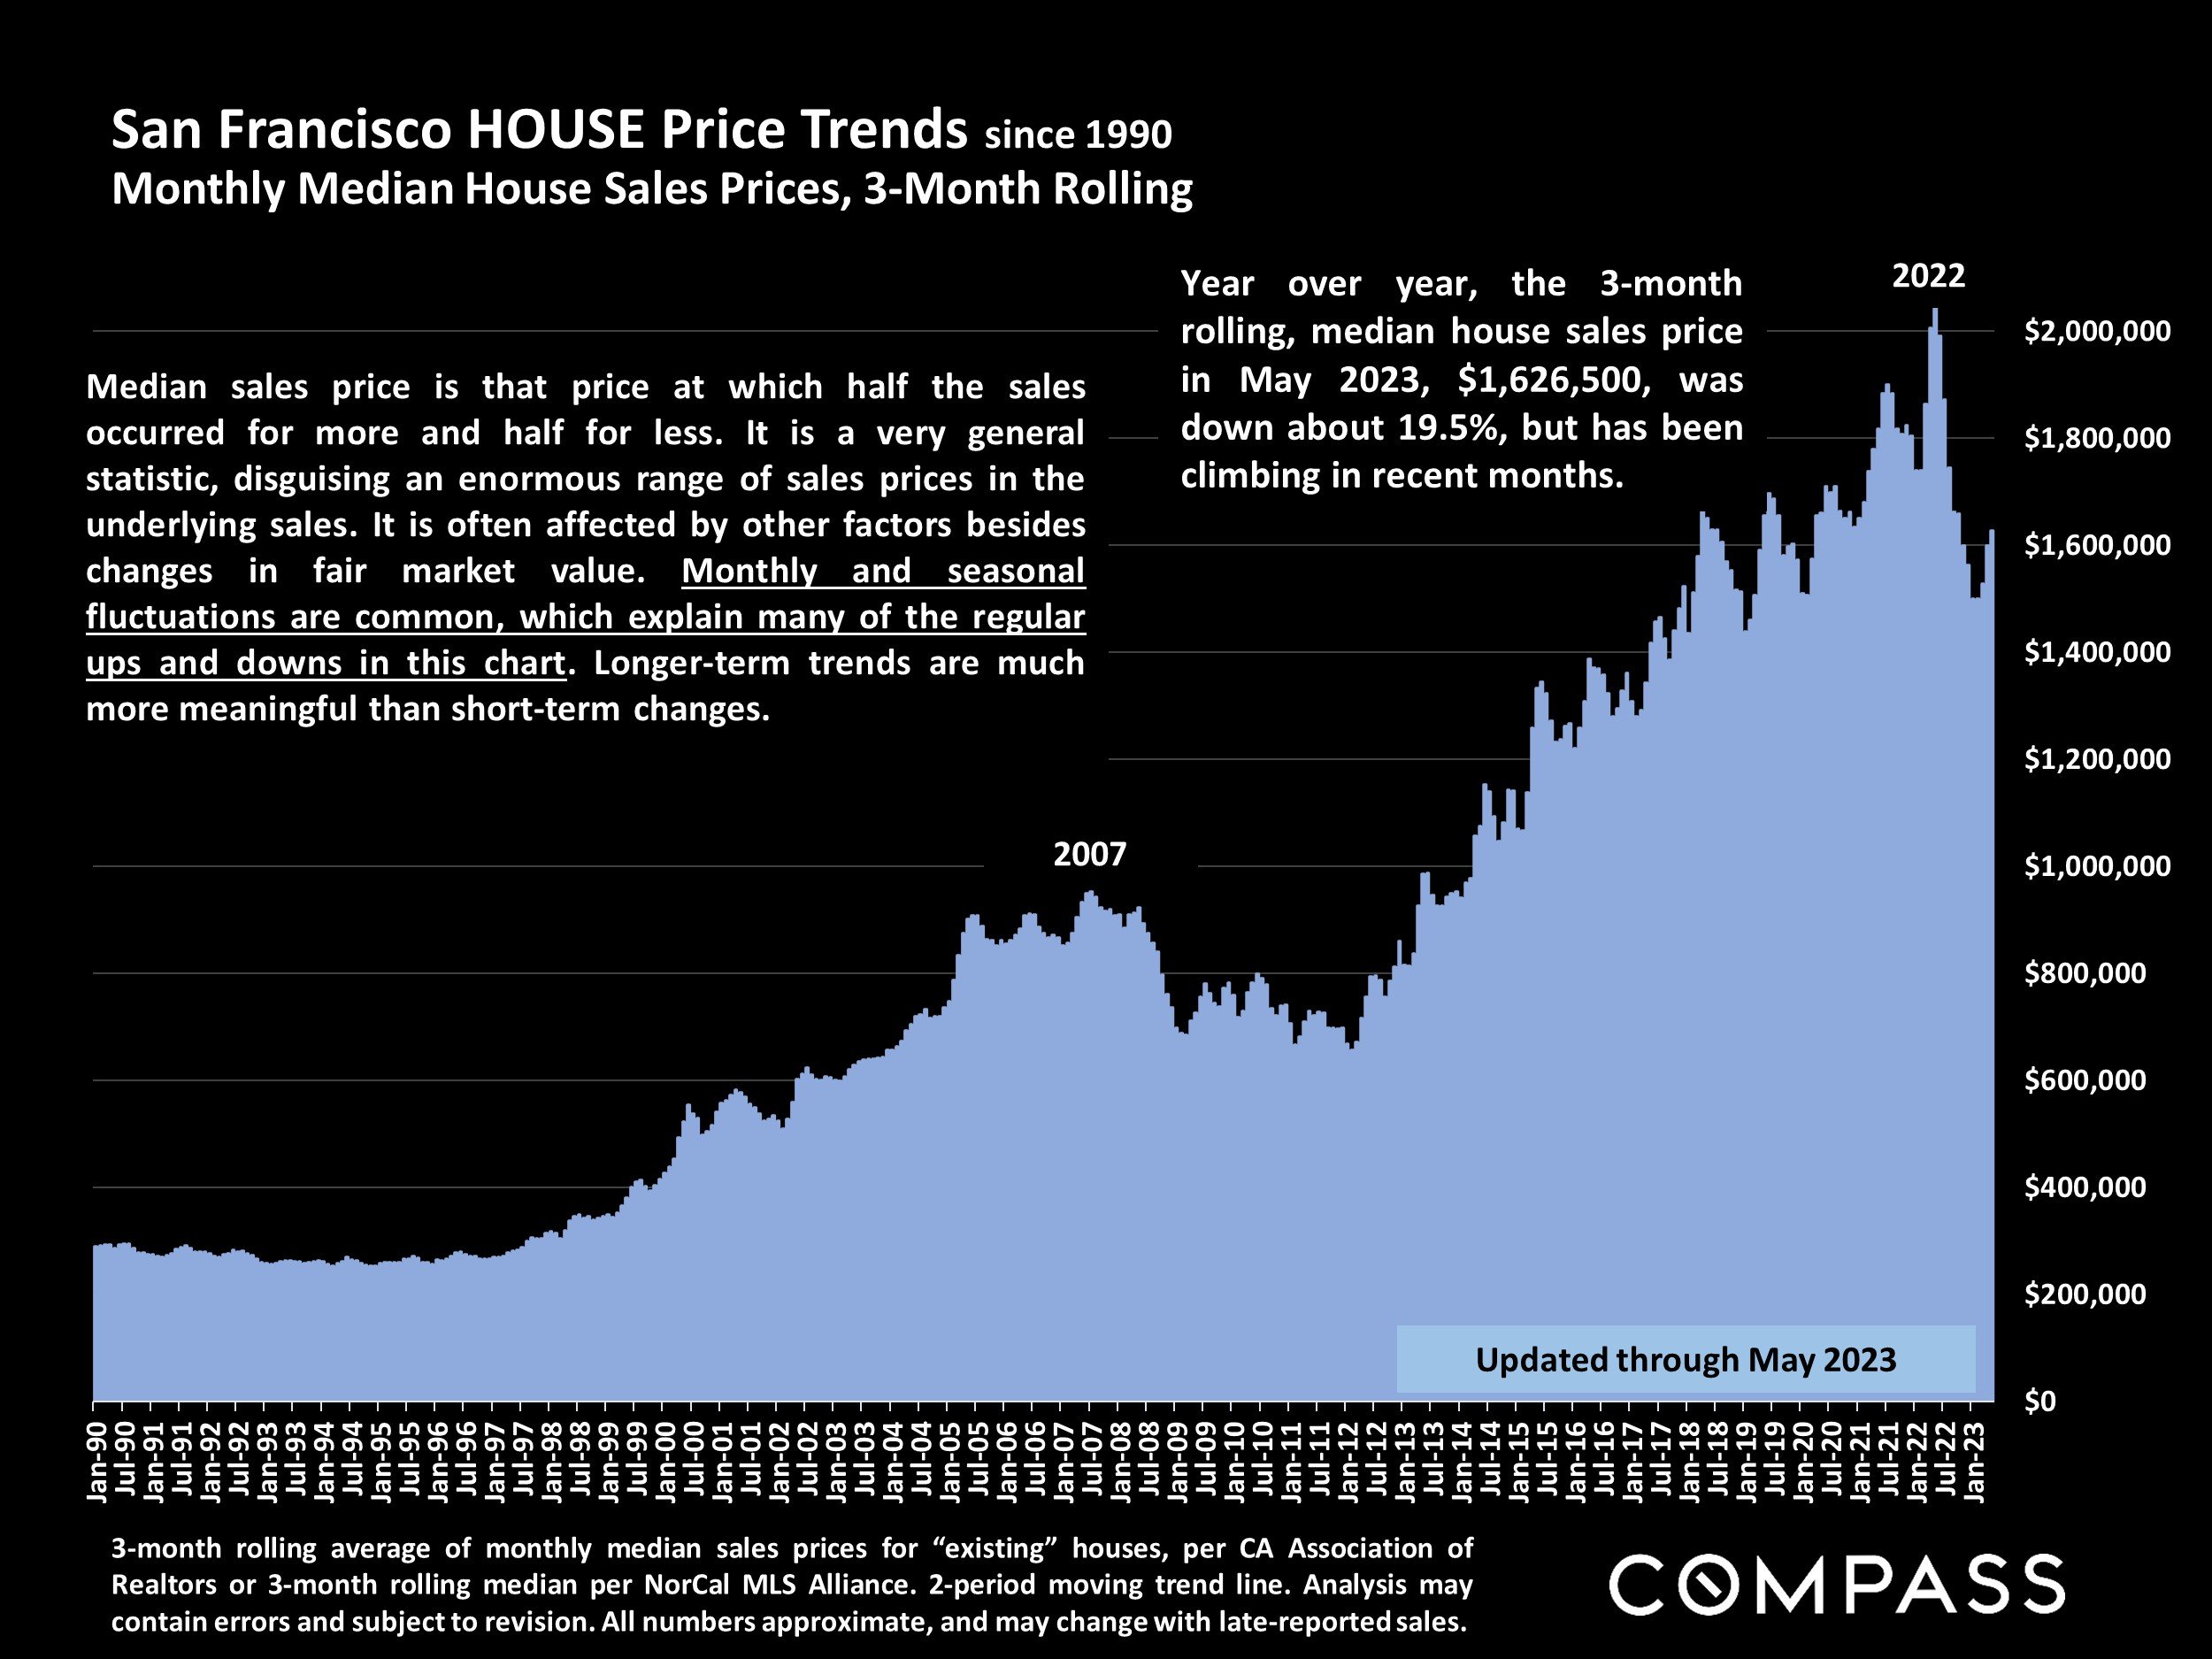
3-month rolling average of monthly median sales prices for “existing” houses, per CA Association of Realtors or 3-month rolling median per NorCal MLS Alliance. 2-period moving trend line. Analysis may contain errors and subject to revision. All numbers approximate, and may change with late-reported sales.
Year over year, the 3-month rolling, median house sales price in May 2023, $1,626,500, was down about 19.5%, but has been climbing in recent months.
Median sales price is that price at which half the sales occurred for more and half for less. It is a very general statistic, disguising an enormous range of sales prices in the underlying sales. It is often affected by other factors besides changes in fair market value. Monthly and seasonal fluctuations are common, which explain many of the regular ups and downs in this chart. Longer-term trends are much more meaningful than short-term changes.
San Francisco HOUSE Value Trends since 2005
3-Month Rolling Median Dollar per Square Foot Values*

*3-month rolling median house sales values reported to NorCal MLS Alliance, per Infosparks. Analysis may contain errors and subject to revision. All numbers approximate, and may change with late-reported sales.
Year over year, the 3-month rolling, median house$/sq.ft. value in May 2023, $1002, was down about 14%, but has been climbing in recent months.
Median $/sq.ft. value is a very general statistic, disguising an enormous range of values in the underlying sales. It is often affected by other factors besides changes in fair market value. Monthly and seasonal fluctuations are common, which explain many of the regular ups and downs in this chart. Longer-term trends are much more meaningful than short-term changes.
San Francisco House Sales
6 Months Sales by Bedroom Count & Price Segment

6 months house sales reported to SFARMLS & MLSLISTINGS through late May 2023, per Broker Metrics. Not all sales are reported. Data from sources deemed reliable, but may contain errors and subject to revision. All numbers approximate.
The size of houses of the same bedroom count can vary widely. Of course, many factors impact values, including location, architecture, quality of construction and condition, number of bathrooms, extra rooms, amenities, views, parking, outdoor space, decks and others too many to list.
Due to the age of its inventory of houses, San Francisco has a higher percentage of 2-bedroom houses and a smaller percentage of 5+ bedroom houses than most other Bay Area Counties, which were built out much later (during more affluent periods).
San Francisco CONDO Price Trends since 2005
3-Month Rolling, Median Condo Sales Price

3-month rolling median condo sales prices reported to NorCal MLS Alliance, per Infosparks. Analysis may contain errors and subject to revision. All numbers approximate, and may change with late-reported sales.
Median sales price is that price at which half the sales occurred for more and half for less. It is a very general statistic, often affected by other factors besides changes in fair market value. Monthly and seasonal fluctuations are common, and longer-term trends are more meaningful than short-term changes.
Year over year, the 3-month rolling, SF median condo sales price in May 2023, $1,150,000, was down about 11.5%, but has been rising in spring 2023.
San Francisco CONDO Value Trends since 2005
3-Month Rolling Median Dollar per Square Foot Values*
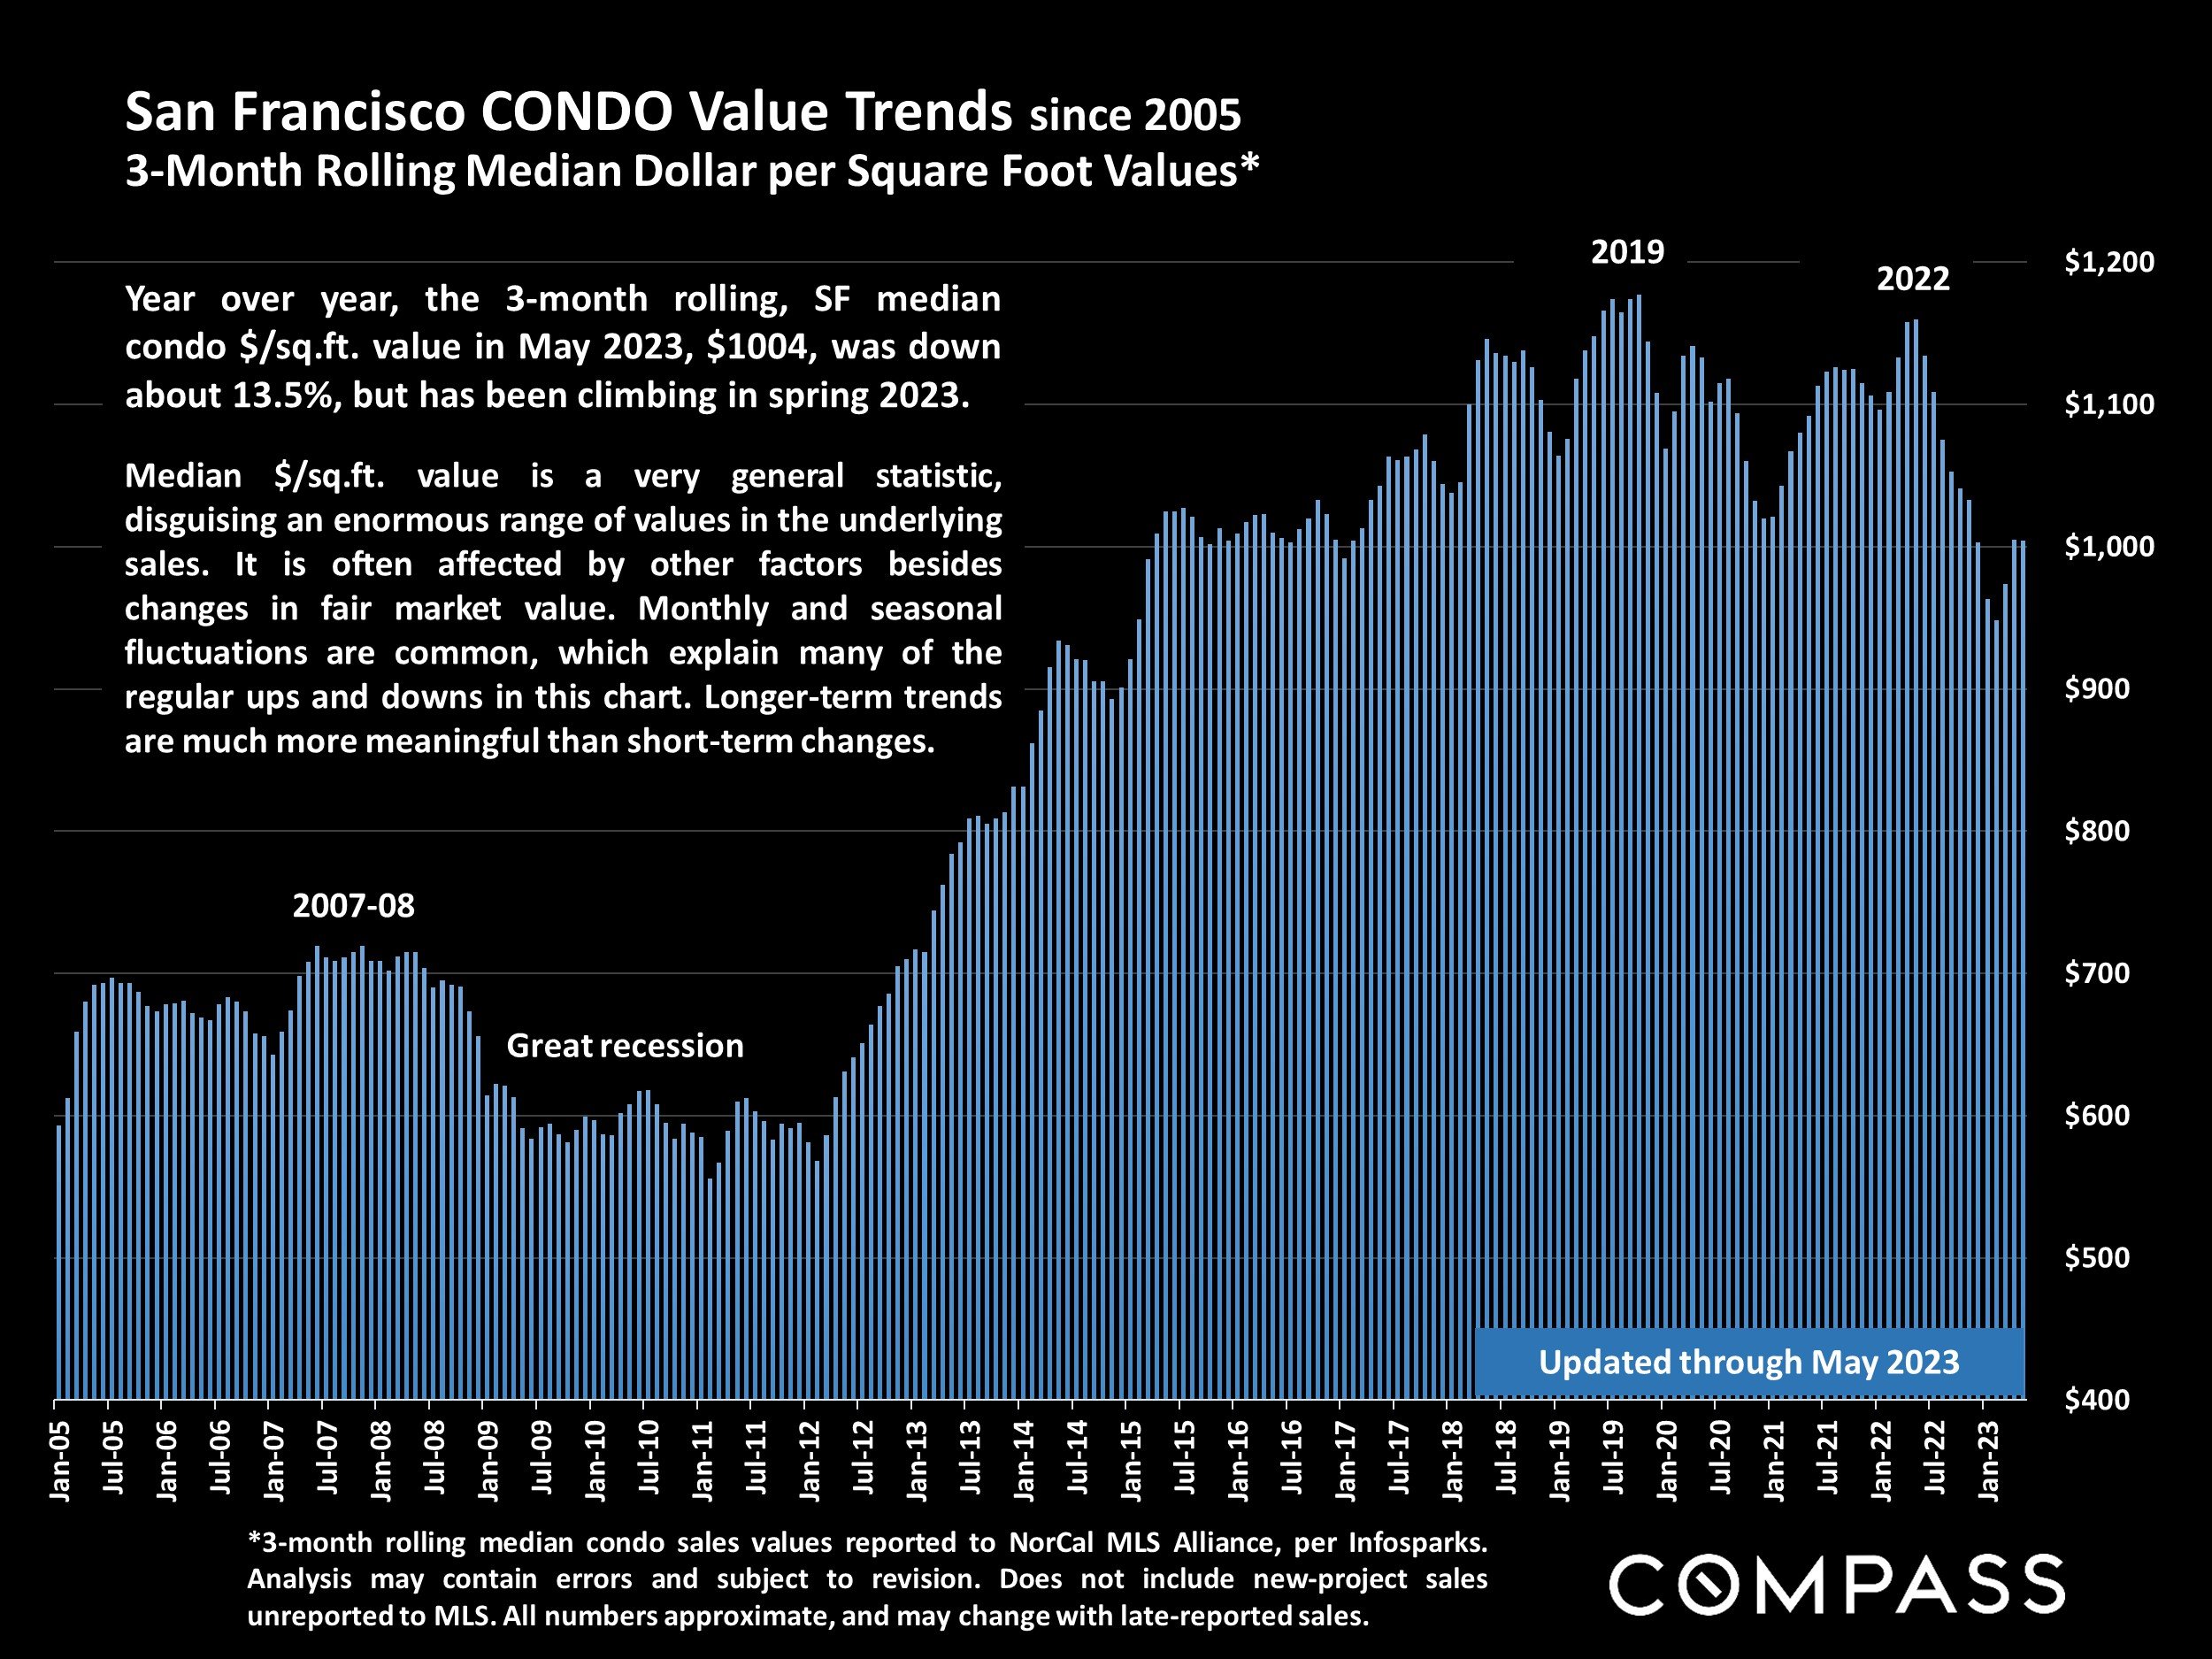
*3-month rolling median condo sales values reported to NorCal MLS Alliance, per Infosparks. Analysis may contain errors and subject to revision. Does not include new-project sales unreported to MLS. All numbers approximate, and may change with late-reported sales.
Year over year, the 3-month rolling, SF median condo $/sq.ft. value in May 2023, $1004, was down about 13.5%, but has been climbing in spring 2023.
Median $/sq.ft. value is a very general statistic, disguising an enormous range of values in the underlying sales. It is often affected by other factors besides changes in fair market value. Monthly and seasonal fluctuations are common, which explain many of the regular ups and downs in this chart. Longer-term trends are much more meaningful than short-term changes.
San Francisco Condo, Co-op, TIC & Townhouse Sales
6 Months Sales by Bedroom Count & Price Segment

6 months condo, co-op, TIC and townhouse sales reported to SFAR MLS through late May 2023, per Broker Metrics. Not all sales are reported, including many new-project condo sales. Data derived from sources deemed reliable, but may contain errors and subject to revision. All numbers approximate.
Values are often deeply affected by the floor on which they reside (and views), though many factors impact values including location, architecture, quality of building, outdoor space, number of bathrooms, common amenities, parking and others too many to list. Units of the same bedroom count can vary widely in size.
San Francisco CONDO Price Trends: Downtown vs. Non-Downtown
6-Month-Rolling Median Condo Sales Prices since 2005*

*6-month rolling median condo sales values reported to NorCal MLS Alliance, per Infosparks. Analysis may contain errors and subject to revision. Does not include new-project sales unreported to MLS. All numbers approximate, and may change with late-reported sales.
Comparing the median condo sales price in the greater Downtown/South of Market/Civic Center area (the center of large-project, new-condo construction, office buildings and high-tech employment) – delineated by the blue line – with the median condo sales price in the rest of San Francisco (mostly smaller, older buildings, in less urban environments) – delineated by the white columns.
The Greater/SoMa/Civic Center condo market has been more negatively affected by a number of economic, demographic, and social factors including supply and demand than condos in other city districts.
Long-Term, 12-Month-Rolling, Overview of Supply & Demand
Ultimately, it always boils down to supply & demand: When buyers compete for too few listings, home prices rise; when sellers compete for too few buyers, prices drop. The next chart reviews broad, long-term trends in new listings and sales: Each monthly reading reflects activity over a 1-year period. (Note that 12-month-rolling data = clearer trend lines, but can disguise and lag shorter term changes).
One critical factor missing from the following chart is speed of sale: As a market heats up, new listings sell more quickly: During the pandemic boom, homes typically sold at their fastest rates ever. When demand declines during a downturn, listings take longer to sell: During the 2008-2011 market recession, days-on-market often doubled or tripled from historical norms – the average listing could take months to sell. Even if the new-listing count stays the same, the inventory of active listings available to purchase can climb or fall considerably depending on speed of sale, and how long the boom or slowdown lasts.
After the 2007-08 housing & stock market crash, buyer demand plunged, foreclosures climbed and inventory soared, home prices cratered. Once the crisis passed, the quantity of listings coming on market dropped – no more foreclosure and short sale listings, and homeowners were moving less often – just as buyer demand jumped with the high-tech hiring, population and wealth boom. Increasing demand vs. decreasing supply created strong upward pressure on prices. When the pandemic hit, a number of factors – interest rates, stock markets, contagion, desire for outside space, work from home, family care, etc. – came together, and the number of new listings quickly escalated, especially of condos. Until the vaccine rollout, conditions in the condo and house markets diverged, but ultimately, at the peak of the pandemic boom, sales volume hit its highest point in 15+ years, and home prices peaked.
Reverses in economic conditions led to the 2022 market correction. Due to the “mortgage lock-in effect,” the number of new listings dropped, but housing costs increased with rising interest rates, consumer confidence slumped with inflation and stock market declines, demand fell, and prices declined significantly from 2022 peaks. In 2023, buyer demand rebounded and prices started to rise again, though trends vary by market segment. (2023 changes do not yet stand out in the 12-month-rolling data. See 1-month-rolling charts later in this report for more recent, shorter-term trends.)
New-Listing & Home Sales Volumes: Broad, Longer-Term Trends
San Francisco, 12-Month-Rolling Data since 2005*
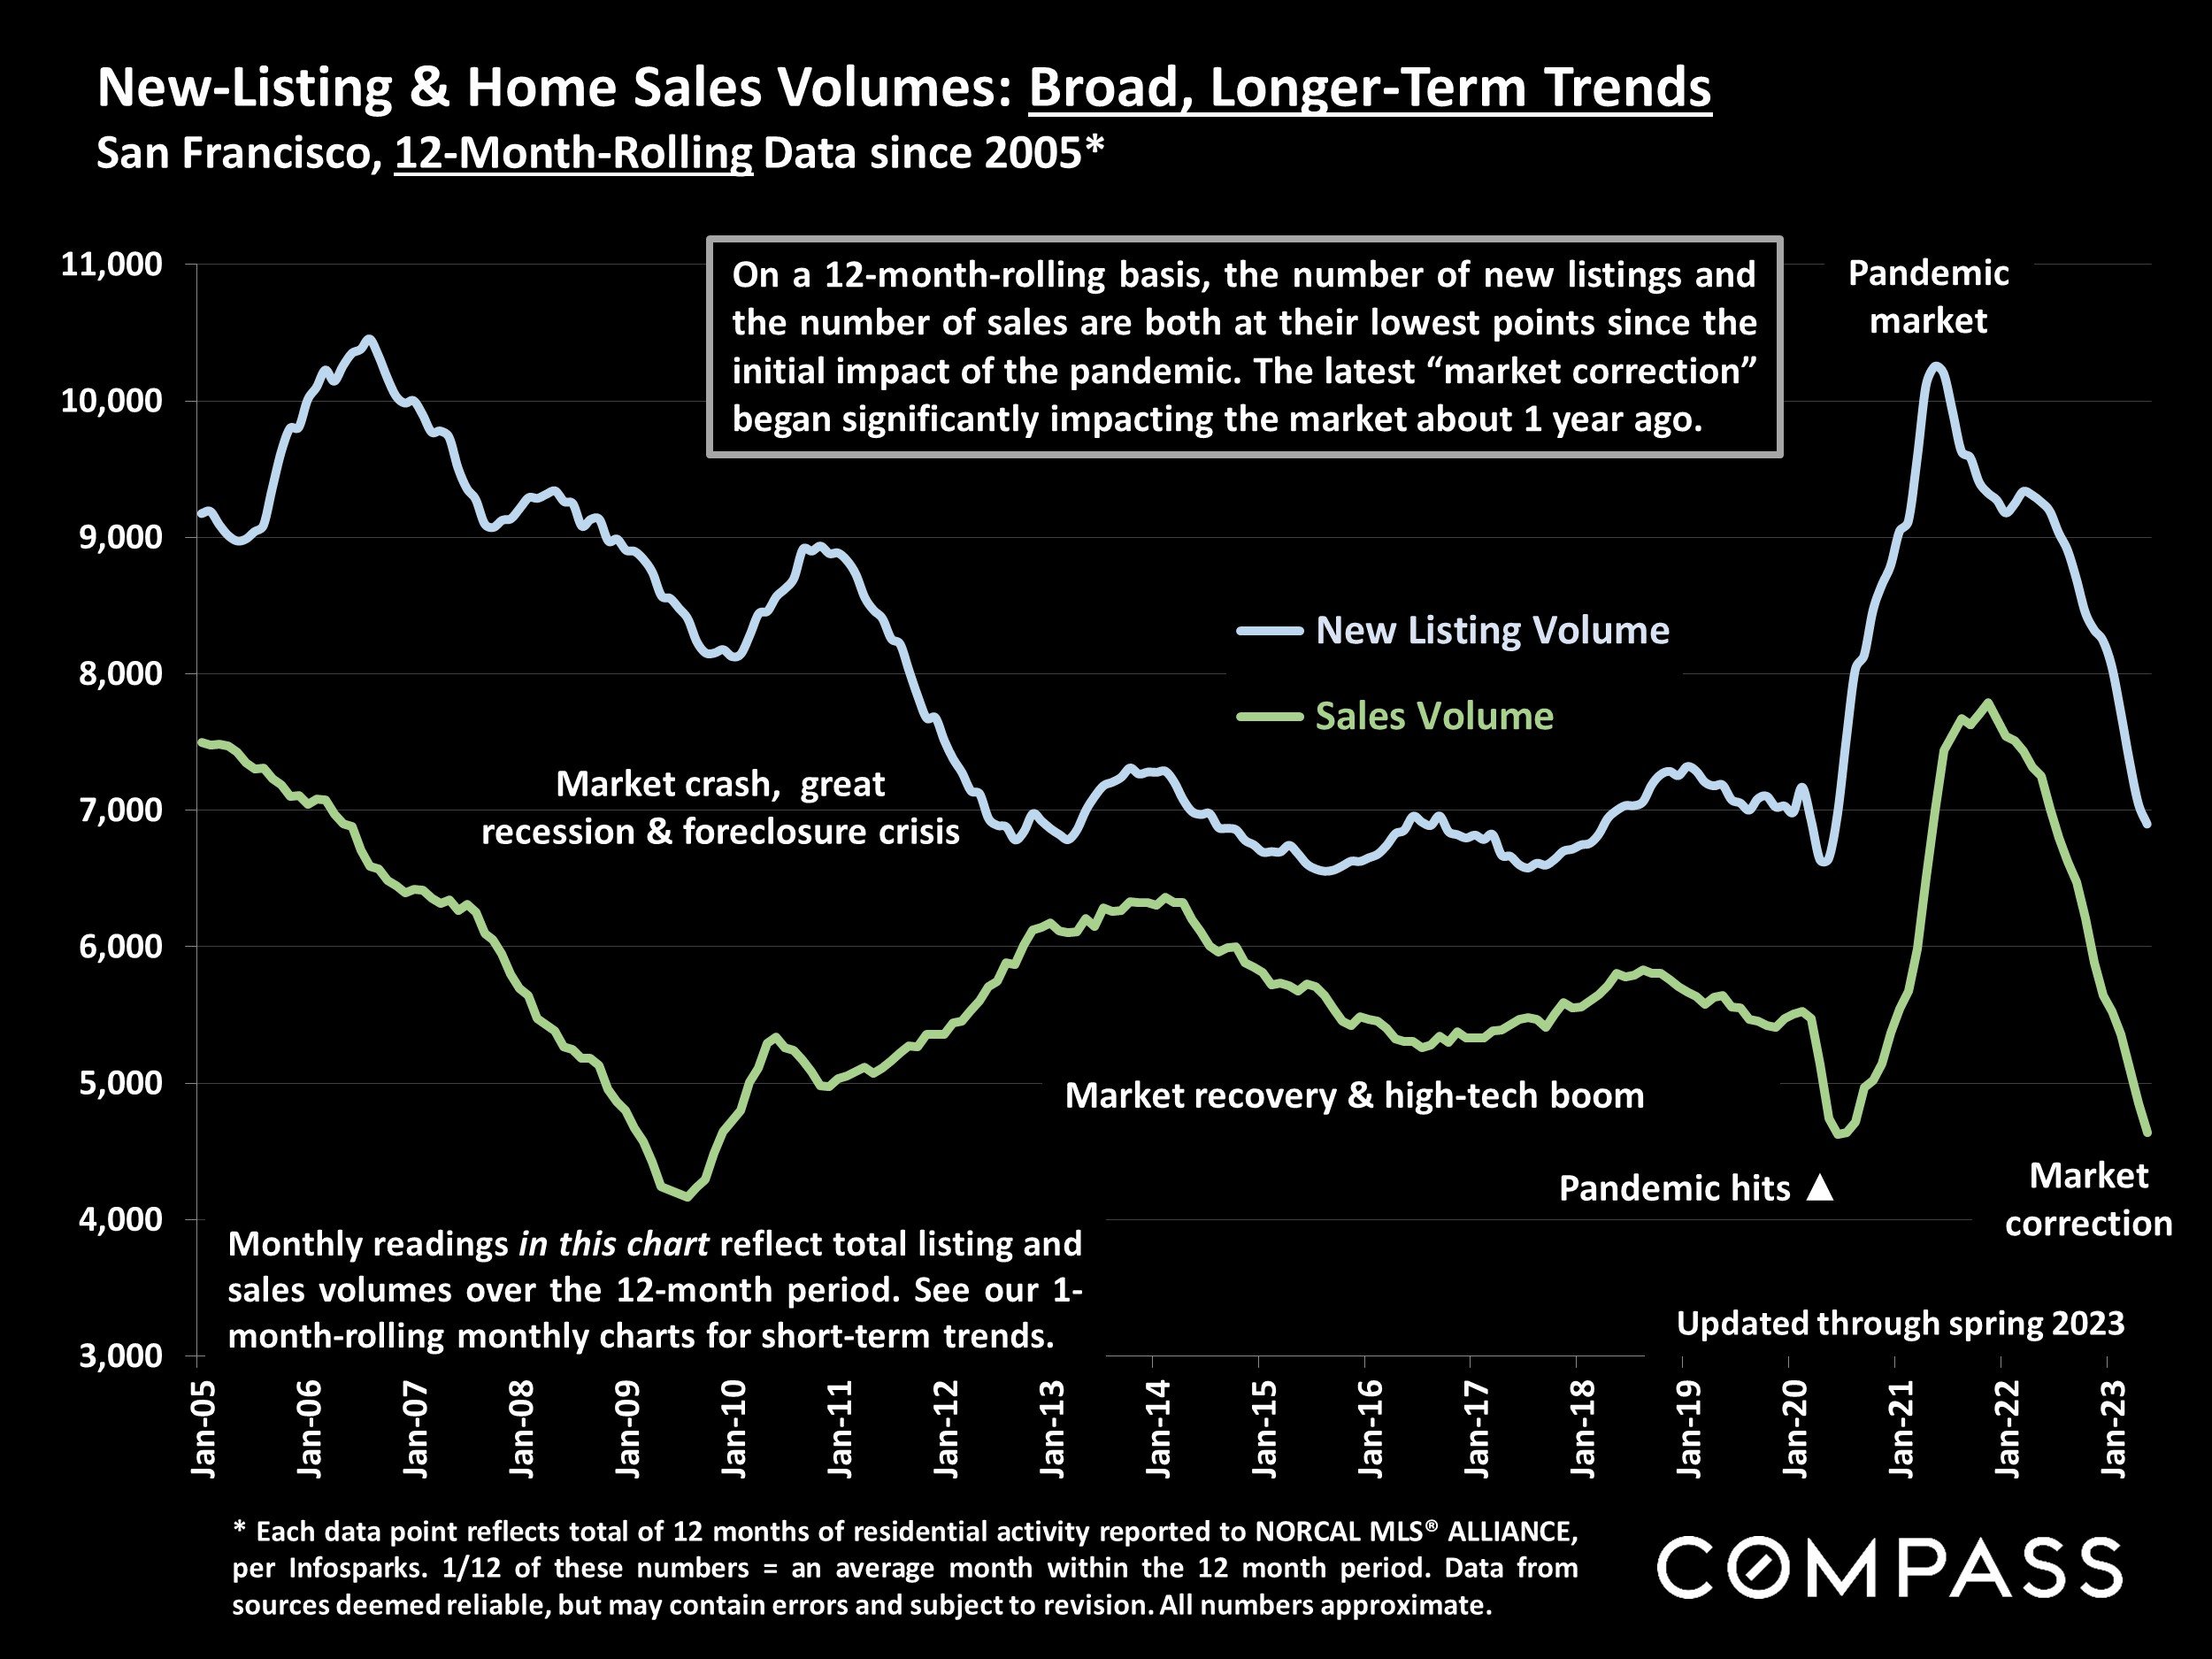
* Each data point reflects total of 12 months of residential activity reported to NORCAL MLS® ALLIANCE, per Infosparks. 1/12 of these numbers = an average month within the 12 month period. Data from sources deemed reliable, but may contain errors and subject to revision. All numbers approximate.
On a 12-month-rolling basis, the number of new listings and the number of sales are both at their lowest points since the initial impact of the pandemic. The latest “market correction” began significantly impacting the market about 1 year ago.
New Listings Coming on Market
San Francisco Market Dynamics & Seasonality
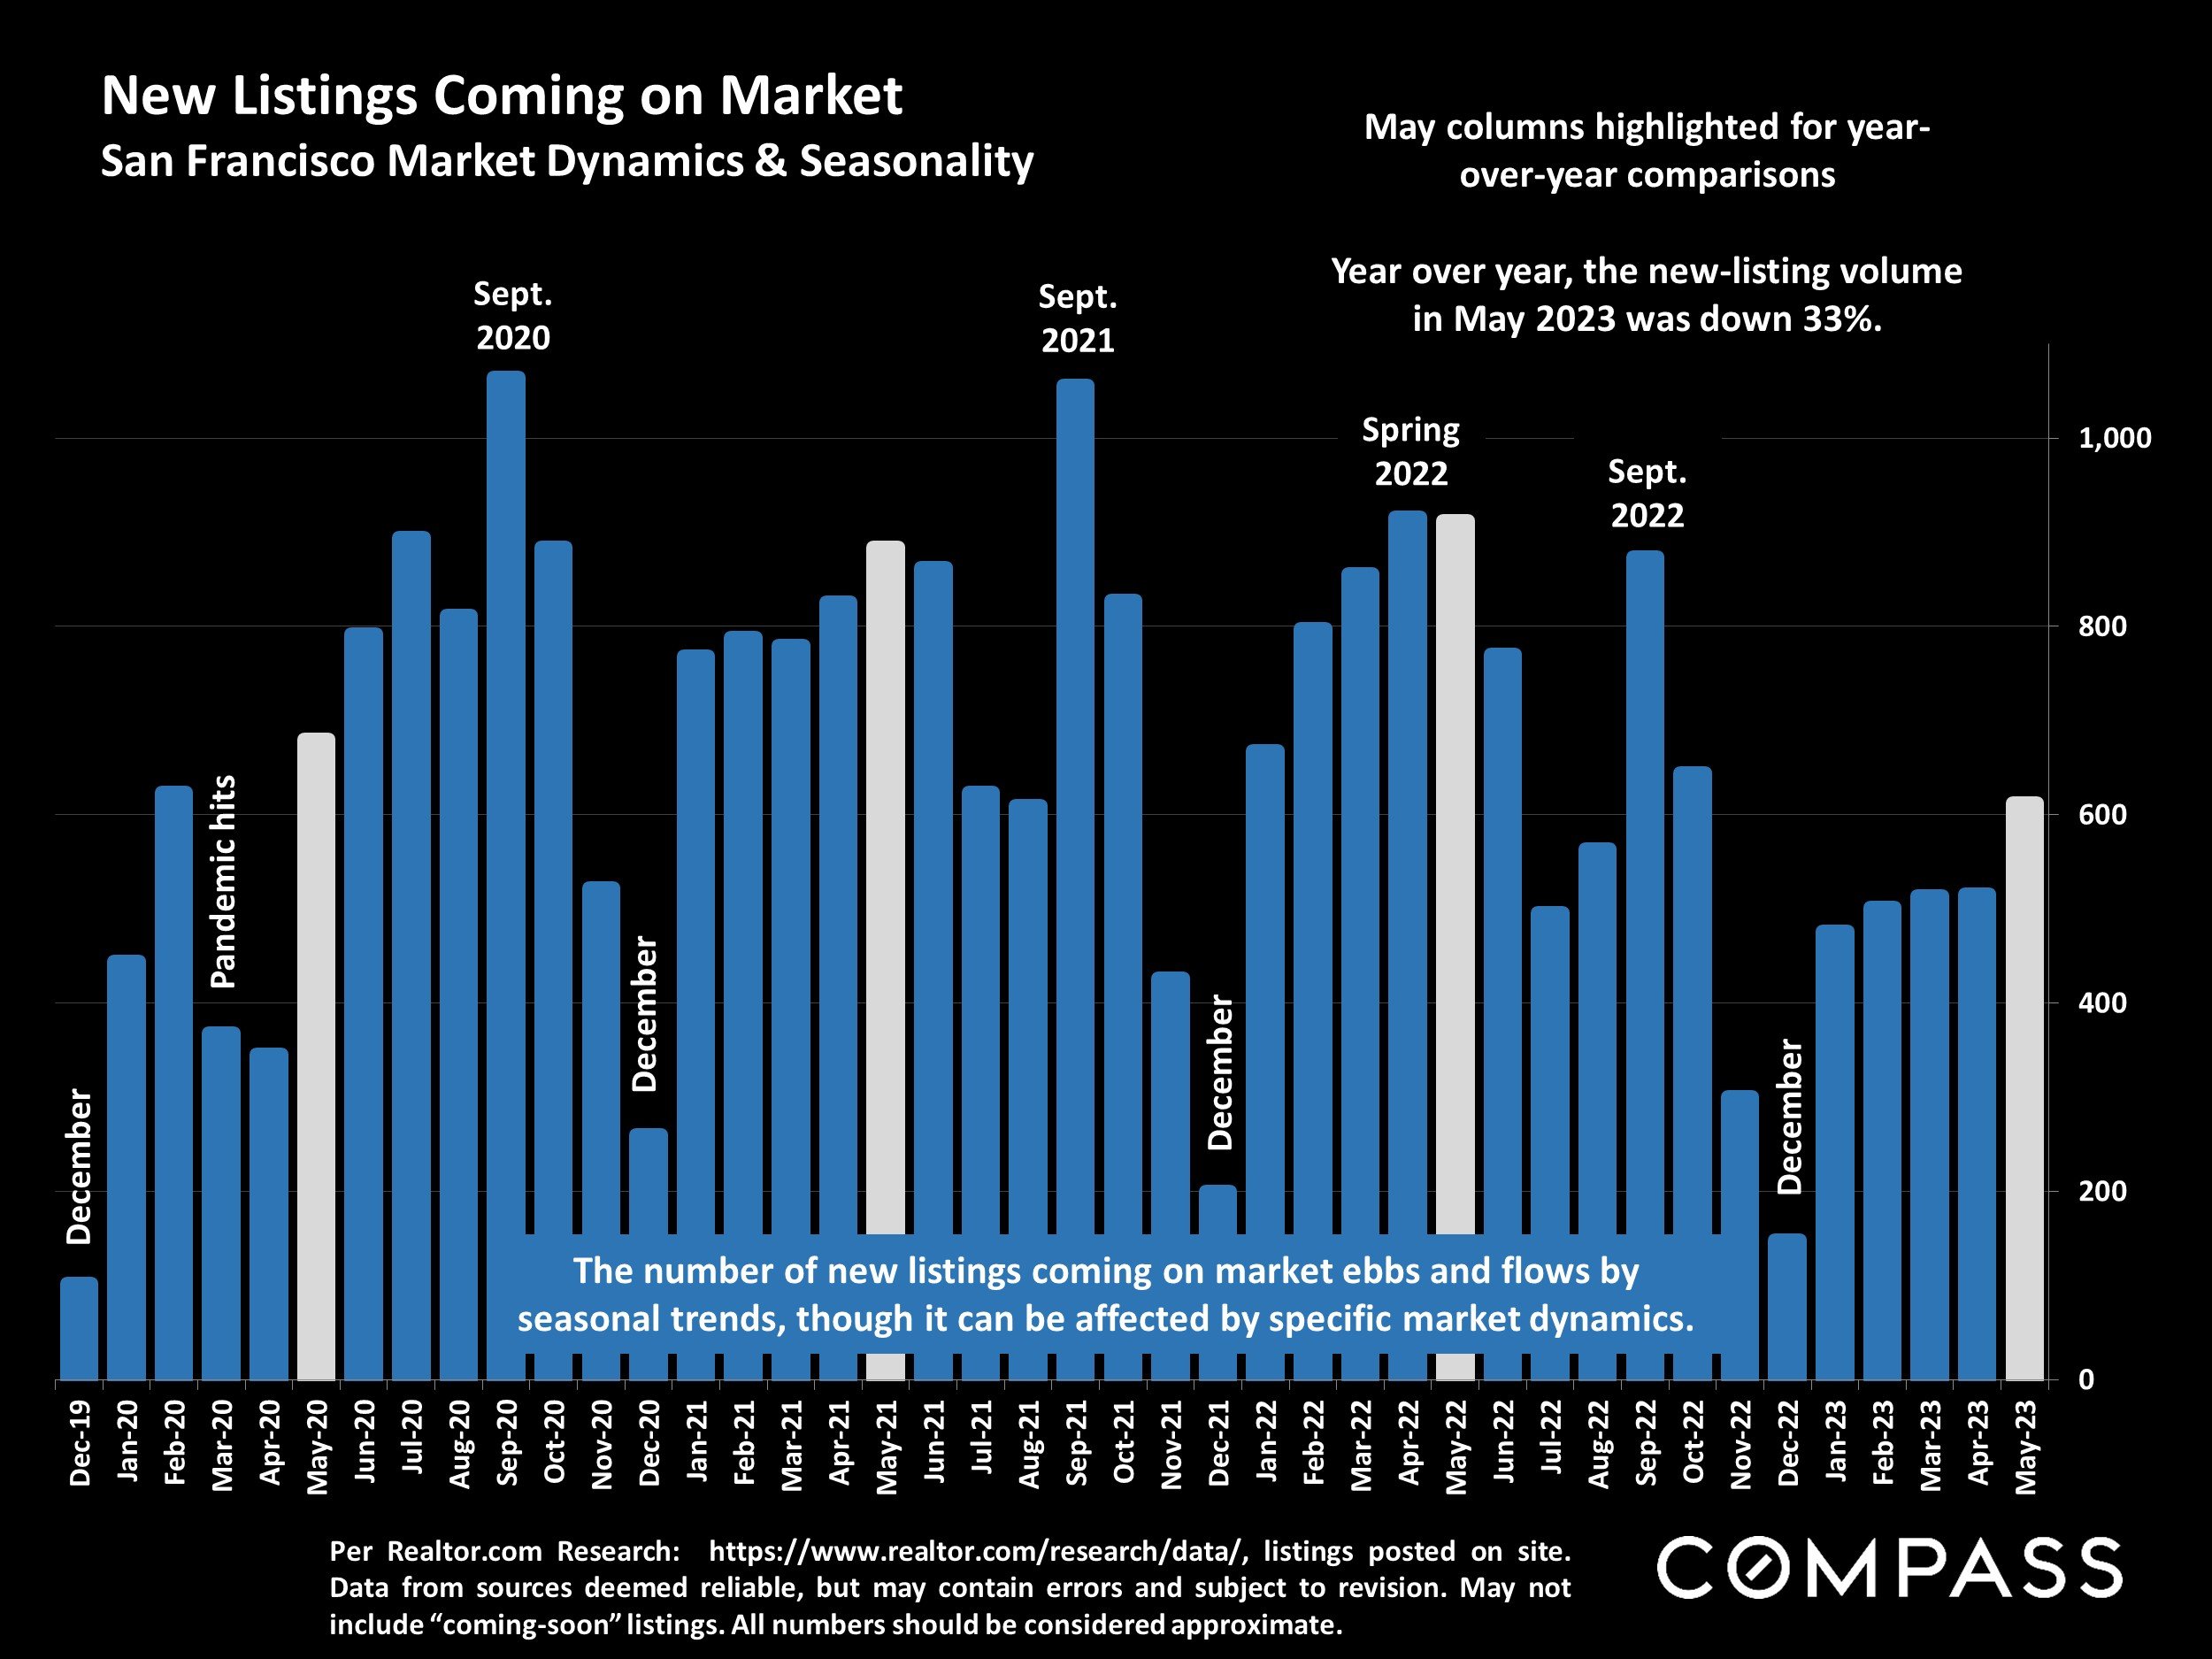
Per Realtor.com Research: https://www.realtor.com/research/data/, listings posted on site. Data from sources deemed reliable, but may contain errors and subject to revision. May not include “coming-soon” listings. All numbers should be considered approximate.
May columns highlighted for year-over-year comparisons. Year over year, the new-listing volume in May 2023 was down 33%.
San Francisco Homes Market
Active & Coming-Soon Listings on 1st of Month*

* Houses, condos, co-ops, TICs, townhouses: Active/Coming-Soon listings posted to NorCal MLS Alliance. Does not include new-project condos not listed on MLS. Data from sources deemed reliable, but may contain errors and subject to revision. All numbers approximate. The # of active listings changes constantly.
Of the listings for sale on June 1, 32%were houses, and 68% were condos, co-ops, TICs & townhouses.*
The # of active listings on a given day is affected by 1) the # of new listings coming on market, 2) how quickly buyers put them into contract, 3) the sustained heat of the market over time, and 4) sellers pulling their homes off the market without selling.
San Francisco: Homes for Sale by Price Segment
Active Listings on Market, as of 6/1/2023*

*Active & coming-soon listings posted to NorCal MLS Alliance. Not all listings are posted. Listing numbers change constantly. Data from sources deemed reliable, but may contain errors and subject to revision. All numbers approximate.
87% of active listings under $1,000,000 were condos, co-ops or TICs. 7 active listings were priced at $19.9 million+.
Active Listings on Market – Longer-Term Trends
San Francisco Market Dynamics & Seasonality
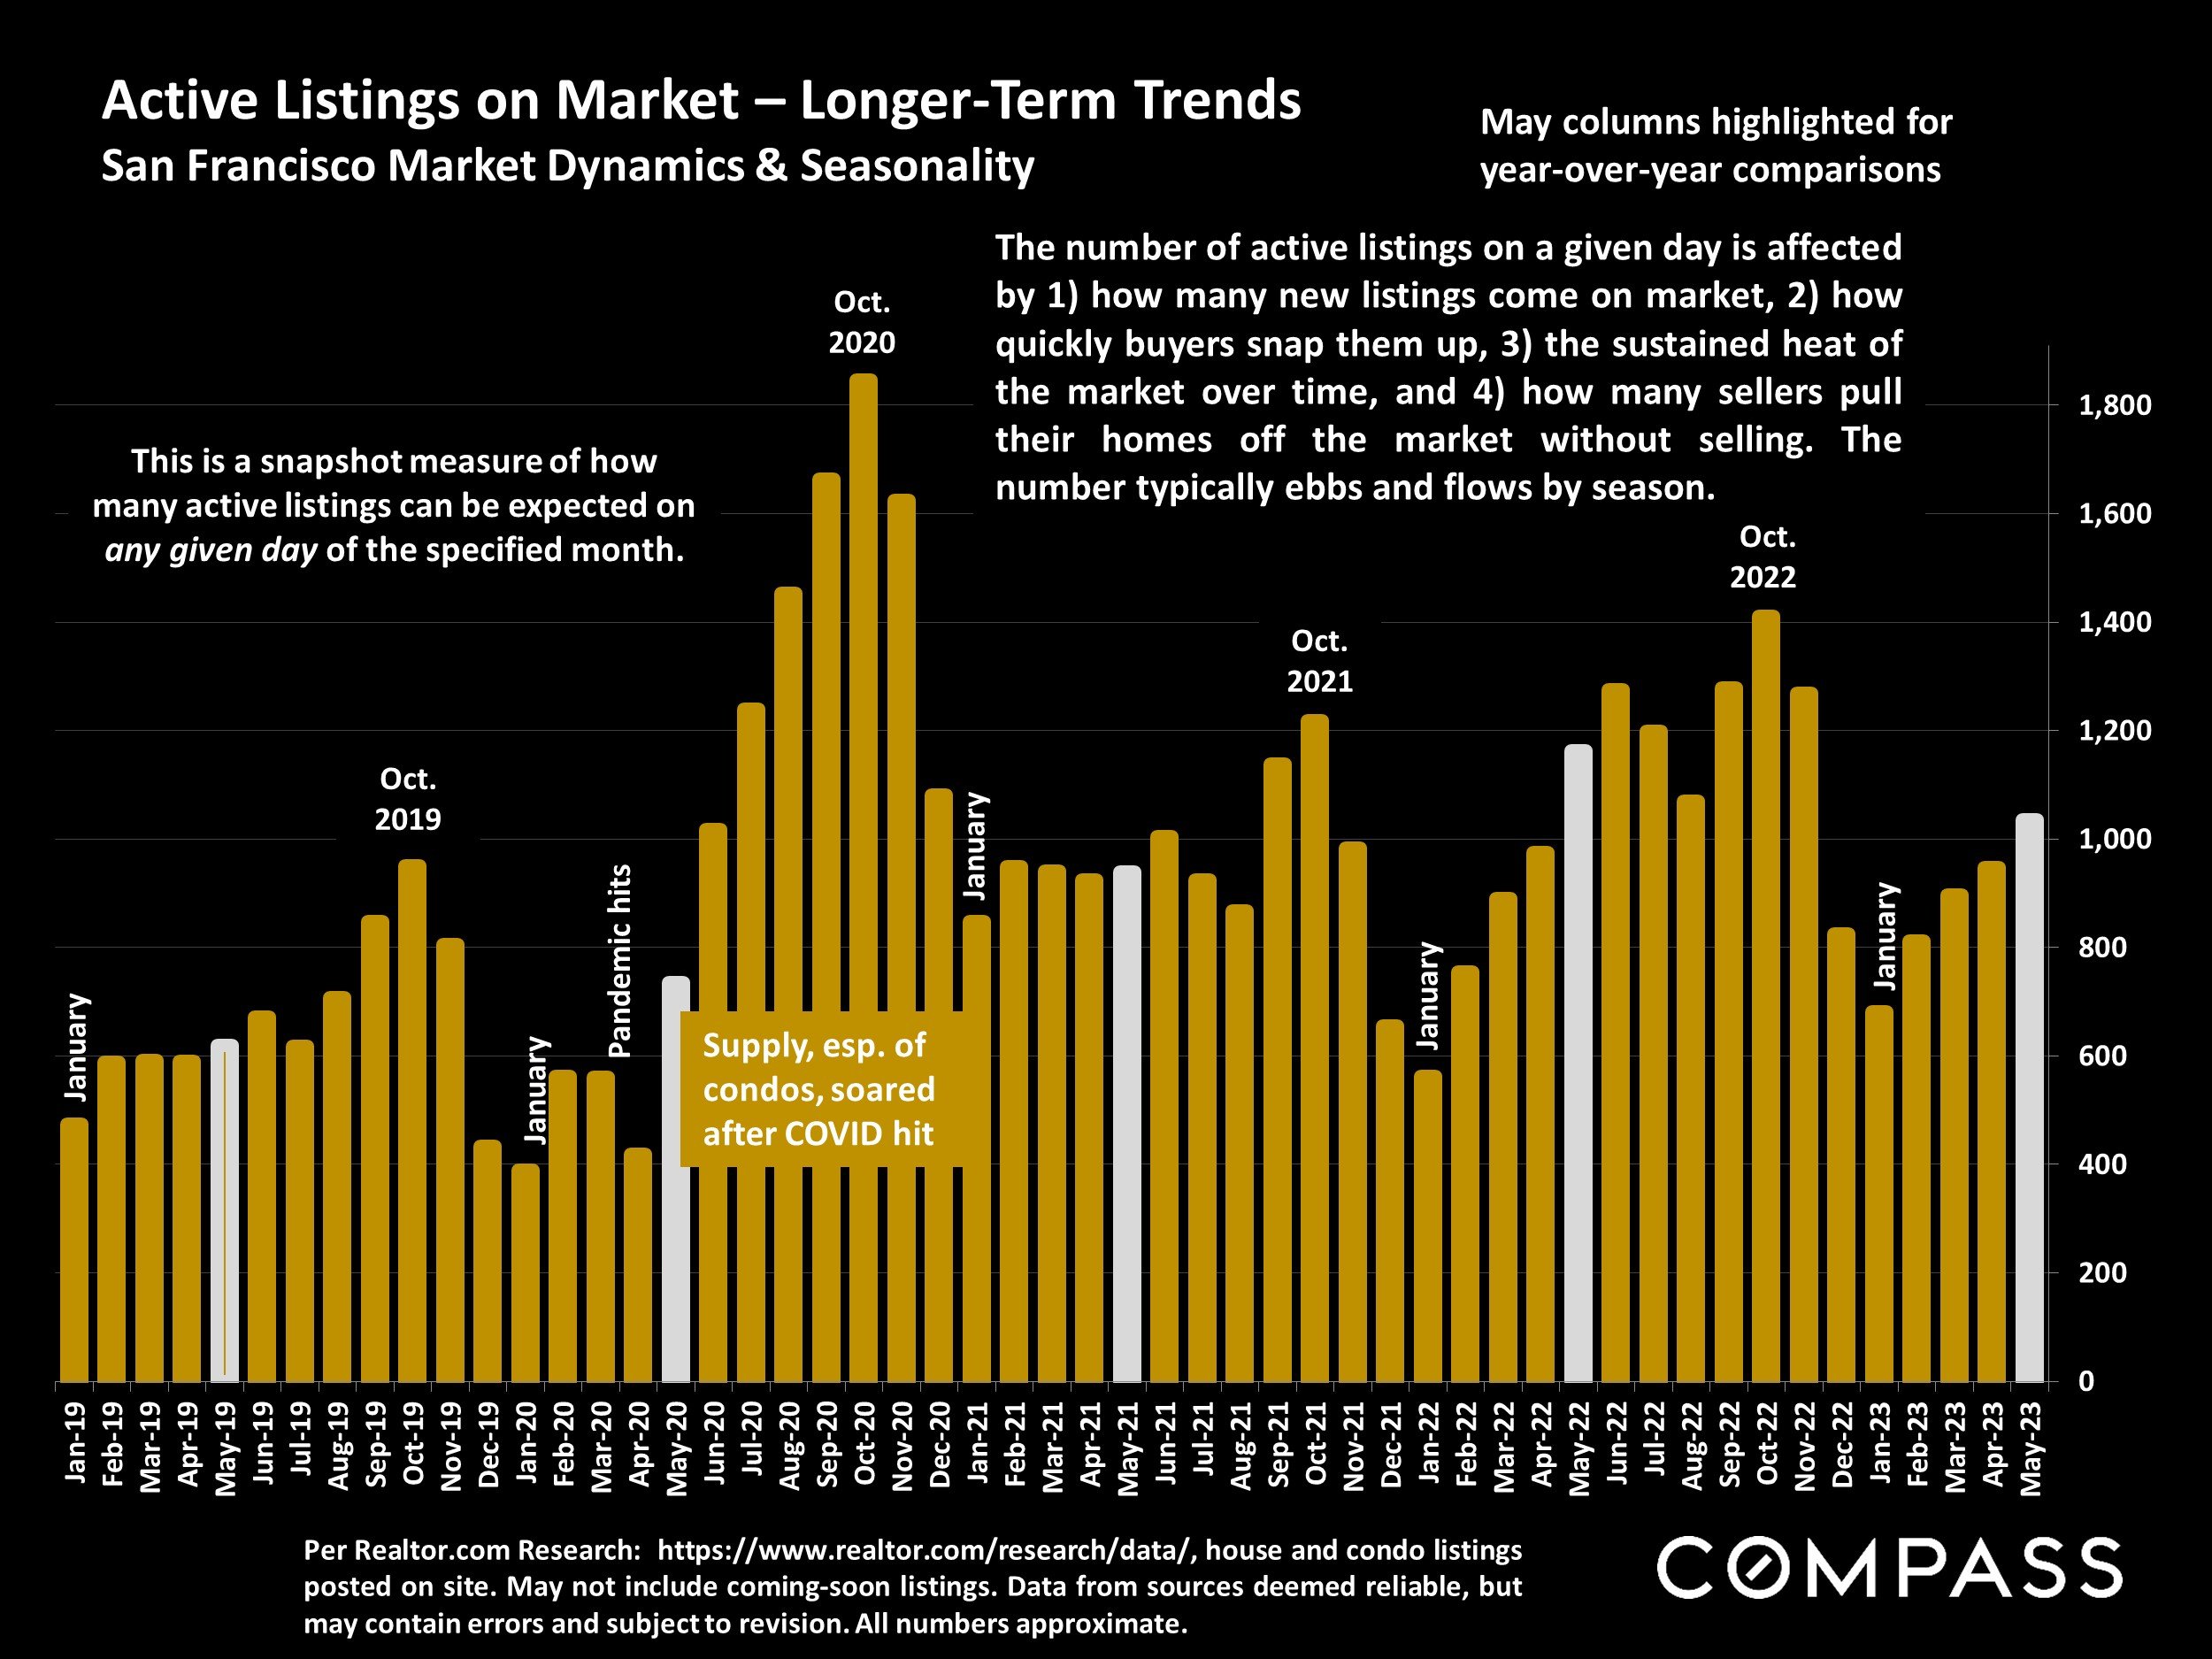
Per Realtor.com Research: https://www.realtor.com/research/data/, house and condo listings posted on site. May not include coming-soon listings. Data from sources deemed reliable, but may contain errors and subject to revision. All numbers approximate.
The number of active listings on a given day is affected by 1) how many new listings come on market, 2) how quickly buyers snap them up, 3) the sustained heat of the market over time, and 4) how many sellers pull their homes off the market without selling. The number typically ebbs and flows by season.
Listings Pending Sale (in Contract, Offer Accepted)
San Francisco Market Dynamics & Seasonality
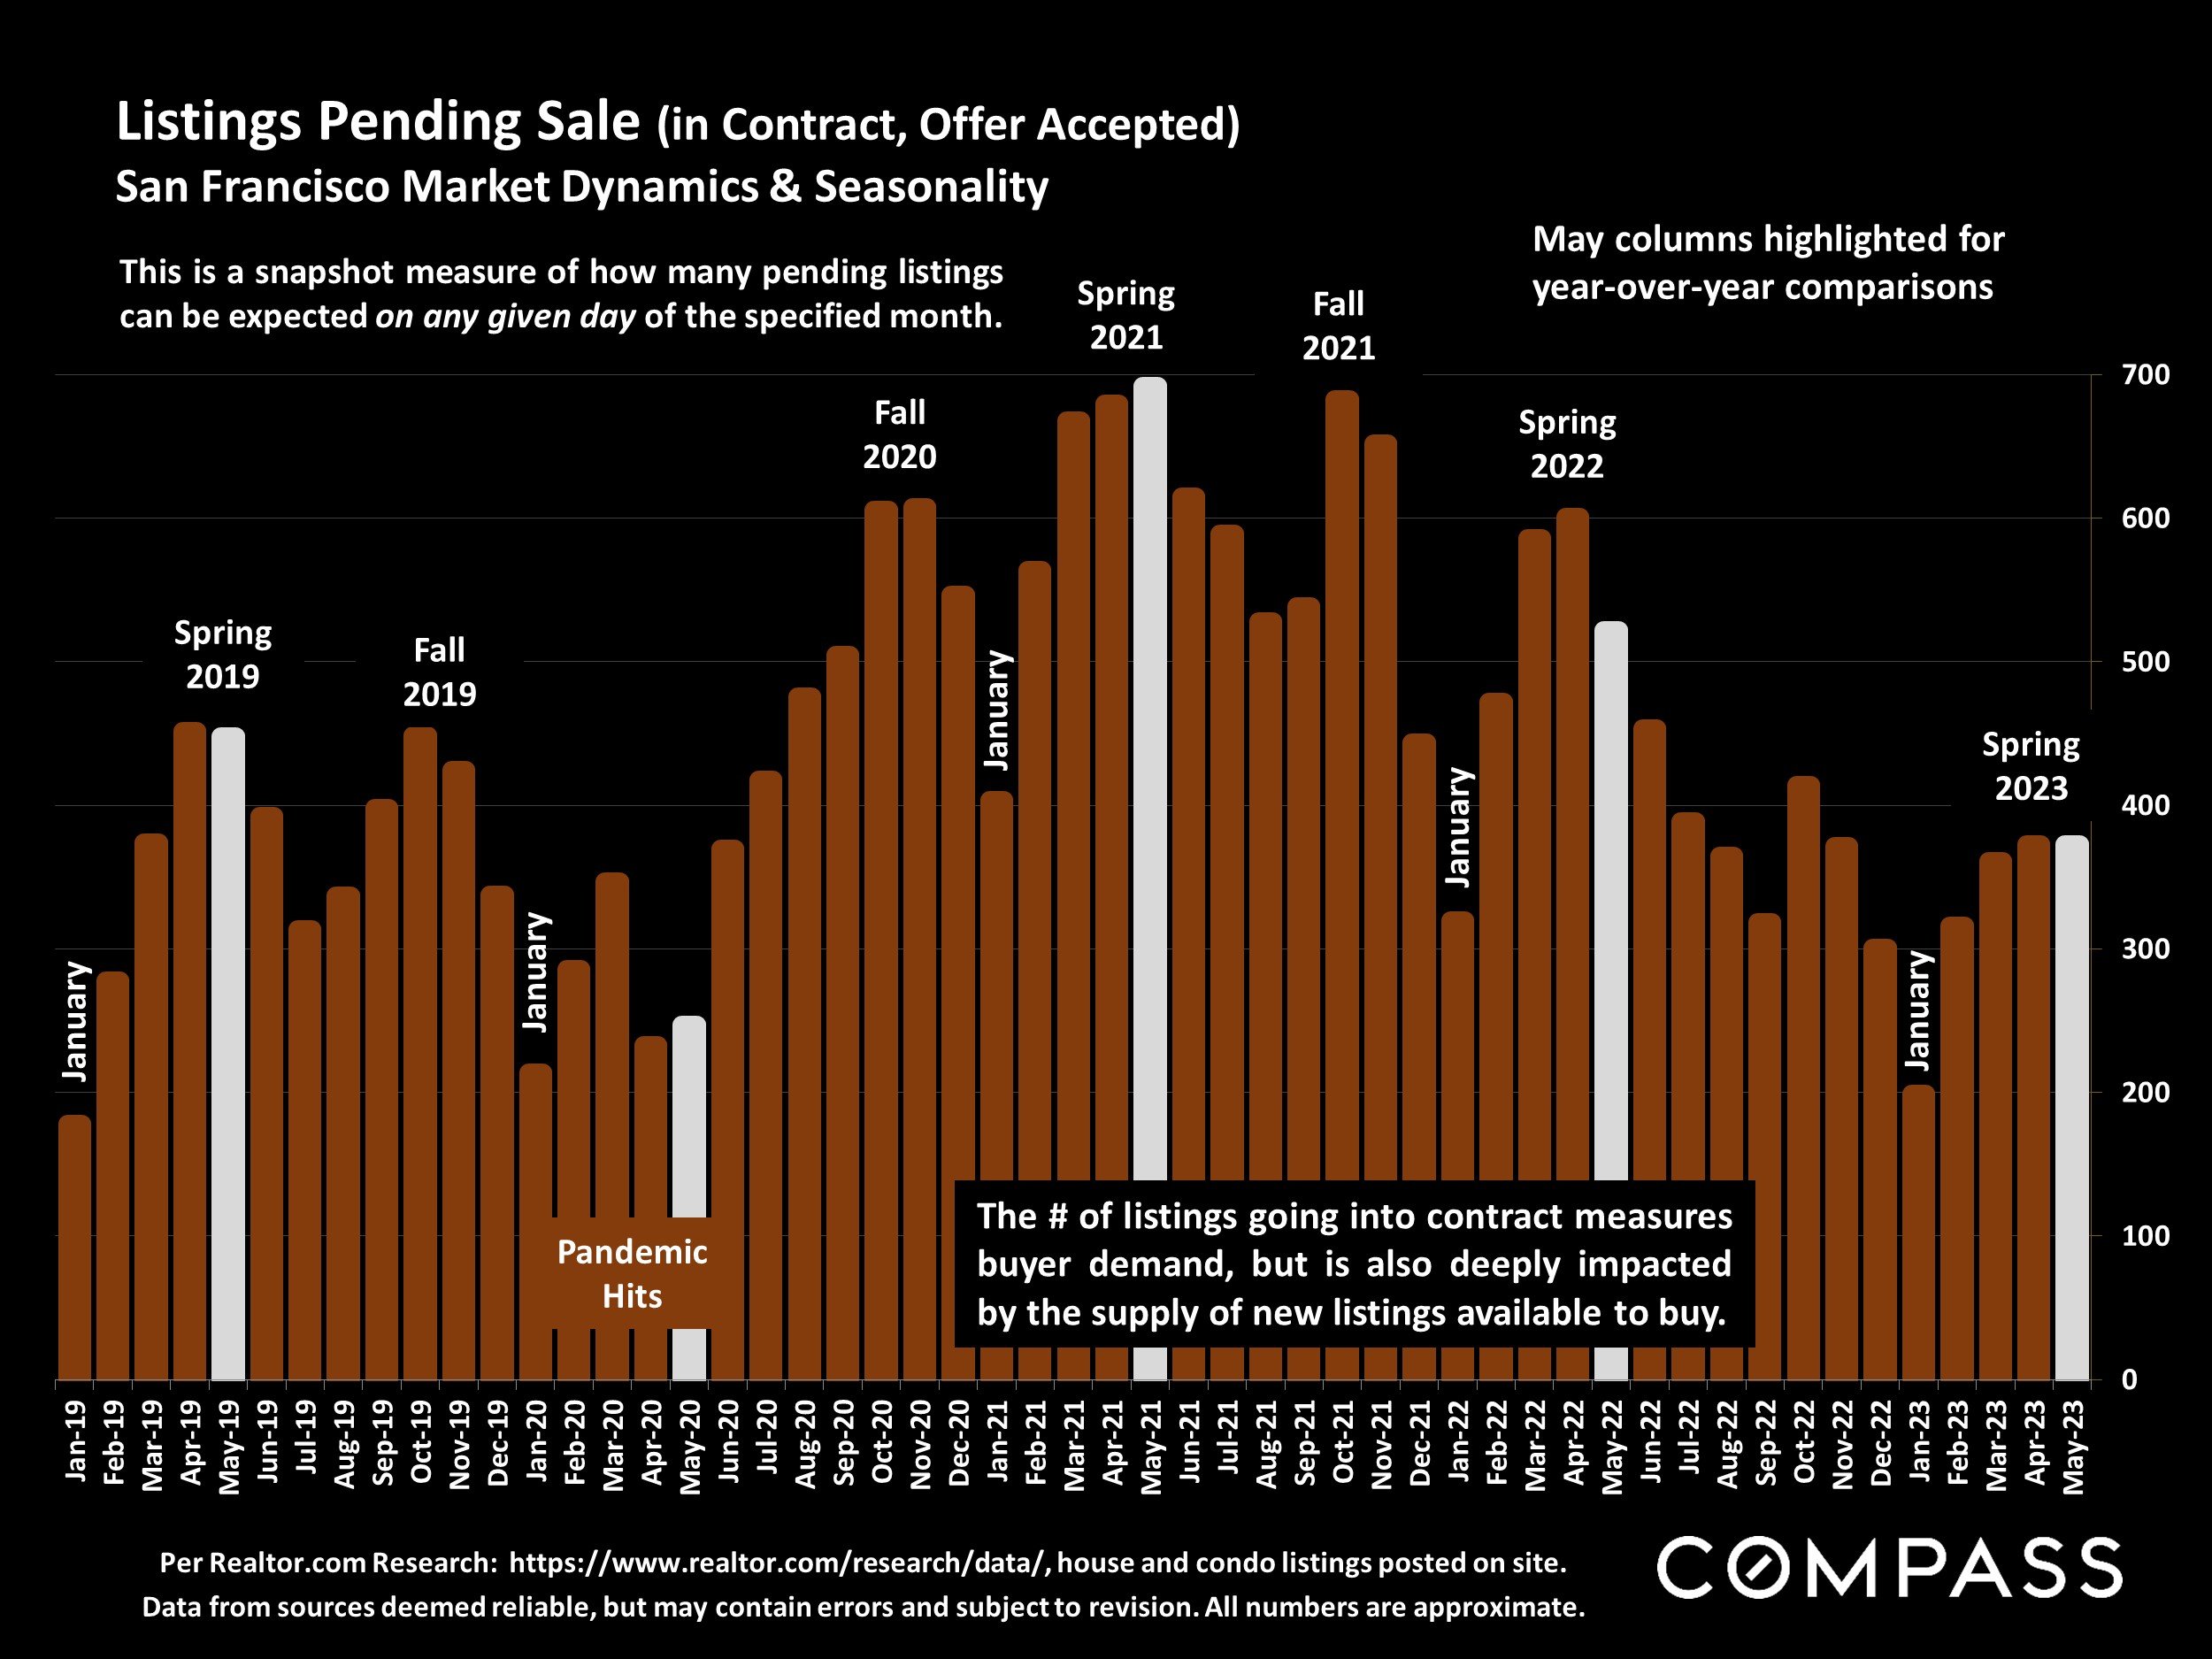
Per Realtor.com Research: https://www.realtor.com/research/data/, house and condo listings posted on site. Data from sources deemed reliable, but may contain errors and subject to revision. All numbers are approximate.
This is a snapshot measure of how many pending listings can be expected on any given day of the specified month. The number of listings going into contract measures buyer demand, but is also deeply impacted by the supply of new listings available to buy.
Monthly Home Sales Volume
San Francisco Market Dynamics & Seasonality

Sales of houses, condos, townhouses reported to NorCal MLS Alliance, per Infosparks. Data from sources deemed reliable but may contain errors and subject to revision. Last month estimated based on available information and may change with late reported sales. All numbers approximate.
Year over year, May 2023 sales volume was down about 35%. Sales in one month mostly reflect accepted-offer activity in the previous month.
San Francisco Higher-Price Home Sales
Homes Selling for $3 Million+ — Houses, condos, co-ops, townhouses, TICs

Sales reported to NorCal MLS Alliance, per Infosparks. Does not include sales unreported to MLS: Not all sales are reported. Data from sources deemed reliable but may contain errors and subject to revision. All numbers approximate, and may change with late-reported activity.
The number of higher-price sales typically ebbs and flows dramatically by season, with spring usually the biggest selling season, and mid-winter the slowest. Sales usually follow the time of offers being accepted by 3 to 5 weeks.
Year over year, May 2023 $3m+ home sales were down 57%.
Price Reductions on Active Listings
San Francisco Market Dynamics & Seasonality
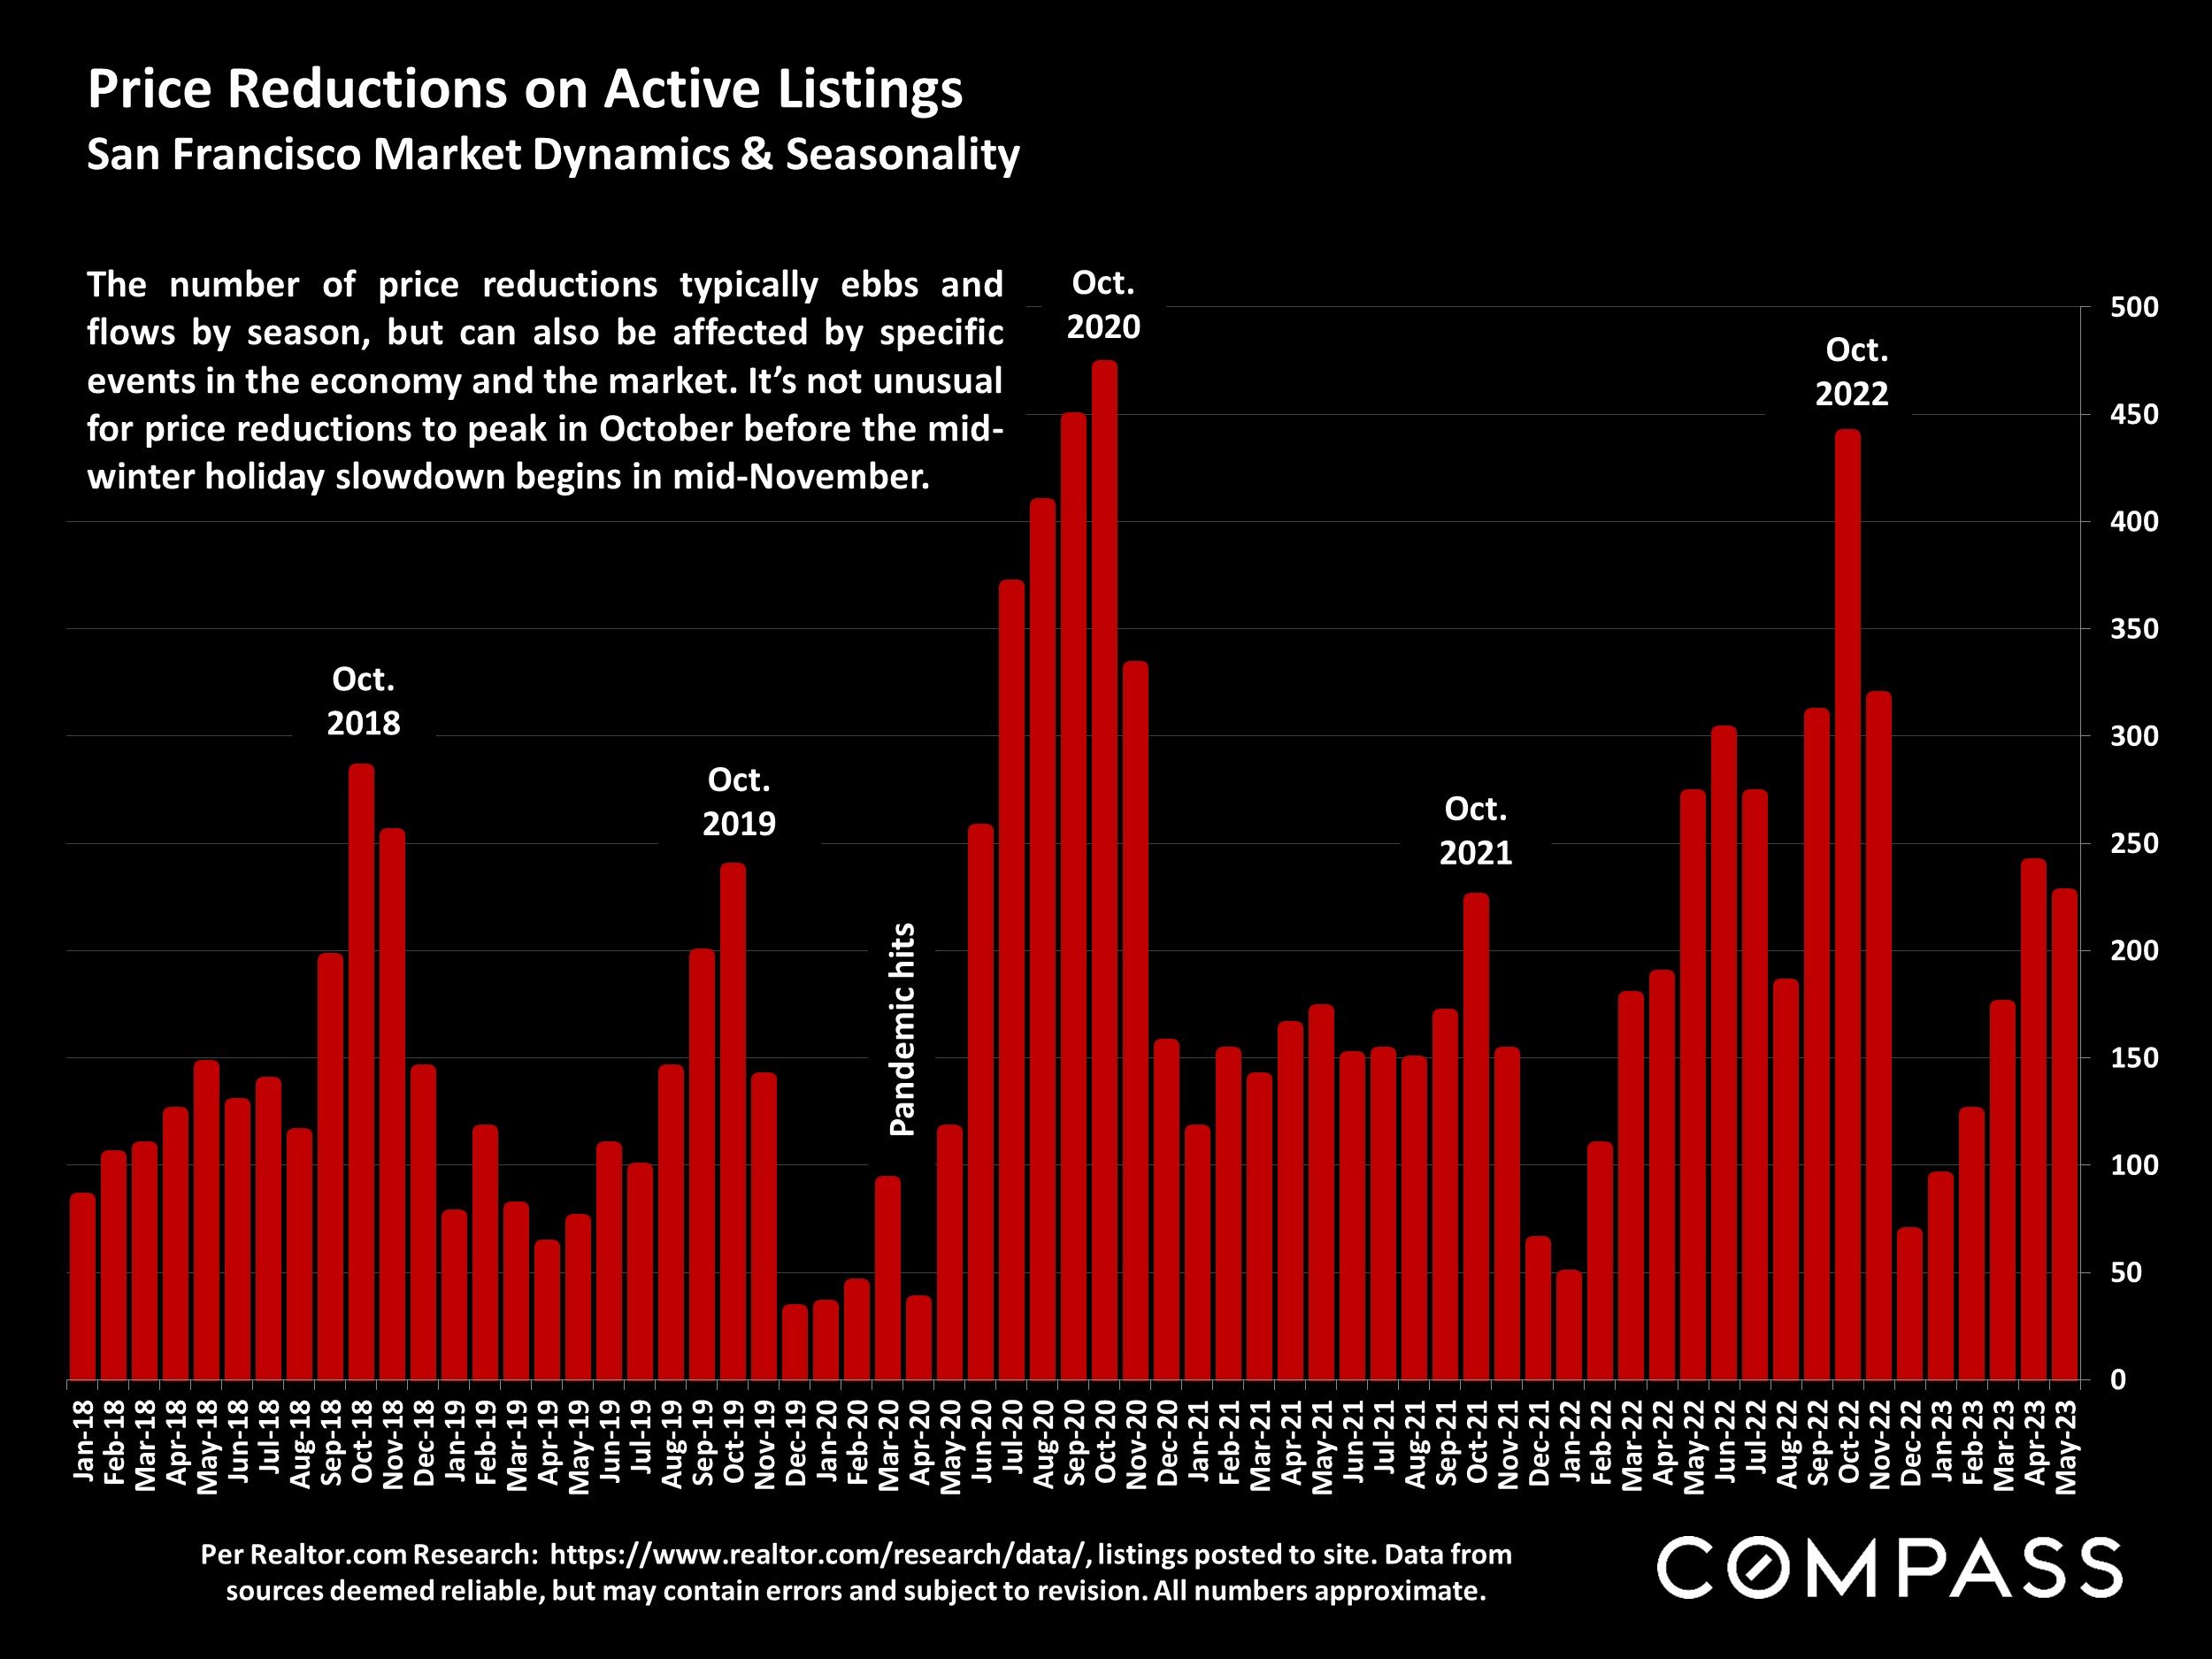
Per Realtor.com Research: https://www.realtor.com/research/data/, listings posted to site. Data from sources deemed reliable, but may contain errors and subject to revision. All numbers approximate.
The number of price reductions typically ebbs and flows by season, but can also be affected by specific events in the economy and the market. It’s not unusual for price reductions to peak in October before the mid-winter holiday slowdown begins in mid-November.
Average Days on Market – Speed of Sale
San Francisco Market Dynamics & Seasonality
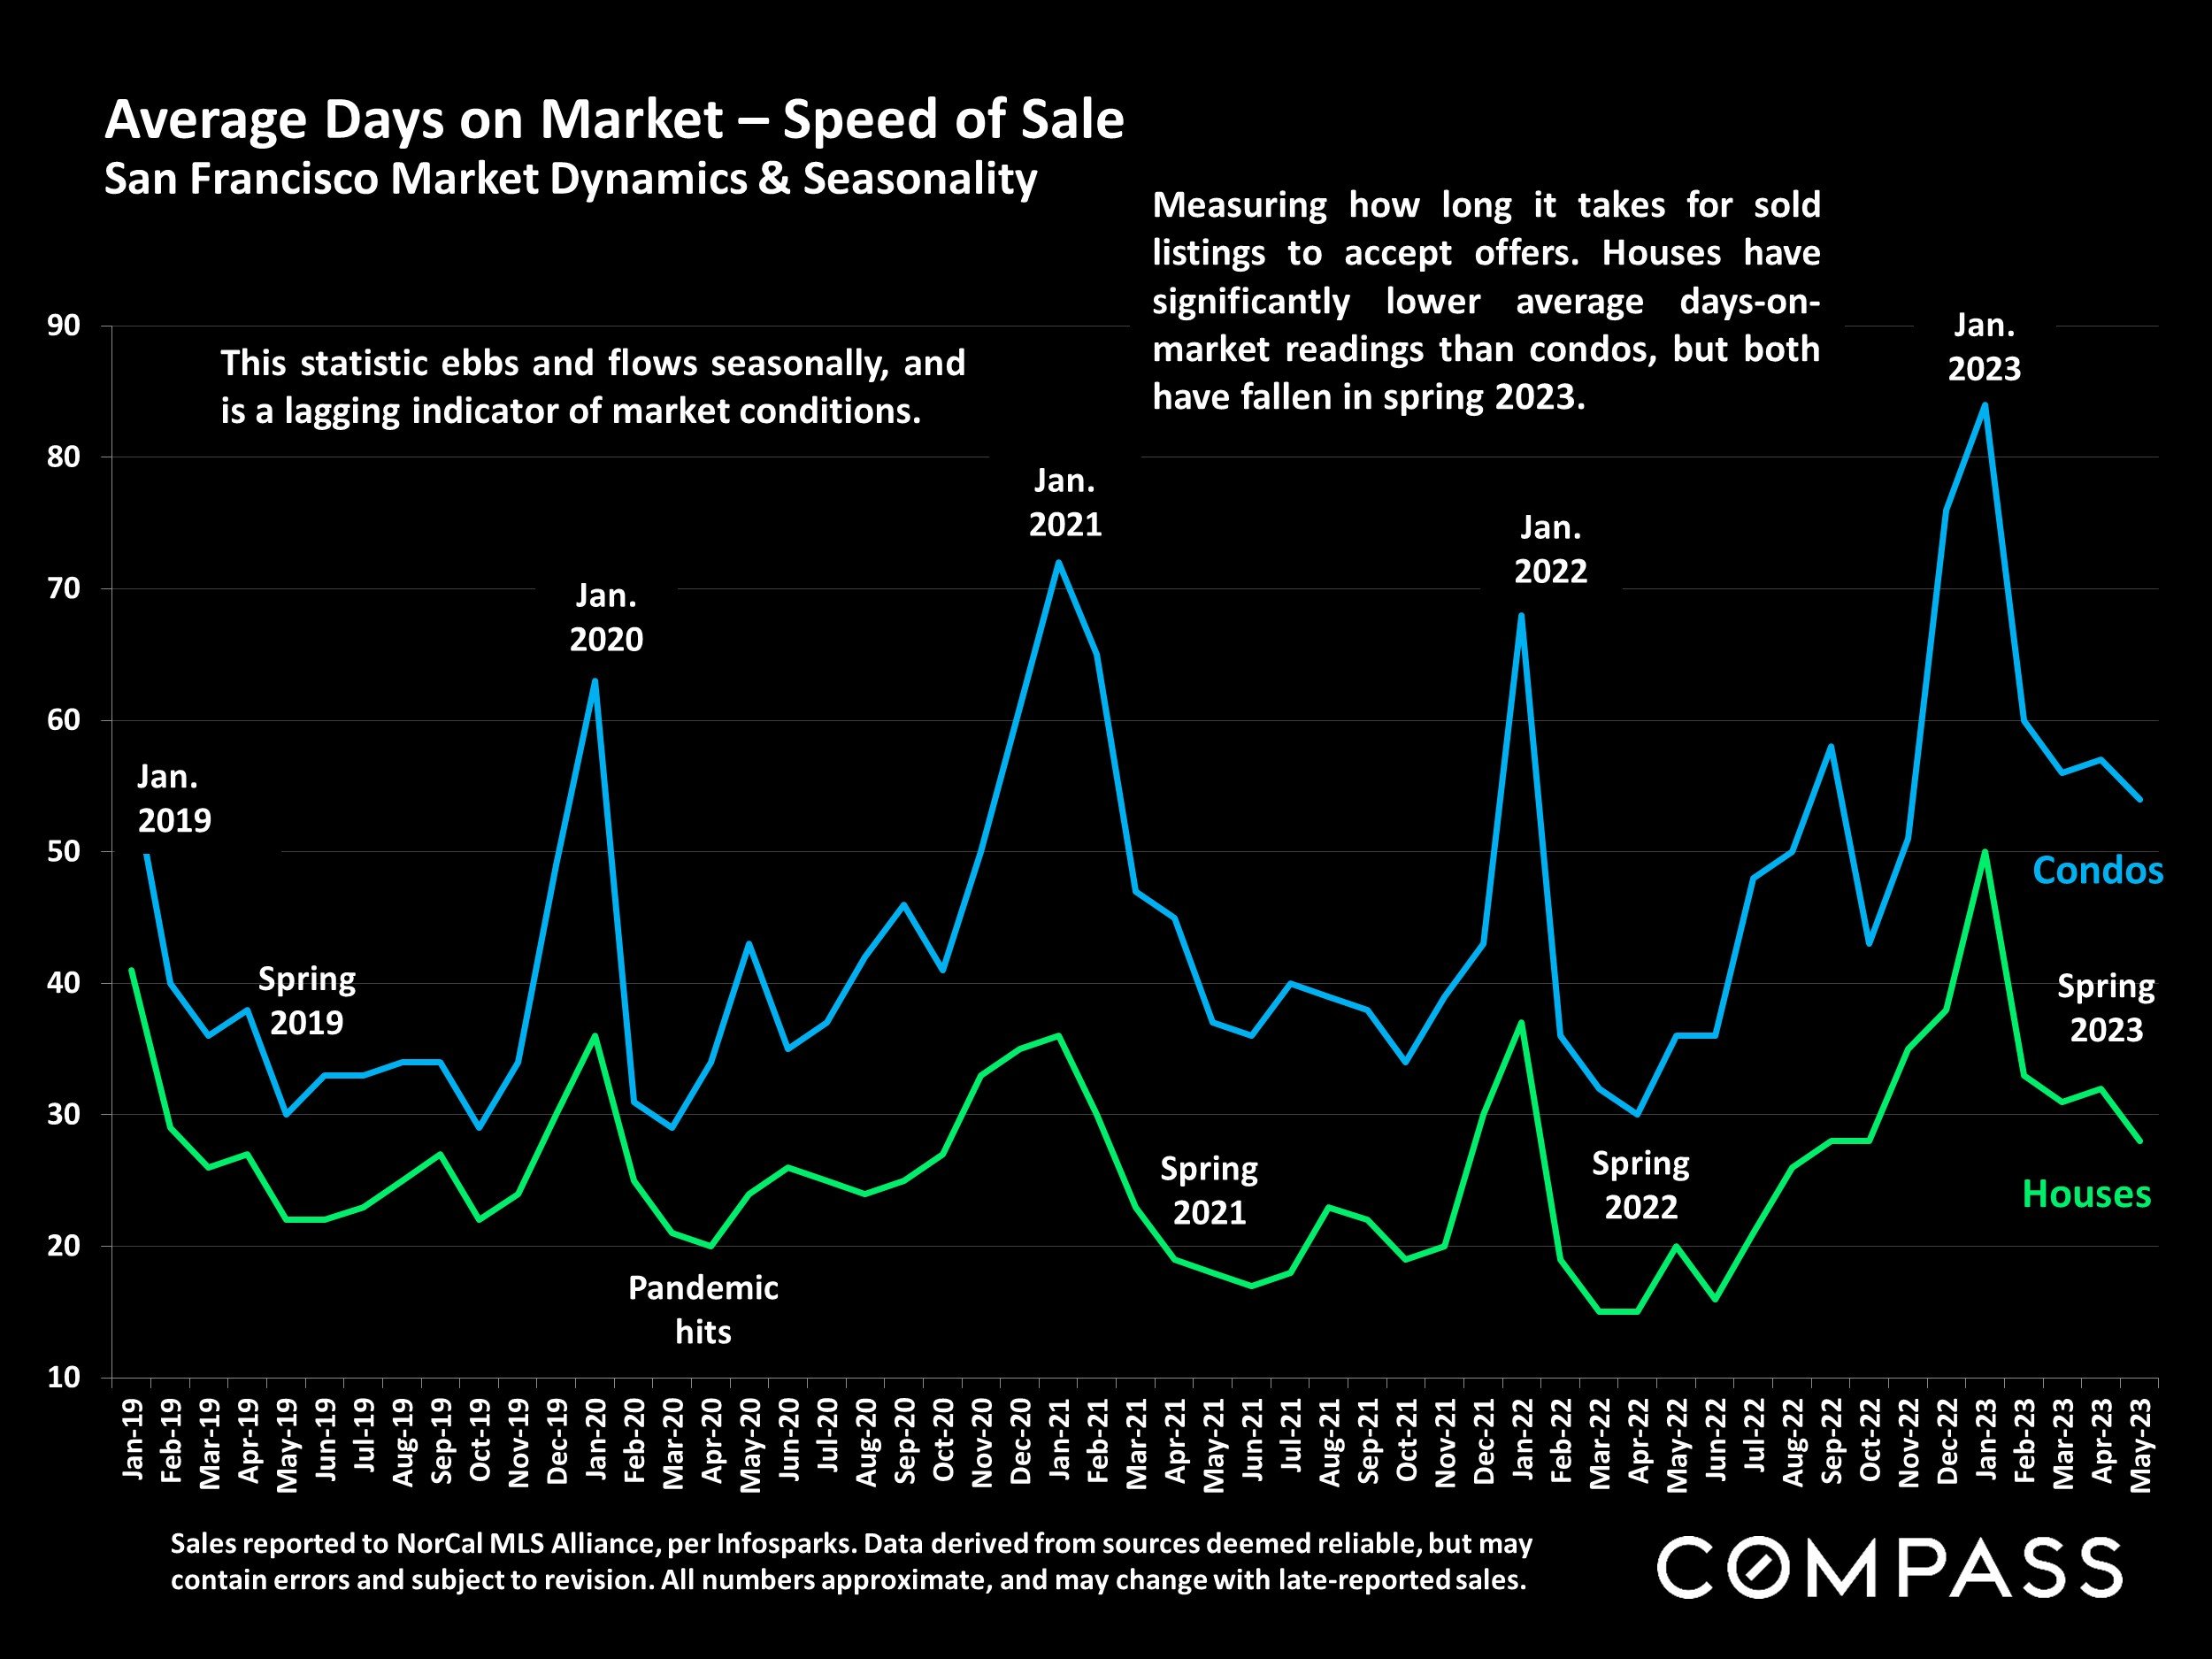
Sales reported to NorCal MLS Alliance, per Infosparks. Data derived from sources deemed reliable, but may contain errors and subject to revision. All numbers approximate, and may change with late-reported sales.
Measuring how long it takes for sold listings to accept offers. Houses have significantly lower average days-on-market readings than condos, but both have fallen in spring 2023.
This statistic ebbs and flows seasonally, and is a lagging indicator of market conditions.
Overbidding List Prices in San Francisco
Percentage of Home Sales Closing over List Price, since 2018

Sales data reported to NORCAL MLS® ALLIANCE, per Infosparks. Reflecting the percentage of sales closing at sales prices over the final list prices. Data from sources deemed reliable, but may contain errors and subject to revision. All numbers are approximate, and may change with late-reported sales.
By property type, the % selling over list price in May 2023 for houses was 63%, and for condos, co-ops and TICs, 41%. Sales in 1 month mostly reflect market dynamics in the previous month. Seasonal ebbs and flows are typical.
Average Sales Price to Original List Price Percentage
San Francisco Over/Under Bidding: Market Dynamics & Seasonality

Sales reported to NorCal MLS Alliance, per Infosparks. Data derived from sources deemed reliable, but may contain errors and subject to revision. All numbers approximate, and may change with late-reported sales.
On average, SF houses are selling well above asking price, and condos slightly below. This statistic fluctuates by season, and is a lagging indicator of market activity 3-6 weeks earlier.
2023 Bay Area Median Home Prices by County
3-Month-Rolling, Median House Sales Prices in January, March & May 2023

*3-month rolling sales reported to NorCal MLS Alliance. Deemed reliable, but may contain errors and subject to revision. All numbers approximate, and may change with late-reported sales. Different sources sometimes calculate median sales price differently.
Median sales price is that price at which half the sales occurred for more and half for less. It is a very general statistic that typically disguises an enormous range of sales prices in the individual underlying sales. It may fluctuate for many reasons other than changes in fair market value. Seasonal fluctuations in median sales prices are common.
Prices still remain below peak prices hit in spring 2022.
Mortgage Interest Rates since February 2023
30-Year Fixed-Rate Loans, Daily Average Readings*
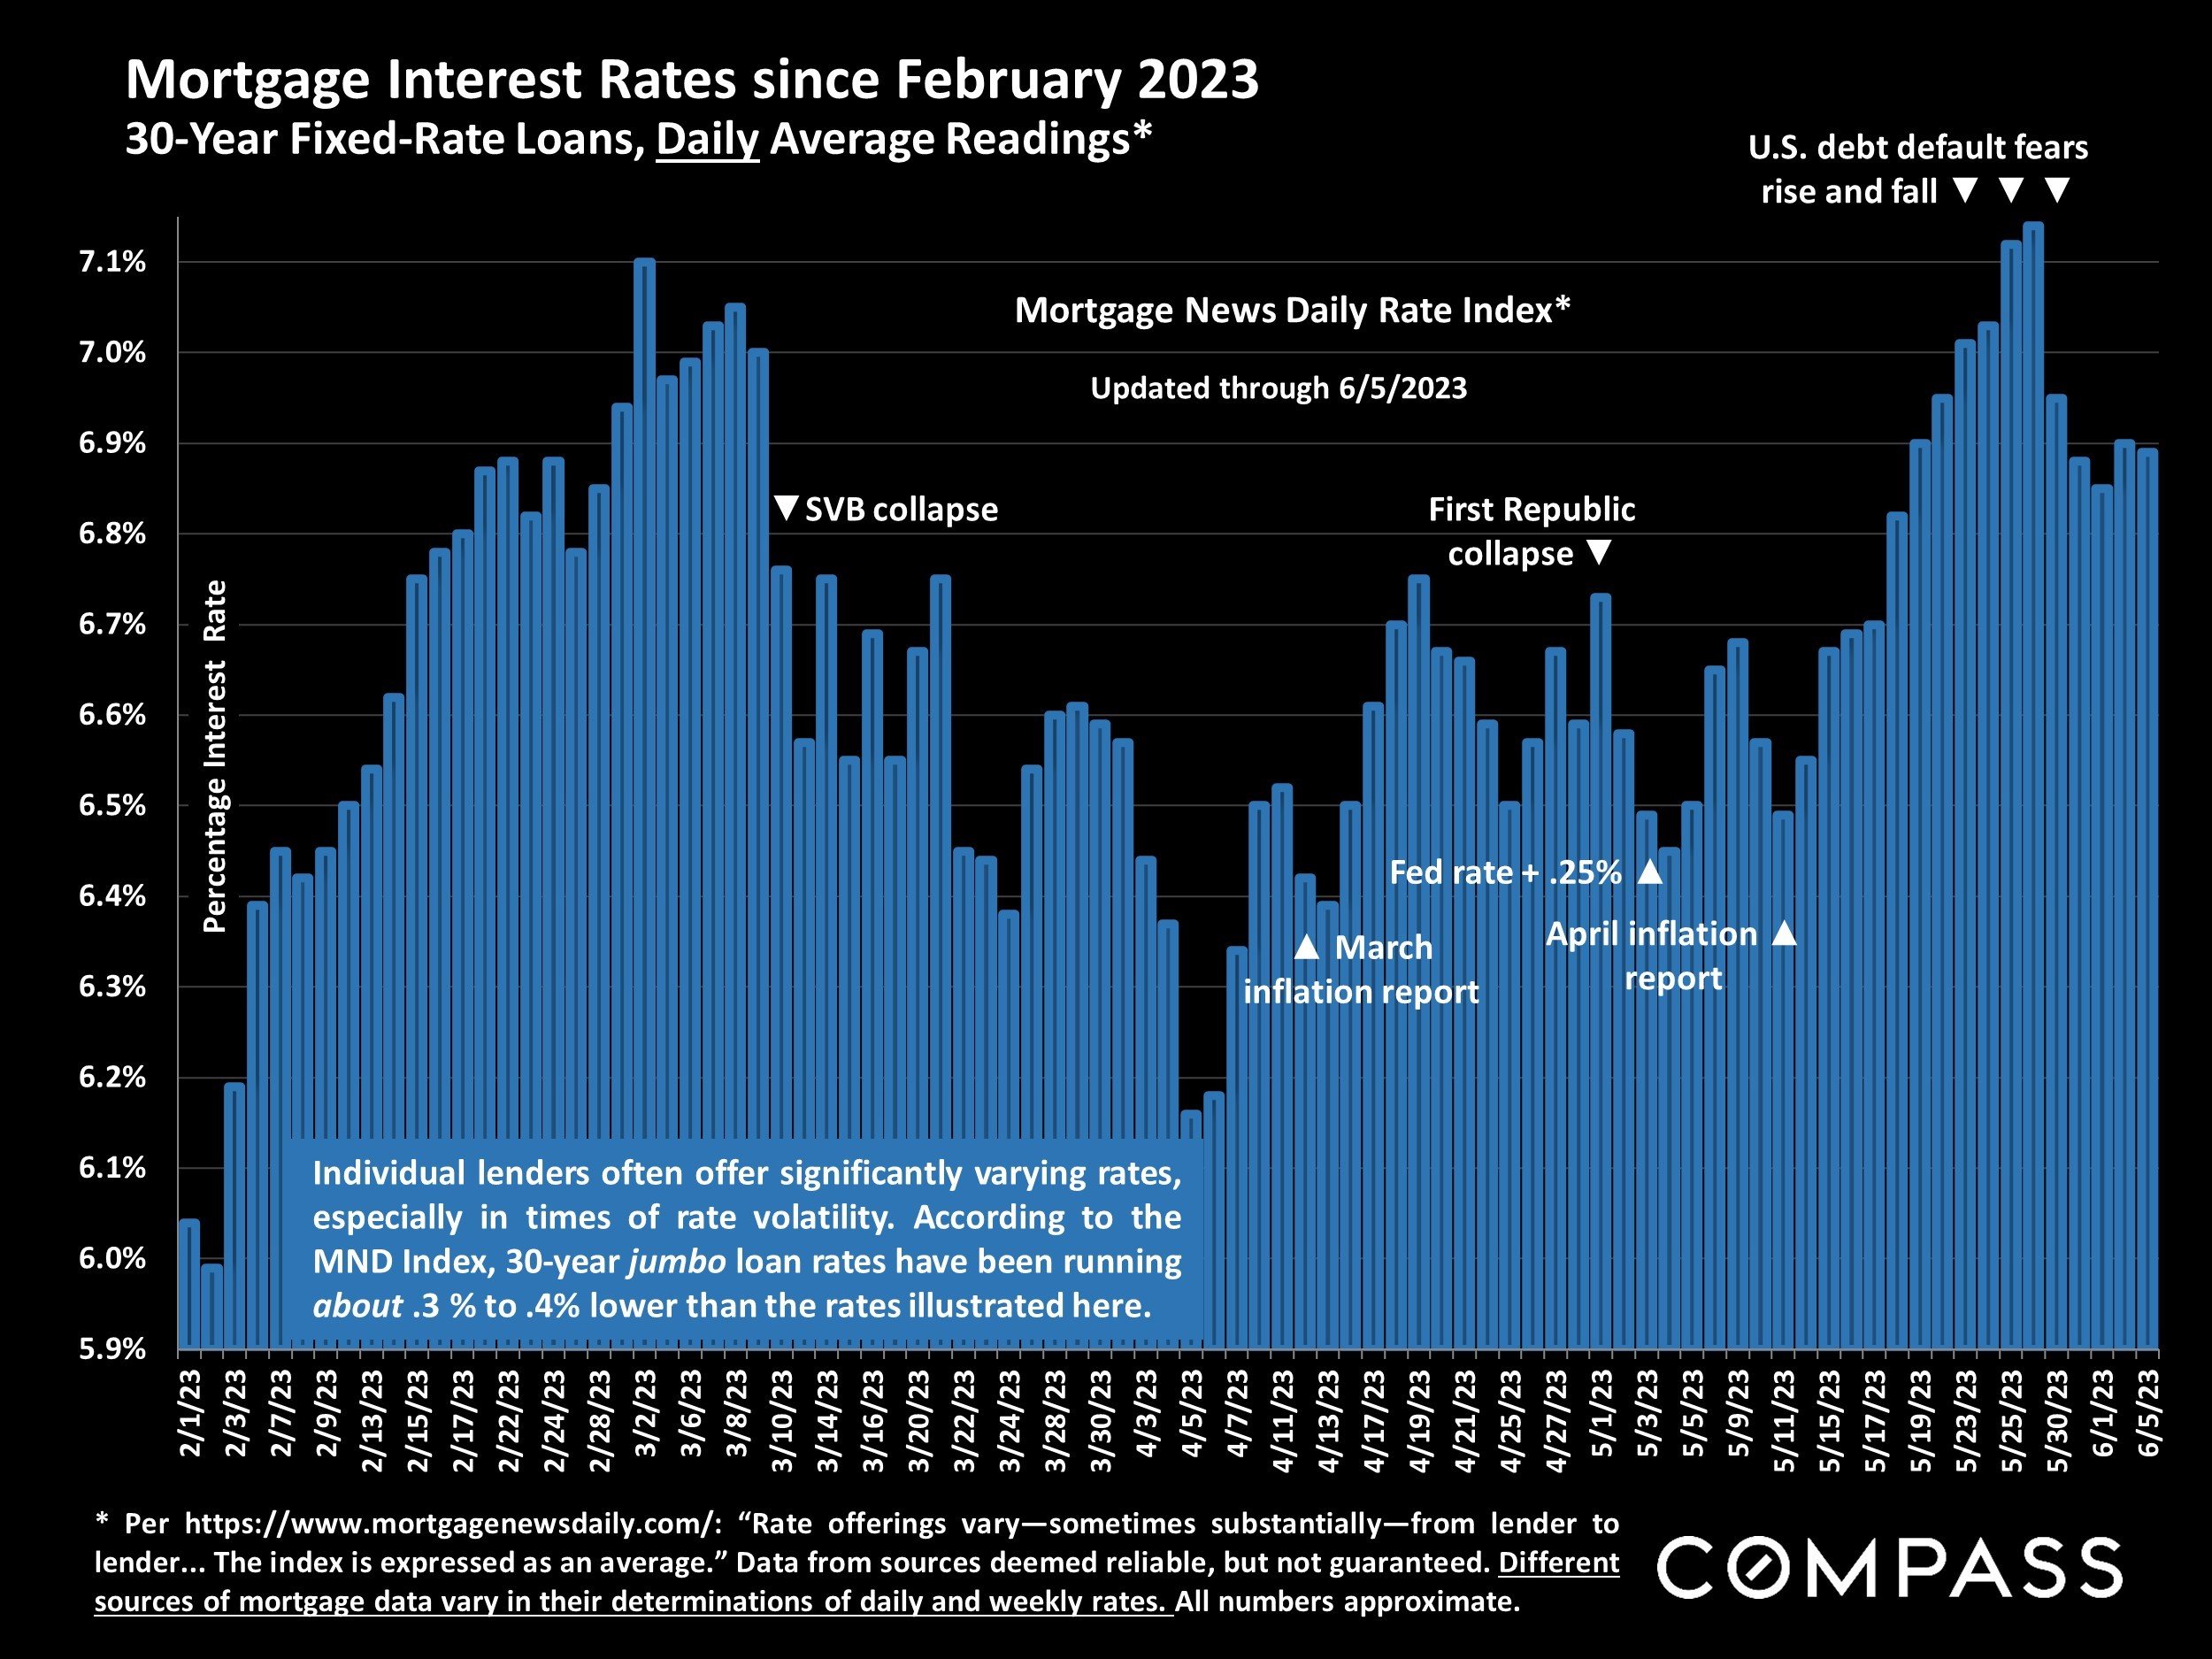
* Per https://www.mortgagenewsdaily.com/: "Rate offerings vary--sometimes substantially-from lender to lender. The index is expressed as an average." Data from sources demned reliable, but not guaranteed. Different sources of mortgage data vary in their determinations of daily and weekly rates. All numbers approximate.
Individual lenders often offer significantly varying rates, especially in times of rate volatility. According to the MND Index, 30-year jumbo loan rates have been running about .3 % to .4% lower than the rates illustrated here.
Housing Units Permitted or Completed in 2022
By County, per CA Dept. of Housing & Community Development*

*https://www.hcd.ca.gov/planning-and-community-development/housing-open-data-tools/housing-element-implementation-and-apr-dashboard. All numbers approximate, may contain errors and subject to revision.
| Accessory Dwelling Units (ADUs) | Permitted | Completed |
|---|---|---|
| Alameda County | 997 | 442 |
| Contra Costa | 433 | 239 |
| Marin County | 177 | 89 |
| Monterey County | 316 | 149 |
| Napa County | 85 | 15 |
| Sacramento County | 417 | 237 |
| San Francisco | 342 | 254 |
| San Mateo County | 699 | 343 |
| Santa Clara County | 763 | 306 |
| Santa Cruz County | 164 | 116 |
| Solano County | 73 | 24 |
| Sonoma County | 309 | 219 |
Statistics are generalities, essentially summaries of widely disparate data generated by dozens, hundreds or thousands of unique, individual sales occurring within different time periods. They are best seen not as precise measurements, but as broad, comparative indicators, with reasonable margins of error. Anomalous fluctuations in statistics are not uncommon, especially in smaller, expensive market segments. Last period data should be considered estimates that may change with late-reported data. Different analytics programs sometimes define statistics – such as “active listings,” “days on market,” and “months supply of inventory” – differently: what is most meaningful are not specific calculations but the trends they illustrate. Most listing and sales data derives from the local or regional multi-listing service (MLS) of the area specified in the analysis, but not all listings or sales are reported to MLS and these won’t be reflected in the data. “Homes” signifies real-property, single-household housing units: houses, condos, co-ops, townhouses, duets and TICs (but not mobile homes), as applicable to each market. City/town names refer specifically to the named cities and towns, unless otherwise delineated. Multi-county metro areas will be specified as such. Data from sources deemed reliable, but may contain errors and subject to revision. All numbers to be considered approximate.
Many aspects of value cannot be adequately reflected in median and average statistics: curb appeal, age, condition, amenities, views, lot size, quality of outdoor space, “bonus” rooms, additional parking, quality of location within the neighborhood, and so on. How any of these statistics apply to any particular home is unknown without a specific comparative market analysis.
Median Sales Price is that price at which half the properties sold for more and half for less. It may be affected by seasonality, “unusual” events, or changes in inventory and buying trends, as well as by changes in fair market value. The median sales price for an area will often conceal an enormous variety of sales prices in the underlying individual sales.
Dollar per Square Foot is based upon the home’s interior living space and does not include garages, unfinished attics and basements, rooms built without permit, patios, decks or yards (though all those can add value to a home). These figures are usually derived from appraisals or tax records, but are sometimes unreliable (especially for older homes) or unreported altogether. The calculation can only be made on those home sales that reported square footage.
Compass is a real estate broker licensed by the State of California, DRE 01527235. Equal Housing Opportunity. This report has been prepared solely for information purposes. The information herein is based on or derived from information generally available to the public and/or from sources believed to be reliable. No representation or warranty can be given with respect to the accuracy or completeness of the information. Compass disclaims any and all liability relating to this report, including without limitation any express or implied representations or warranties for statements contained in, and omissions from, the report. Nothing contained herein is intended to be or should be read as any regulatory, legal, tax, accounting or other advice and Compass does not provide such advice. All opinions are subject to change without notice. Compass makes no representation regarding the accuracy of any statements regarding any references to the laws, statutes or regulations of any state are those of the author(s). Past performance is no guarantee of future results.