June 2025 Market Report

Photo by Leighann Blackwood on Unsplash
Ongoing volatility in political/economic conditions – particularly the plunge in stock markets in April, which affected May home sales – took some of the wind out of the spring real estate market, usually the most dynamic of the year. Uncertainty regarding the economy and the possible implications for personal financial circumstances understandably made a proportion of buyers and sellers hesitant about moving forward. Still, while most Bay Area markets slowed year over year, there was nothing approximating a crash. As inventory continued to rise, sales activity failed to keep pace, resulting in lower absorption rates (a comparison of demand vs. supply). With more homes for sale and somewhat less competition between buyers, overbidding generally declined, time-on-market ticked up, and price reductions increased. Most counties saw small year-over-year declines in their 3-month-rolling median home sales prices.
But many of these indicators of slowdown did not occur in San Francisco, which had one of the Bay Area’s strongest markets in May: SF median sales prices rose, inventory remained steady, and both the number of listings going into contract and the % of sales sold for over asking price increased.
It’s worth noting that virtually all May sales were negotiated before the May 12 reversal of China-tariff policies, which triggered an enormous rebound in the stock market. Unlike stocks, home sales don’t reflect shifts in market conditions instantly – there is typically a 3-to-6-week lag between offer acceptance and close of sale – and there are indications that the effects of April’s negative economic gyrations on buyer and seller psychology in the Bay Area may already be fading.
The speed and scale of developments in 2025 – tariffs, stock markets, inflation, interest rates, consumer confidence, tax law, national debt concerns, international relations, what the Fed decides, and so on – have made it challenging for real estate market reports to keep up. As always, real estate trends vary locally. The rest of this report focuses on the specifics of the San Francisco market.
Report created in good faith using data from sources deemed reliable but may contain errors and subject to revision. Last period figures are preliminary estimates based on data available early in the following month. All numbers approximate, and may change with late-reported activity.
“San Francisco’s beleaguered downtown continues to show signs of recovery, while the economy copes with continuing contraction in the tech industry, and accumulating signs of a broader slowdown nationally…the city’s unemployment rate fell to 3.7%…Most indicators of downtown activity trended up: MUNI Metro and downtown BART ridership recovery in April both reached post-pandemic highs, as did foot traffic…Apartment asking rents also continued their notable growth.” — Status of the San Francisco Economy, May 2025, SF Offices of the Controller & Economic Analysis
Financial Markets, 2024 – 2025 YTD
Percentage Increases in S&P 500 & Nasdaq since 1/2/24

Data per MarketWatch.com. Data from source deemed reliable but may contain errors and subject to revision. Financial market values change constantly and all numbers to be considered approximate. Financial markets have been prone to significant volatility.
Large changes in stock markets can dramatically affect household wealth, consumer confidence and housing markets. The first months of 2025 have been particularly volatile.
Mortgage Interest Rates in 2023-2025 YTD
30-Year Conforming Fixed-Rate Loans, Weekly Average Readings*

*Freddie Mac (FHLMC), 30-Year Fixed Rate Mortgage Weekly Average: https://www.freddiemac.com/pmms. Data from sources deemed reliable. Different sources of mortgage data sometimes vary in their determinations of daily and weekly rates. Data from sources deemed reliable but may contain errors. All numbers approximate.
Per Freddie Mac (FHLMC), on June 5, 2025, the weekly average, 30-year, conforming-loan interest rate fell slightly to 6.85%.
Mortgage interest rates have not seen the hoped for declines since spring began.
San Francisco HOUSE Price Trends since 1990
Monthly Median House Sales Prices, 3-Month Rolling

3-month rolling average of monthly median sales prices for “existing” houses, per CA Association of Realtors or 3-month rolling median per NorCal MLS Alliance. Analysis may contain errors and subject to revision. All numbers approximate, and may change with late-reported sales.
The 3-month-rolling median house sales price rose moving deeper into spring, and in May 2025 was up about 4% year-over-year.
Median sales price is that price at which half the sales occurred for more and half for less. It is a very general statistic, disguising an enormous range of sales prices in the underlying sales. It is often affected by other factors besides changes in fair market value. Monthly and seasonal fluctuations are common, which explain many of the regular ups and downs in this chart. More often than not, median sales prices peak for the year in spring.
San Francisco CONDO Price Trends since 2005
Median Condo Sales Price, 3-Month Rolling

3-month rolling median condo sales prices reported to NorCal MLS Alliance, per Infosparks. Analysis may contain errors and subject to revision. All numbers approximate, and may change with late-reported sales.
The 3-month-rolling median condo sales price in May 2025 jumped from April, and rose 5.7% year-over-year – but large short-term spikes should be treated cautiously until substantiated over the longer term.
Generally speaking, over the last 5-6 years, Bay Area median condo sales prices have not seen the appreciation rates common in house markets.
Median sales price is that price at which half the sales occurred for more and half for less. It is a very general statistic, often affected by other factors besides changes in fair market value. Monthly and seasonal fluctuations are common, and longer-term trends are more meaningful than short-term changes.
San Francisco Value Trends since 2005
3-Month-Rolling, Median Dollar per Square Foot Values*

*3-month rolling median house sales values reported to NorCal MLS Alliance, per Infosparks. Analysis may contain errors and subject to revision. All numbers approximate, and may change with late-reported sales.
Until the pandemic, the median $/sq.ft. value for condos (green columns) ran substantially higher than for houses (white line), but that is no longer the case.
Median $/sq.ft. value is a general statistic, disguising an enormous range of values in the underlying sales. It is often affected by other factors besides changes in fair market value. Monthly and seasonal fluctuations are common, which explain many of the regular ups and downs in this chart.
San Francisco CONDO Prices: Downtown vs. Non-Downtown
12-Month-Rolling, Median 2-Bedroom Condo Sales Prices since 2005*

*12-month rolling median condo sales values reported to NorCal MLS Alliance, per Infosparks. Analysis may contain errors and subject to revision. Does not include new-project sales unreported to MLS. All numbers approximate, and may change with late-reported sales.
Comparing median 2-bedroom condo sales prices in the greater Downtown/South of Market/Civic Center area (the center of large-project, new-condo construction, office buildings and high-tech employment) – the white line – with the rest of San Francisco (mostly smaller, older buildings, in less urban environments) – the green line.
Median sales prices also vary widely within these two broad regions.
12-month-rolling sales data smooths the median sales price trend lines and removes seasonality from the analysis, but it can lag short-term changes.
2025 YTD Home Sales by Price Segment*
San Francisco Residential Market

*2025 sales reported to NorCal MLS Alliance by 5/27/25. Not all sales are reported to MLS. Data from sources deemed reliable, but may contain errors and subject to revision. All numbers approximate. New sales are reported constantly.
Approximately 1830 sales were reported during the period. Sales rose about 5% over the same period of 2024.
18% of sales of $5 million+ were condos and co-ops.
83% of sales under $1,000,000 were condos, co-ops and TICs.
53% of sales of $1m - $1,499,999 were condos, co-ops and TICs.
Sales by Property Type:
House 47%
Condo 45.5%
TIC 5.5%
Co-op 1.5%
Townhouse less than 1%
Breakdown by price segment:
Under $1,000,000: 27%
$1,000,000-$1,499,999: 28%
$1,500,000-$1,999,999: 18%
$2,000,000-$2,999,999: 16%
$3,000,000$3,999,999: 6%
$4,000,00-$4,999,999: 2%
$5,000,000+: 3%
Months-Supply-of-Inventory (MSI), by Price Segment*
San Francisco: Supply vs. Demand

*Calculated using the number of active/coming soon listings posted to NorCal MLS Alliance on 6/1/25 vs. the last 12 months’ rate of sales. Not all listings and sales are posted to MLS. Data from sources deemed reliable, but may contain errors and subject to revision. All numbers approximate. How this analysis applies to any particular property is unknown.
MSI compares the supply of homes for sale to buyer demand, measuring the number of months it would take to sell the quantity of active listings on the market on 6/1/25 at the last 12 months’ rate of sale: The lower the MSI reading, the higher the demand as compared to the supply of listings for sale.*
By property type, MSI was 2.1 months for houses, 4.4 months for condos, 4.8 months for TICs, and 5.4 months for co-ops: The house market has been by far the strongest market segment in recent years.
It’s not unusual for the most expensive price segments to have the highest MSI readings.
Breakdown by price segment:
Under $1,000,000: 5.0 (Sales under $1 million are dominated by condos and TICs)
$1,000,000 -$1,999,999: 2.4
$2,000,000 -$2,999,999: 2.6
$3,000,000 -$4,999,999: 2.9
$5,000,000 -$9,999,999: 7.1
$10 Million+: 12.0
New Listings Coming on Market
San Francisco Market Dynamics & Seasonality*

*Per Realtor.com Research: https://www.realtor.com/research/data/, listings posted on site. Data from sources deemed reliable, but may contain errors and subject to revision. May not include “coming-soon” listings. All numbers should be considered approximate.
The number of new listings in May 2025 declined from April, but was basically unchanged year over year.
Active & Coming-Soon Listings on 1st of Month*
San Francisco Homes Market

* Houses, condos, co-ops, TICs, townhouses: Active/Coming-Soon listings posted to NorCal MLS Alliance. Does not include new-project condos not listed on MLS. Data from sources deemed reliable, but may contain errors and subject to revision. All numbers approximate. The # of active listings changes constantly.
The number of listings for sale on 6/1/25 ticked down from the previous month, but ticked up year over year. 30.5% of listings were houses, 59% condos, 7% TICs, 2.5% co-ops, and 1% townhouses.
The # of active listings on a given day is affected by 1) the # of new listings coming on market, 2) how quickly buyers put them into contract, 3) the sustained heat of the market over time, and 4) sellers pulling their hoes off the market without selling.
Listings Accepting Offers (Going into Contract)
San Francisco Market Dynamics & Seasonality

Residential activity reported to MLS, per Broker Metrics. Will not include new-project condo activity not reported to MLS. Data from sources deemed reliable, but may contain errors and subject to revision. All numbers approximate, and may change with late-reported activity.
The number of listings going into contract in May 2025 increased from April and rose about 10% year over year.
Monthly Home Sales Volume*
San Francisco Market Dynamics & Seasonality

*Sales of houses, condos, townhouses reported to NorCal MLS Alliance, per Infosparks. Does not include new-project condo sales unreported to MLS. Data from sources deemed reliable but may contain errors and subject to revision. Last month estimated based on available information and may change with late reported sales. All numbers approximate.
The number of sales in May 2025 increased slightly from April, but declined about 6% to 7% year over year.
House sales made up approximately 49% of May 2025 sales, and condos, co-ops and TICs made up about 51%.
Sales in one month mostly reflect accepted offers in the previous month.
Luxury Home Sales, $5 Million+*
San Francisco Market Dynamics & Seasonality

*Sales of houses, condos, co-ops, townhouses reported to NorCal MLS Alliance, per Infosparks. Does not include new-project condo sales unreported to MLS. Data from sources deemed reliable but may contain errors and subject to revision. Last month may change with late reported sales. All numbers approximate.
$5 million home sales in May 2025 rose from April and year over year.
The luxury home market is fiercely seasonal: High sales activity in spring, then slowing in summer, rebounding in fall, and plunging in mid-winter.
Sales in one month mostly reflect accepted offers in the previous month.
San Francisco Luxury HOUSE Sales*
Houses Selling for $5 Million+ since 2020

*House sales reported to NorCal MLS Alliance, per Infosparks. Does not generally include listings and sales unreported to MLS. Data from sources deemed reliable but may contain errors and subject to revision. All numbers approximate, and may change with late-reported activity.
Luxury house sales rebounded in May 2025 to the highest monthly count in 3 years.
The luxury home market is fiercely seasonal: High sales activity in spring, then slowing in summer, rebounding in fall, and plunging in mid-winter.
San Francisco Luxury CONDO & CO-OP Sales*
Units Selling for $2.5 Million+ since 2019

*Sales of condos, co-ops, townhouses & TICs reported to NorCal MLS Alliance, per Infosparks. Does not include sales unreported to MLS, such as some new-project condos. Data from sources deemed reliable but may contain errors and subject to revision. All numbers approximate, and may change with late-reported activity.
After soaring in April 2025, sales dropped back down in May.
The luxury home market is typically very seasonal in nature: High sales activity in spring, then slowing in summer, rebounding in fall, and dropping in mid-winter.
$5 Million+ Home Listings & Sales, by Bay Area County*
Bay Area Luxury Home Market, Supply vs. Demand

*As reported to NorCal MLS Alliance. Active/Coming Soon Homes 6/1/25; 12 months sales through late May 2025. Not all luxury home listings or sales are posted to MLS. Data from sources deemed reliable but may contain errors and subject to revision. All numbers approximate, and change constantly.
County supply vs. demand dynamics for these expensive homes are reflected in the ratio of active listings to 12 months’ sales: Very low ratios, such as in Santa Clara (30%) and San Mateo (45%) signify strong demand compared to the supply of listings for sale; very high ratios, such as in Sonoma (293%) and Napa (247%), signify strong buyer’s markets. Other Bay Area county markets range from stronger (SF with a 68% ratio) to weaker (Santa Cruz, 177%) between these 2 extremes.
San Mateo and Santa Clara, the 2 Silicon Valley Counties most affected by the AI boom, dominate $5 million+ sales.
In Santa Cruz, Alameda, Sonoma, Napa, and Contra Costa Counties, the “luxury” home price threshold typically begins at $3 million. $5 million+ would be considered “ultra-luxury” homes here.
Price Reductions on Active Listings
San Francisco Market Dynamics & Seasonality

Per Realtor.com Research: https://www.realtor.com/research/data/, listings posted to site. Data from sources deemed reliable, but may contain errors and subject to revision. All numbers approximate.
The number of price reductions typically ebbs and flows by season, but can also be affected by specific events in the economy and the market. The number of price reductions in May 2025 rose 17% year over year. (Most other Bay Area Counties have seen much larger increases in spring 2025.)
Overbidding List Prices in San Francisco
Percentage of Home Sales Closing over List Price

Sales data reported to NORCAL MLS® ALLIANCE, per Infosparks. Reflecting the percentage of sales closing at sales prices over the final list prices. Data from sources deemed reliable, but may contain errors and subject to revision. All numbers are approximate, and may change with late-reported sales.
Overbidding is generally caused by buyer competition for new listings. The overall overbidding percentage in the latest month was 62% of sales, but for houses alone, it was 80%, and for condos, 45%.
This statistic fluctuates according to seasonal demand trends, and is a lagging indicator of market activity 3-6 weeks earlier.
Average Sales Price to Original List Price Percentage
San Francisco Over/Under Bidding: Market Dynamics & Seasonality

Sales reported to NorCal MLS Alliance, per Infosparks. Data derived from sources deemed reliable, but may contain errors and subject to revision. All numbers approximate, and may change with late-reported sales.
This chart illustrates the average Sales Price to Original List Price Percentage for all residential sales. But overbidding has been much more common and dramatic for house sales than for condo sales: For houses alone, the average was 12% above list price, and for condos, 1% above list price.
This statistic can be distorted by strategic underpricing strategies by listing agents.
Average Days on Market – Speed of Sale
San Francisco Market Dynamics & Seasonality

Sales reported to NorCal MLS Alliance, per Infosparks. Data derived from sources deemed reliable, but may contain errors and subject to revision. All numbers approximate, and may change with late-reported sales.
This chart illustrates average days on market for all residential sales (34 days in May 2025). But for houses alone, the average was 22 days, and for condos, 45 days.
Measuring how long it takes for sold listings to accept offers. Homes usually sell fastest in spring and early autumn, and slowest in mid-winter. Houses, on average, sell much faster than condos, co-ops and TICs.
Macroeconomic Indicators
Economic Policy Uncertainty Index*
By Month since January 2000

*Source: 'Measuring Economic Policy Uncertainty' by Scott Baker, Nicholas Bloom and Steven J. Davis, 3-component index, www.PolicyUncertainty.com, https://www.policyuncertainty.com/us_monthly.html. Data from sources deemed reliable, but numbers to be considered approximate and subject to revision.
Since home sales in May mostly reflect listings that went into contract before the China tariff policy reversal on May 12 – and the huge stock market rebound which resulted – the soaring Economic Uncertainty Index reading for April had substantial impact on May sales statistics.
The Economic Uncertainty Index is constructed from analysis of data from 3 sources: 1) an index of search results from 10 large newspapers for terms related to economic and policy uncertainty, 2) reports by the Congressional Budget Office, and 3) the Federal Reserve Bank of Philadelphia's Survey of Professional Forecasters.*
Inflation: Consumer Price Index (CPI), 2021 – 2025 YTD*
Year-over-Year Percentage Change, by Month

*Consumer Price Index for All Urban Consumers: All Items in U.S. City Average [CPIAUCSL], per Federal Reserve Bank of St. Louis; https://fred.stlouisfed.org/graph/?g=8dGq. Data from U.S. Bureau of Labor Statistics. CPIAUCSL is a price index of a basket of goods and services paid by urban consumers. This index includes roughly 88 percent of the total population. Data from sources deemed reliable but may contain errors and subject to revision.
The general “CPI-All Items” inflation reading for April 2025 dropped to 2.3%, its lowest point since 2021. “Core CPI” - all items except food & energy – was unchanged at 2.8% (not illustrated on this chart).*
The “target inflation rate” for the Federal Reserve Bank is 2%.
Federal Funds Interest Rate since 1981
& Economic Interventions by Federal Reserve Bank*
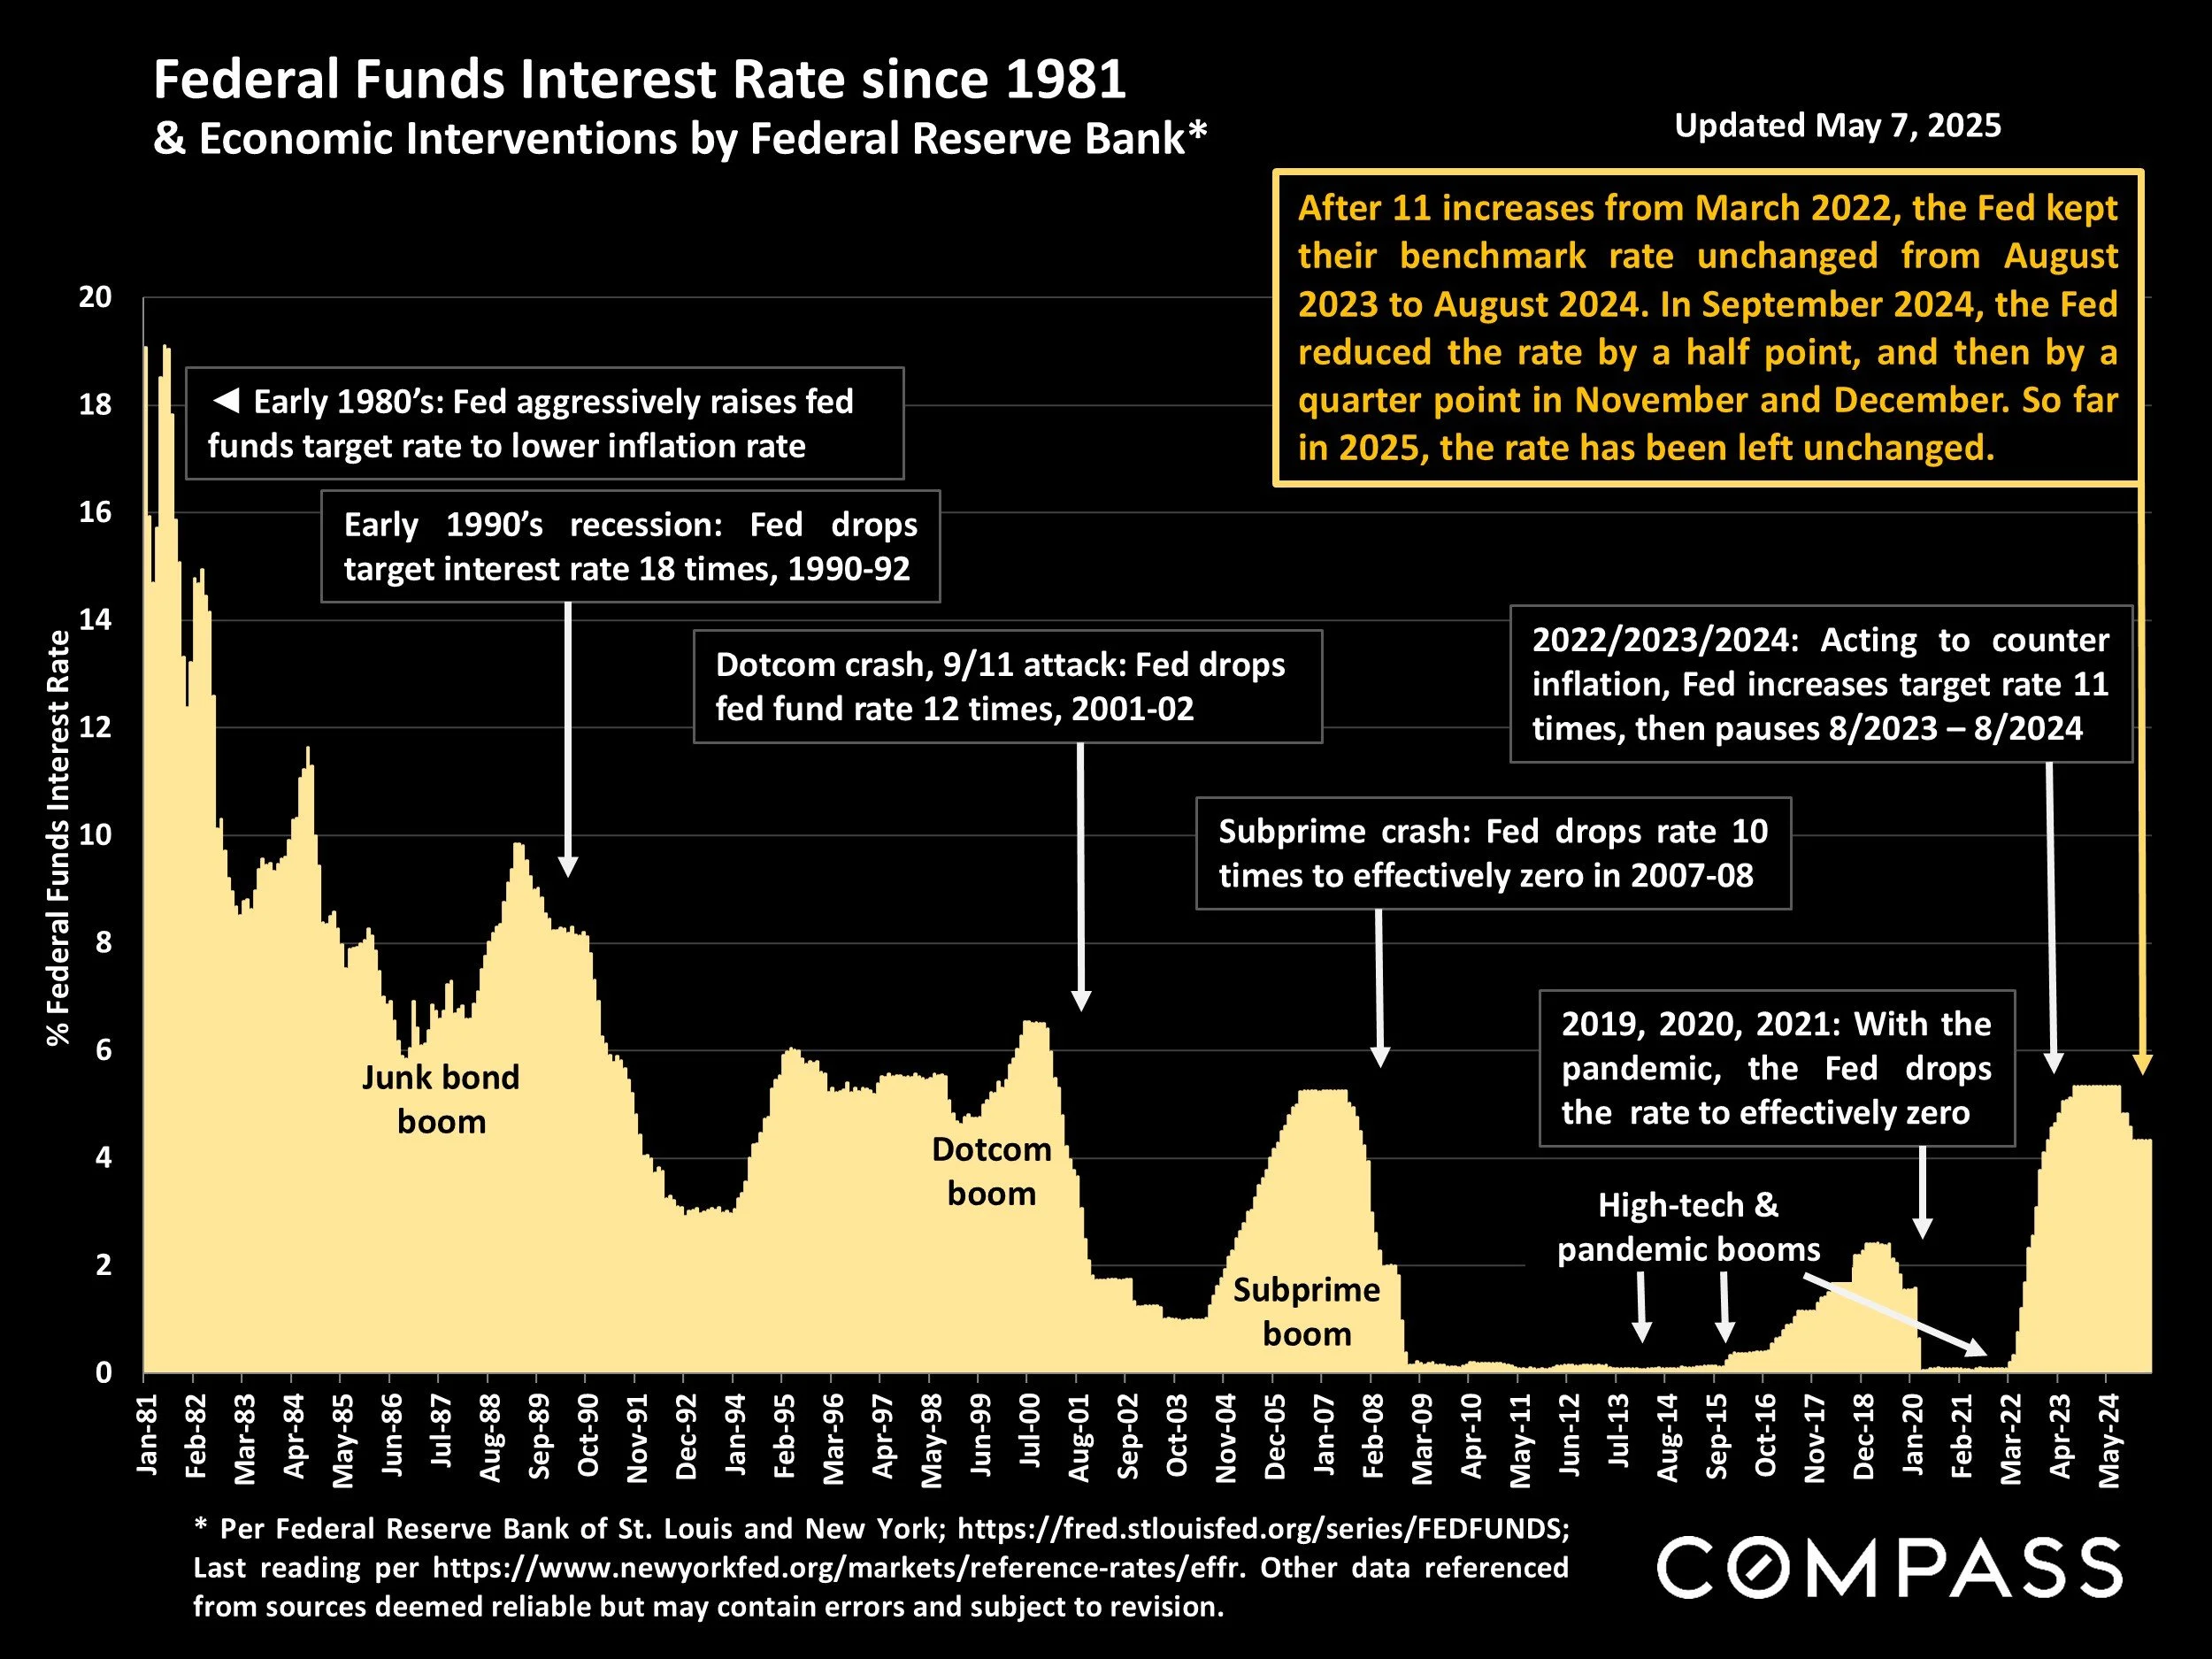
* Per Federal Reserve Bank of St. Louis and New York; https://fred.stlouisfed.org/series/FEDFUNDS; Last reading per https://www.newyorkfed.org/markets/reference-rates/effr. Other data referenced from sources deemed reliable but may contain errors and subject to revision.
After 11 increases from March 2022, the Fed kept their benchmark rate unchanged from August 2023 to August 2024. In September 2024, the Fed reduced the rate by a half point, and then by a quarter point in November and December. So far in 2025, the rate has been left unchanged.
Statistics are generalities, essentially summaries of widely disparate data generated by dozens, hundreds or thousands of unique, individual sales occurring within different time periods. They are best seen not as precise measurements, but as broad, comparative indicators, with reasonable margins of error. Anomalous fluctuations in statistics are not uncommon, especially in smaller, expensive market segments. Last period data should be considered estimates that may change with late-reported data. Different analytics programs sometimes define statistics – such as “active listings,” “days on market,” and “months supply of inventory” – differently: what is most meaningful are not specific calculations but the trends they illustrate. Most listing and sales data derives from the local or regional multi-listing service (MLS) of the area specified in the analysis, but not all listings or sales are reported to MLS and these won’t be reflected in the data. “Homes” signifies real-property, single-household housing units: houses, condos, co-ops, townhouses, duets and TICs (but not mobile homes), as applicable to each market. City/town names refer specifically to the named cities and towns, unless otherwise delineated. Multi-county metro areas will be specified as such. Data from sources deemed reliable, but may contain errors and subject to revision. All numbers to be considered approximate.
Many aspects of value cannot be adequately reflected in median and average statistics: curb appeal, age, condition, amenities, views, lot size, quality of outdoor space, “bonus” rooms, additional parking, quality of location within the neighborhood, and so on. How any of these statistics apply to any particular home is unknown without a specific comparative market analysis.
Median Sales Price is that price at which half the properties sold for more and half for less. It may be affected by seasonality, “unusual” events, or changes in inventory and buying trends, as well as by changes in fair market value. The median sales price for an area will often conceal an enormous variety of sales prices in the underlying individual sales.
Dollar per Square Foot is based upon the home’s interior living space and does not include garages, unfinished attics and basements, rooms built without permit, patios, decks or yards (though all those can add value to a home). These figures are usually derived from appraisals or tax records, but are sometimes unreliable (especially for older homes) or unreported altogether. The calculation can only be made on those home sales that reported square footage.
Compass is a real estate broker licensed by the State of California, DRE 01527235. Equal Housing Opportunity. This report has been prepared solely for information purposes. The information herein is based on or derived from information generally available to the public and/or from sources believed to be reliable. No representation or warranty can be given with respect to the accuracy or completeness of the information. Compass disclaims any and all liability relating to this report, including without limitation any express or implied representations or warranties for statements contained in, and omissions from, the report. Nothing contained herein is intended to be or should be read as any regulatory, legal, tax, accounting or other advice and Compass does not provide such advice. All opinions are subject to change without notice. Compass makes no representation regarding the accuracy of any statements regarding any references to the laws, statutes or regulations of any state are those of the author(s). Past performance is no guarantee of future results.