June 2026 Market Report

The Bay Area housing market hit a lot of national headlines in May. In San Francisco, Al and tech-driven demand has created aggressive bidding wars on the scarce inventory. Skyrocketing rents are back in the norm. Even the city's condo market, which has been under pressure for six years, is showing signs of demand recovery.
For the first time in many years job creation in the Bay Area is positive and economic opportunity is attracting net inbound migration, despite the region's chronic shortage of homes and affordability issues. It's notable that other tech cities like Seattle and Austin are not seeing the boom in the real estate market related to Al. In fact, those cities are now sending more people to San Francisco than the reverse.
While the city dominates the headlines, many areas have not seen the massive wealth effect driving home buying demand like the city has. In this cycle, this resurgent demand is so far concentrated to a very small section in the city, and luxury markets in Peninsula and Marin.
For much of the region, interest rates matter more than stock market performance. In May, mortgage rates jumped higher with sharply higher inflation data. That tension between higher interest rates and the wealth effect is likely to continue for the rest of 2026. Inflation pressures have been pushing higher, and it seems unlikely that interest rates will dip again very soon.
Mortgage Rates Bounce Off the Lows

Interest rates have pushed higher due to war news, overheated inflation, and recently strong jobs data. Still at the low-end of the range over the past three years, any push into the upper 6s is likely to slow home purchase demand abruptly. Our forecast is for mortgage rates to average 6.4% for the year.
Dramatic Rent Cost Increases in San Francisco

San Francisco faces a chronic shortage of homes so as employment increases rents drive higher quickly. The South Bay is second nationally to San Francisco in rent appreciation over the last 12 months.
Inflation is High and Pushing Higher

For much of the last decade, Bay Area housing and services like education and childcare pushed local inflation above national averages. For a brief moment in 2023-2025, housing costs in the Bay Area kept inflation lower than the rest of the US. In 2026 surging inflation nationally is driving interest rates higher.
National Employment Grew in May
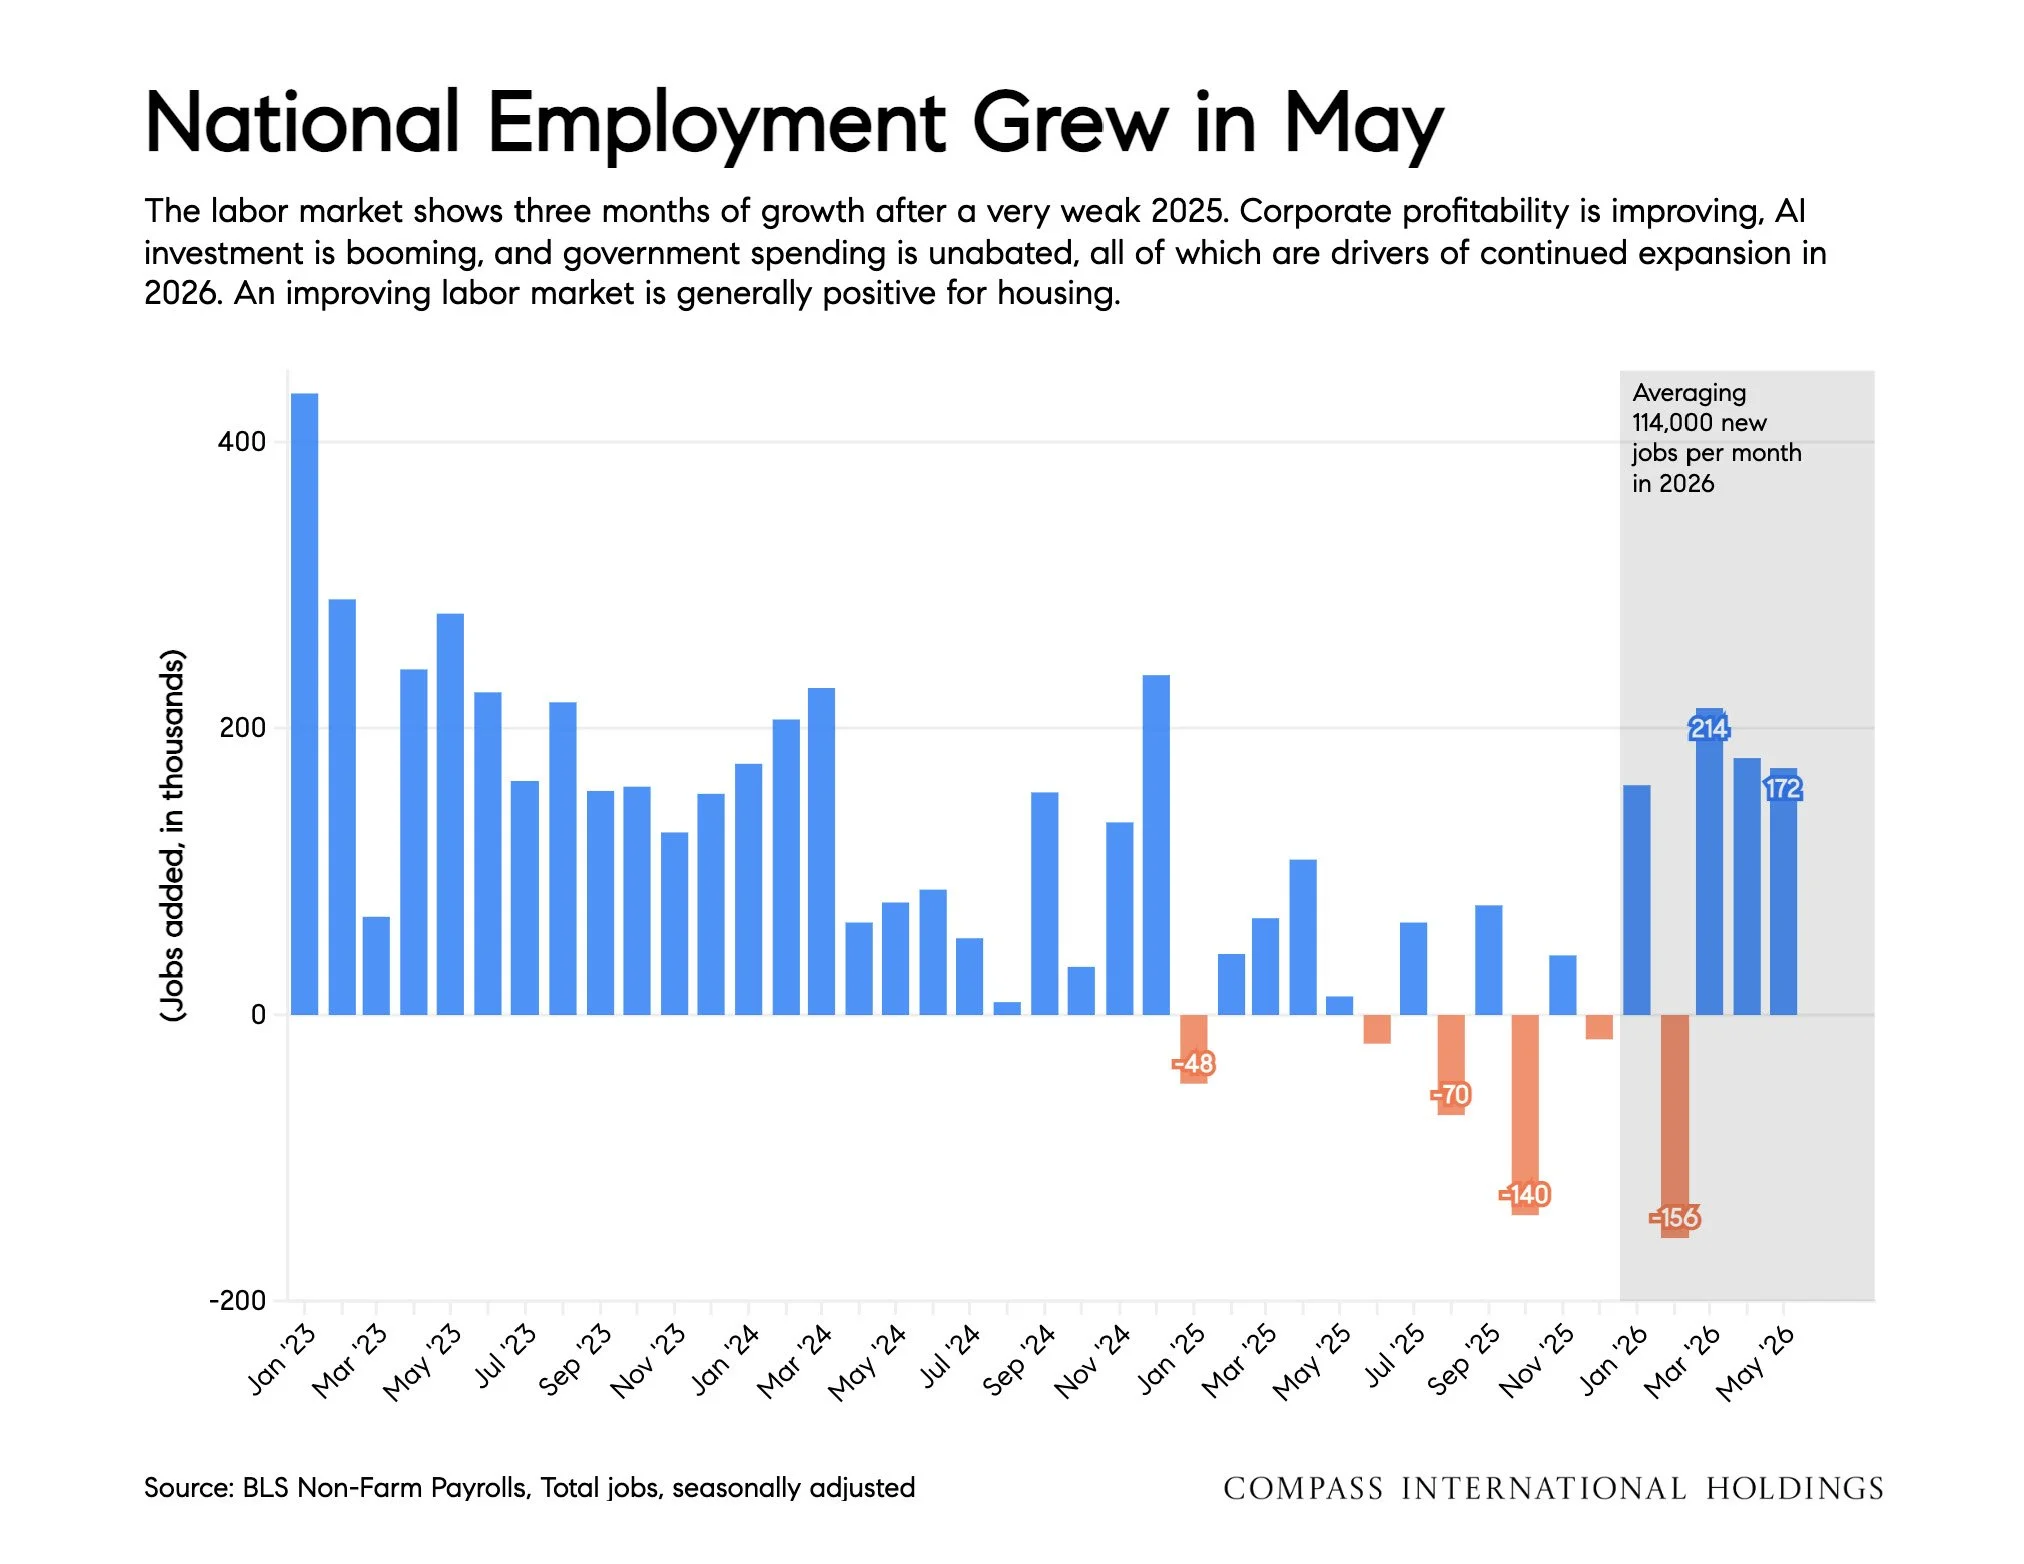
The labor market shows three months of growth after a very weak 2025. Corporate profitability is improving, Al investment is booming, and government spending is unabated, all of which are drivers of continued expansion in 2026. An improving labor market is generally positive for housing.
Bay Area Jobs Are Growing Again
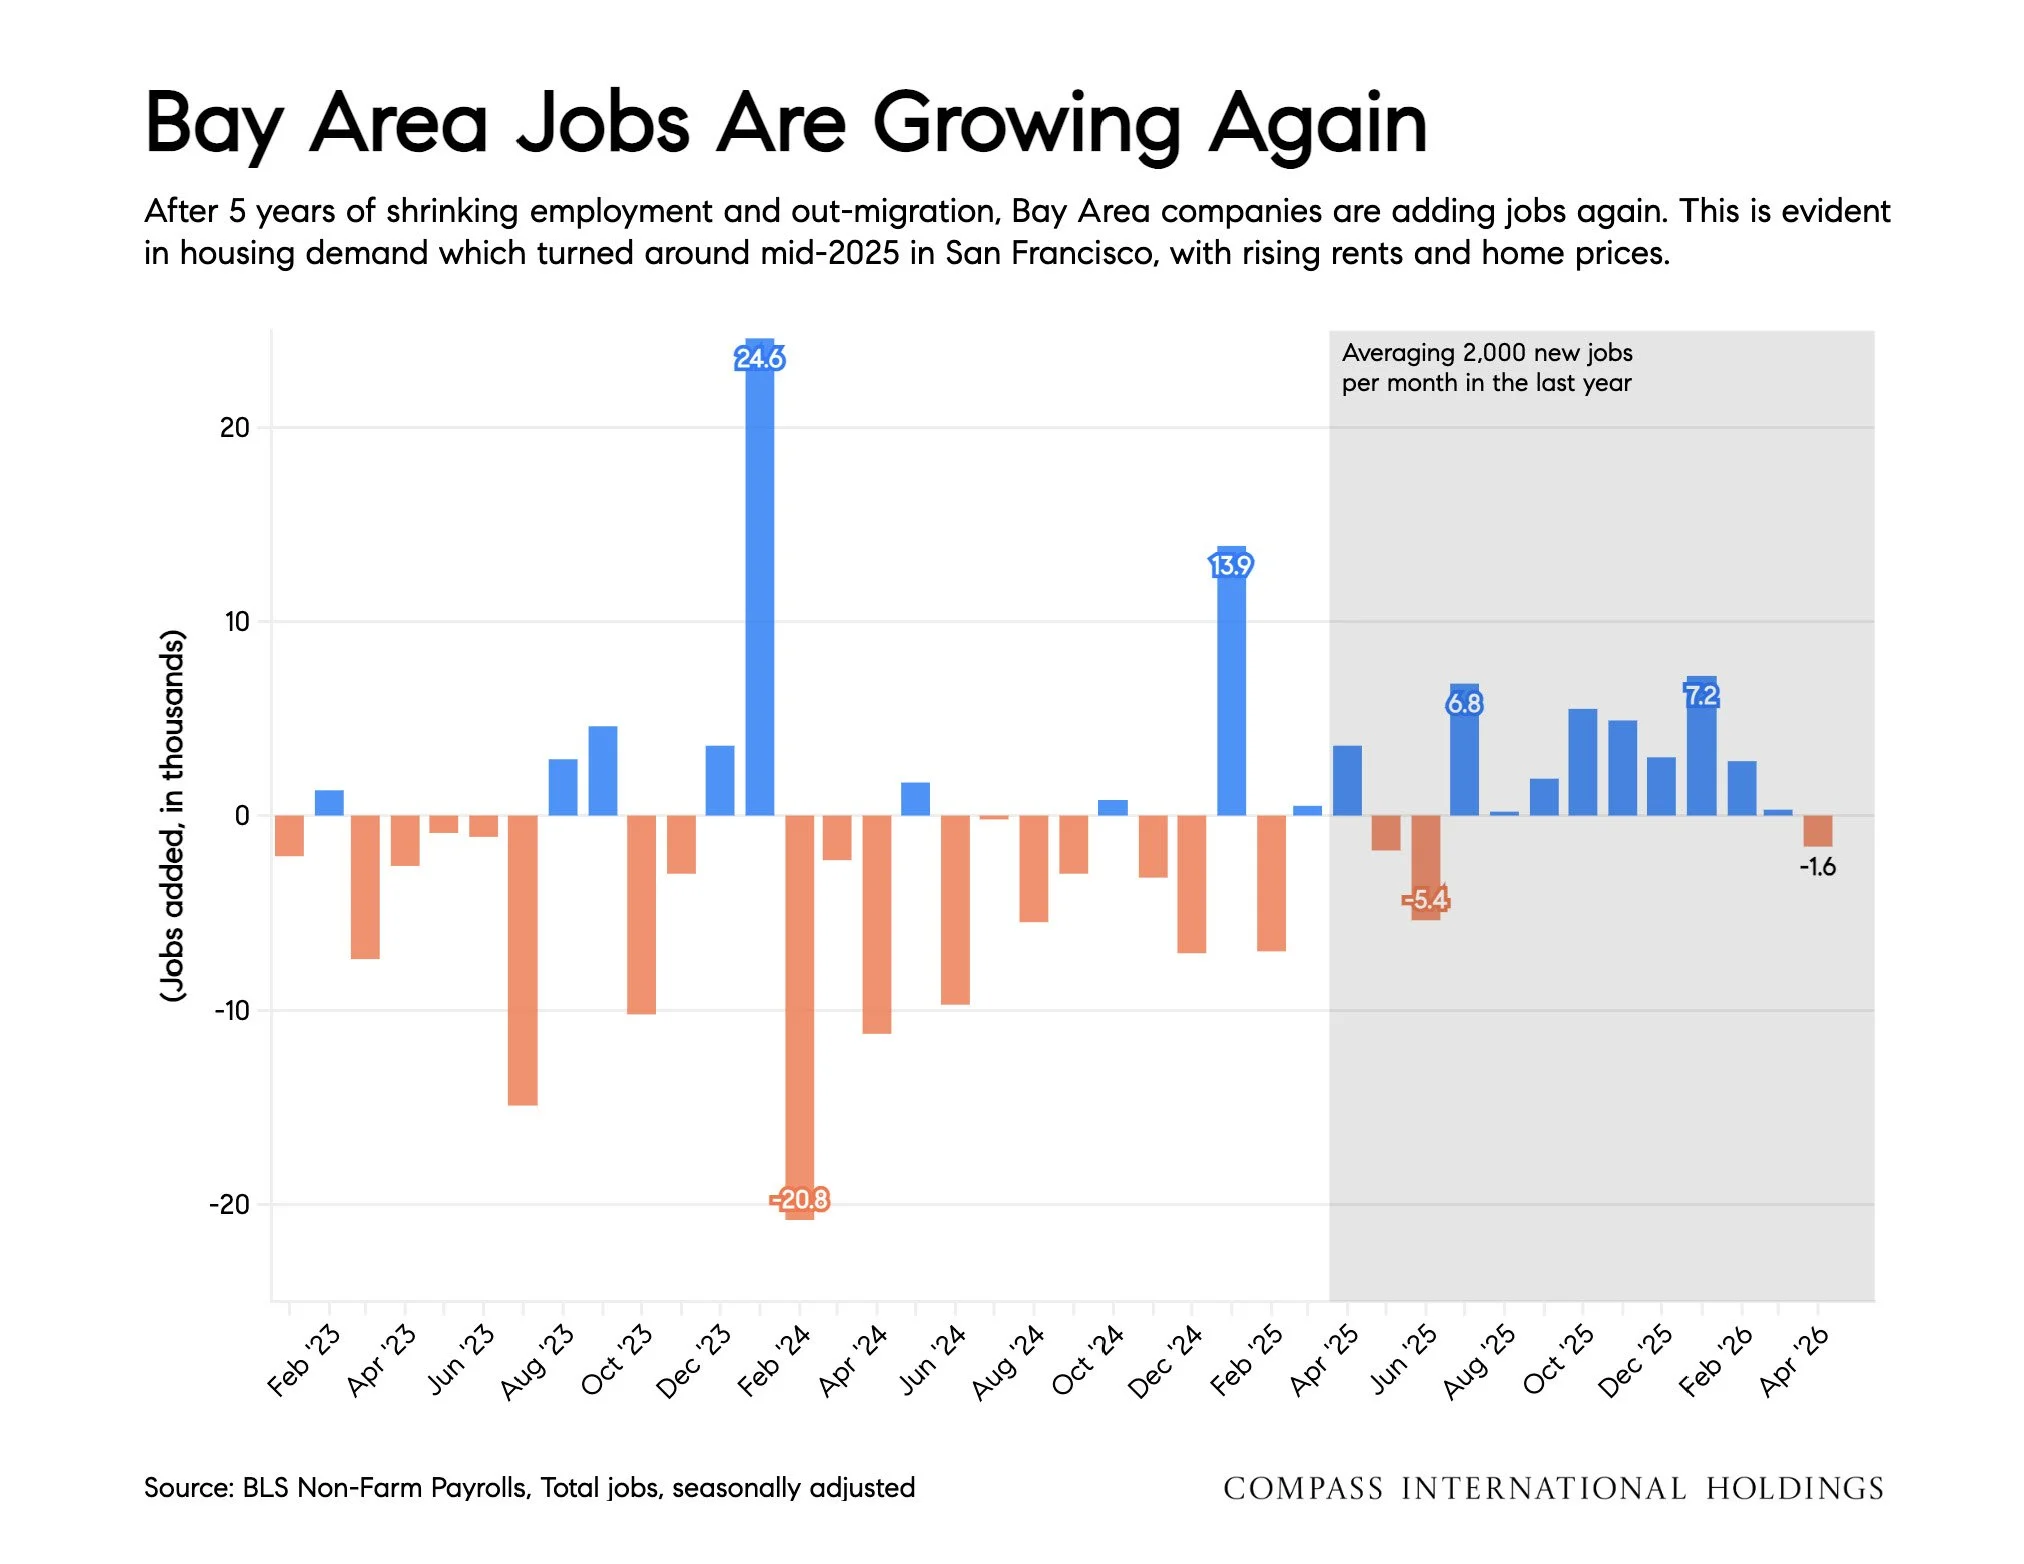
After 5 years of shrinking employment and out-migration, Bay Area companies are adding jobs again. This is evident in housing demand which turned around mid-2025 in San Francisco, with rising rents and home prices.
Stocks Surge to New Highs In May
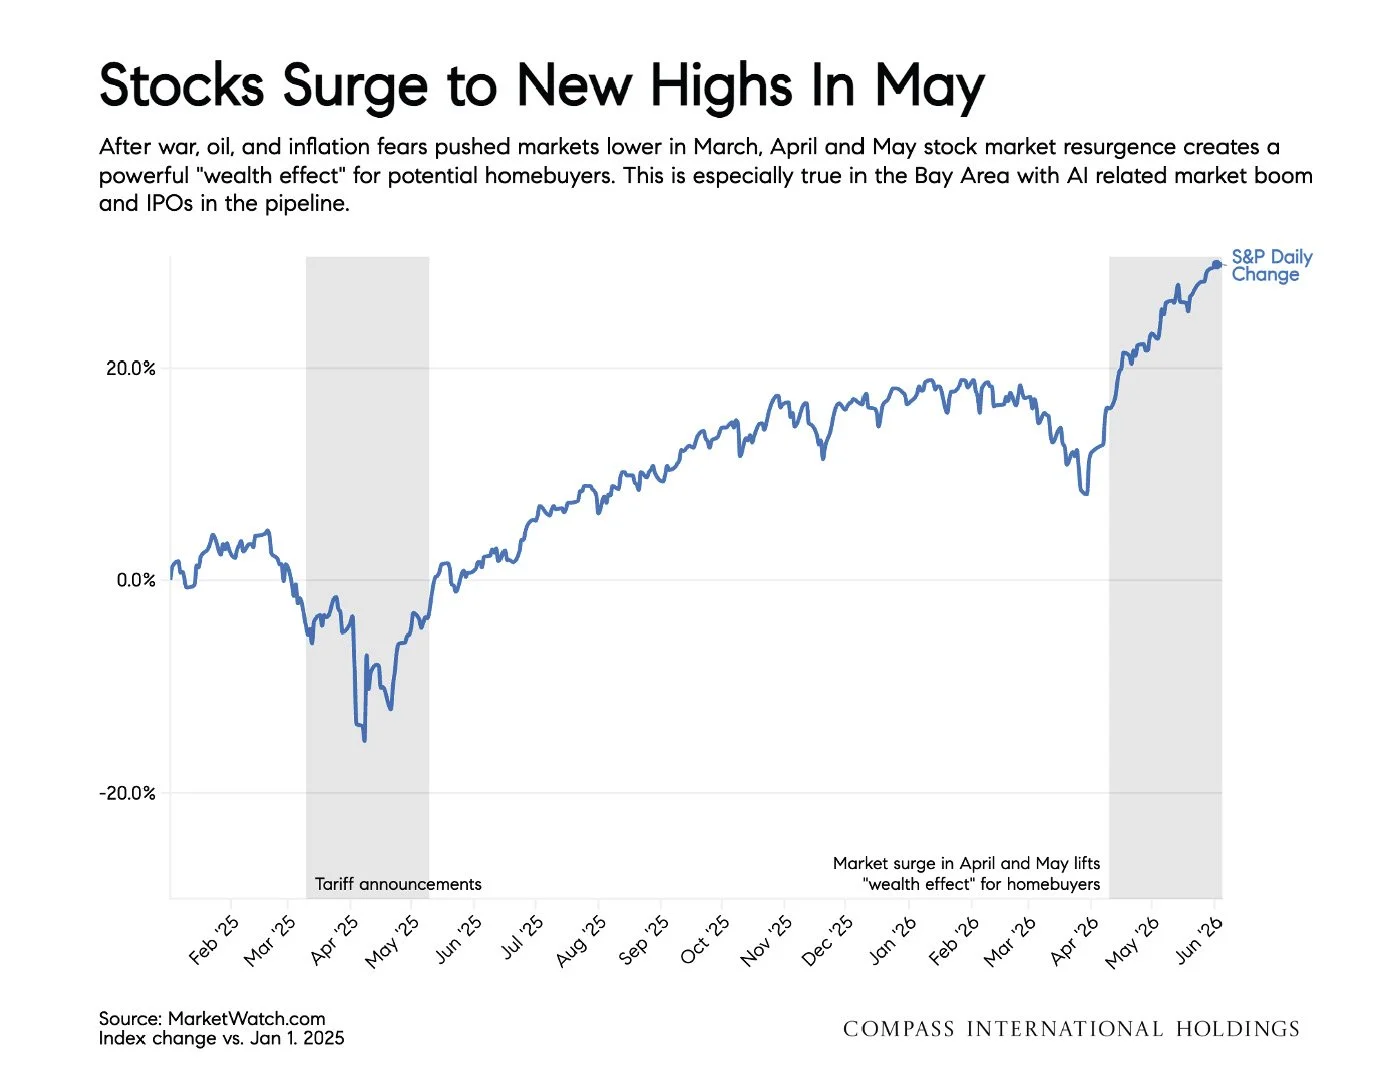
After war, oil, and inflation fears pushed markets lower in March, April and May stock market resurgence creates a powerful "wealth effect" for potential homebuyers. This is especially true in the Bay Area with Al related market boom and IPOs in the pipeline.
Bay Area Migration Sources & Destinations
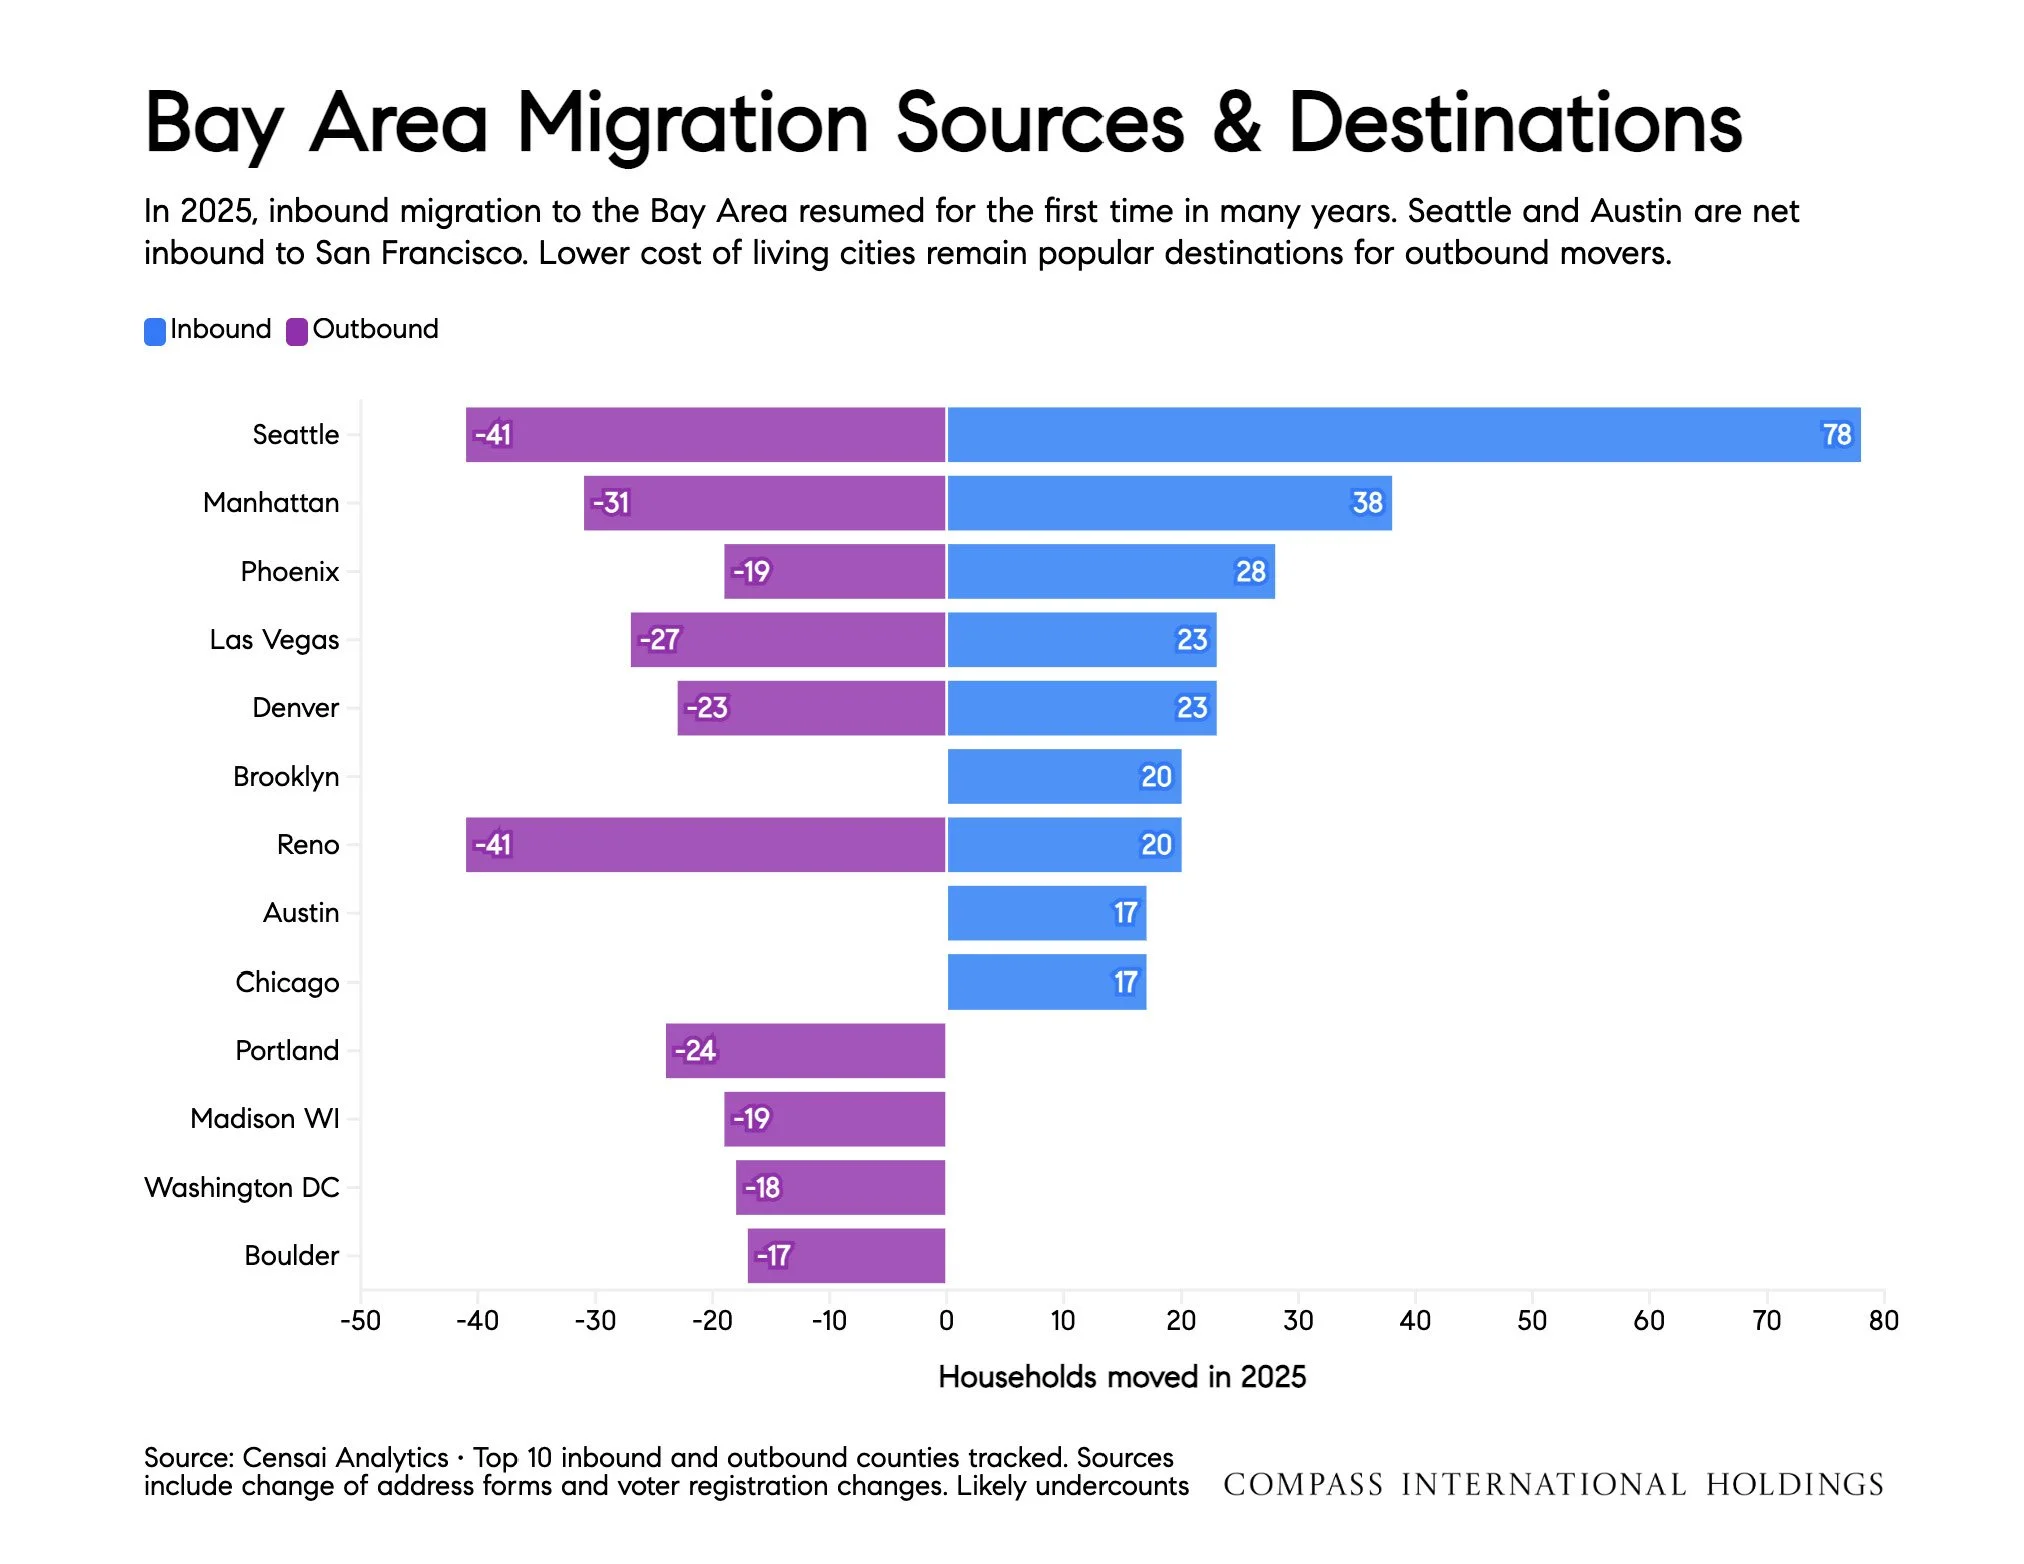
In 2025, inbound migration to the Bay Area resumed for the first time in many years. Seattle and Austin are net inbound to San Francisco. Lower cost of living cities remain popular destinations for outbound movers.
Low Unemployment Keeps People in Homes
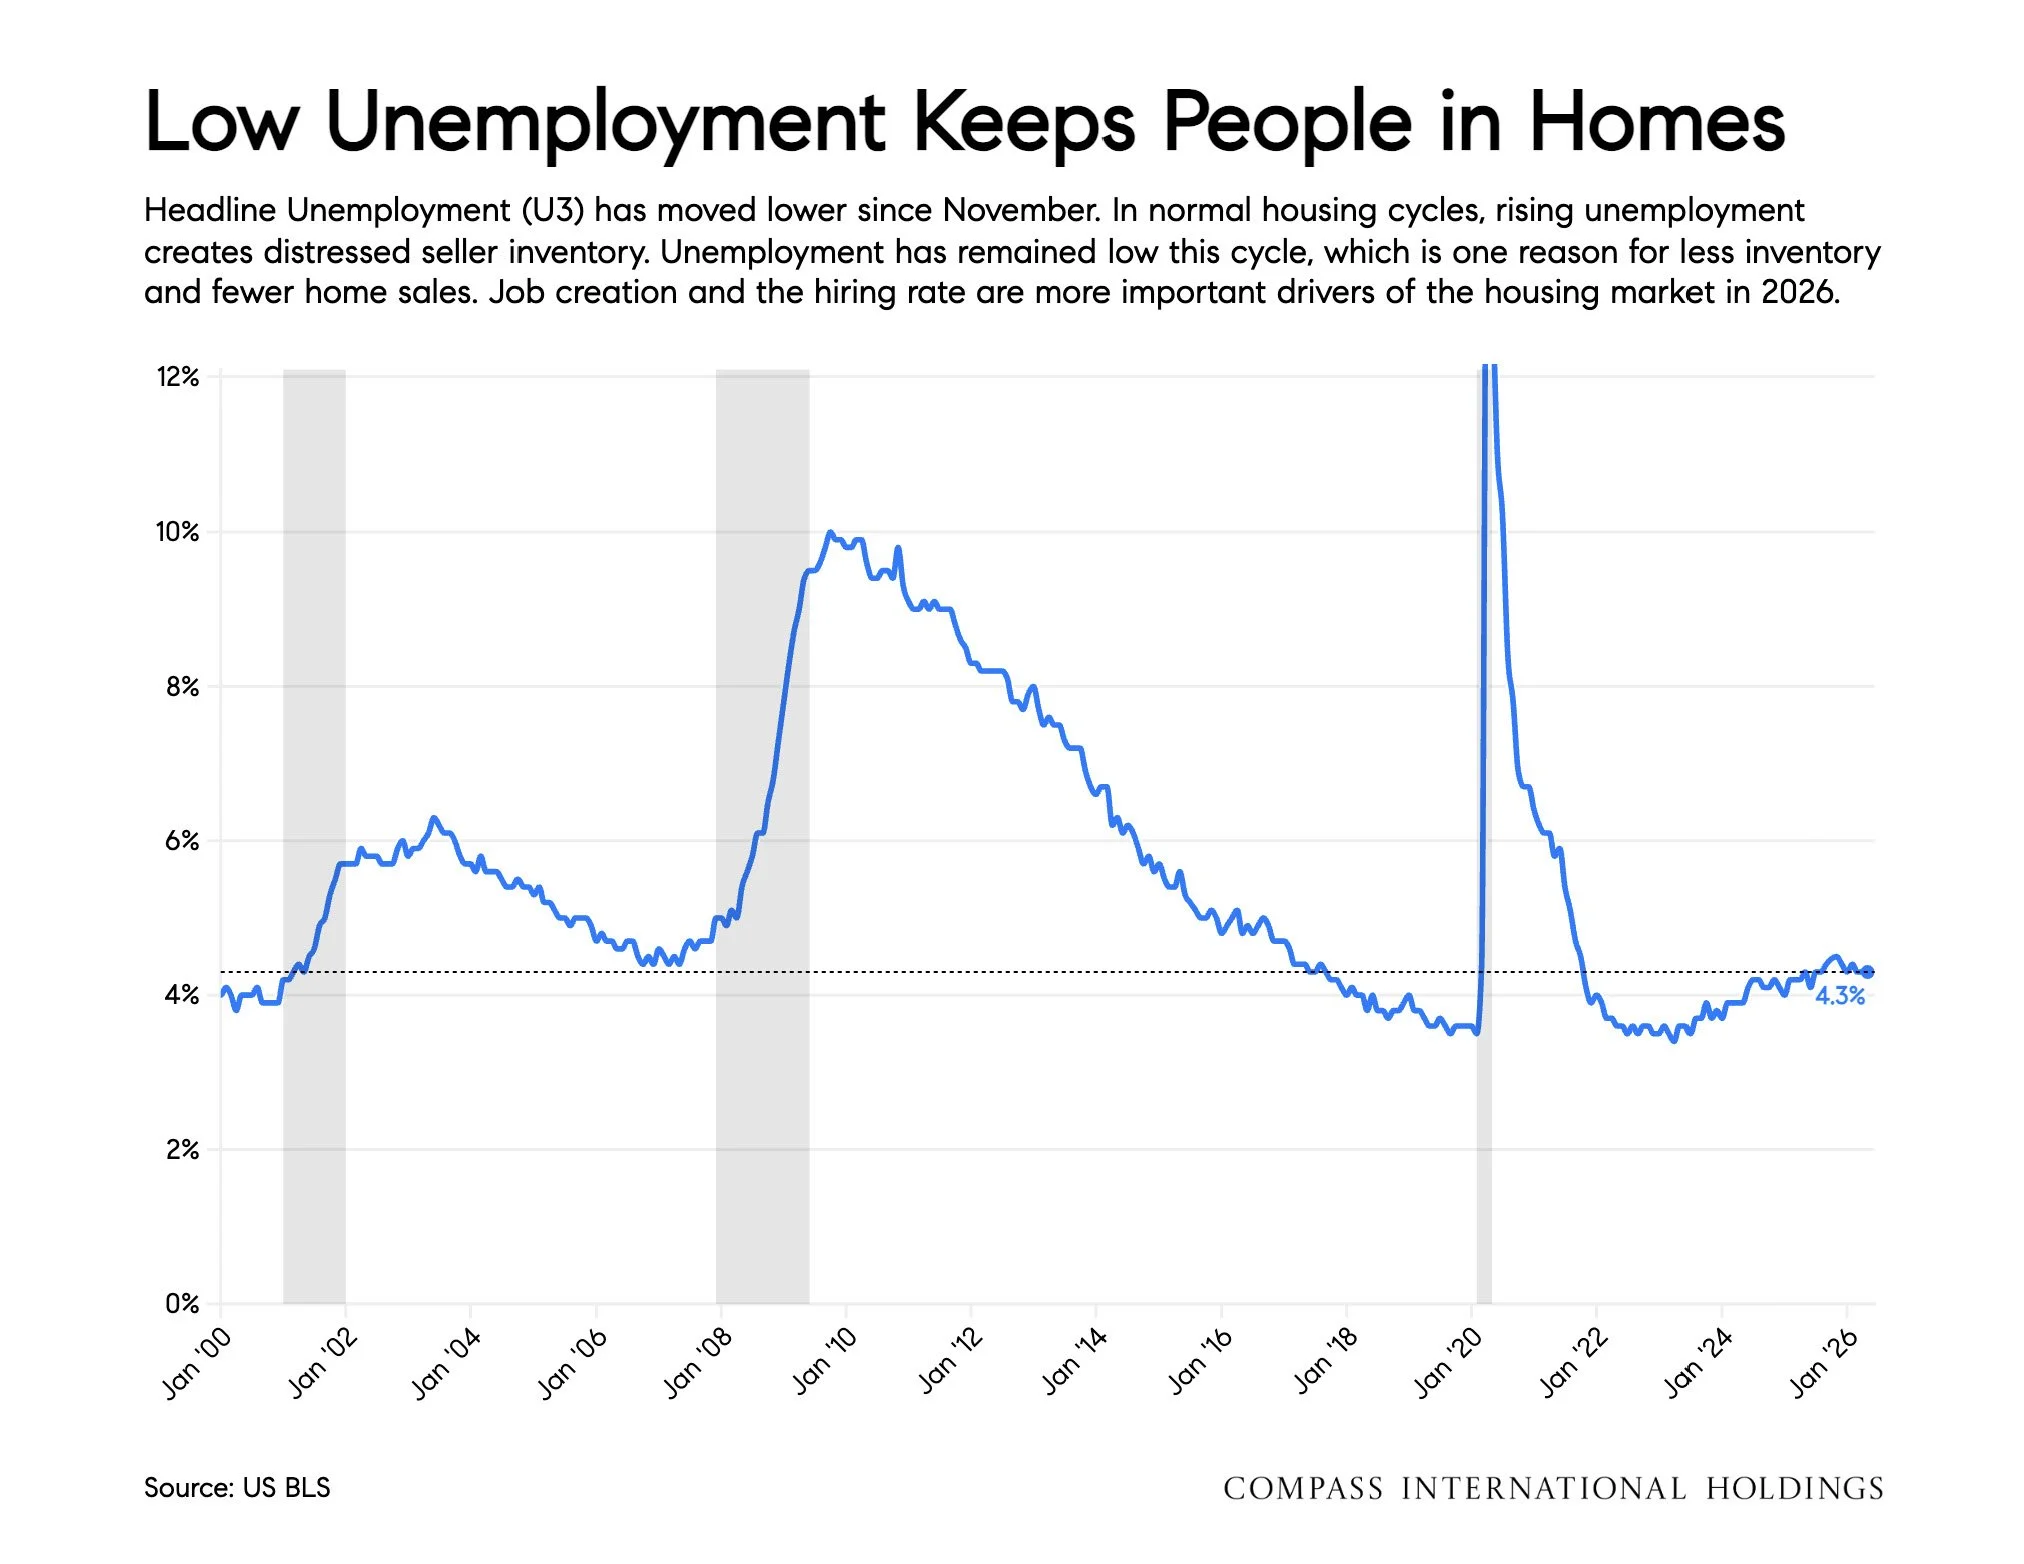
Headline Unemployment (U3) has moved lower since November. In normal housing cycles, rising unemployment creates distressed seller inventory. Unemployment has remained low this cycle, which is one reason for less inventory and fewer home sales. Job creation and the hiring rate are more important drivers of the housing market in 2026.
Very Few Foreclosures in 2026
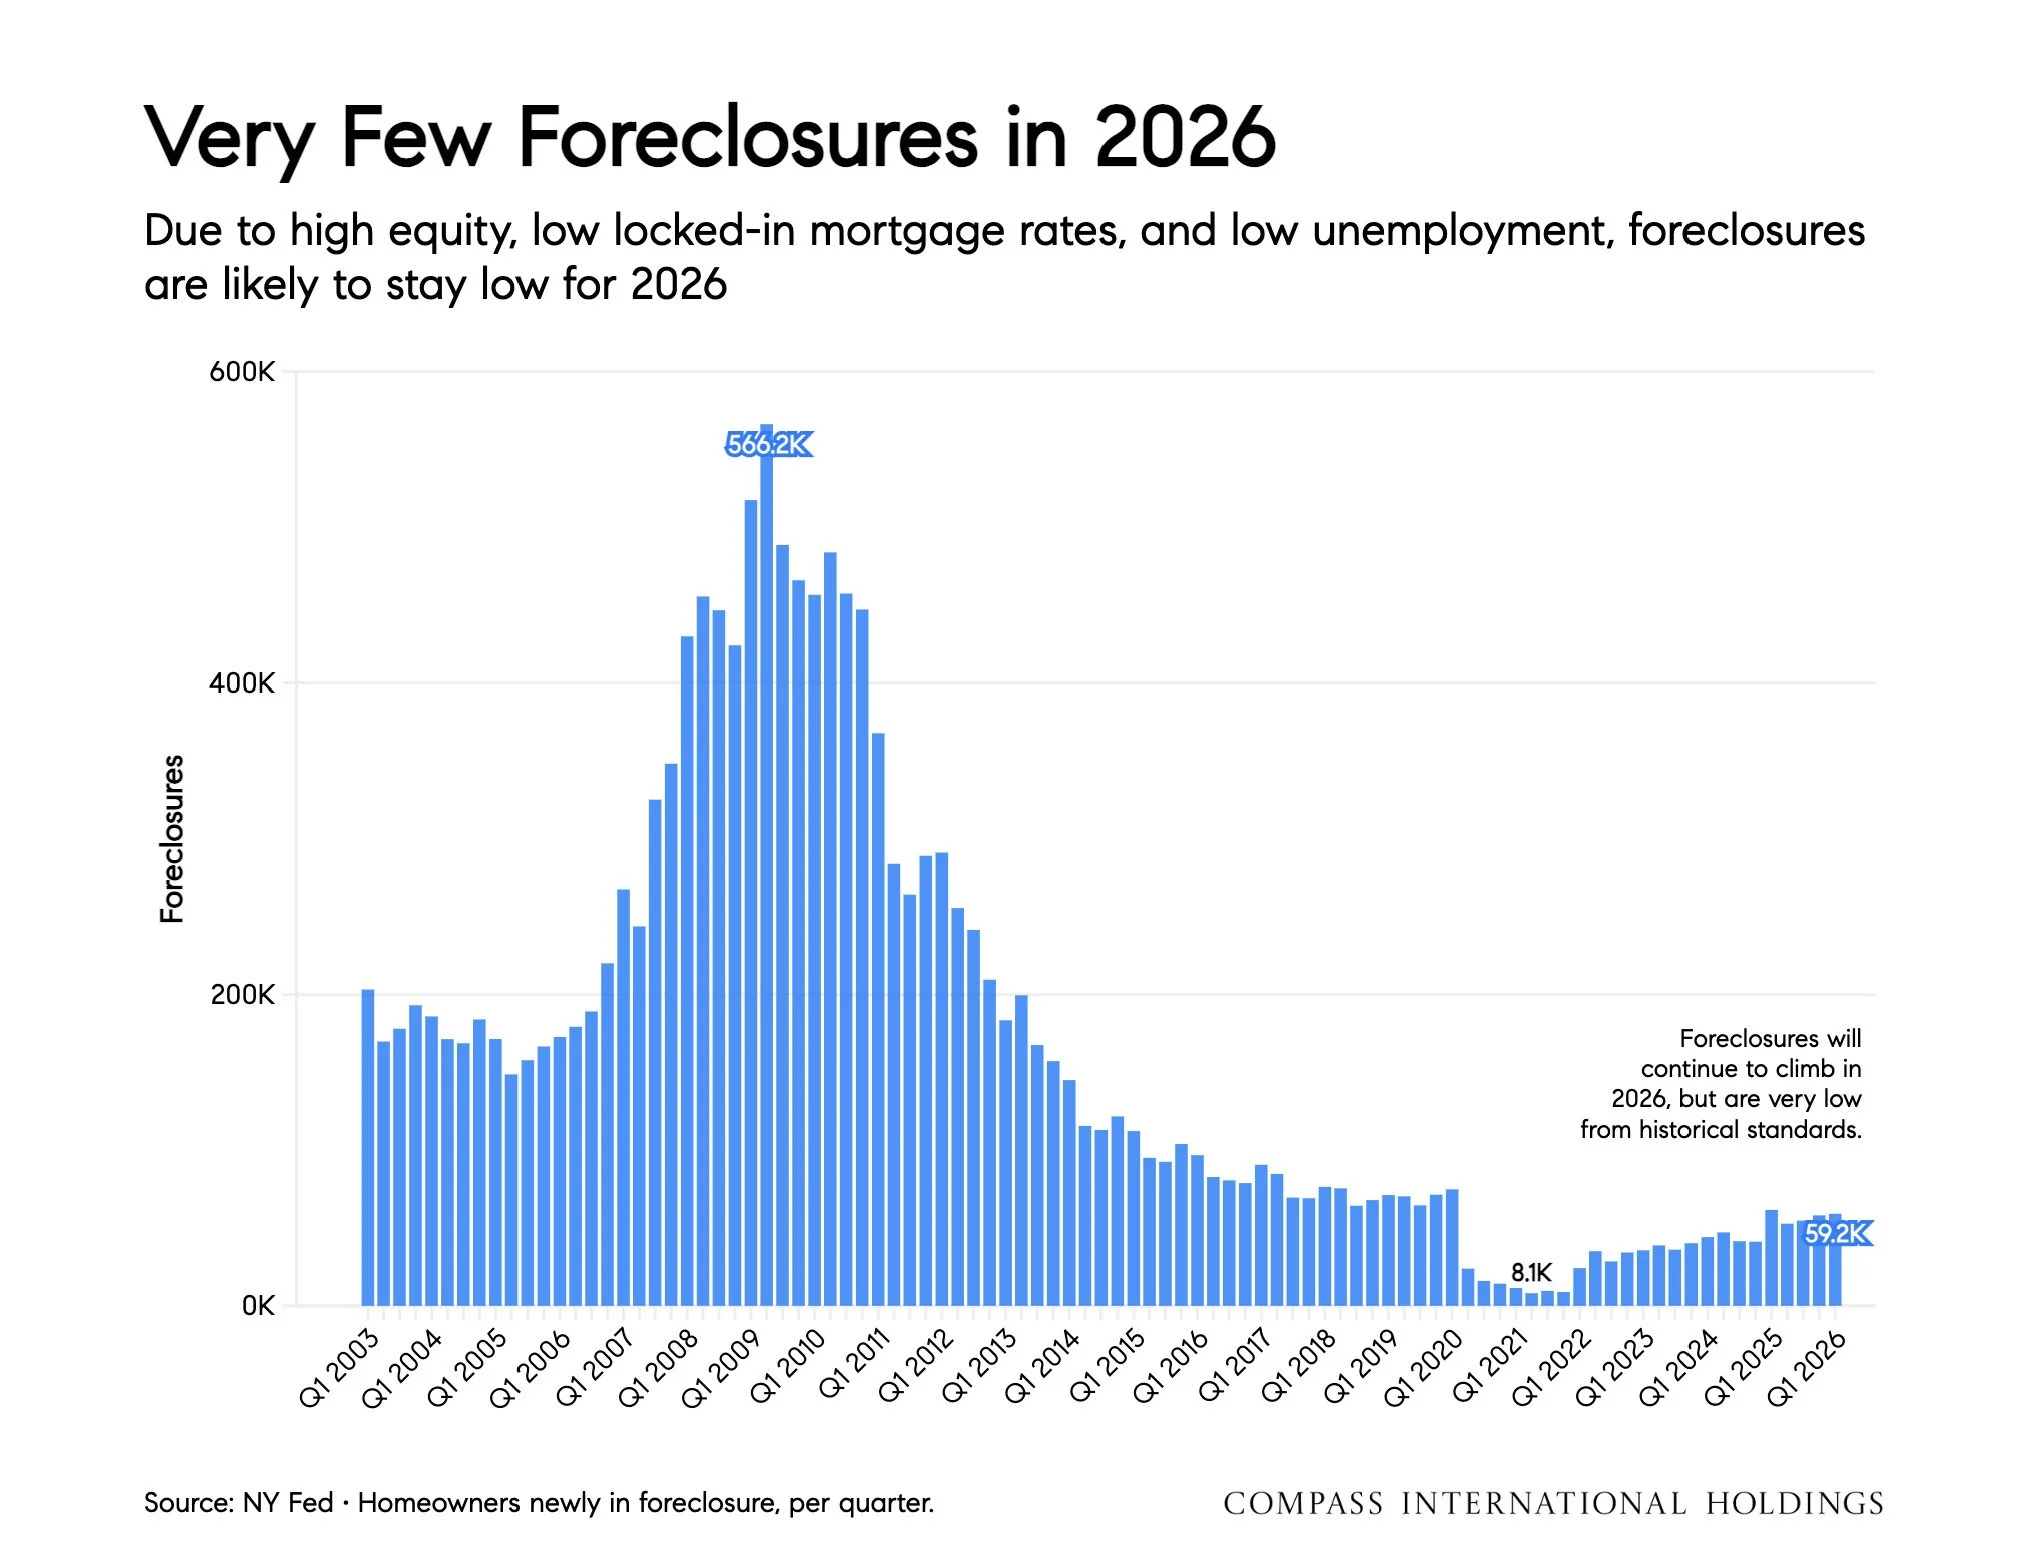
Due to high equity, low locked-in mortgage rates, and low unemployment, foreclosures are likely to stay low for 2026
Expensive and Cheap Mortgages
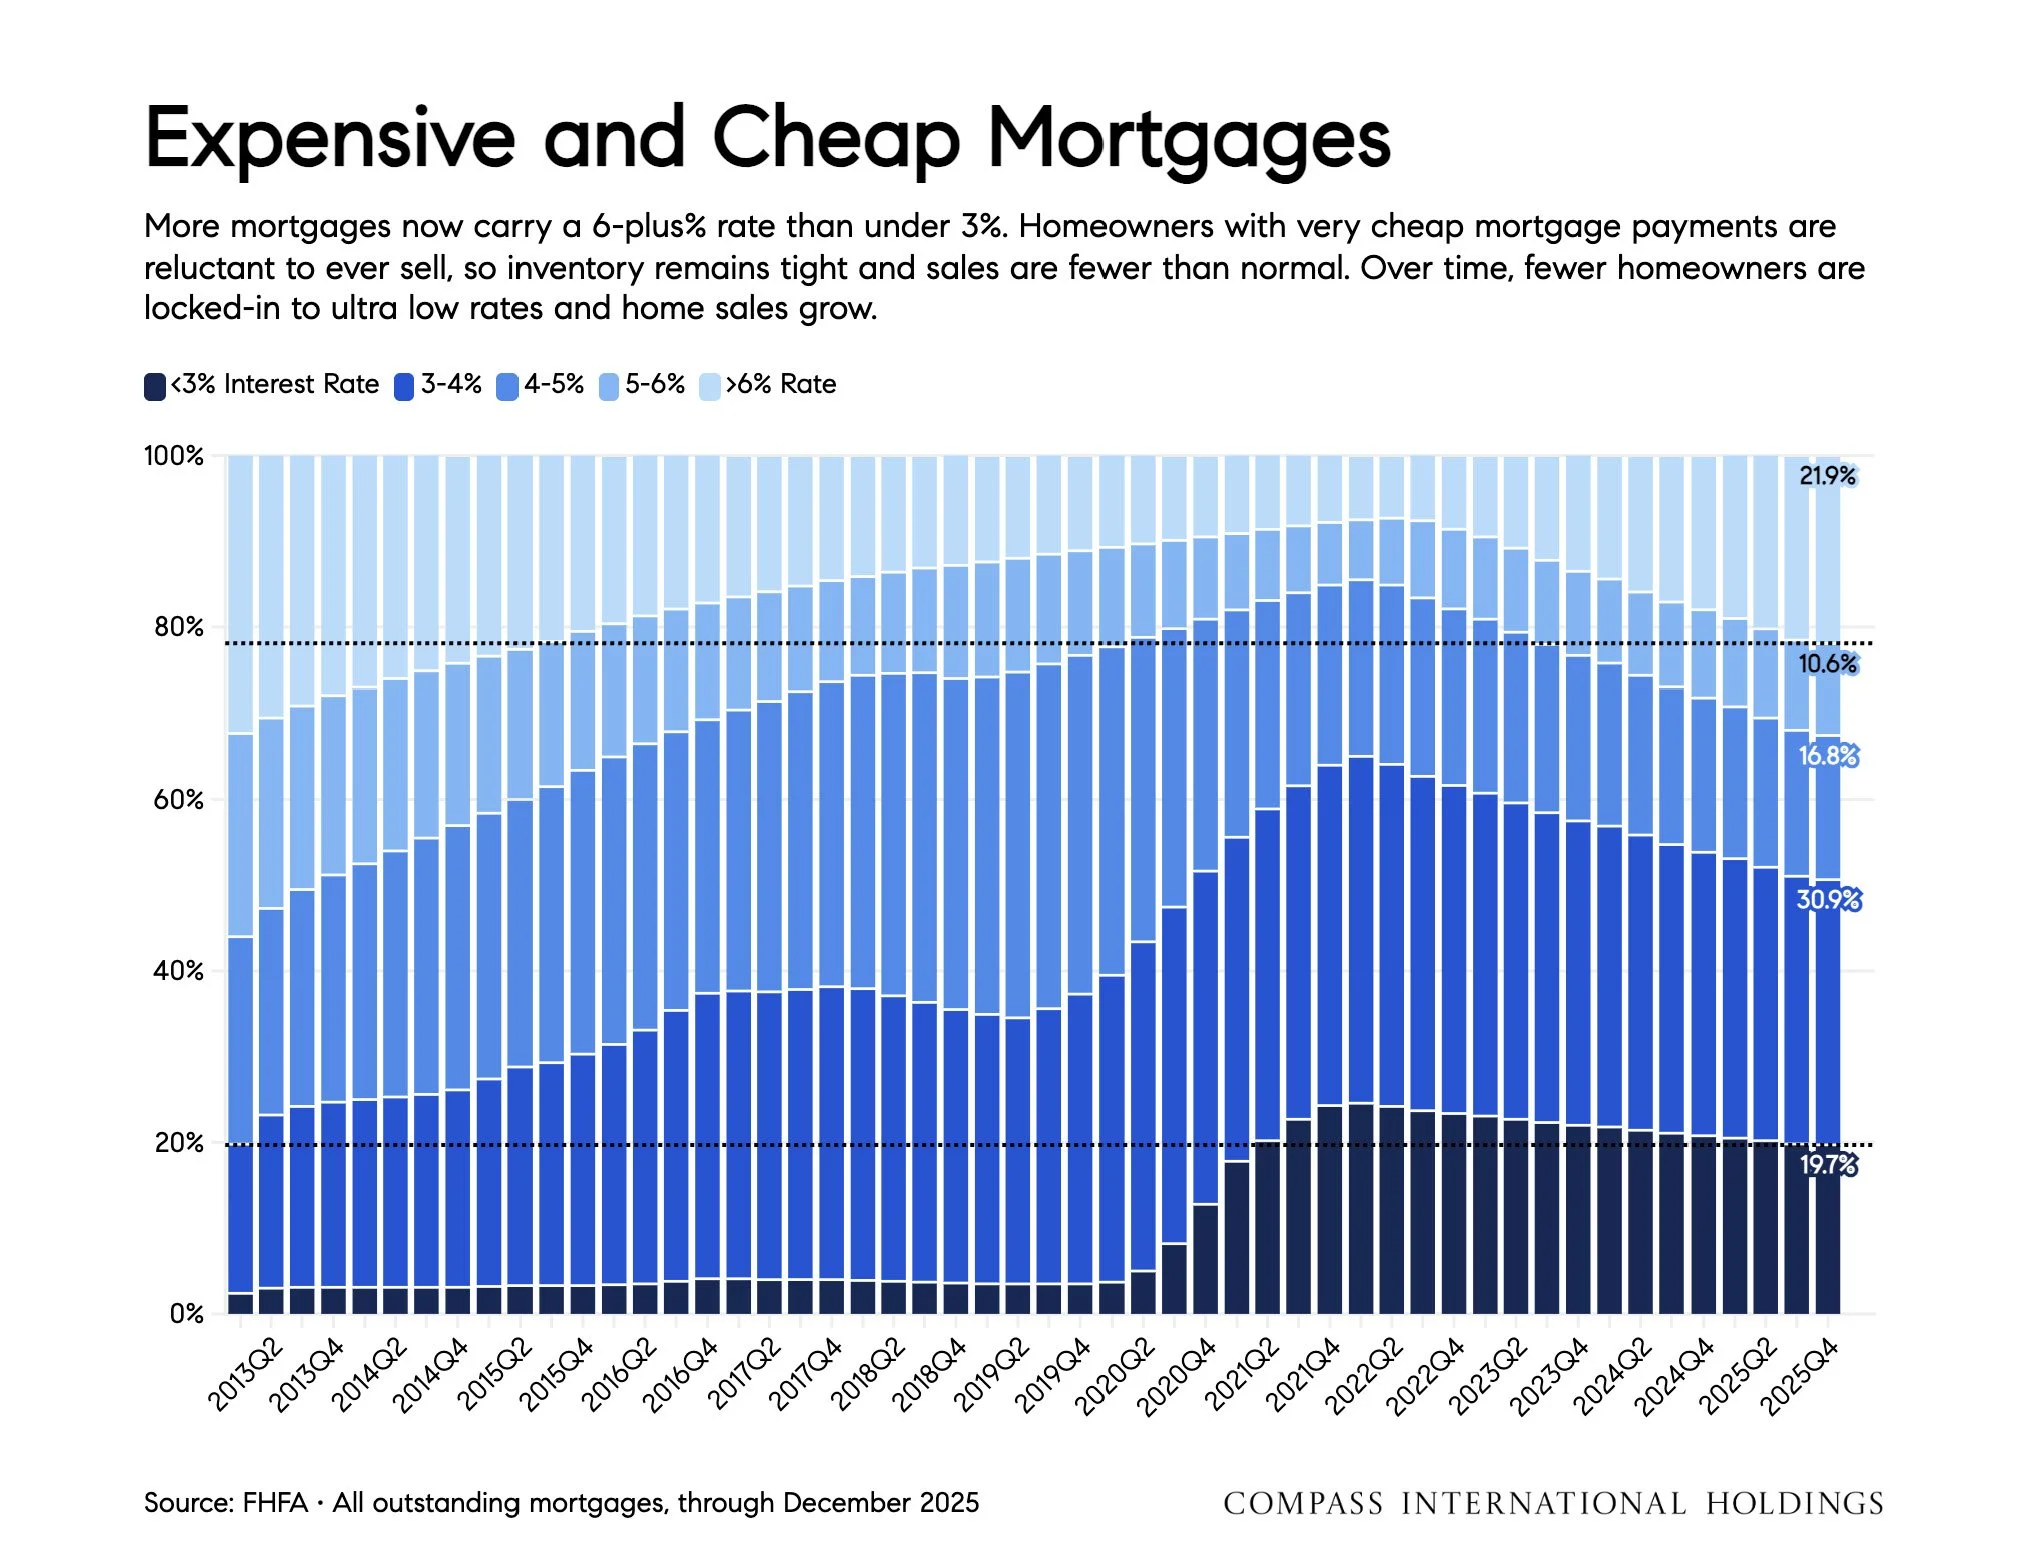
More mortgages now carry a 6+% rate than under 3%. Homeowners with very cheap mortgage payments are reluctant to ever sell, so inventory remains tight and sales are fewer than normal. Over time, fewer homeowners are locked-in to ultra low rates and home sales grow.
Home Price Change vs. 2025
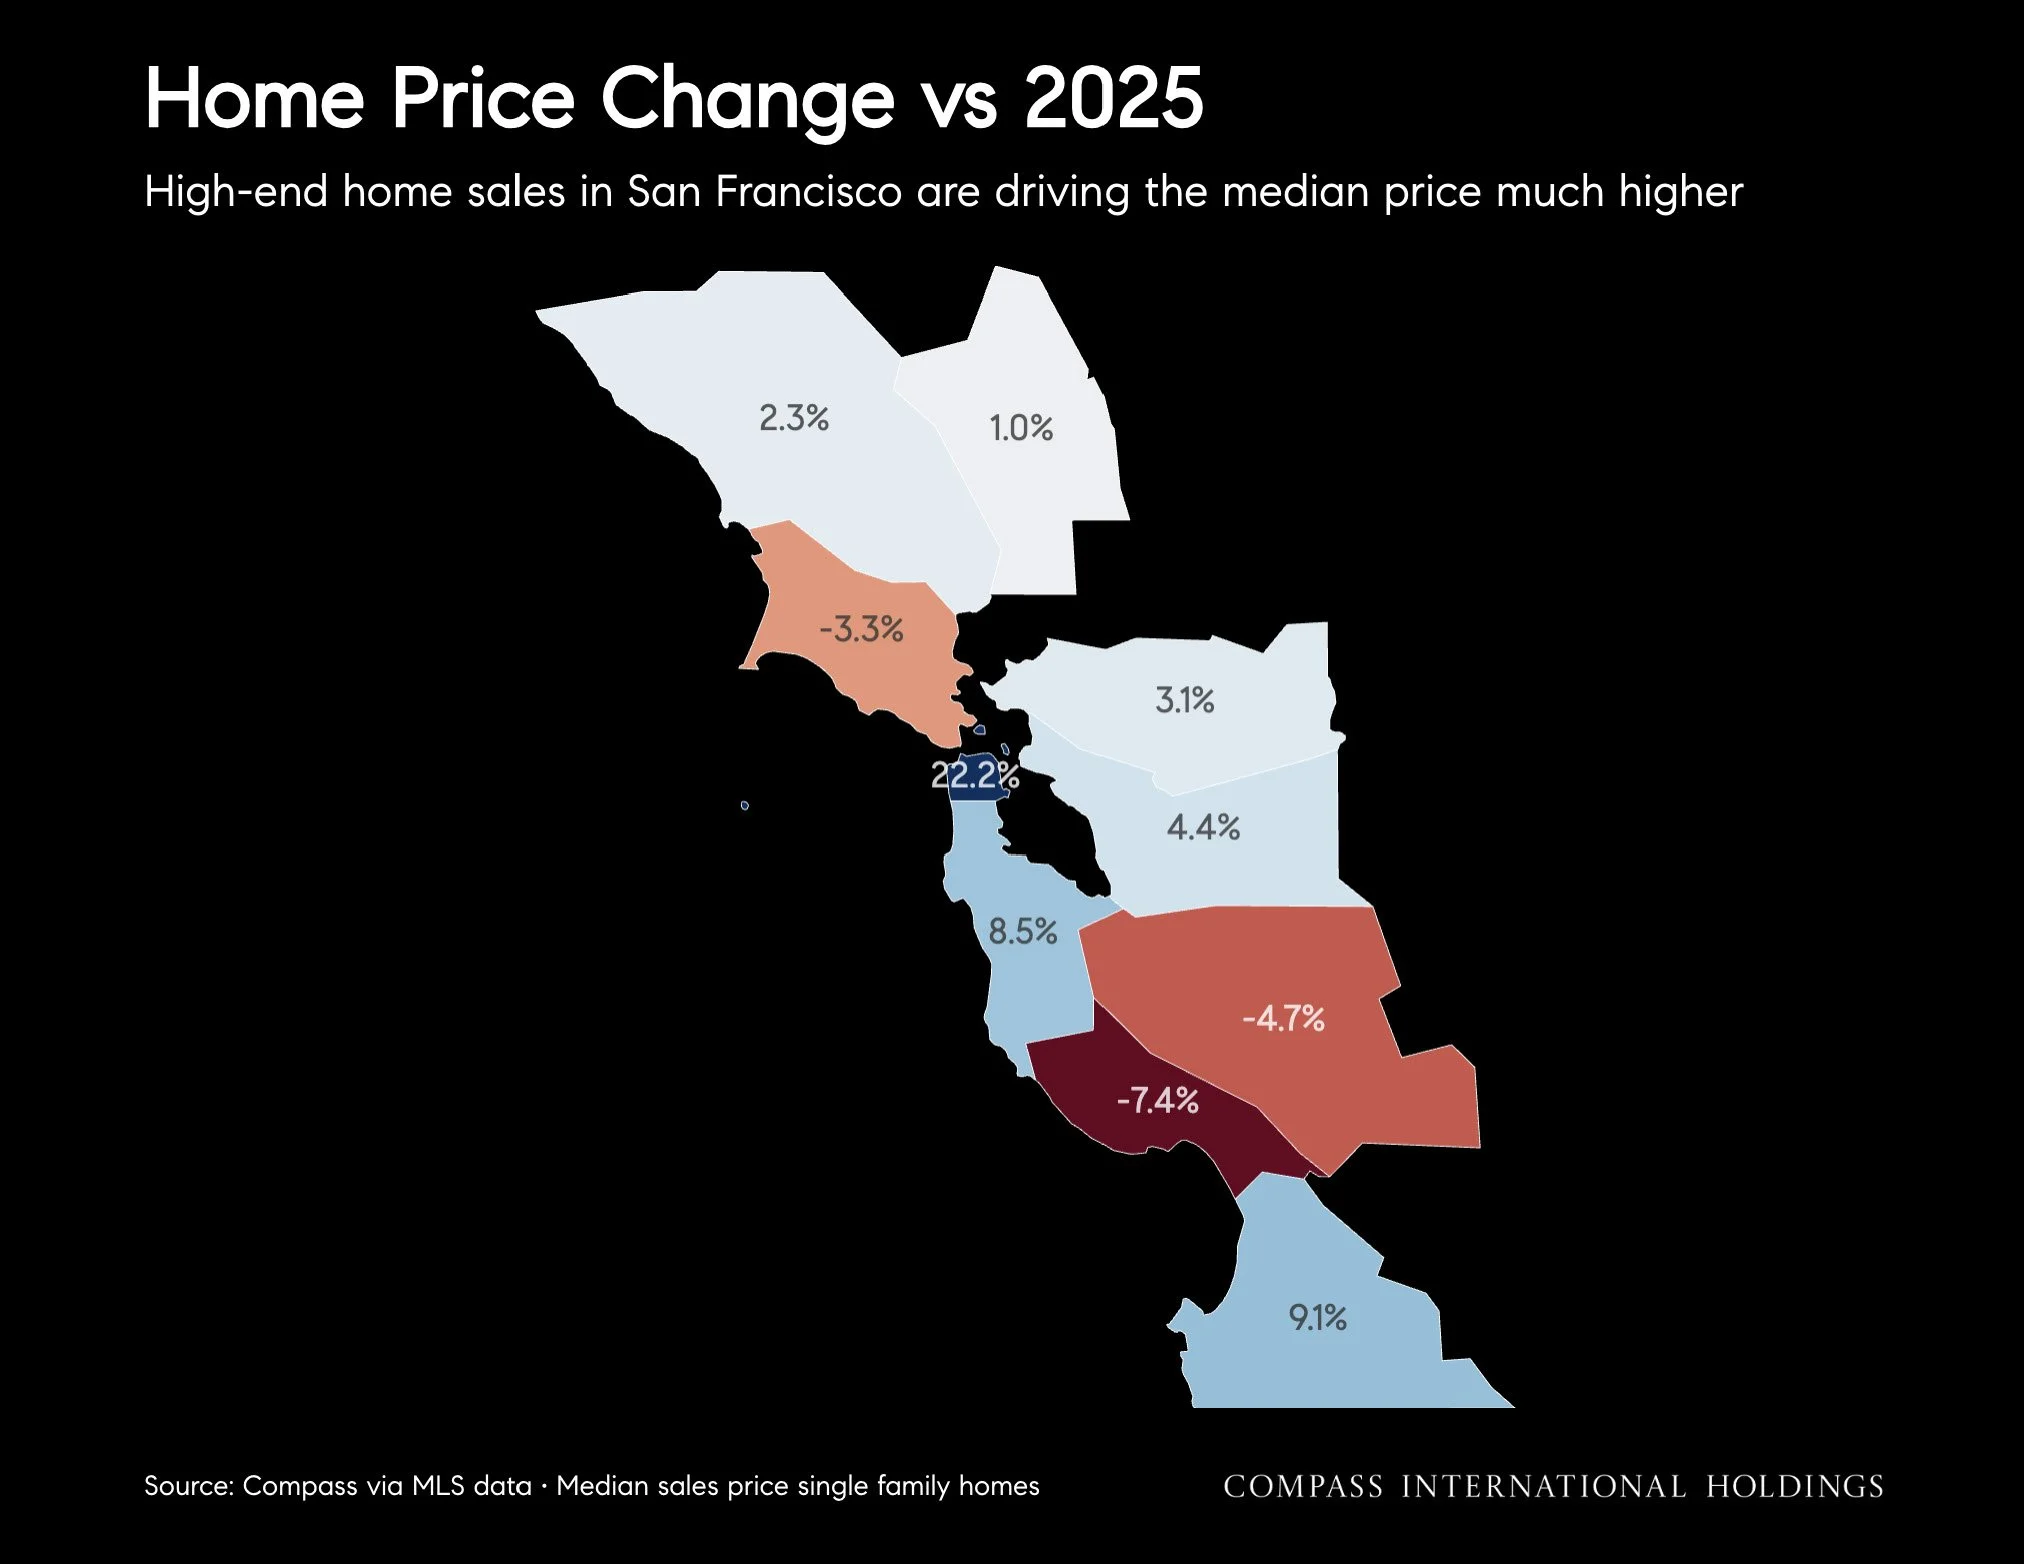
Source: Compass via MLS data • Median sales price single family homes. High-end home sales in San Francisco are driving the median price much higher.
Home Price Changes Over Time
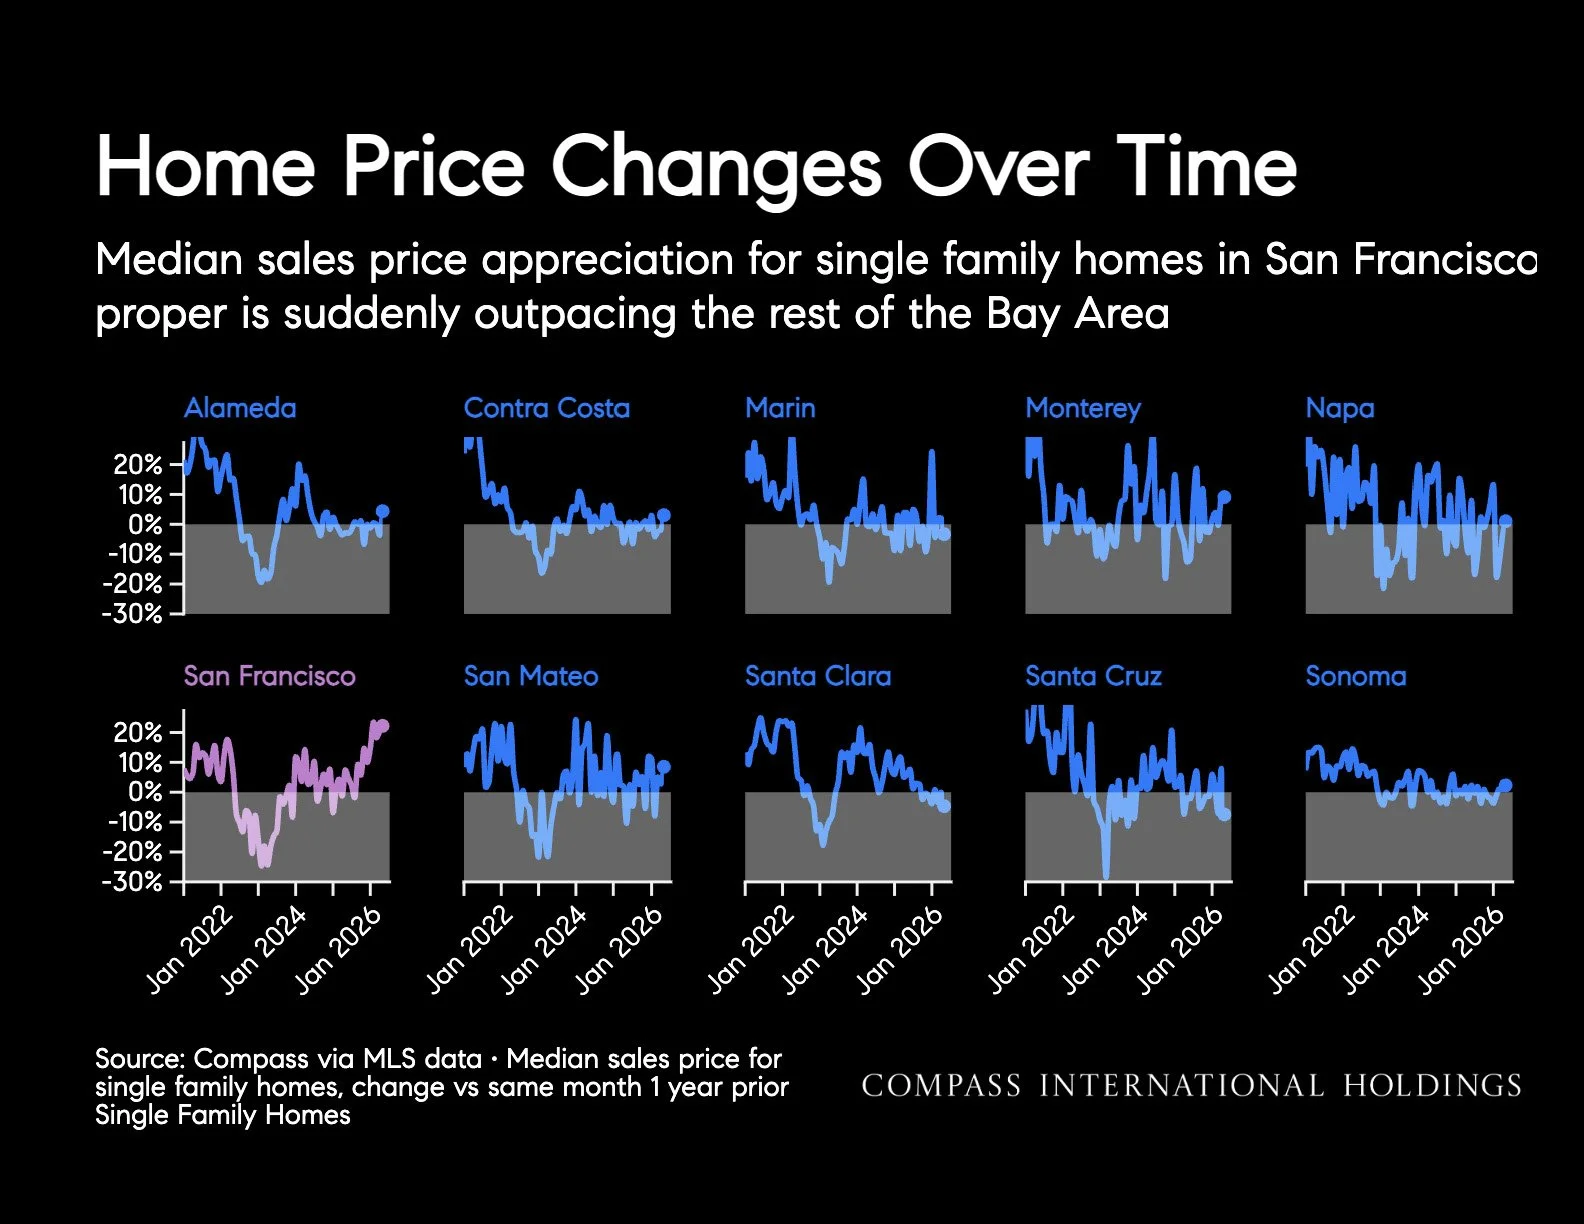
Median sales price appreciation for single family homes in San Francisco proper is suddenly outpacing the rest of the Bay Area. Source: Compass via MLS data • Median sales price for single-family homes, change vs. same month 1 year prior.
San Francisco Median Home Price
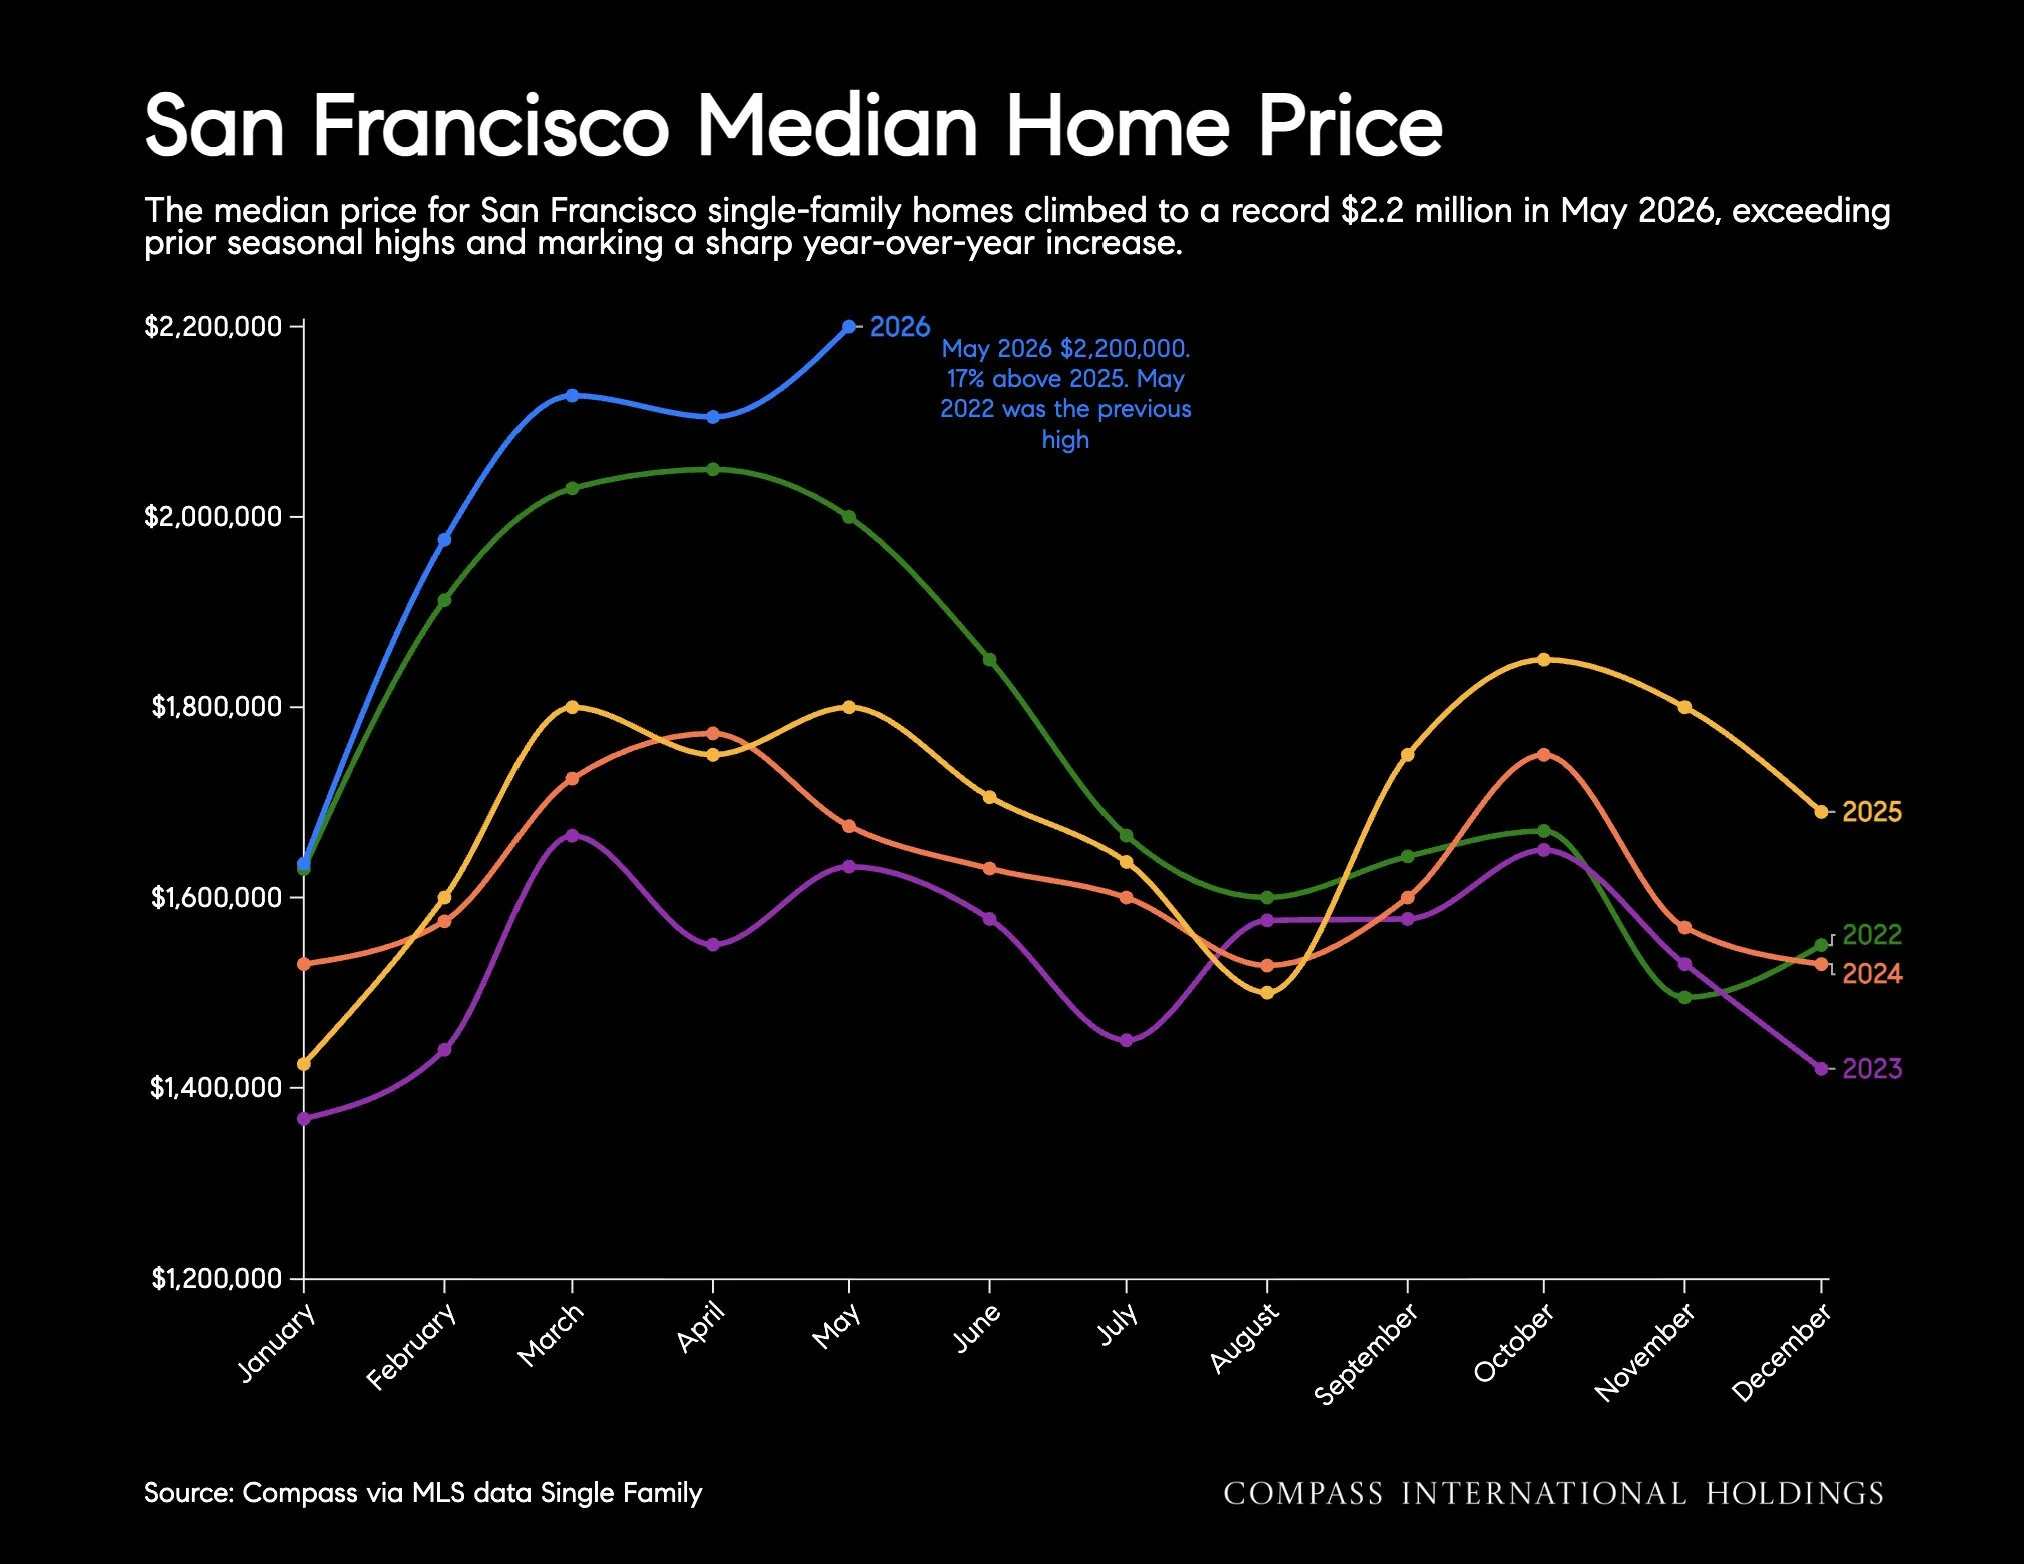
The median price for San Francisco single-family homes climbed to a record $2.2 million in May 2026, exceeding prior seasonal highs and marking a sharp year-over-year increase. Source: Compass via MLS data Single Family.
San Francisco Single Family Price Trends
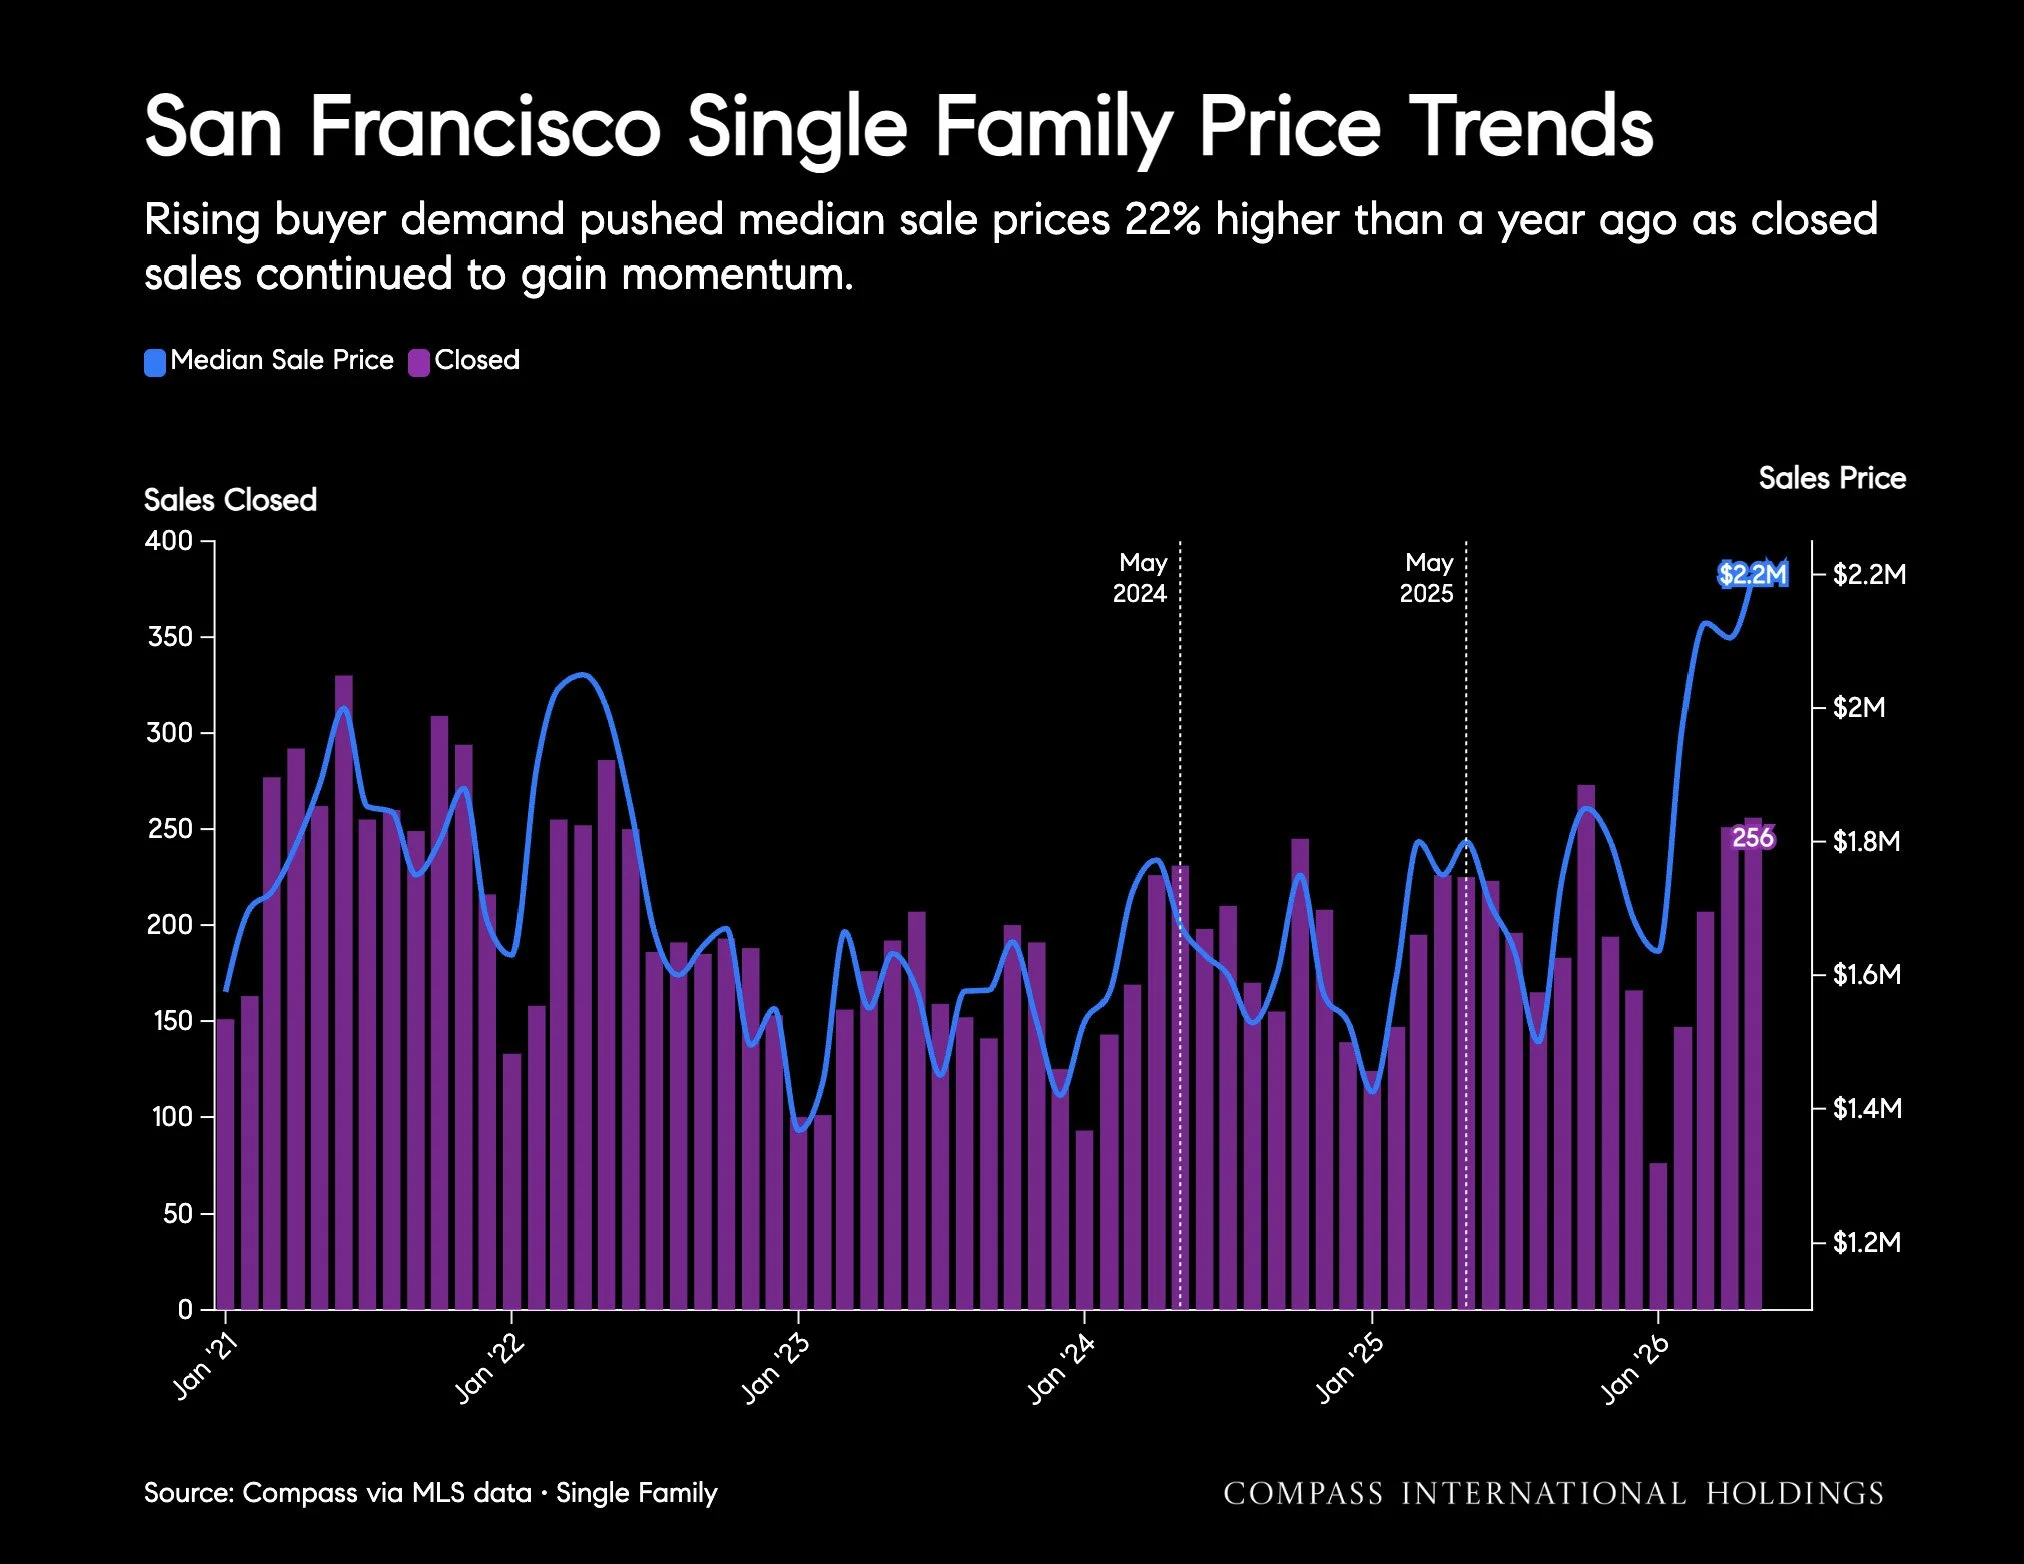
Rising buyer demand pushed median sale prices 22% higher than a year ago as closed sales continued to gain momentum. Source: Compass via MLS data • Single Family
San Francisco Median Price Per Square Foot
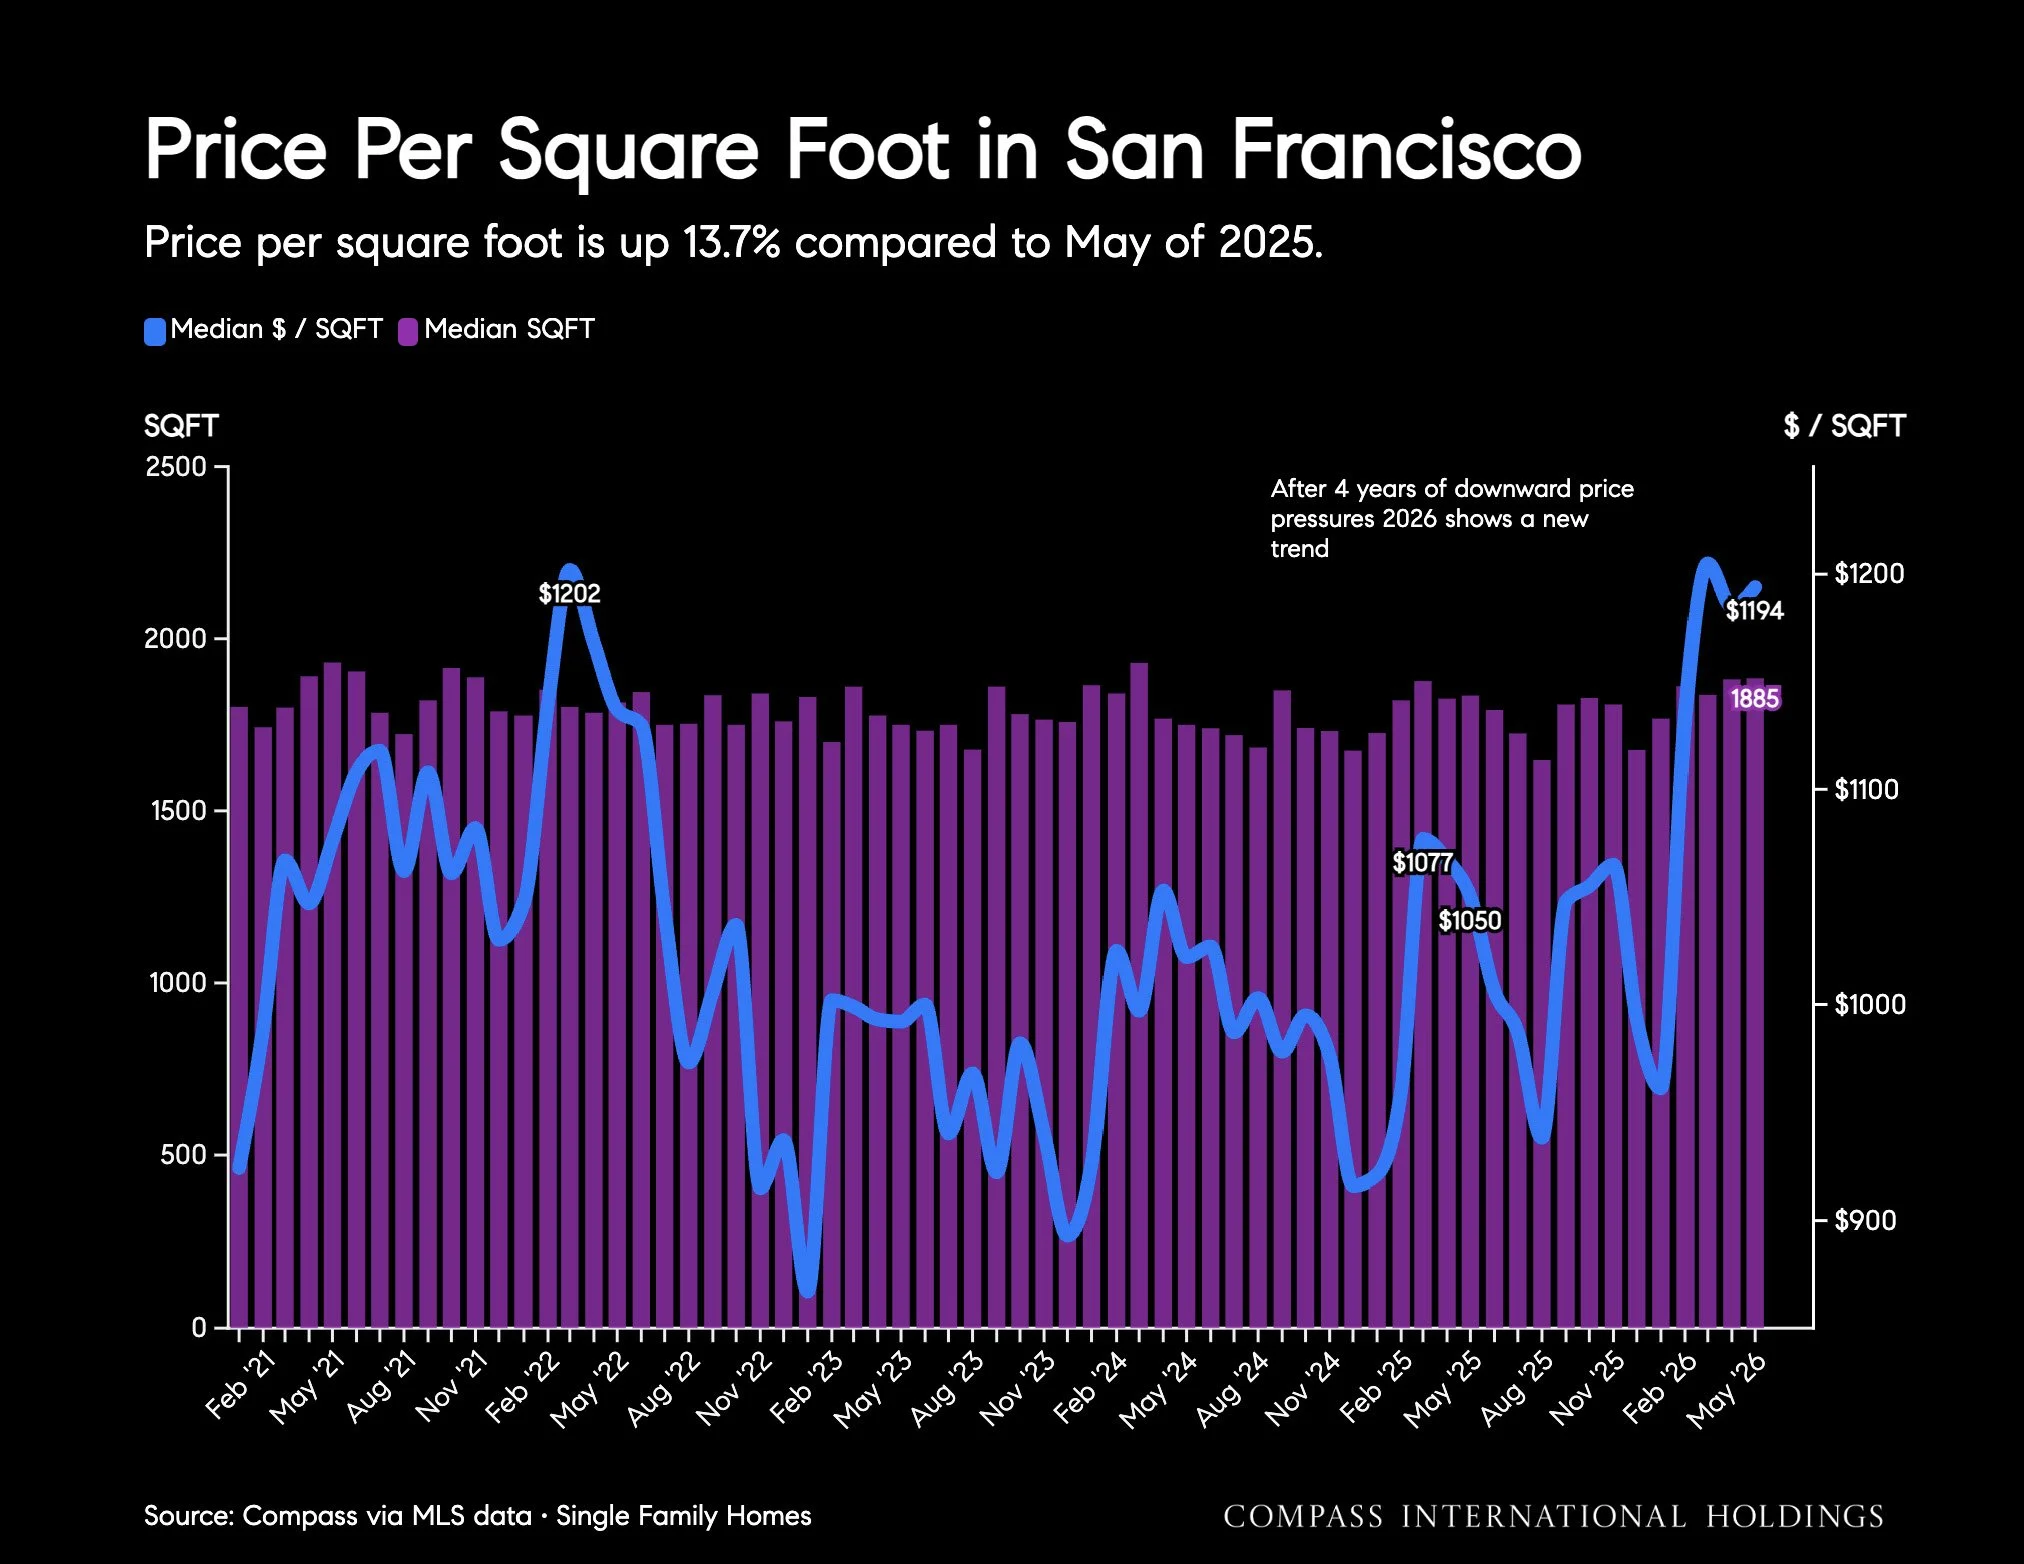
The median $psqft for San Francisco single-family homes in May exceeded prior seasonal highs. Source: Compass International Holdings, Single Family
San Francisco Active Inventory
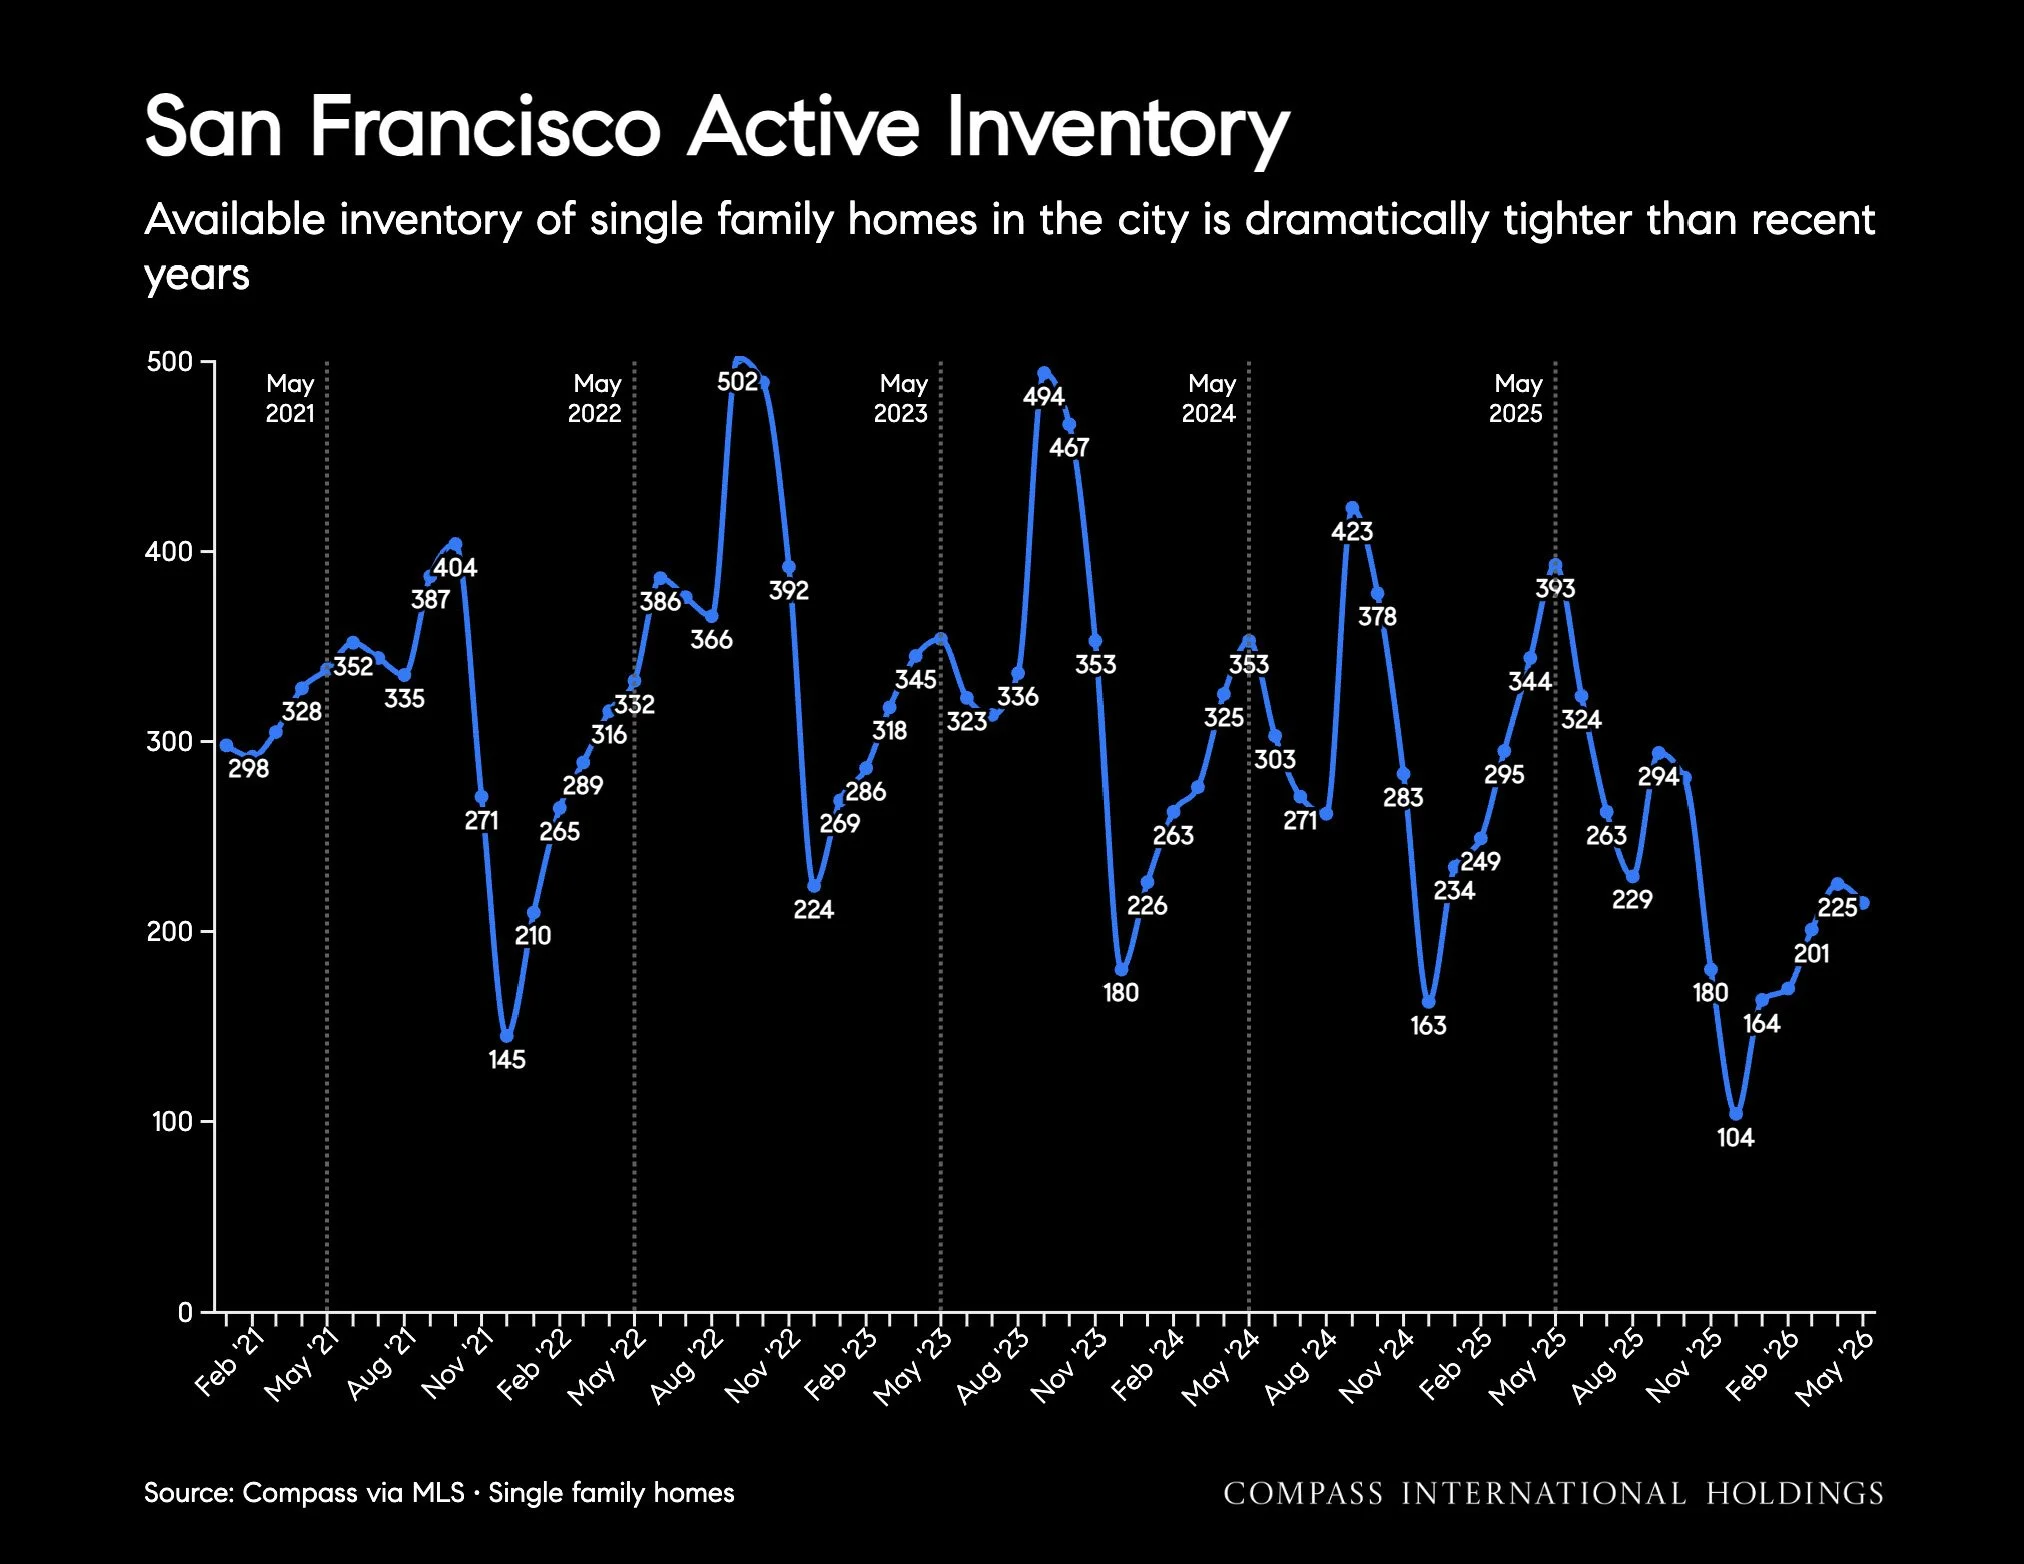
Available inventory of single family homes in the city is dramatically tighter than recent years. Source: Compass via MLS • Single family homes
Inventory and Pending Sales
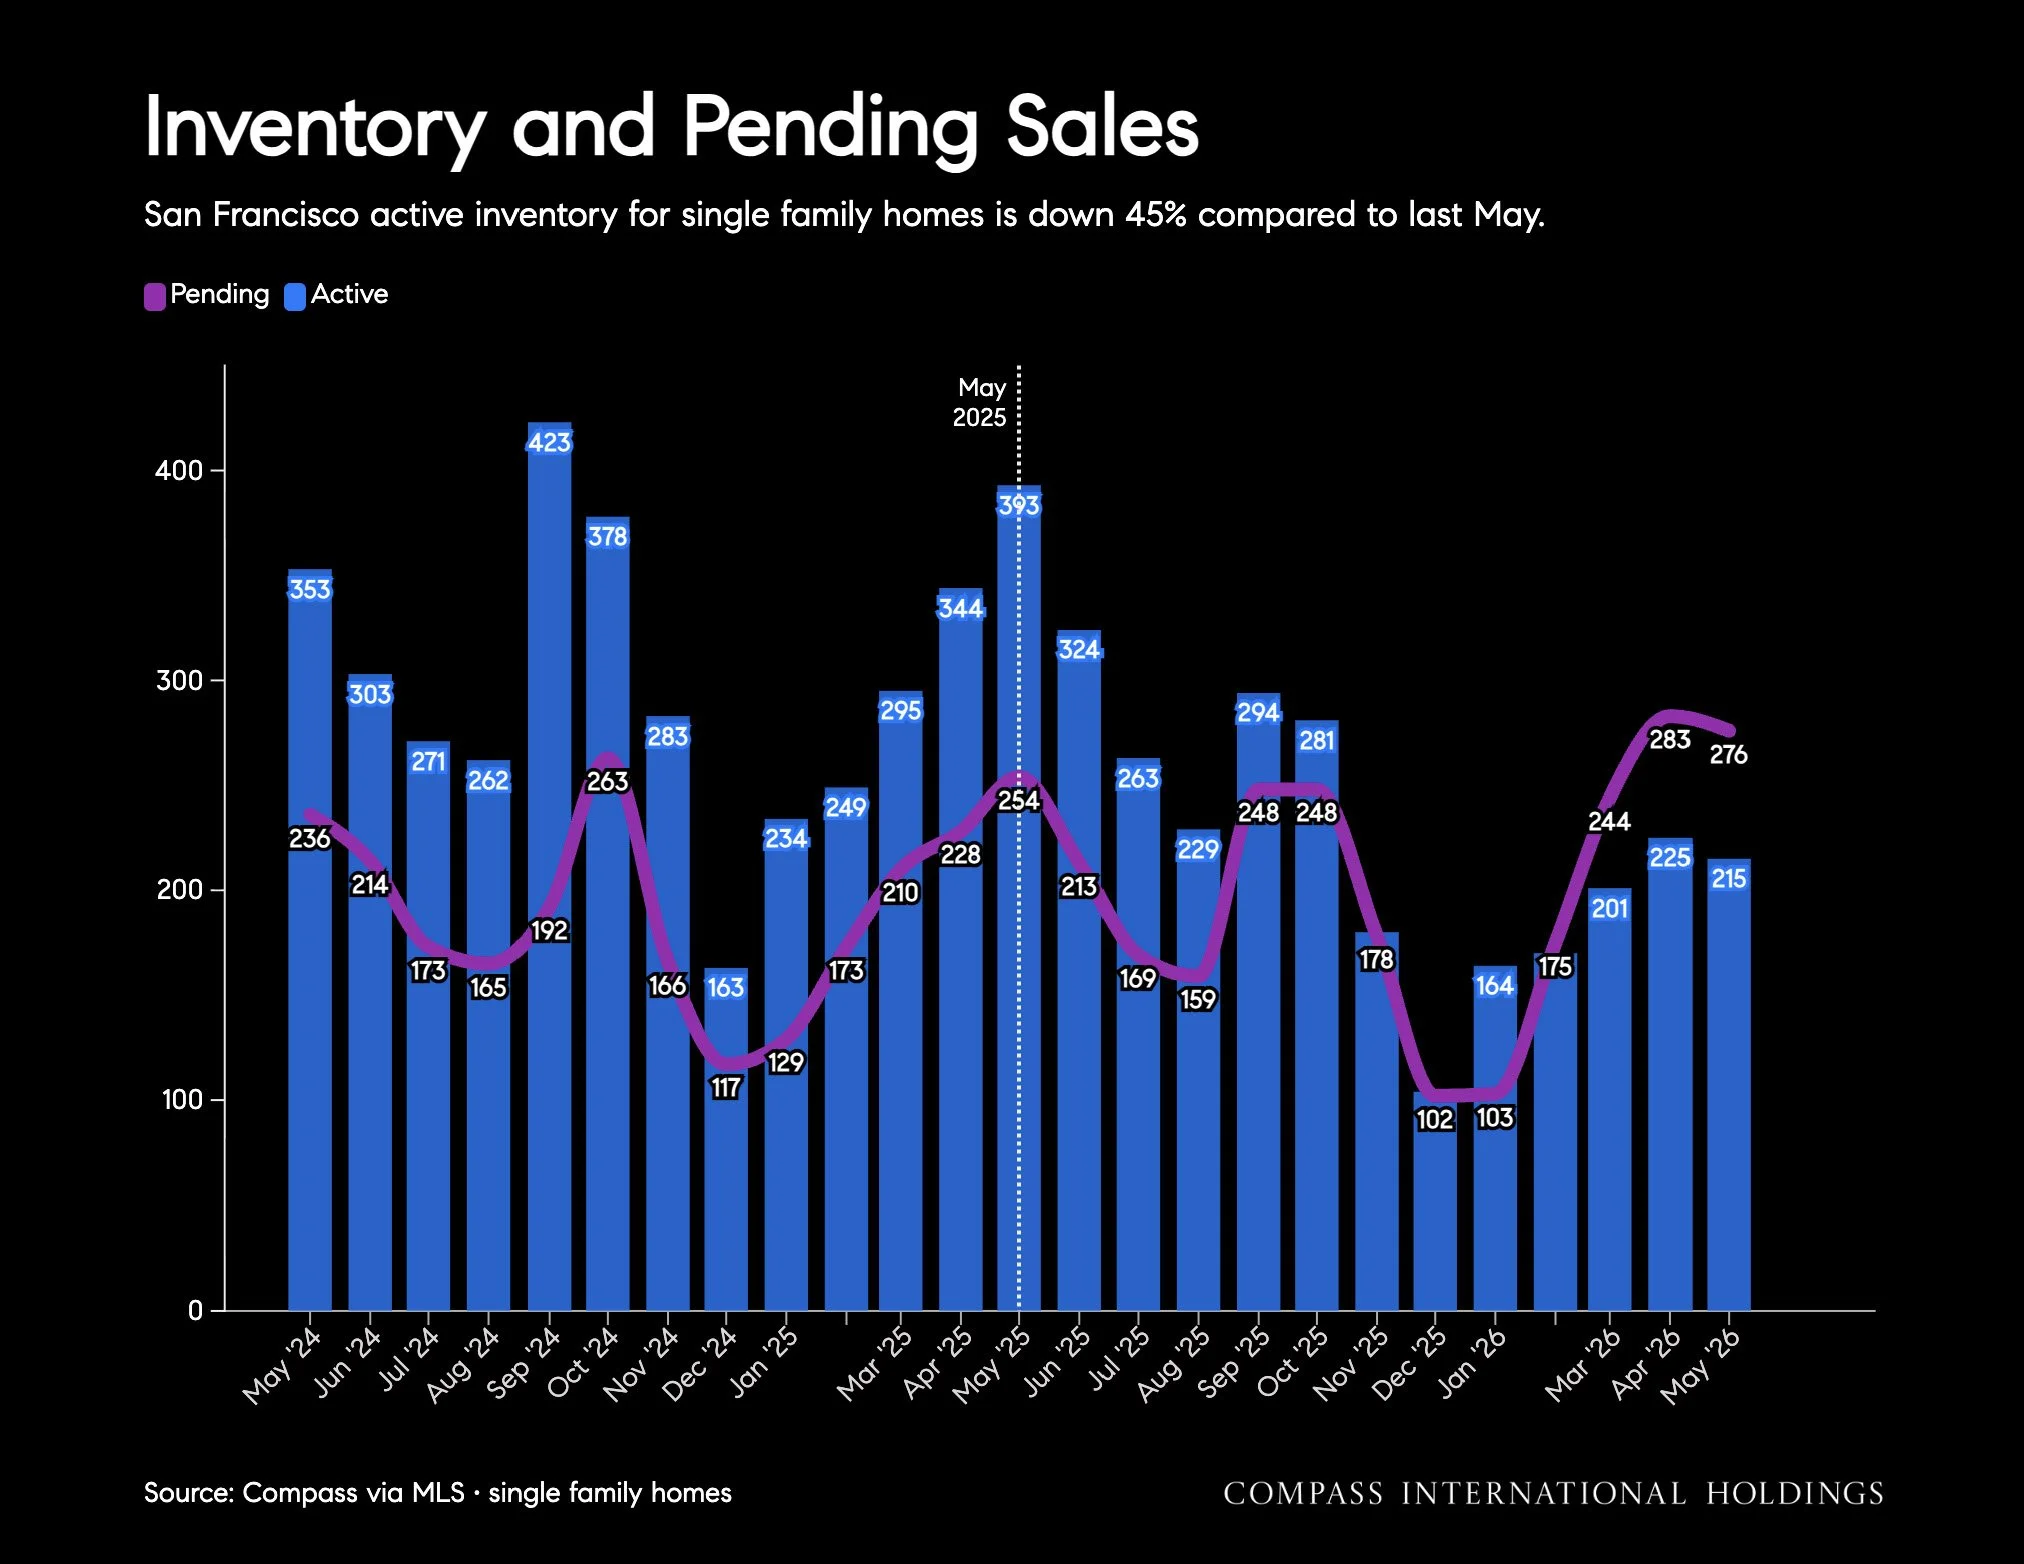
San Francisco active inventory for single family homes is down 45% compared to last May. Source: Compass via MLS • single family homes.
San Francisco Seller Pricing and Buyer Demand

Strong competition persists. Overbidding remains common, yet the leevl of price reductions suggests sellers myst price competitively to capture demand. Source: Compass via MLS • single family homes.
Days on Market
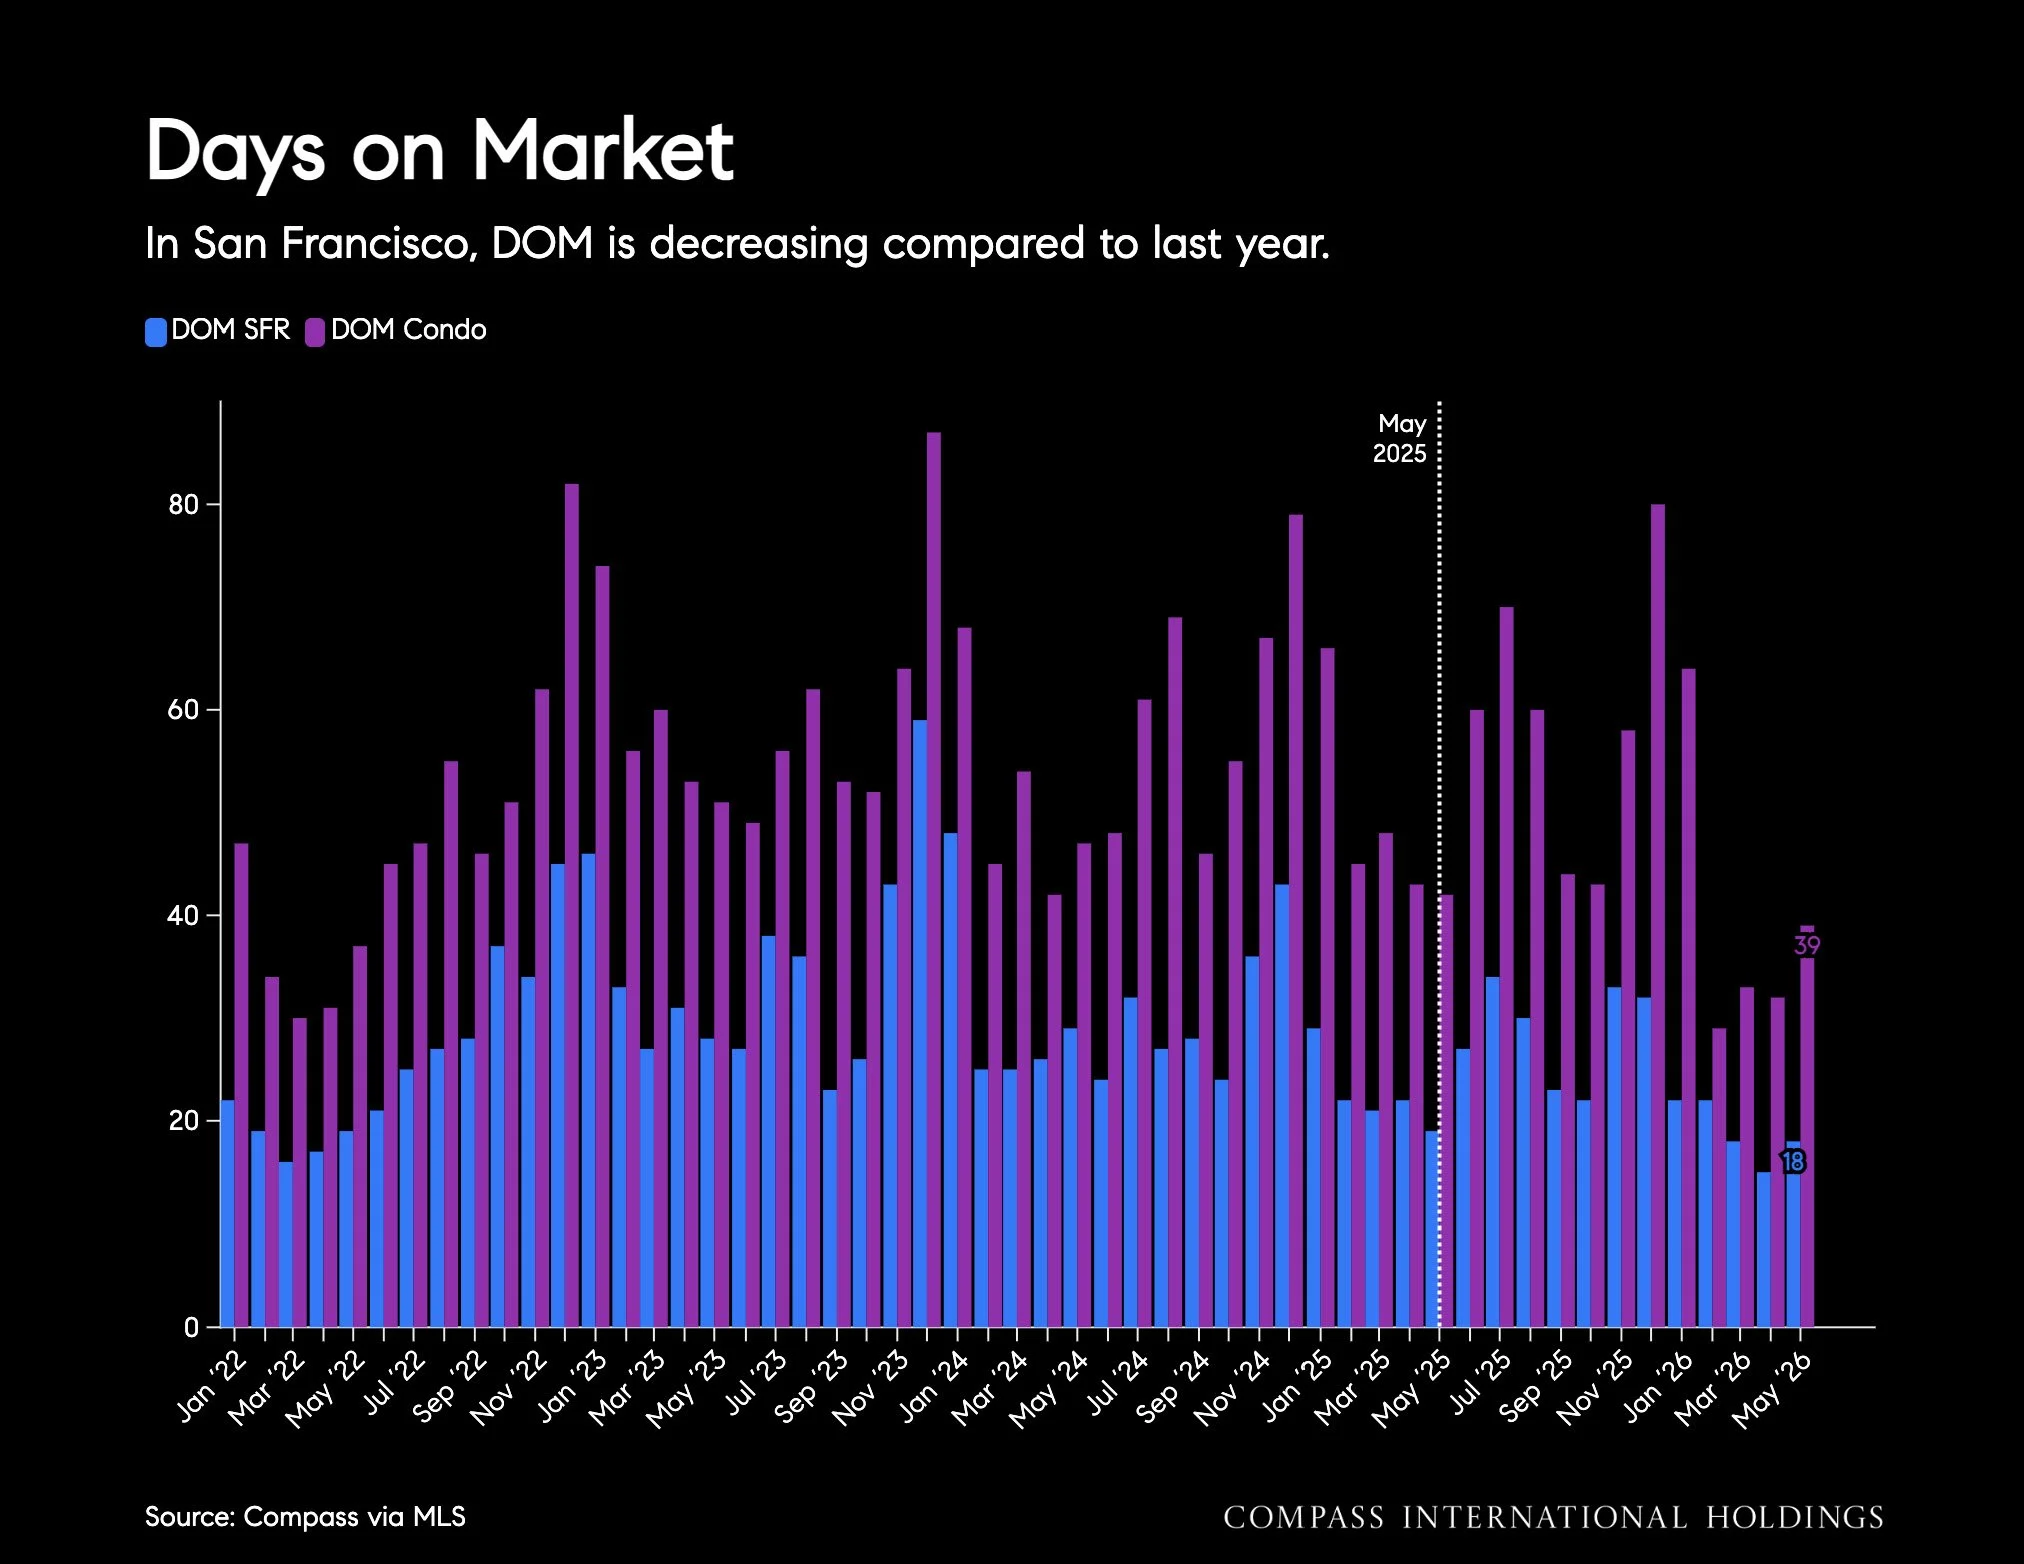
In San Francisco, DOM is decreasing compared to last year. Source: Compass via MLS
Average Days on Market
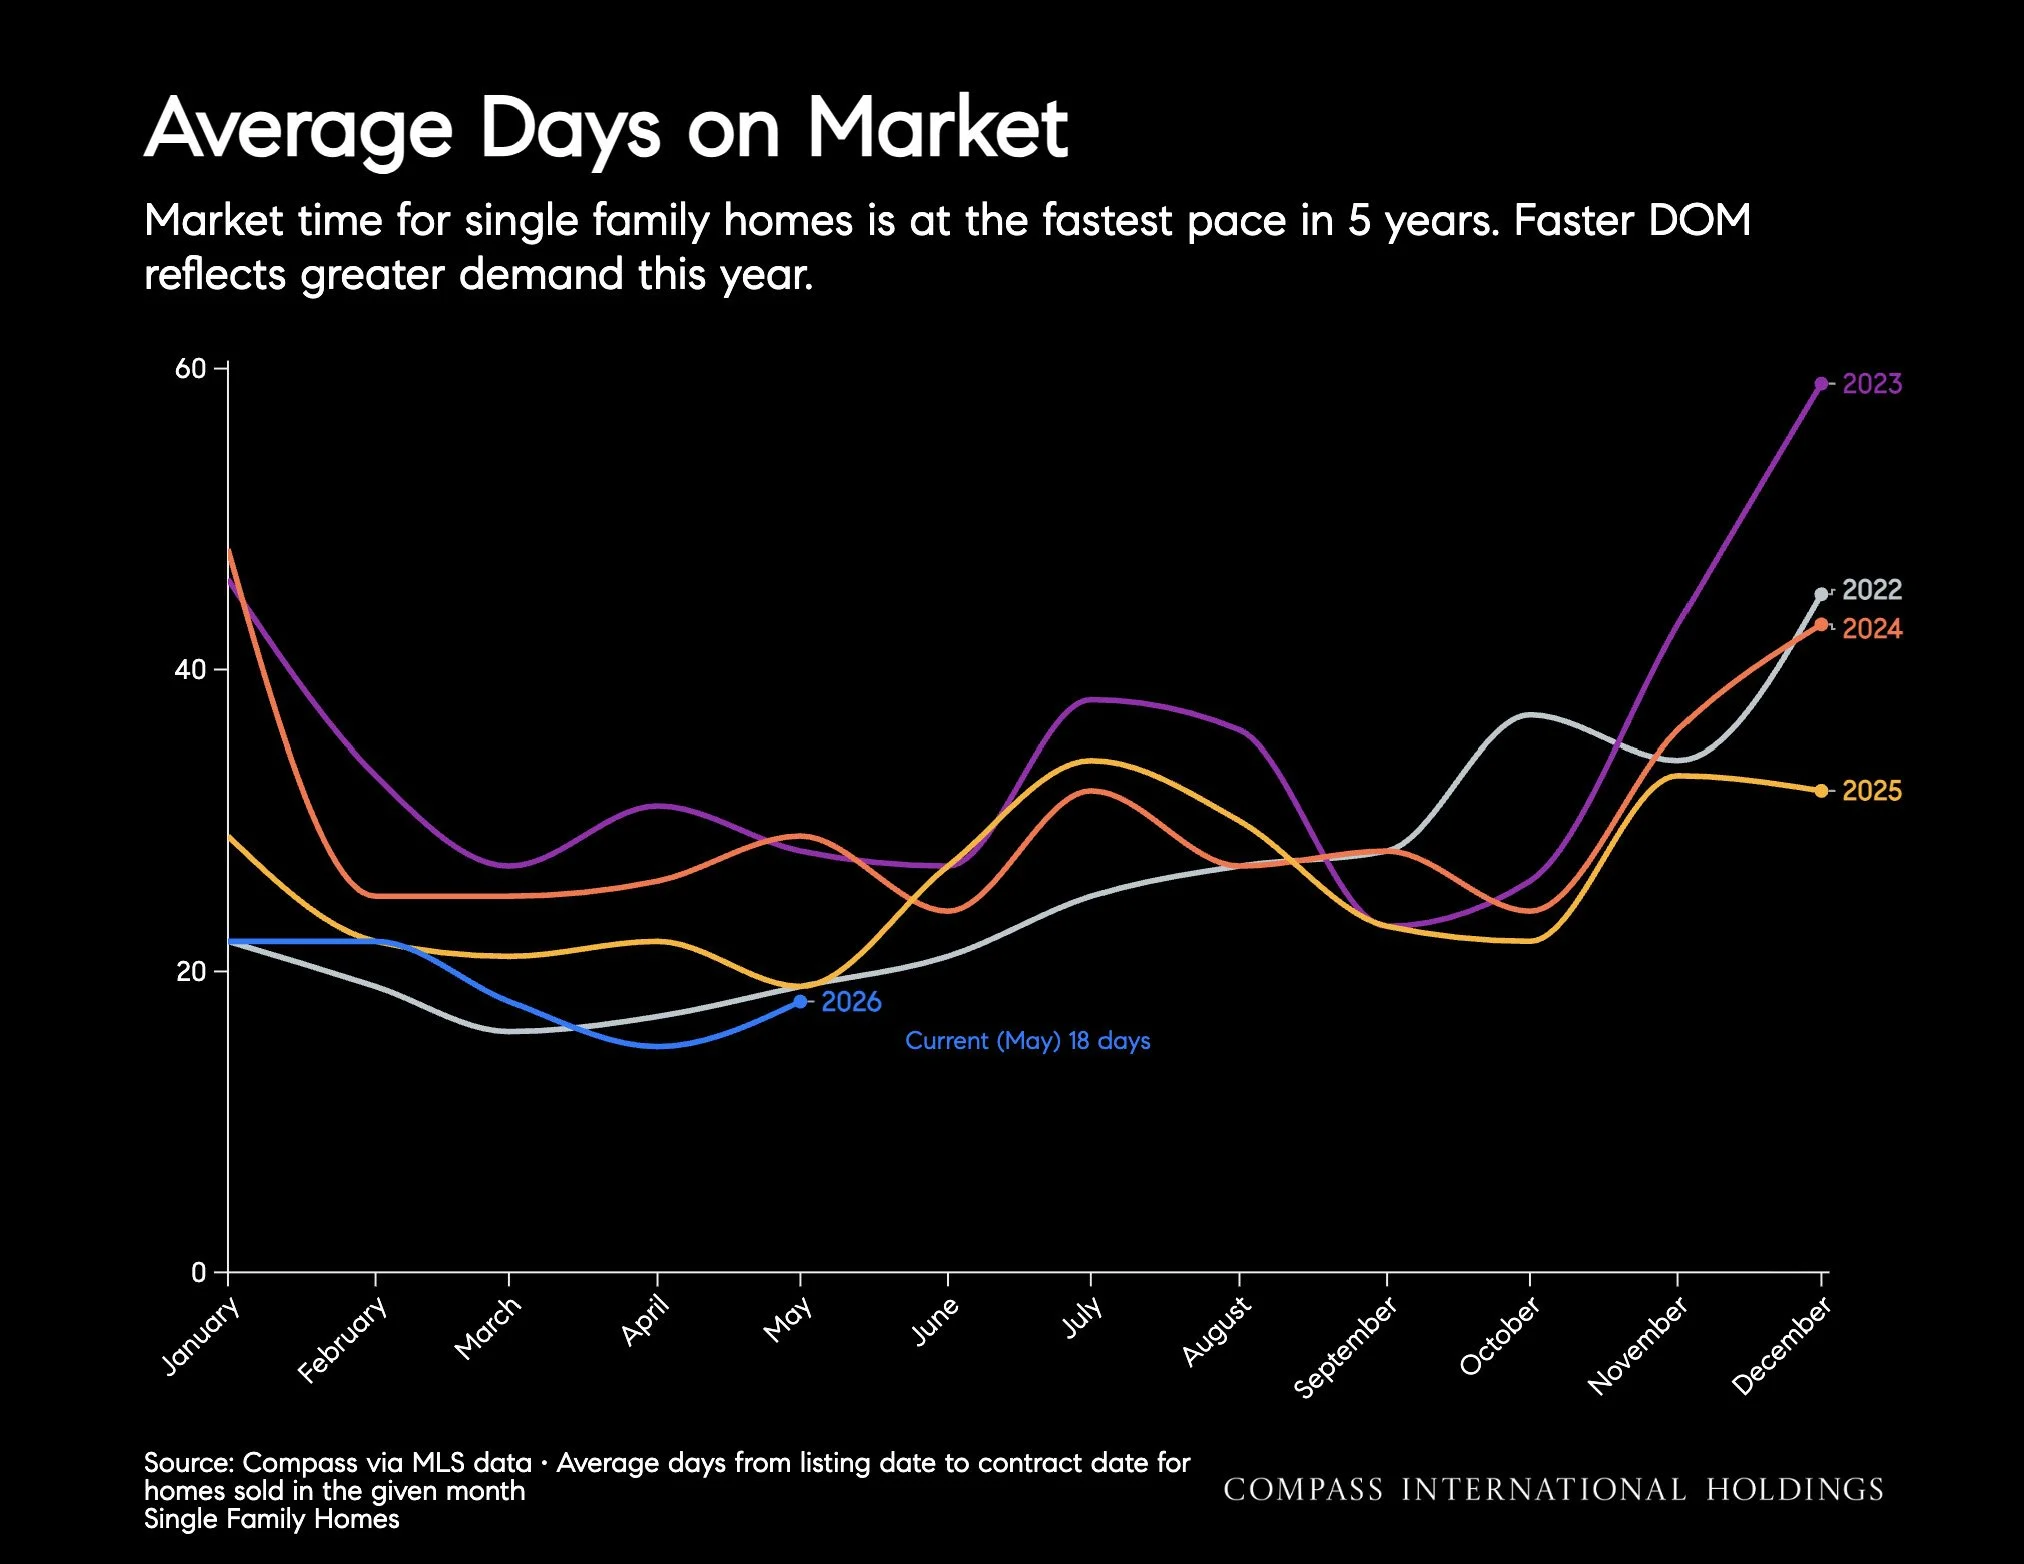
Market time for single family homes is at the fastest pace in 5 years. Faster DOM reflects greater demand this year. Source: Compass via MLS data • Average days from listing date to contract date for homes sold in the given month, Single Family Homes.
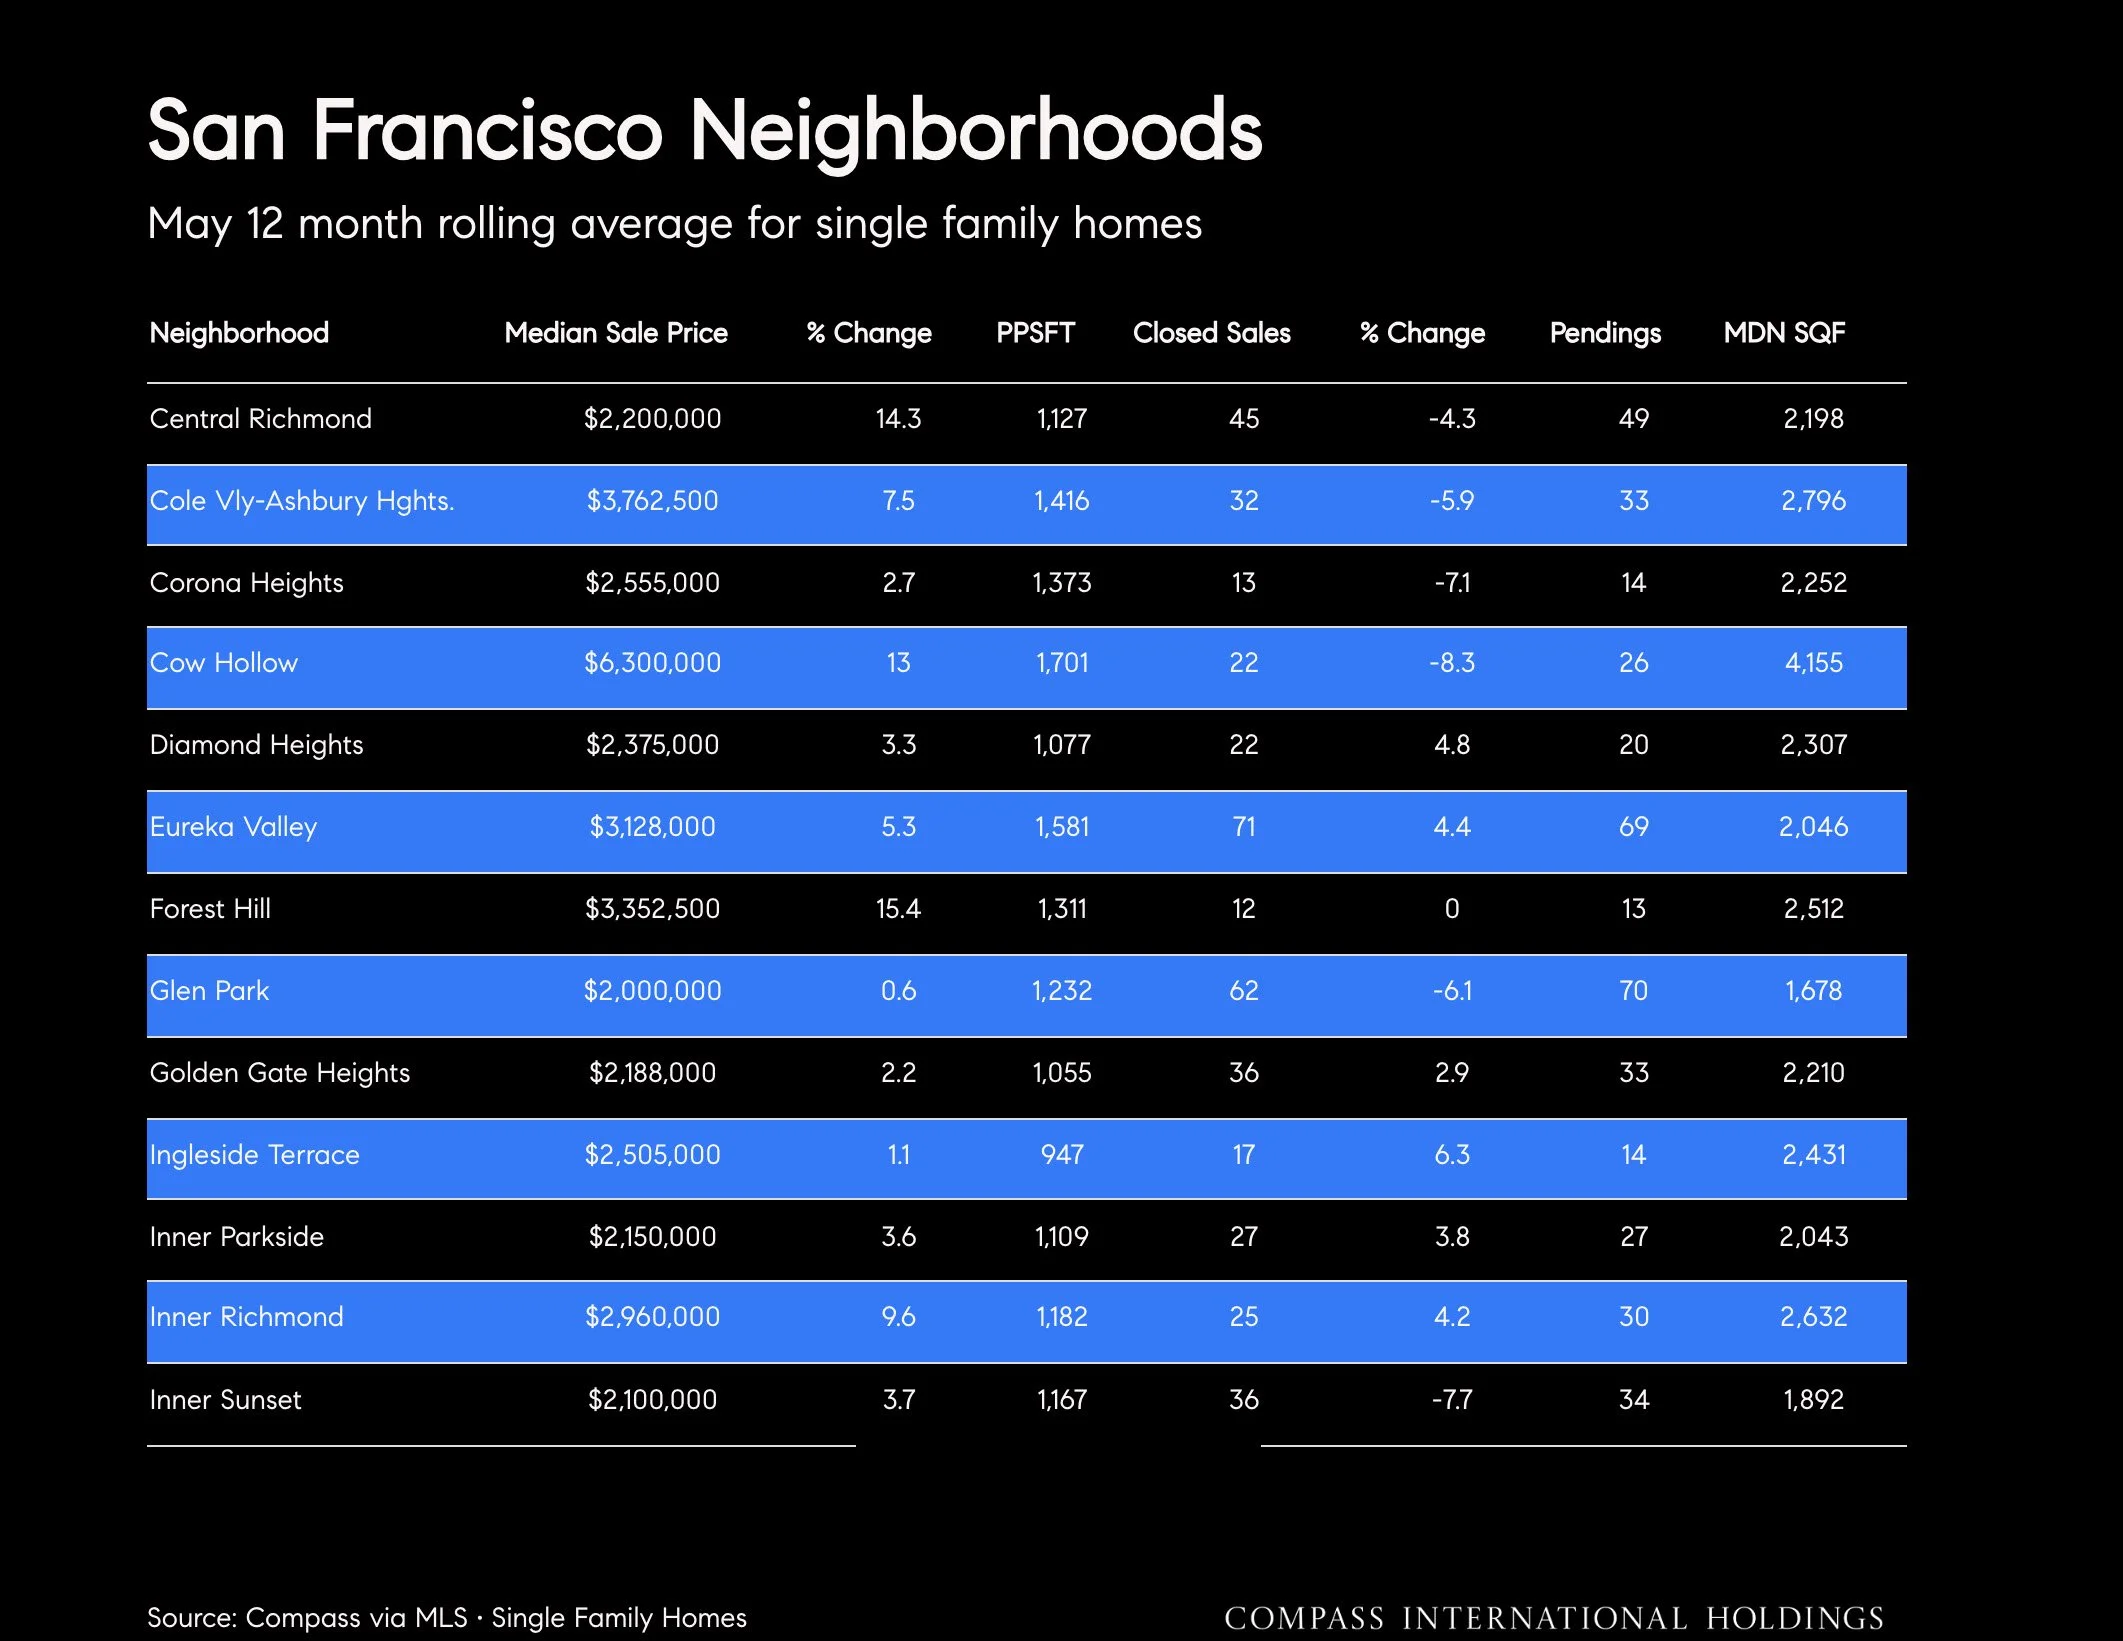
San Francisco Neighborhoods
May 12 month rolling average for single family homes
San Francisco Median Condo Price
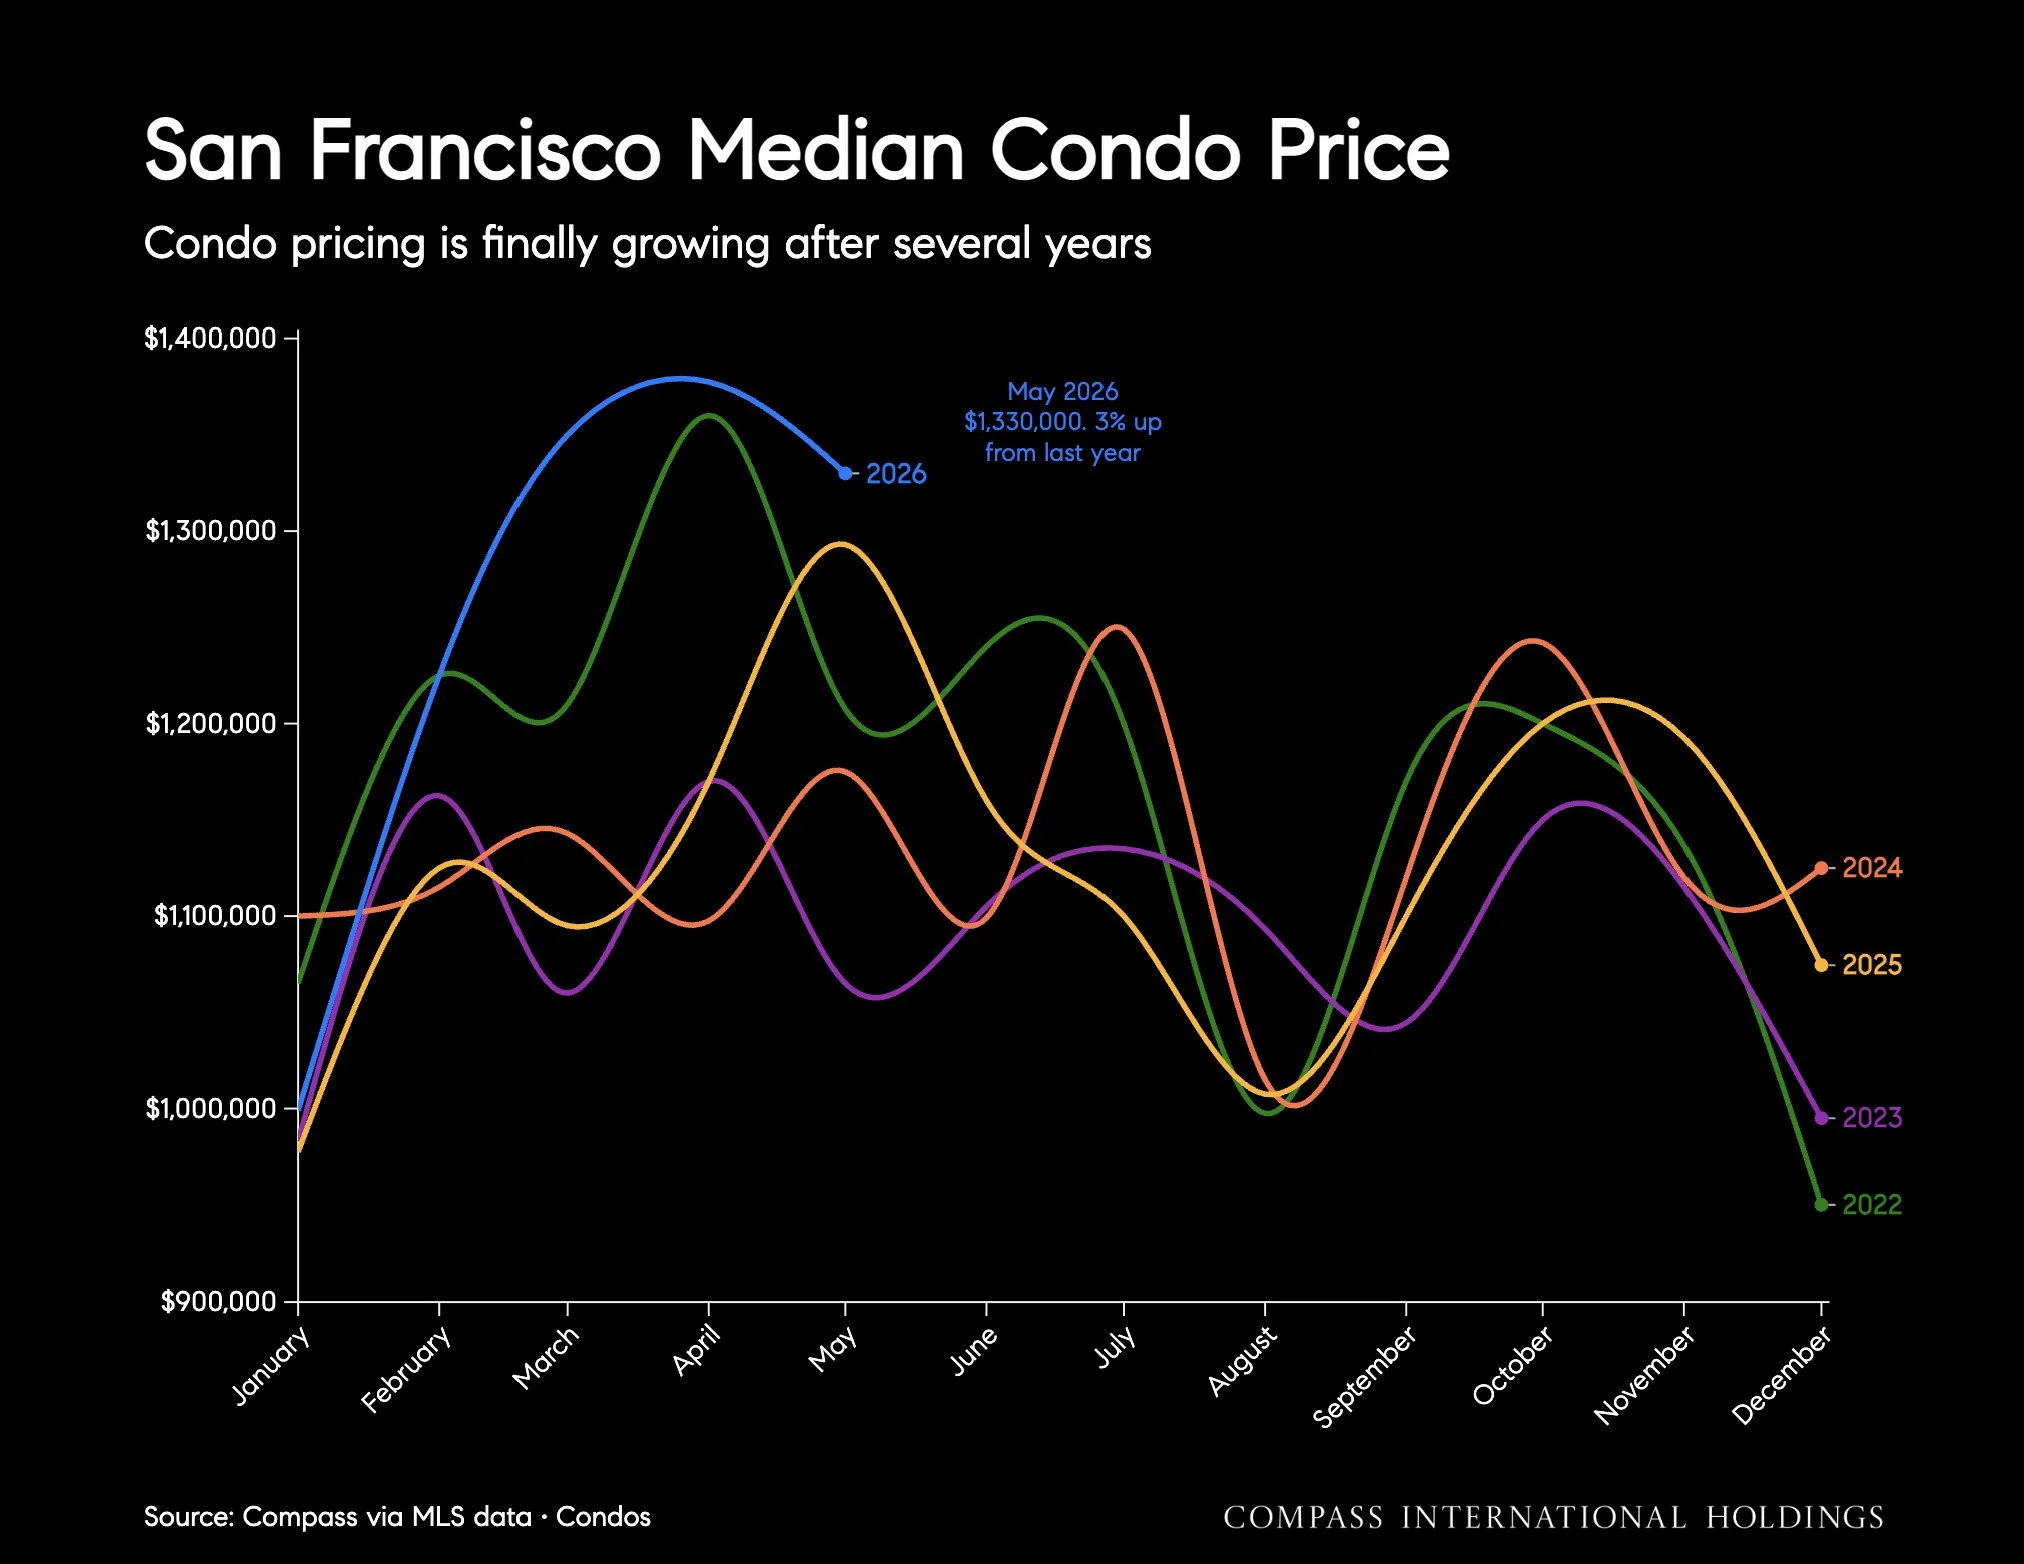
Condo pricing is finally growing after several years. Source: Compass via MLS data • Condos.
San Francisco Condo Price Trends
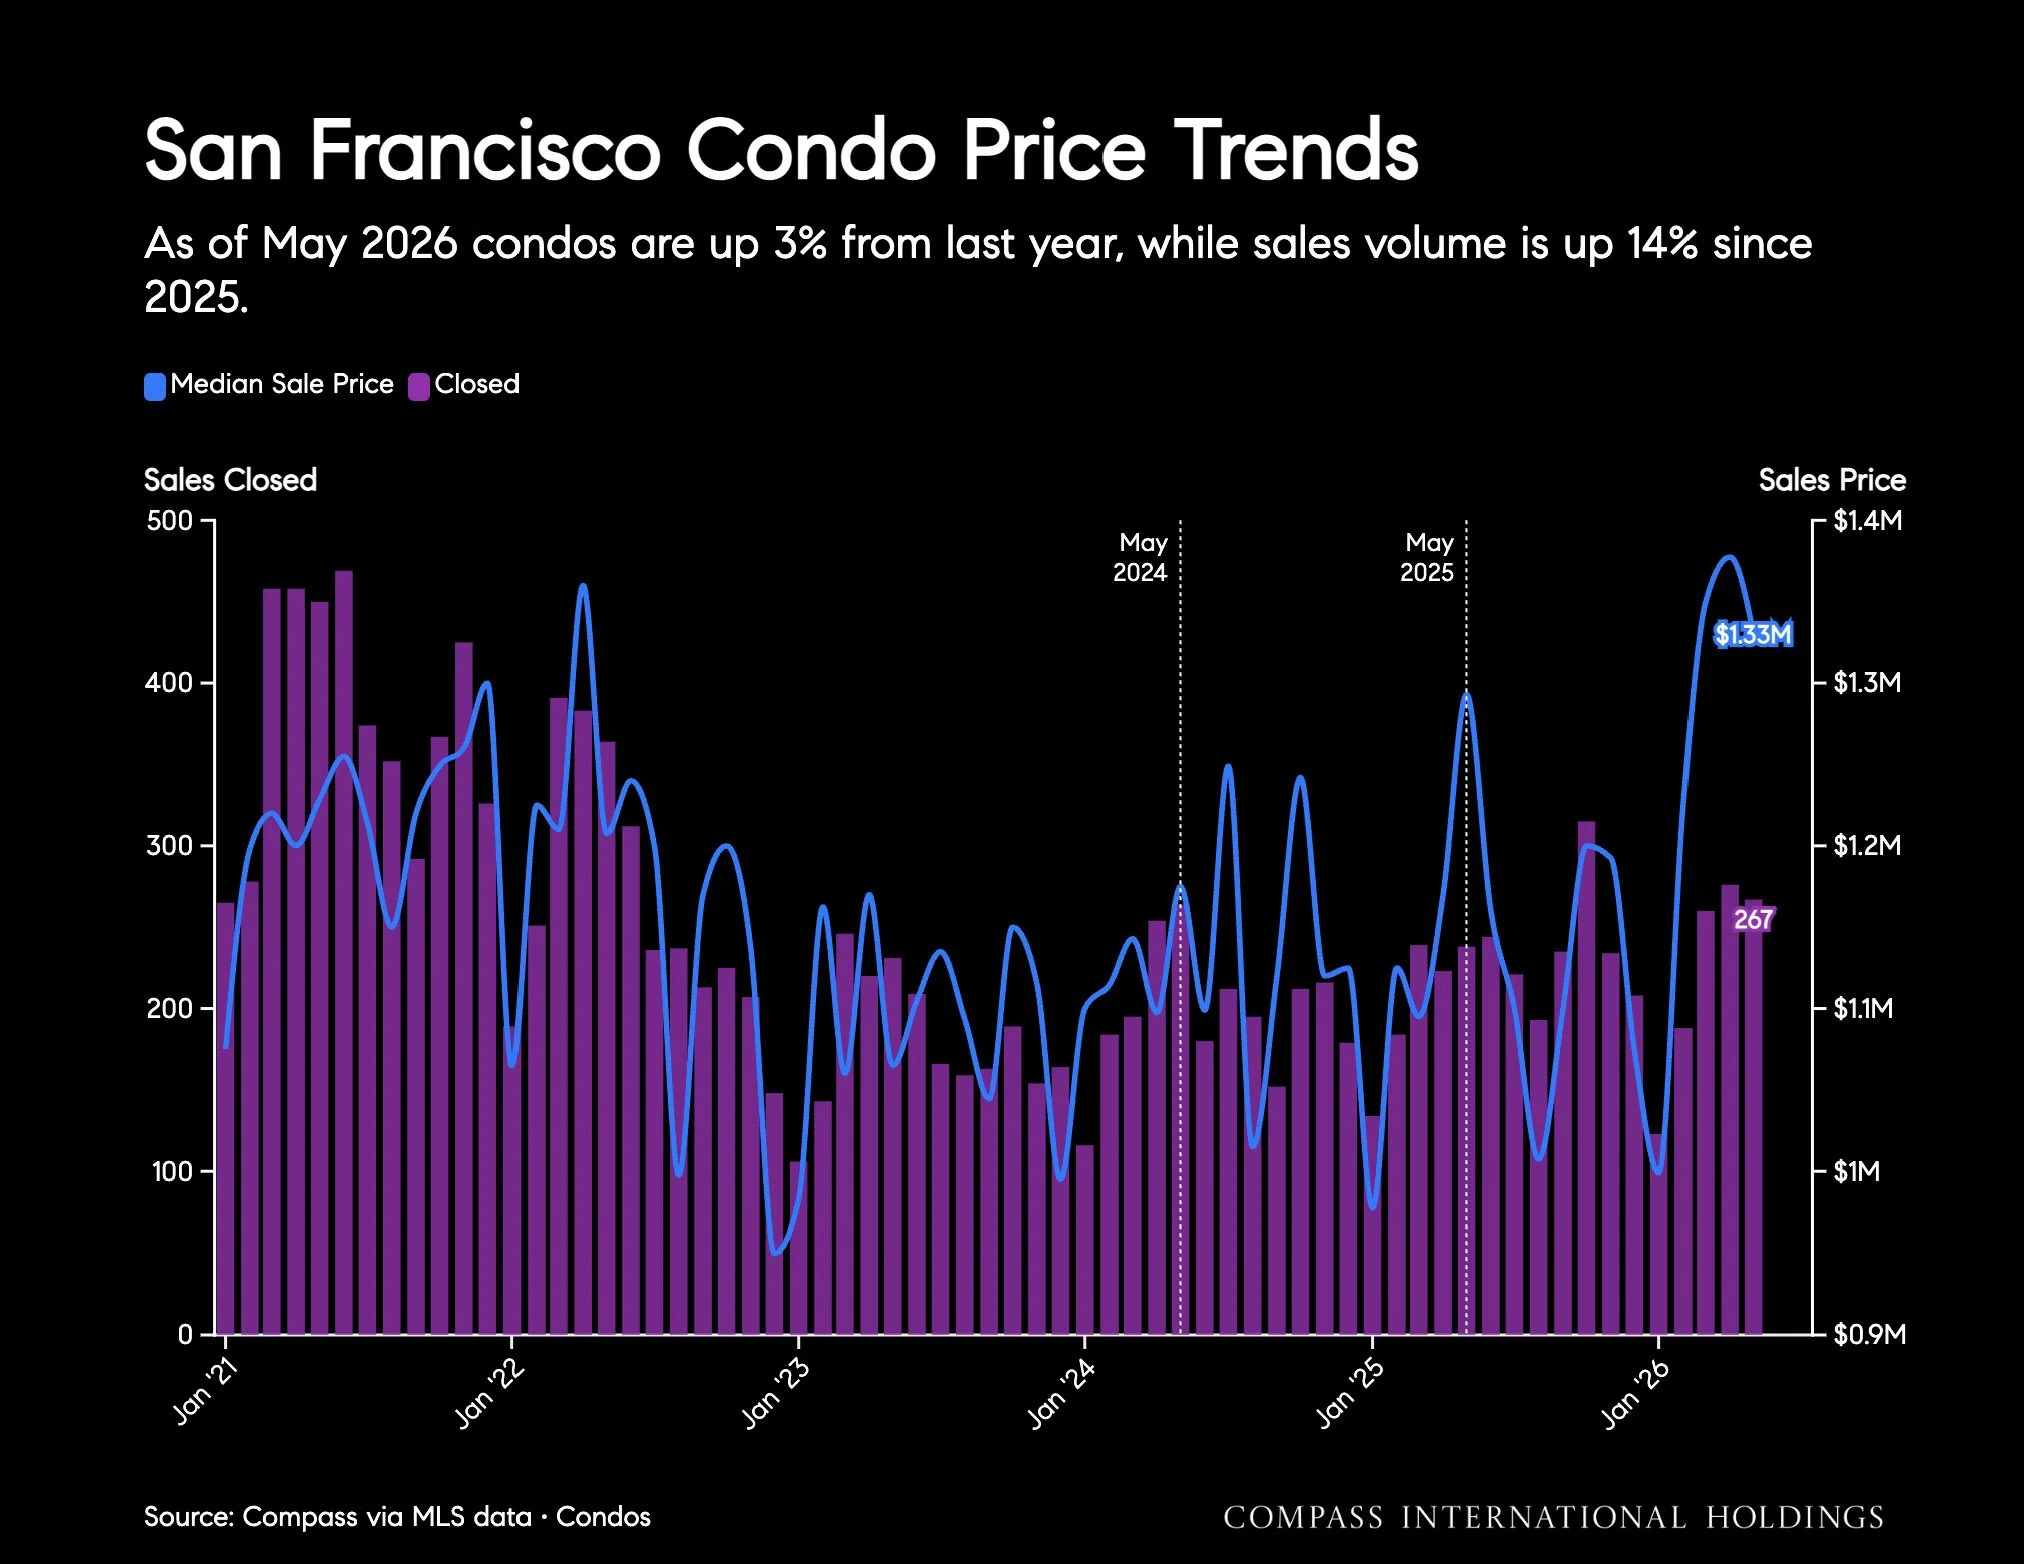
As of May 2026 condos are up 3% from last year, while sales volume is up 14% since 2025. Source: Compass via MLS data • Condos
Price Per Square Foot in San Francisco
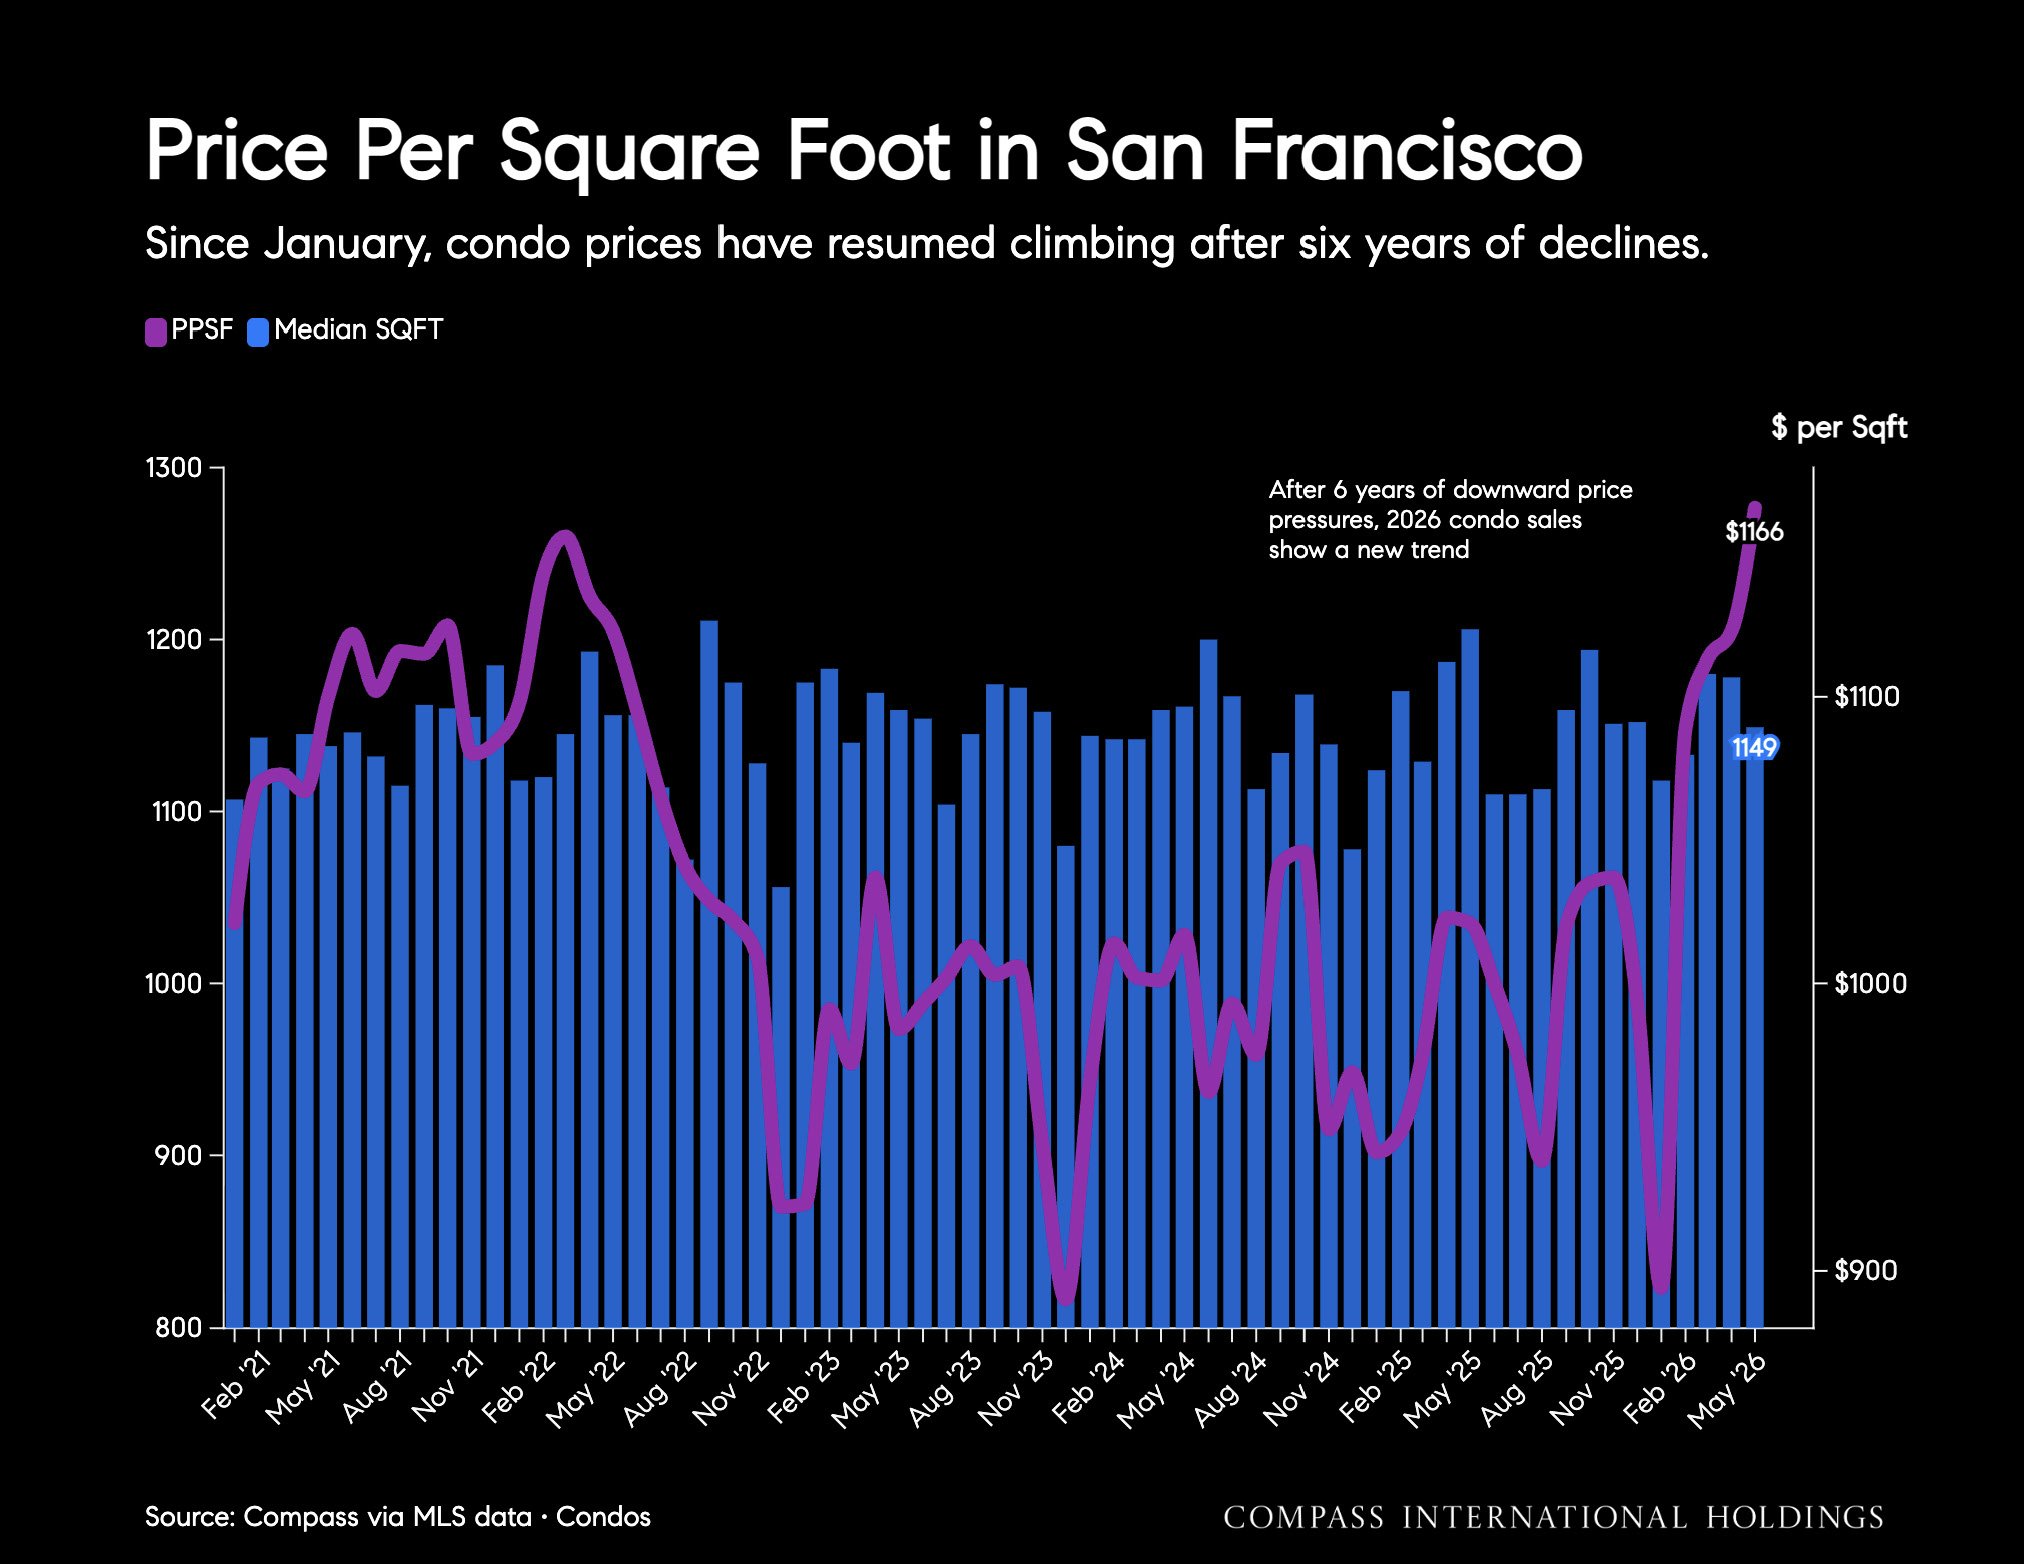
Since January, condo prices have resumed climbing after six years of declines. After 6 years of downward price pressures, 2026 condo sales show a new trend. Source: Compass via MLS data • Condos
San Francisco Condo Active Inventory
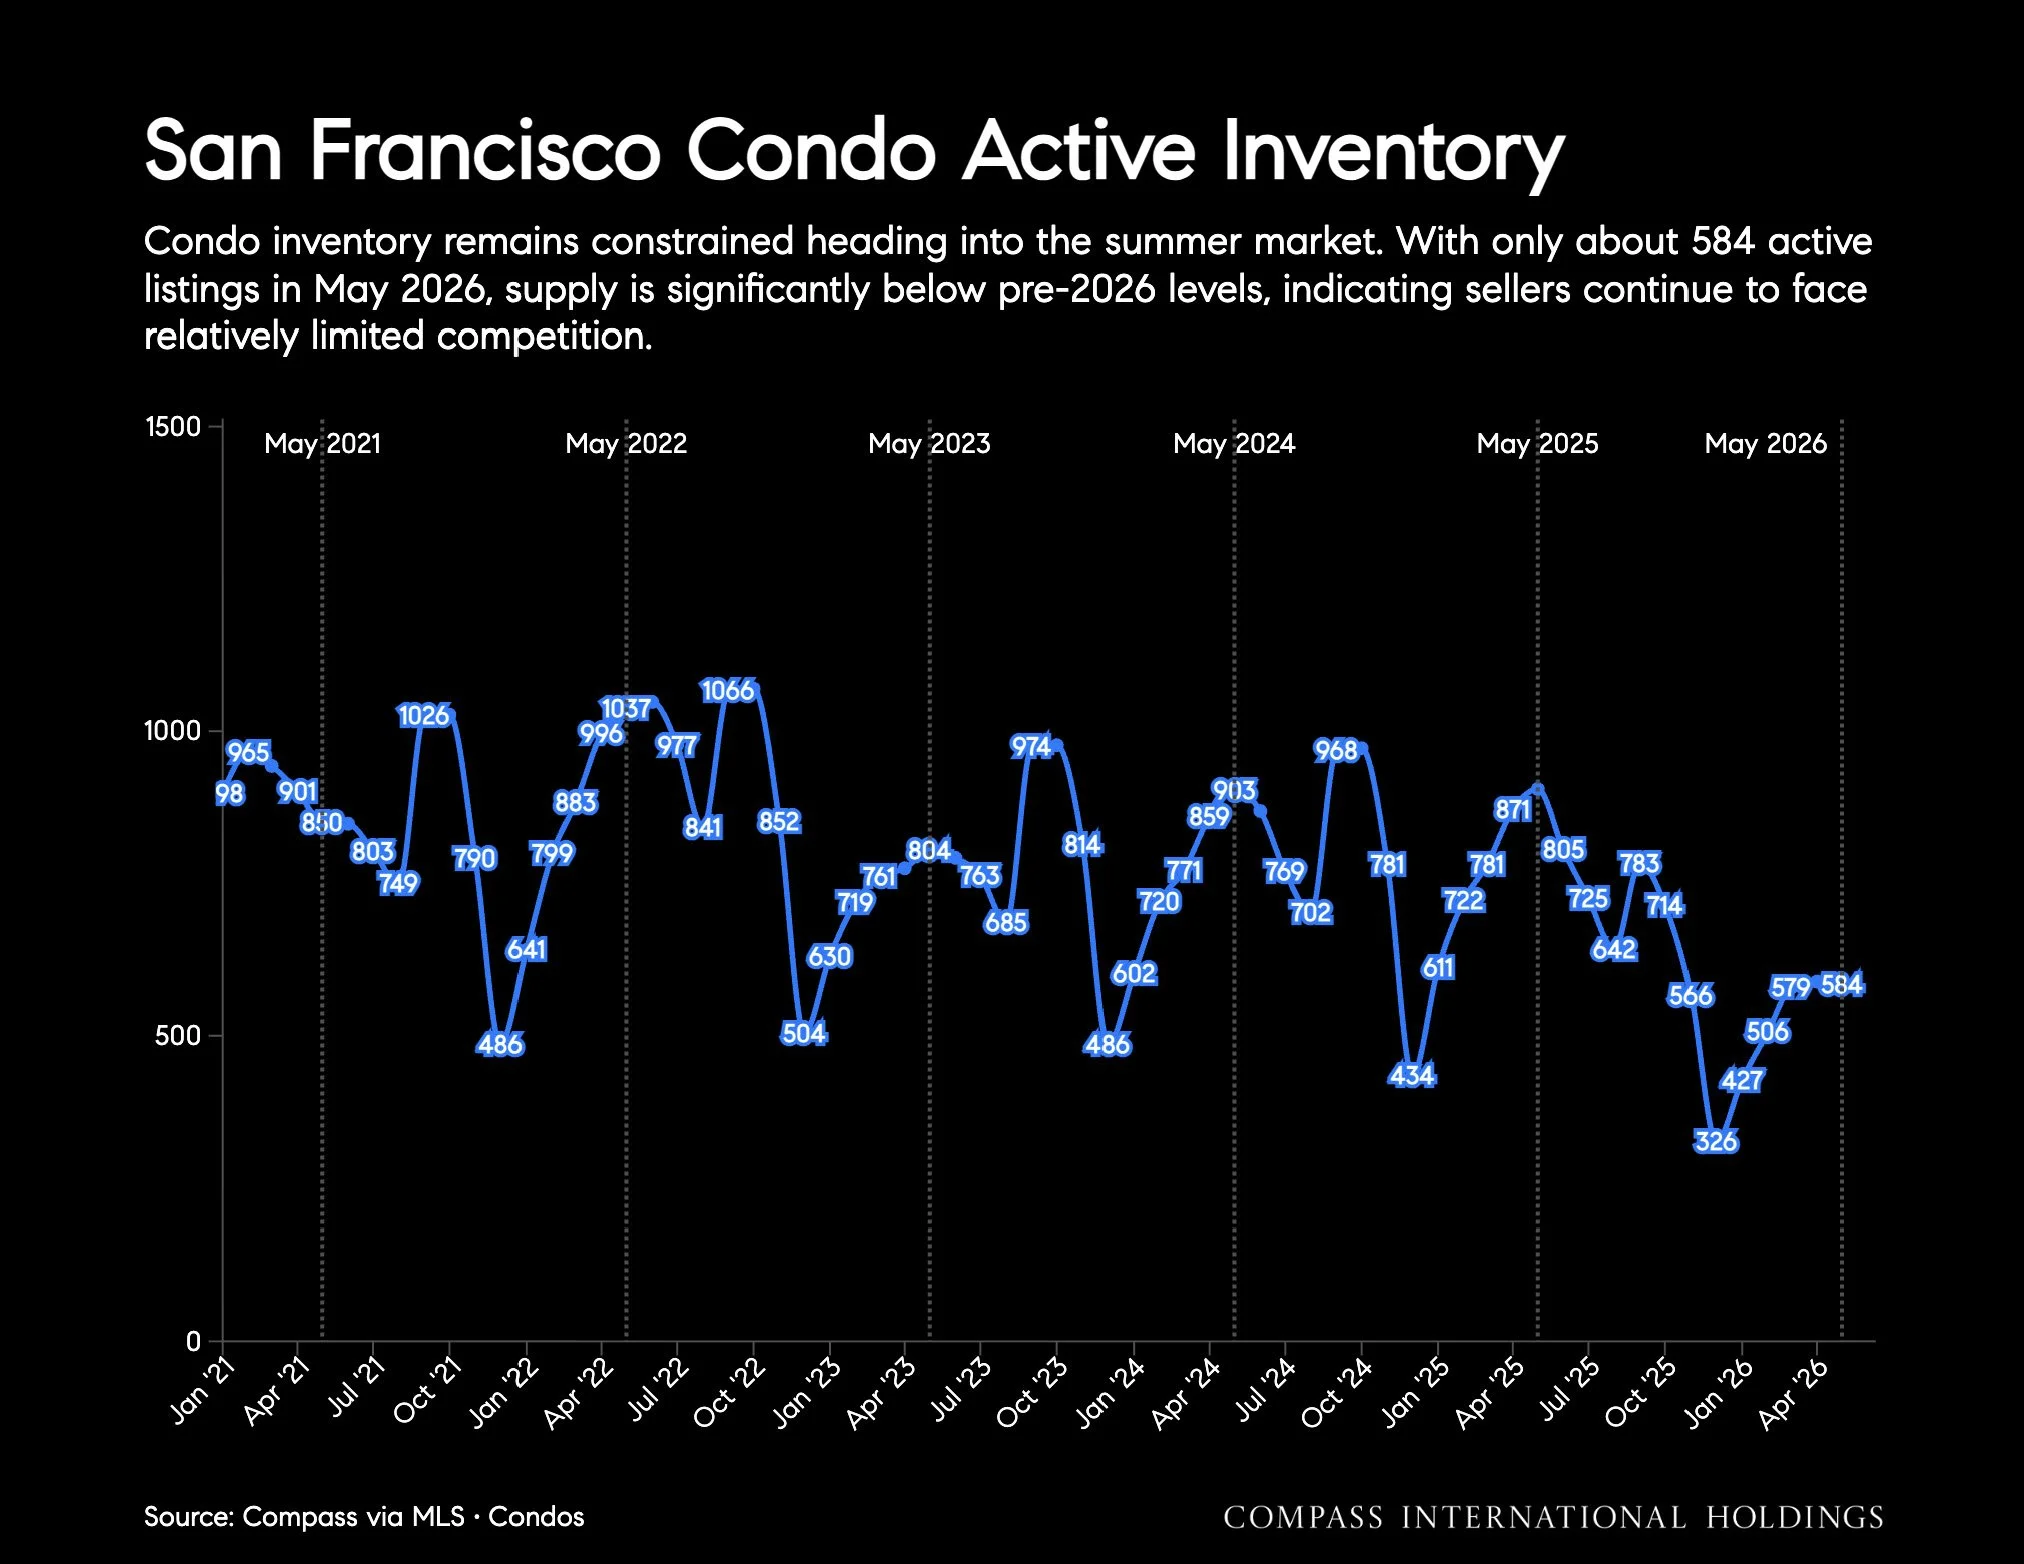
Condo inventory remains constrained heading into the summer market. With only about 584 active listings in May 2026, supply is significantly below pre-2026 levels, indicating sellers continue to face relatively limited competition. Source: Compass via MLS • Condos
San Francisco Condo Monthly Status
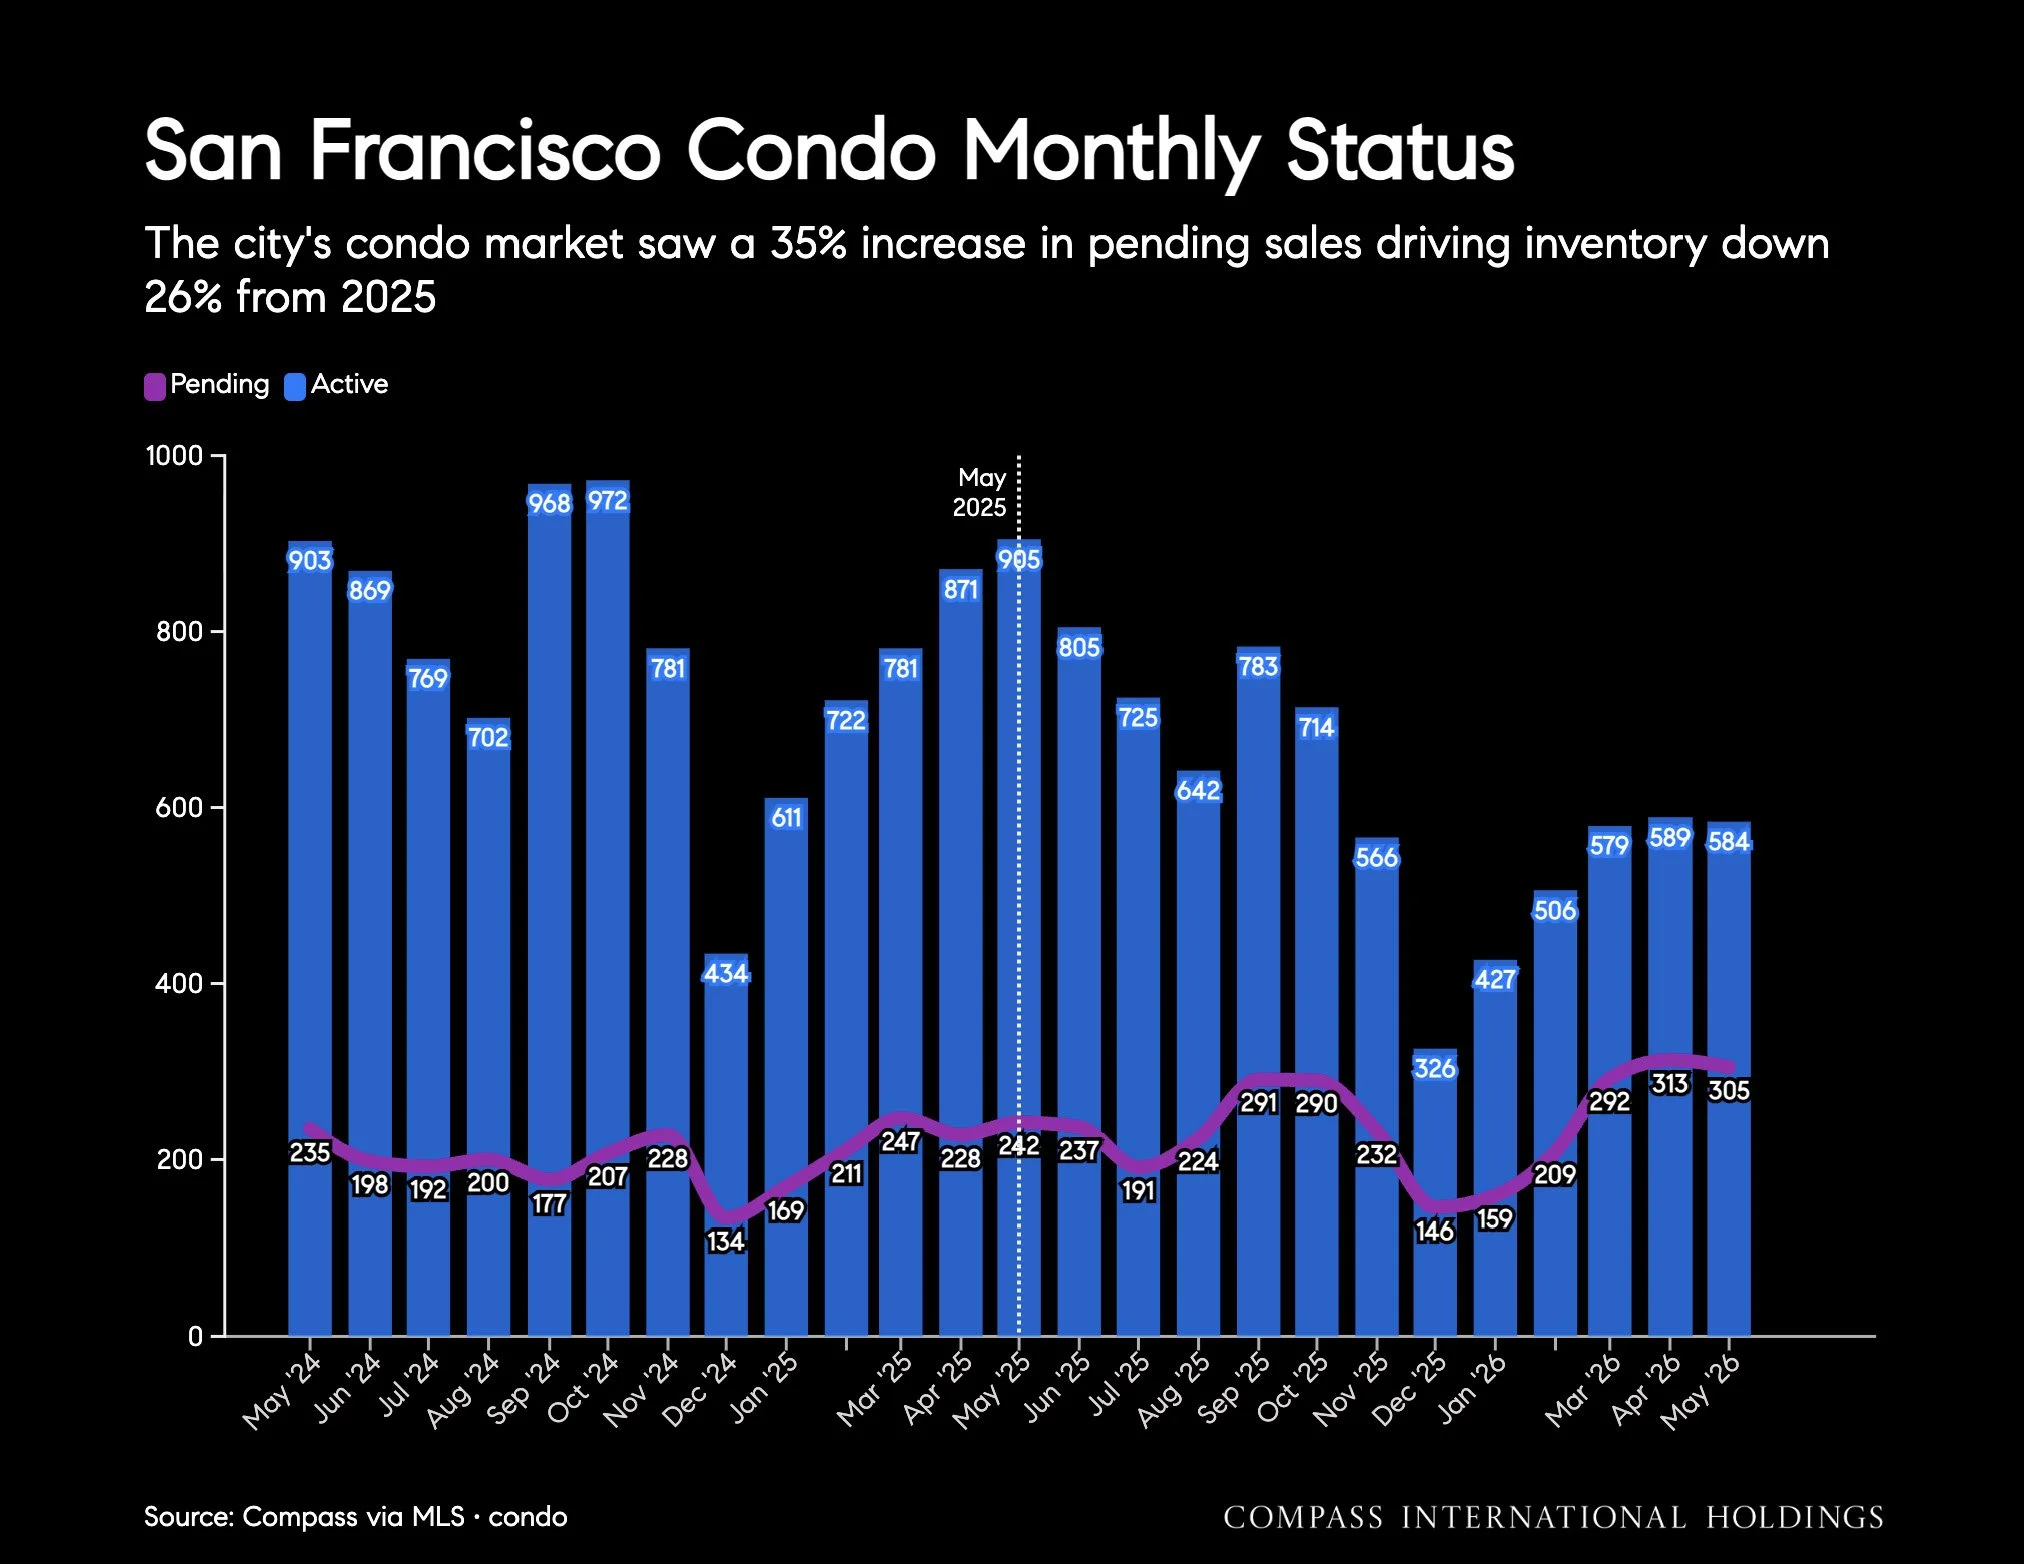
The city's condo market saw a 35% increase in pending sales driving inventory down 26% from 2025. Source: Compass via MLS • condo
San Francisco Seller Pricing and Buyer Demand

Despite a rise in price reductions, condos continue to sell near or above asking price, reflecting selective but resilient buyer demand. Source: Compass via MLS • Condos
Days on Market for Condos
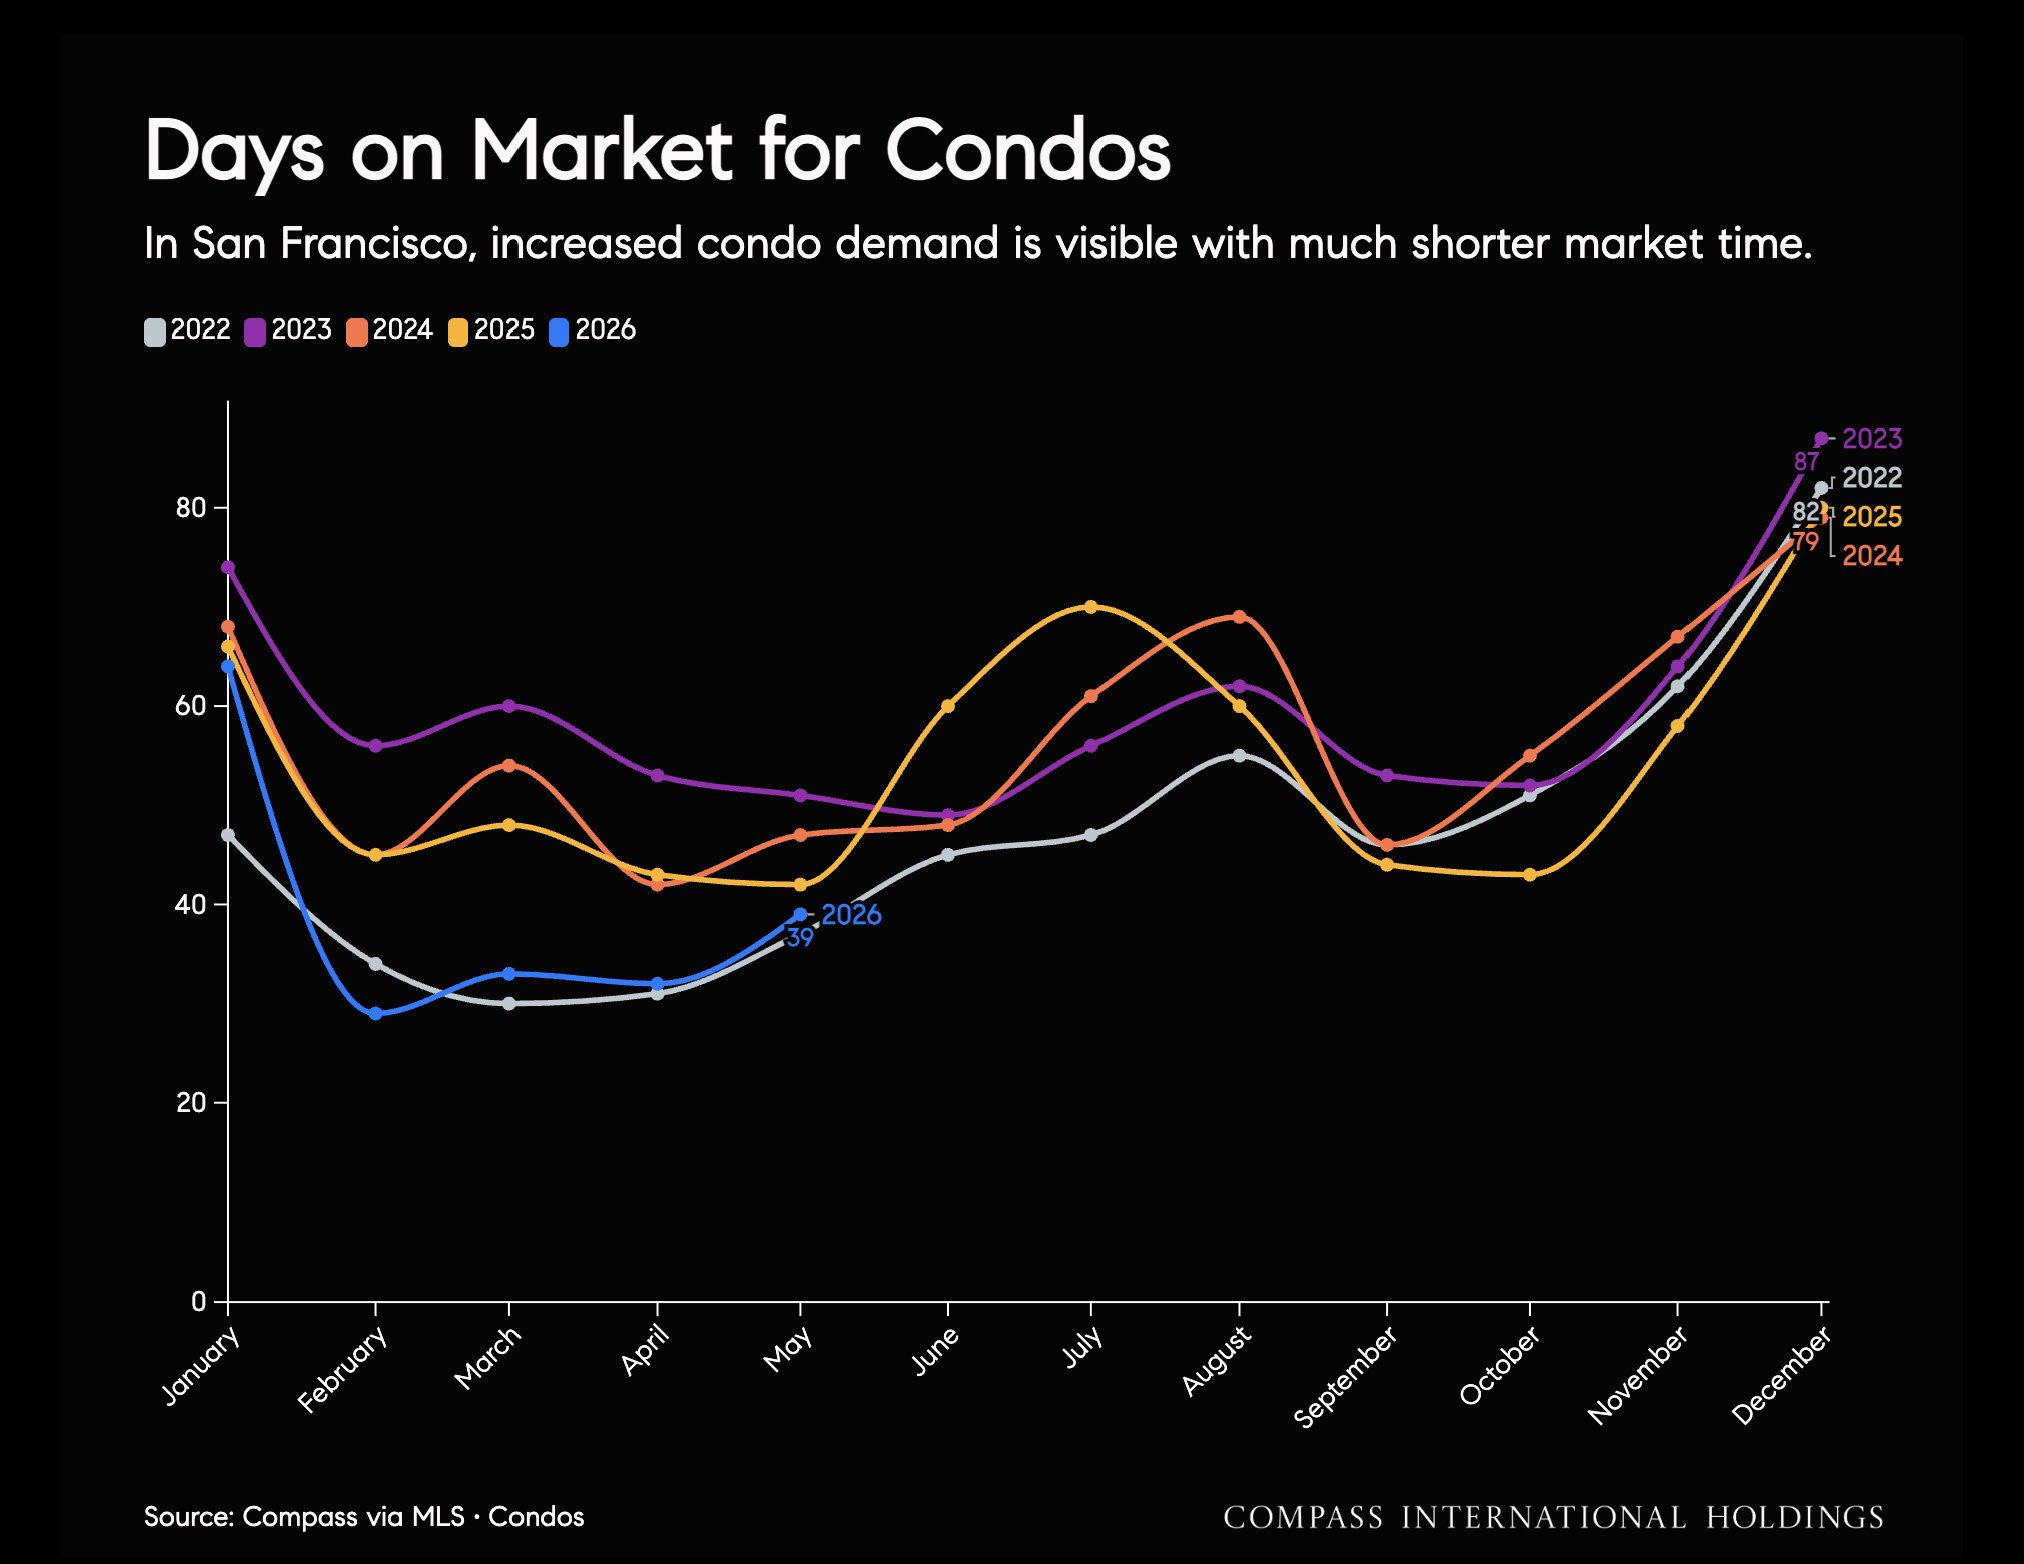
In San Francisco, increased condo demand is visible with much shorter market time. Source: Compass via MLS • Condos
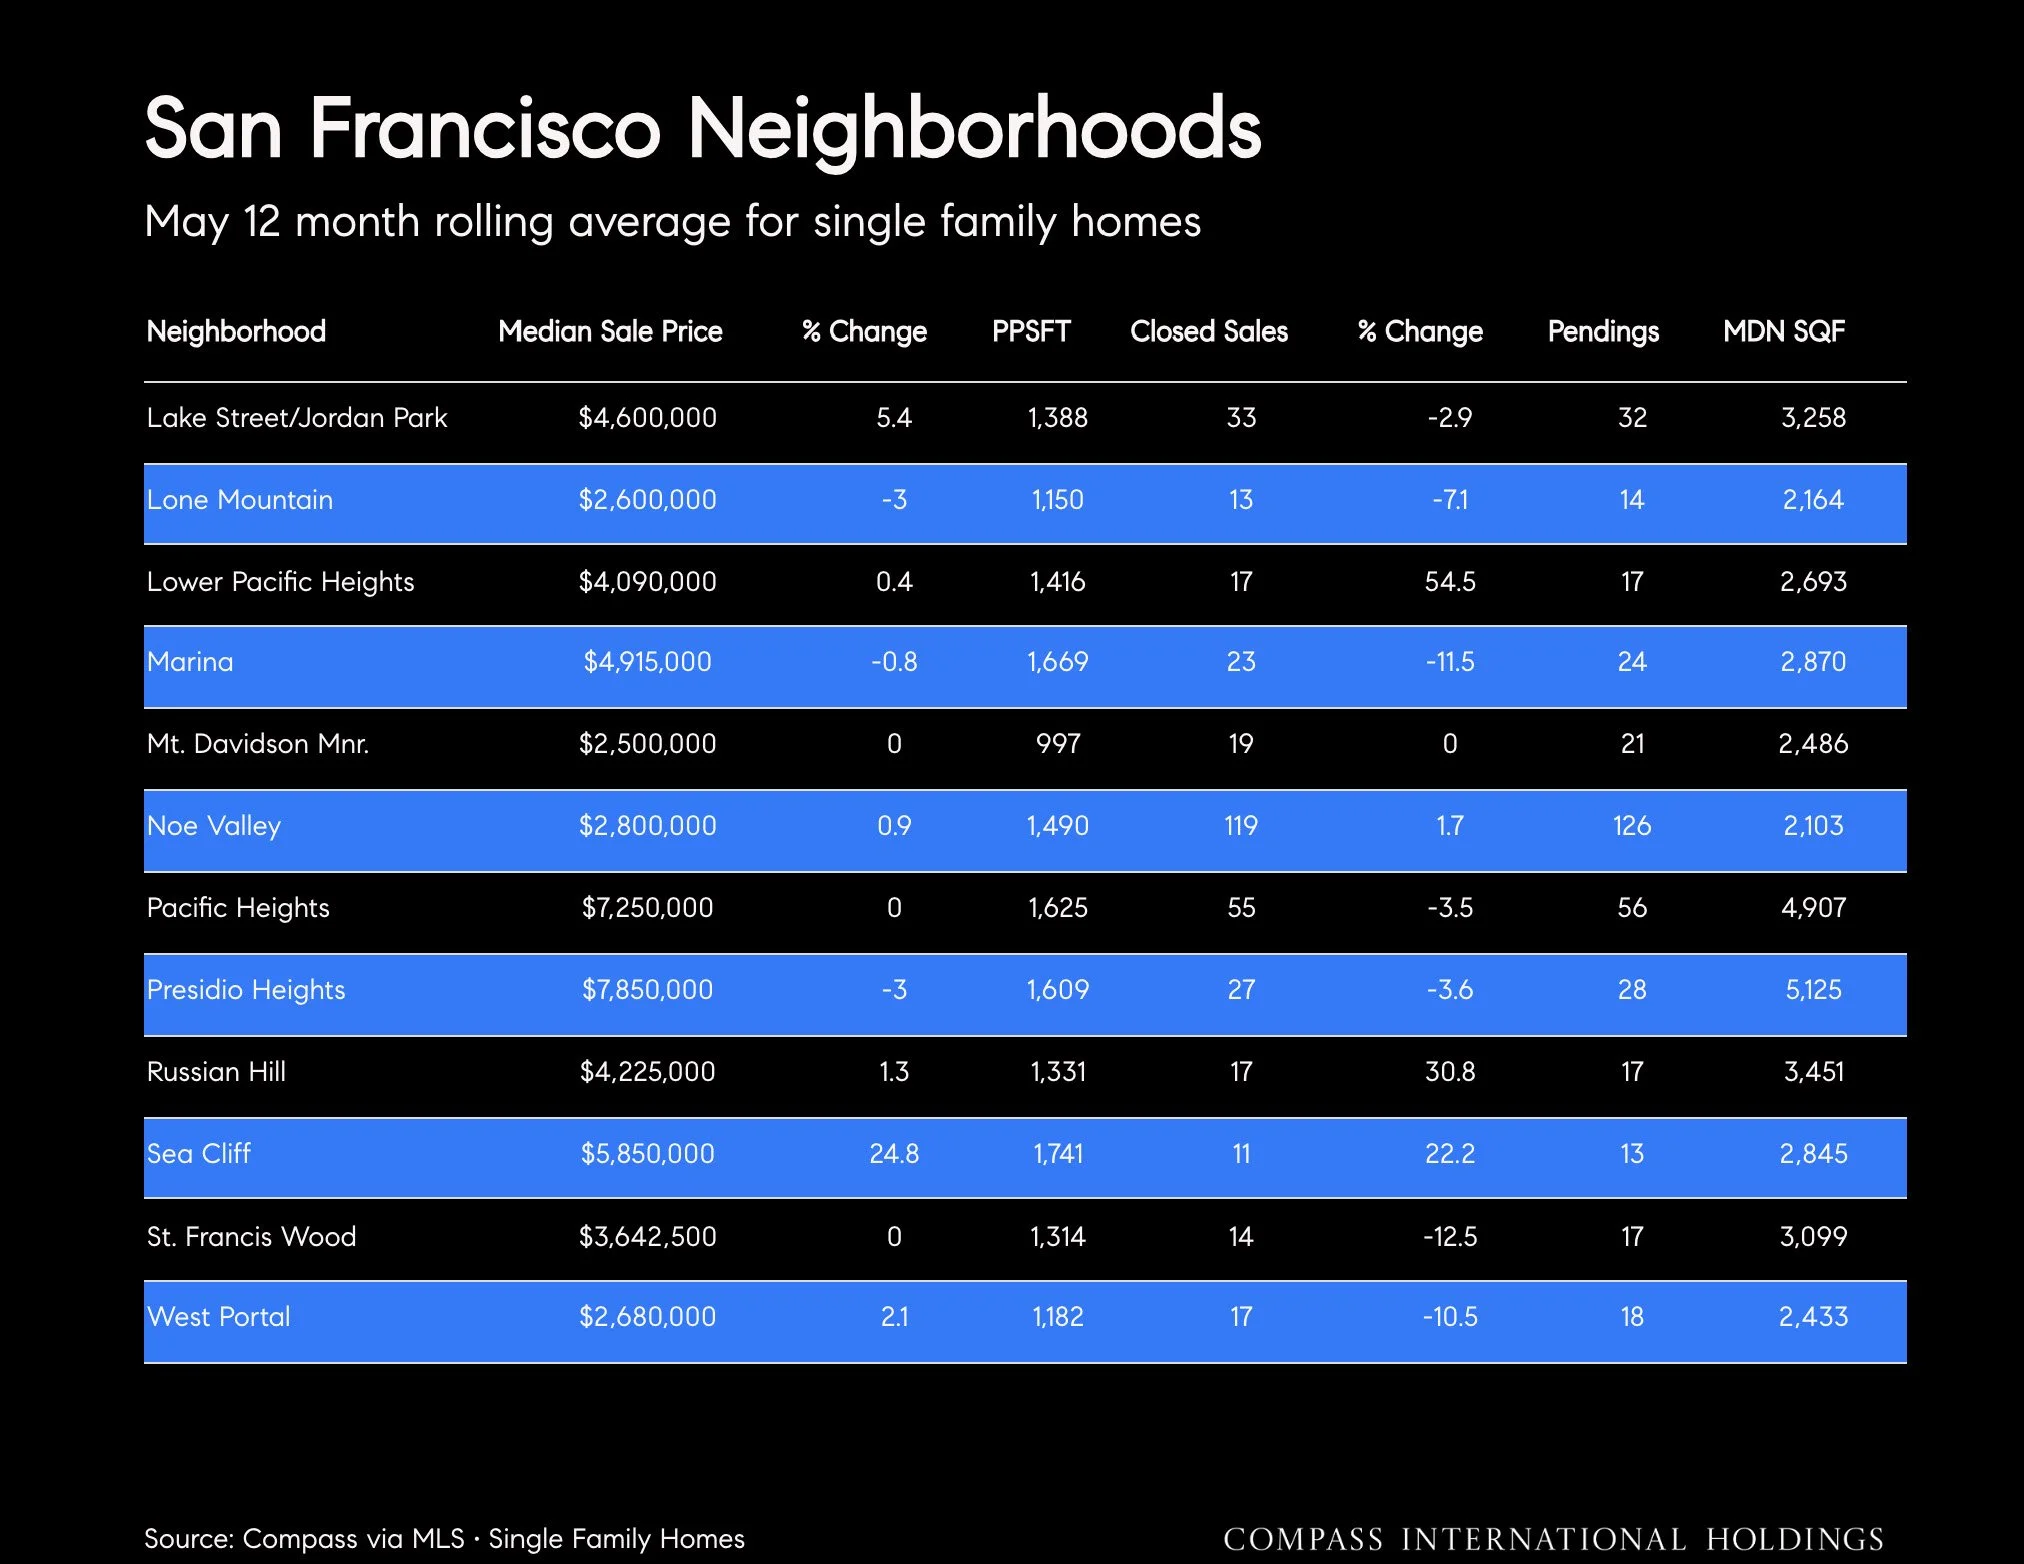
San Francisco Neighborhoods

May 12-month rolling average for condos. Source: Compass via MLS • Condos