March 2026 Market Report
The Market Continues to Accelerate in Possibly the Hottest Market in the Country

Celebrating Women’s History Month. Photograph by Sean Timberlake
Moving into spring, soaring buyer demand vs. an extremely inadequate supply of homes for sale continues to foster ferocious buyer competition, faster sales, more overbidding and rapidly rising home prices. Luxury home sales rose over 200% year over year to hit their highest month-of-February count ever.
The upcoming months are typically among the most active of the year and median home sales prices often hit their calendar-year highs in spring – though that did not happen in 2025 due to autumn’s enormous AI-driven market boom.
As has been the case in recent years, houses are seeing stronger market conditions than condos, but SF’s condo market is also rebounding dramatically. More affluent buyers continue to play an outsized role in demand and home-price appreciation.
The wild card in coming months is what sustained effects, if any, the Iran war may have on inflation, interest rates, financial markets and consumer confidence. Barring an extreme decline in economic conditions, we currently consider a significant negative impact on the city’s housing market unlikely.
Report created in good faith using data from sources deemed reliable but may contain errors and subject to revision. Last period figures are preliminary estimates based on data available early in the following month. All numbers approximate and may change with late-reported activity.
San Francisco HOUSE Price Trends since 1990
Monthly Median House Sales Prices, 3-Month Rolling
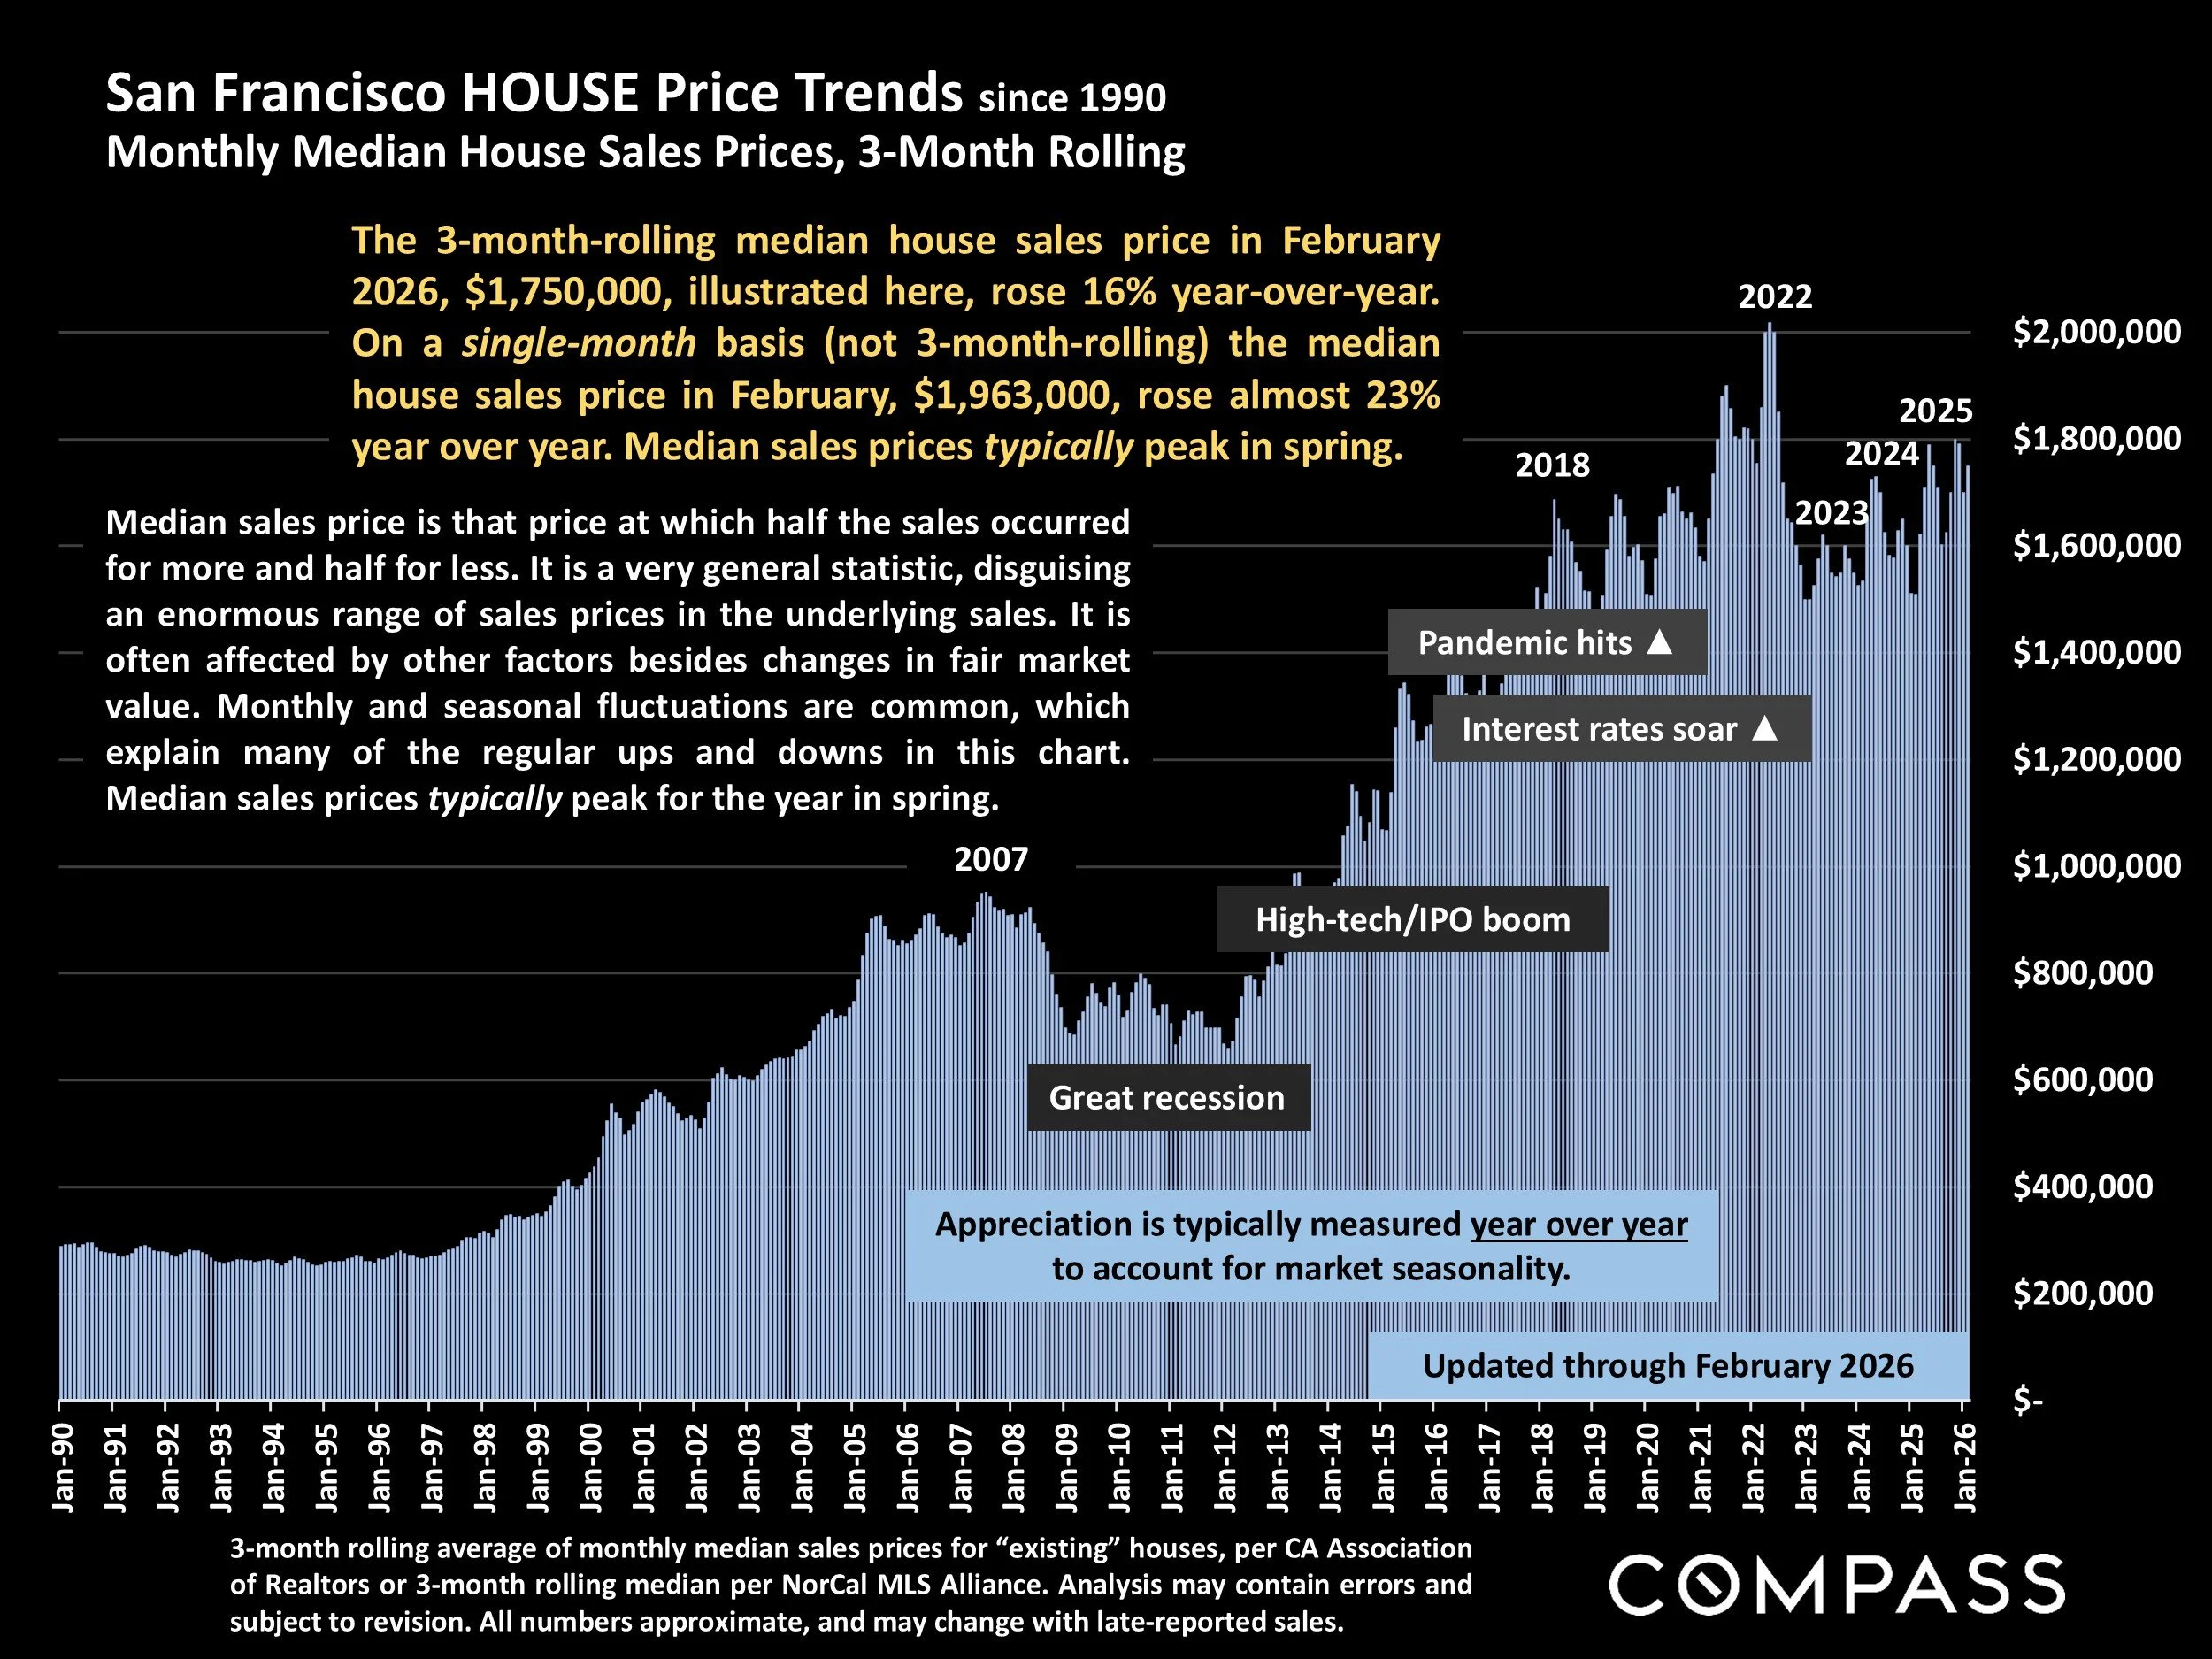
3-month rolling average of monthly median sales prices for “existing” houses, per CA Association of Realtors or 3-month rolling median per NorCal MLS Alliance. Analysis may contain errors and subject to revision. All numbers approximate, and may change with late-reported sales.
The 3-month-rolling median house sales price in February 2026, $1,750,000, illustrated here, rose 16% year-over-year. On a single-month basis (not 3-month-rolling) the median house sales price in February, $1,963,000, rose almost 23% year over year. Median sales prices typically peak in spring.
Median sales price is that price at which half the sales occurred for more and half for less. It is a very general statistic, disguising an enormous range of sales prices in the underlying sales. It is often affected by other factors besides changes in fair market value. Monthly and seasonal fluctuations are common, which explain many of the regular ups and downs in this chart. Median sales prices typically peak for the year in spring.
San Francisco CONDO Price Trends since 2005
Median Condo Sales Price, 3-Month Rolling
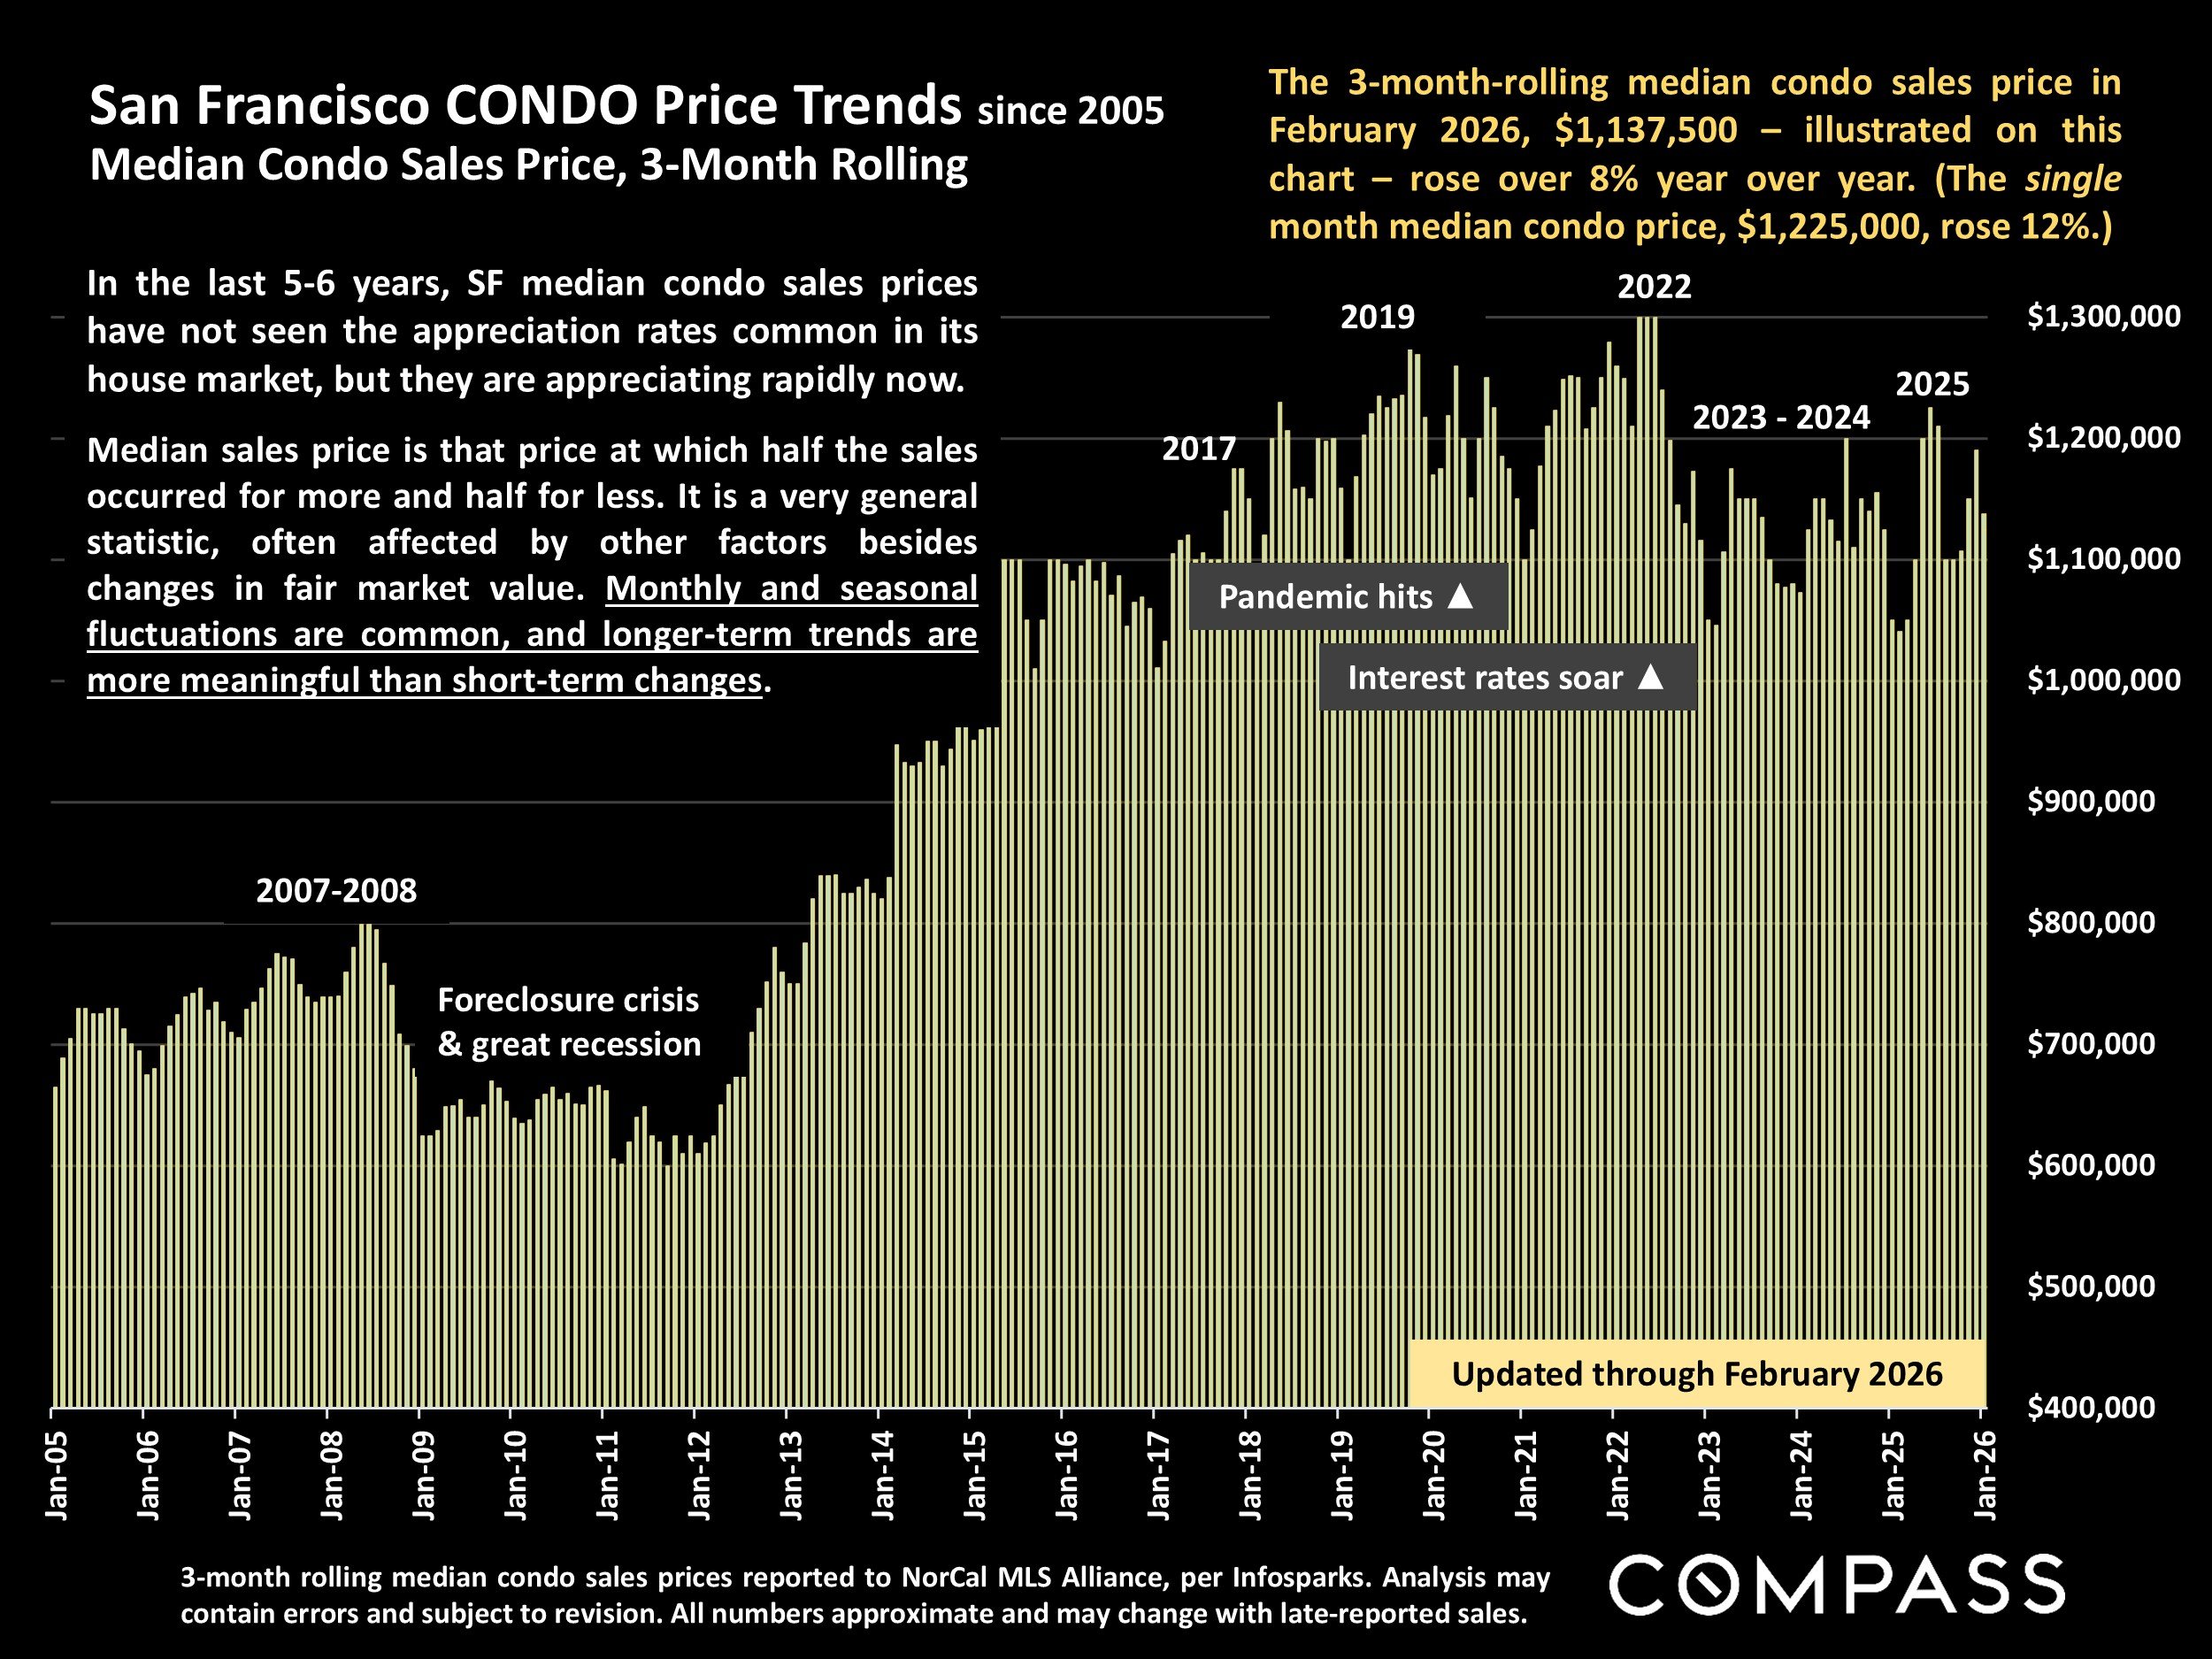
3-month rolling median condo sales prices reported to NorCal MLS Alliance, per Infosparks. Analysis may contain errors and subject to revision. All numbers approximate and may change with late-reported sales.
The 3-month-rolling median condo sales price in February 2026, $1,137,500 – illustrated on this chart – rose over 8% year over year. (The single month median condo price, $1,225,000, rose 12%.)
In the last 5-6 years, SF median condo sales prices have not seen the appreciation rates common in its house market, but they are appreciating rapidly now.
Median sales price is that price at which half the sales occurred for more and half for less. It is a very general statistic, often affected by other factors besides changes in fair market value. Monthly and seasonal fluctuations are common, and longer-term trends are more meaningful than short-term changes.
San Francisco Value Trends since 2005
3-Month-Rolling, Median Dollar per Square Foot Values*
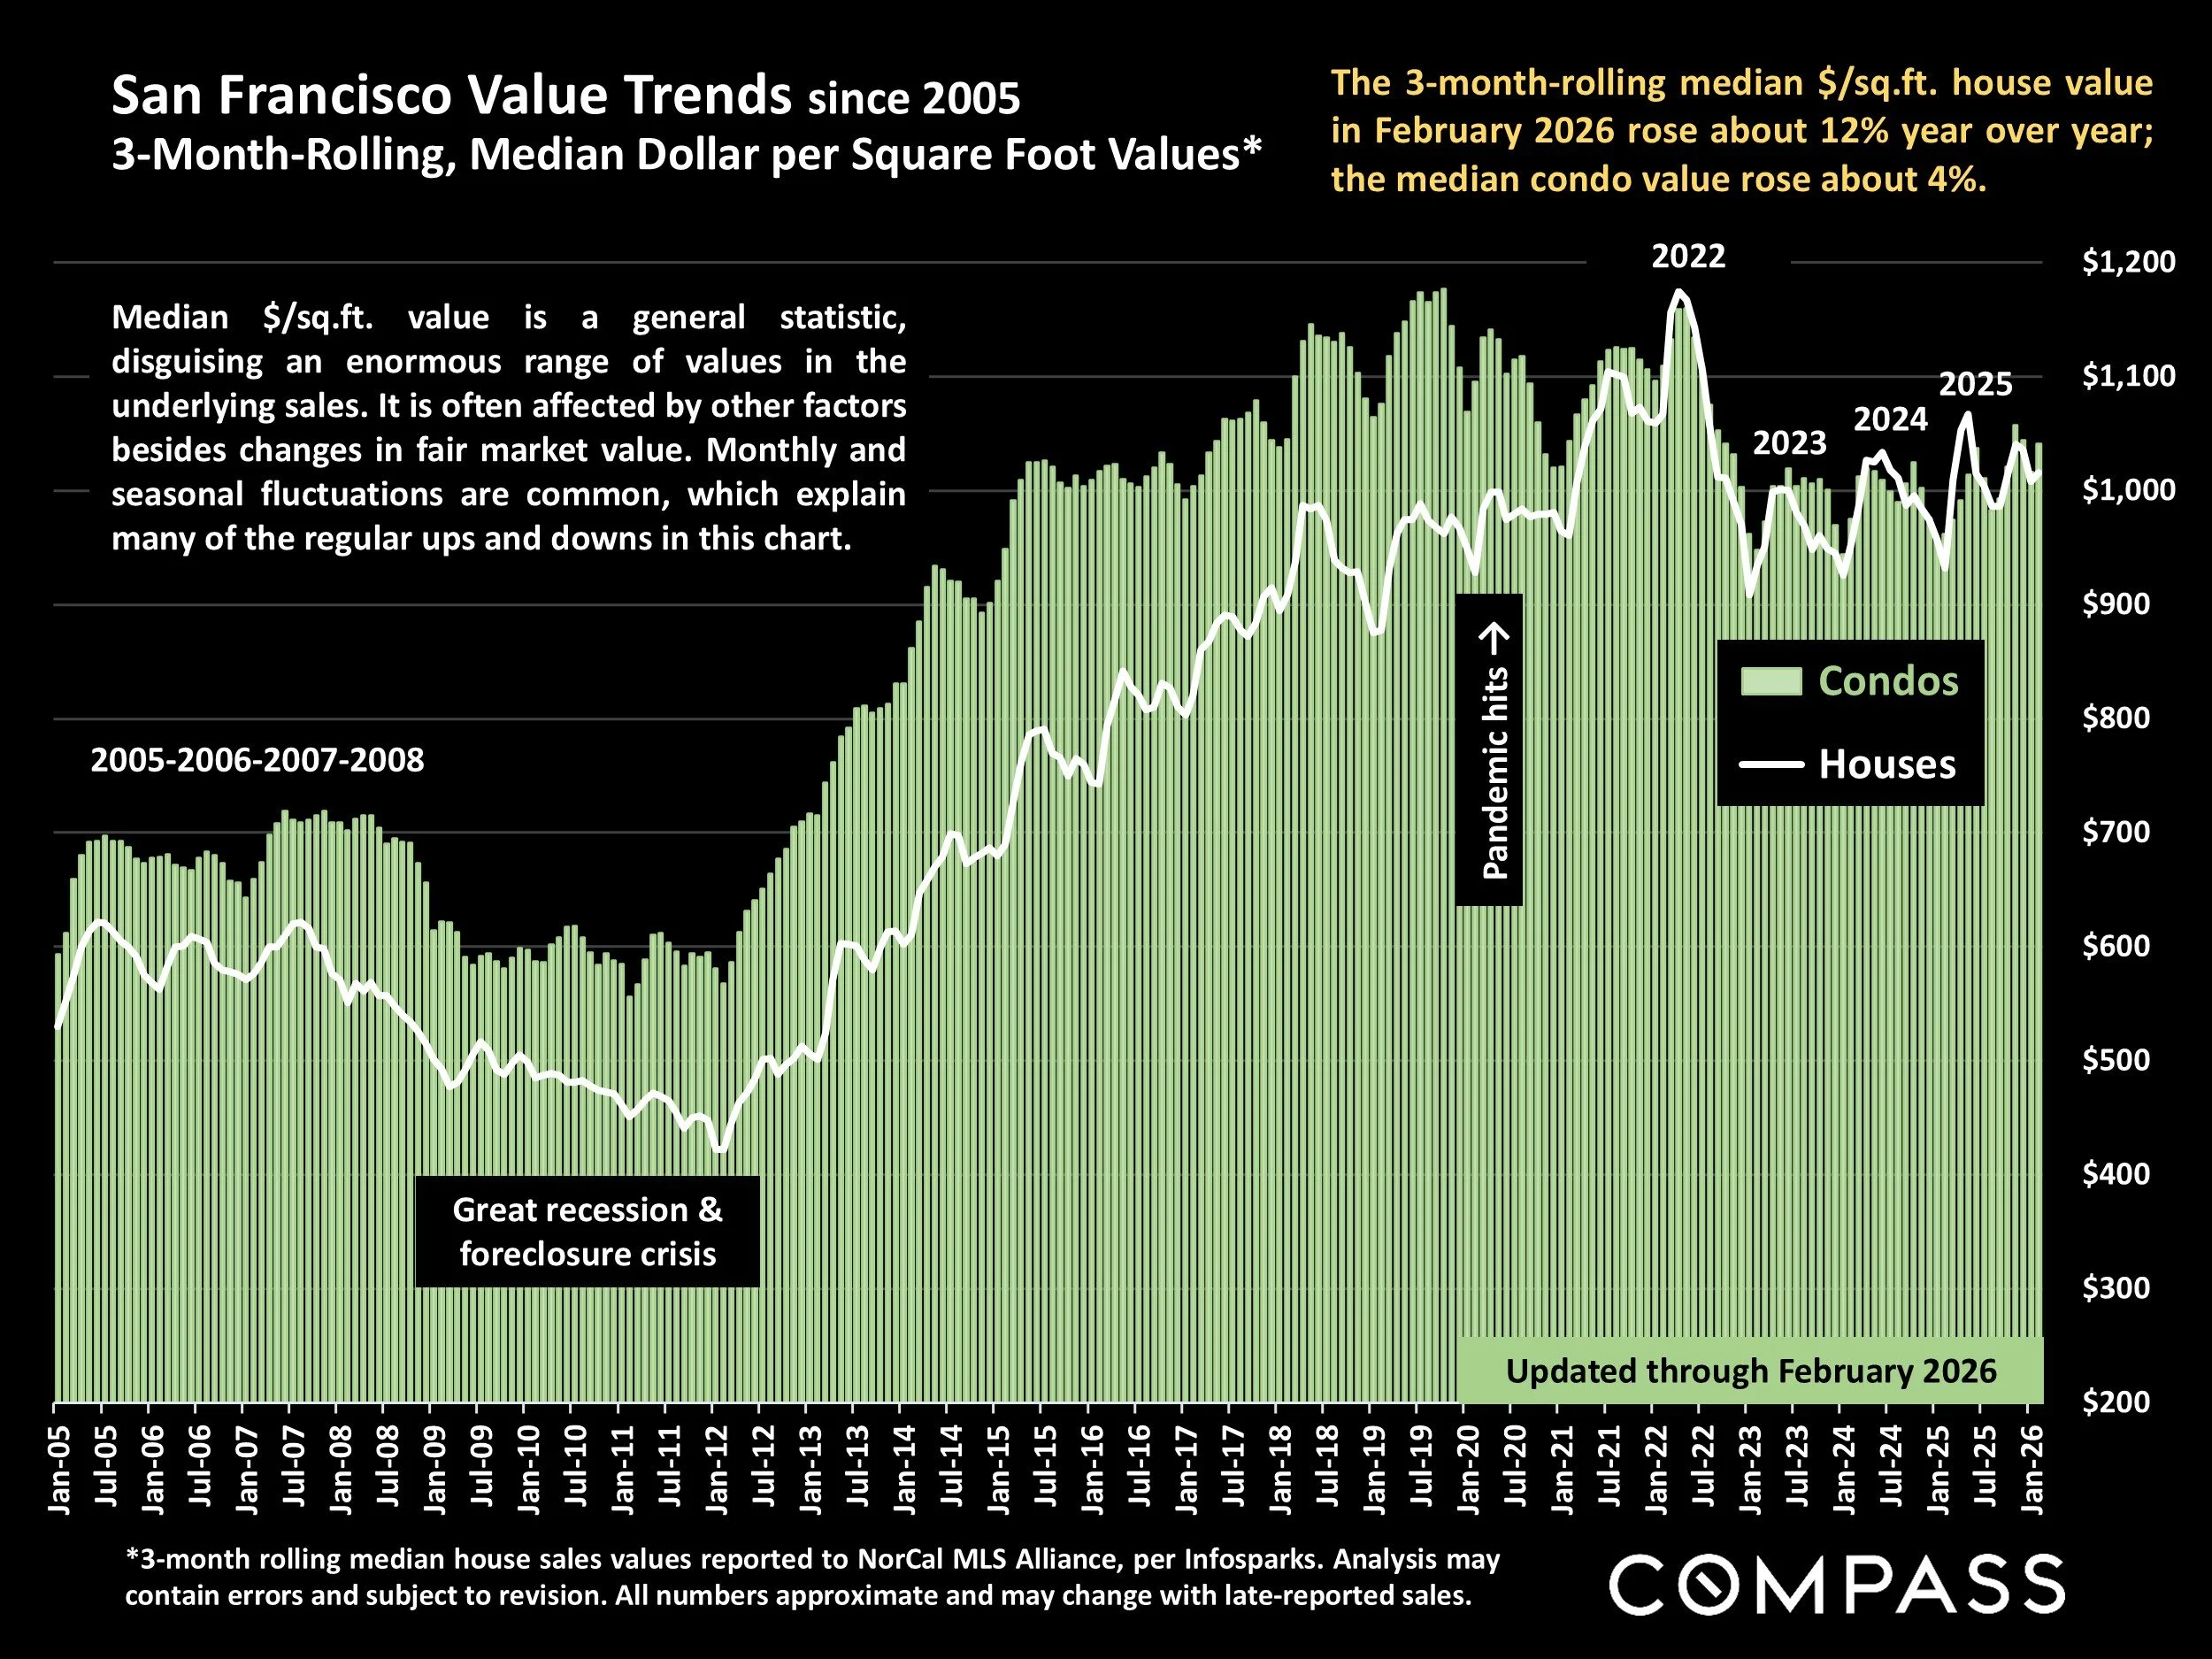
*3-month rolling median house sales values reported to NorCal MLS Alliance, per Infosparks. Analysis may contain errors and subject to revision. All numbers approximate and may change with late-reported sales.
The 3-month-rolling median $/sq.ft. house value in February 2026 rose about 12% year over year; the median condo value rose about 4%.
Median $/sq.ft. value is a general statistic, disguising an enormous range of values in the underlying sales. It is often affected by other factors besides changes in fair market value. Monthly and seasonal fluctuations are common, which explain many of the regular ups and downs in this chart.
San Francisco CONDO Prices: Downtown vs. Non-Downtown
12-Month-Rolling, Median 2-Bedroom Condo Sales Prices since 2005*
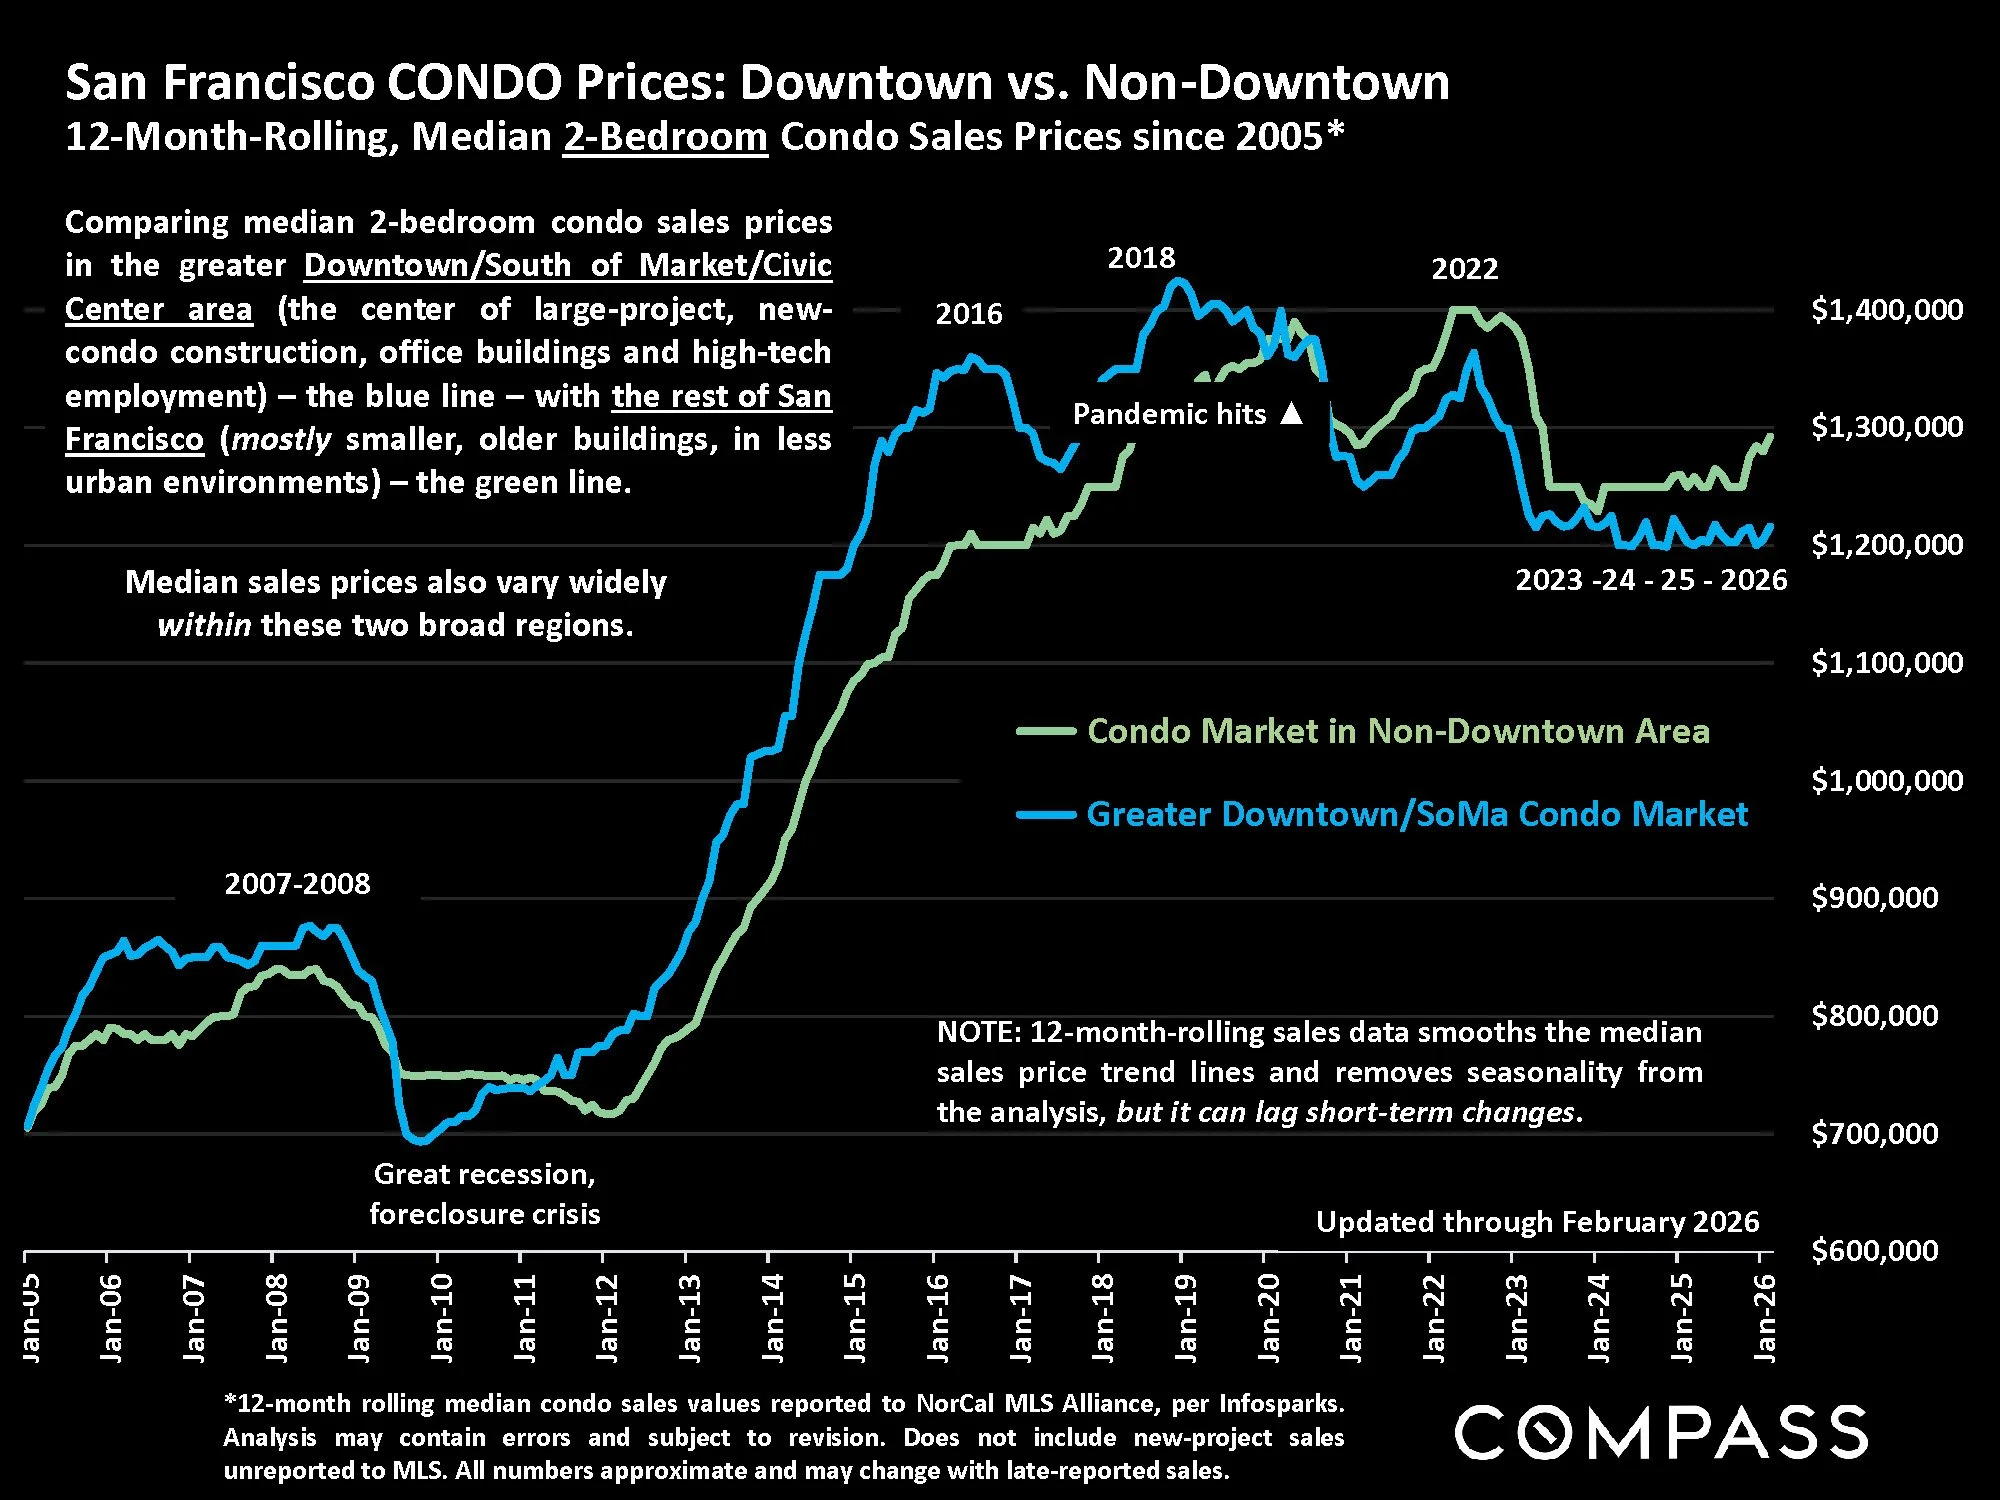
*12-month rolling median condo sales values reported to NorCal MLS Alliance, per Infosparks. Analysis may contain errors and subject to revision. Does not include new-project sales unreported to MLS. All numbers approximate and may change with late-reported sales.
Comparing median 2-bedroom condo sales prices in the greater Downtown/South of Market/Civic Center area (the center of large-project, new-condo construction, office buildings and high-tech employment) – the blue line – with the rest of San Francisco (mostly smaller, older buildings, in less urban environments) – the green line.
Median sales prices also vary widely within these two broad regions.
NOTE: 12-month-rolling sales data smooths the median sales price trend lines and removes seasonality from the analysis, but it can lag short-term changes.
Median Dollar per Square Foot Value by Home Size
San Francisco 2024 & 2025 Sales, and Year-over-Year Percentage Change*

*Sales reported to NorCal Alliance. Year-over-year changes in $/sq.ft. can be affected by other factors besides changes in fair market value. How these values apply to any specific home is unknown with out a comparative market analysis. Data derived from sources deemed reliable but may contain errors and is subject to revision. All numbers approximate.
Dollar per Square Foot is based upon interior living space and doesn’t include garages, attics, basements, rooms built without permit, decks, patios or lot size (though these can add value). All things being equal, a smaller home will typically sell for a higher dollar per square foot value. But larger homes are typically located in more affluent and expensive neighborhoods, and these saw the highest 2024 to 2025 appreciation rates.
San Francisco Luxury Home Sales
Sales Prices of $5,000,000+
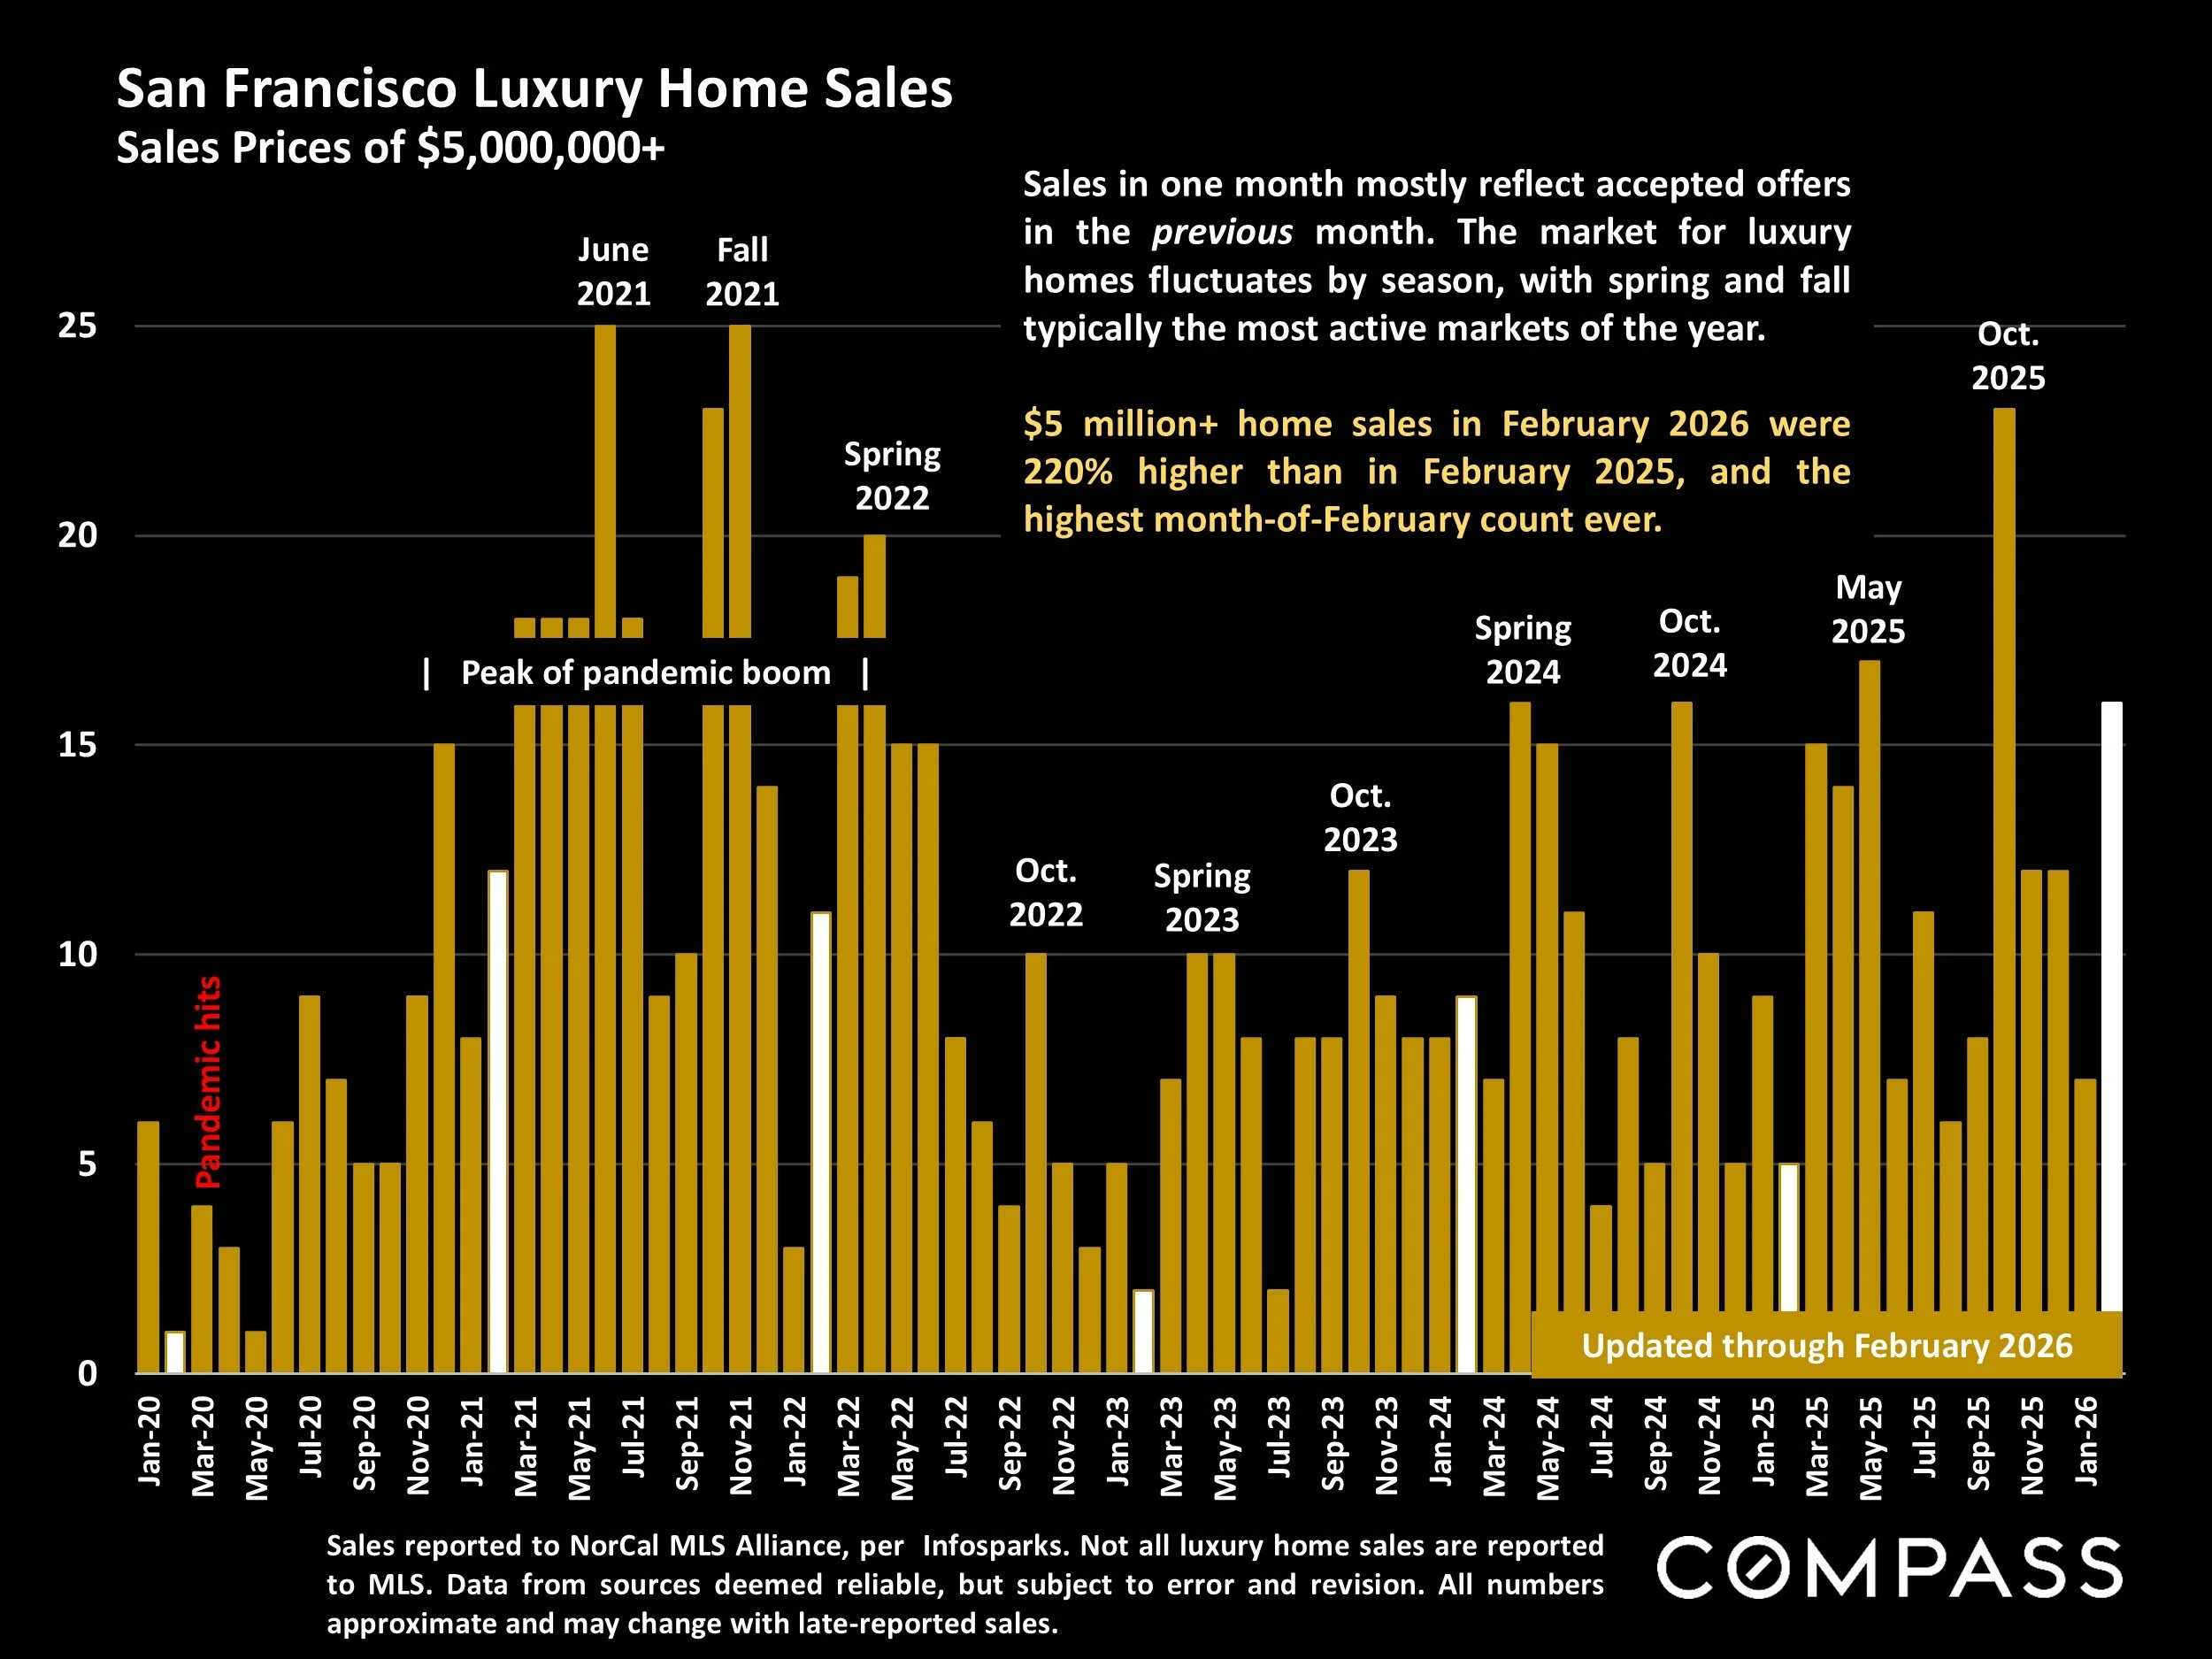
Sales reported to NorCal MLS Alliance, per Infosparks. Not all luxury home sales are reported to MLS. Data from sources deemed reliable, but subject to error and revision. All numbers approximate and may change with late-reported sales.
Sales in one month mostly reflect accepted offers in the previous month. The market for luxury homes fluctuates by season, with spring and fall typically the most active markets of the year.
$5 million+ home sales in February 2026 were 220% higher than in February 2025, and the highest month-of-February count ever.
Median House Sales Prices: 3-Bedroom & 4-Bedroom Homes
by Greater Bay Area County, 12 Months Sales*
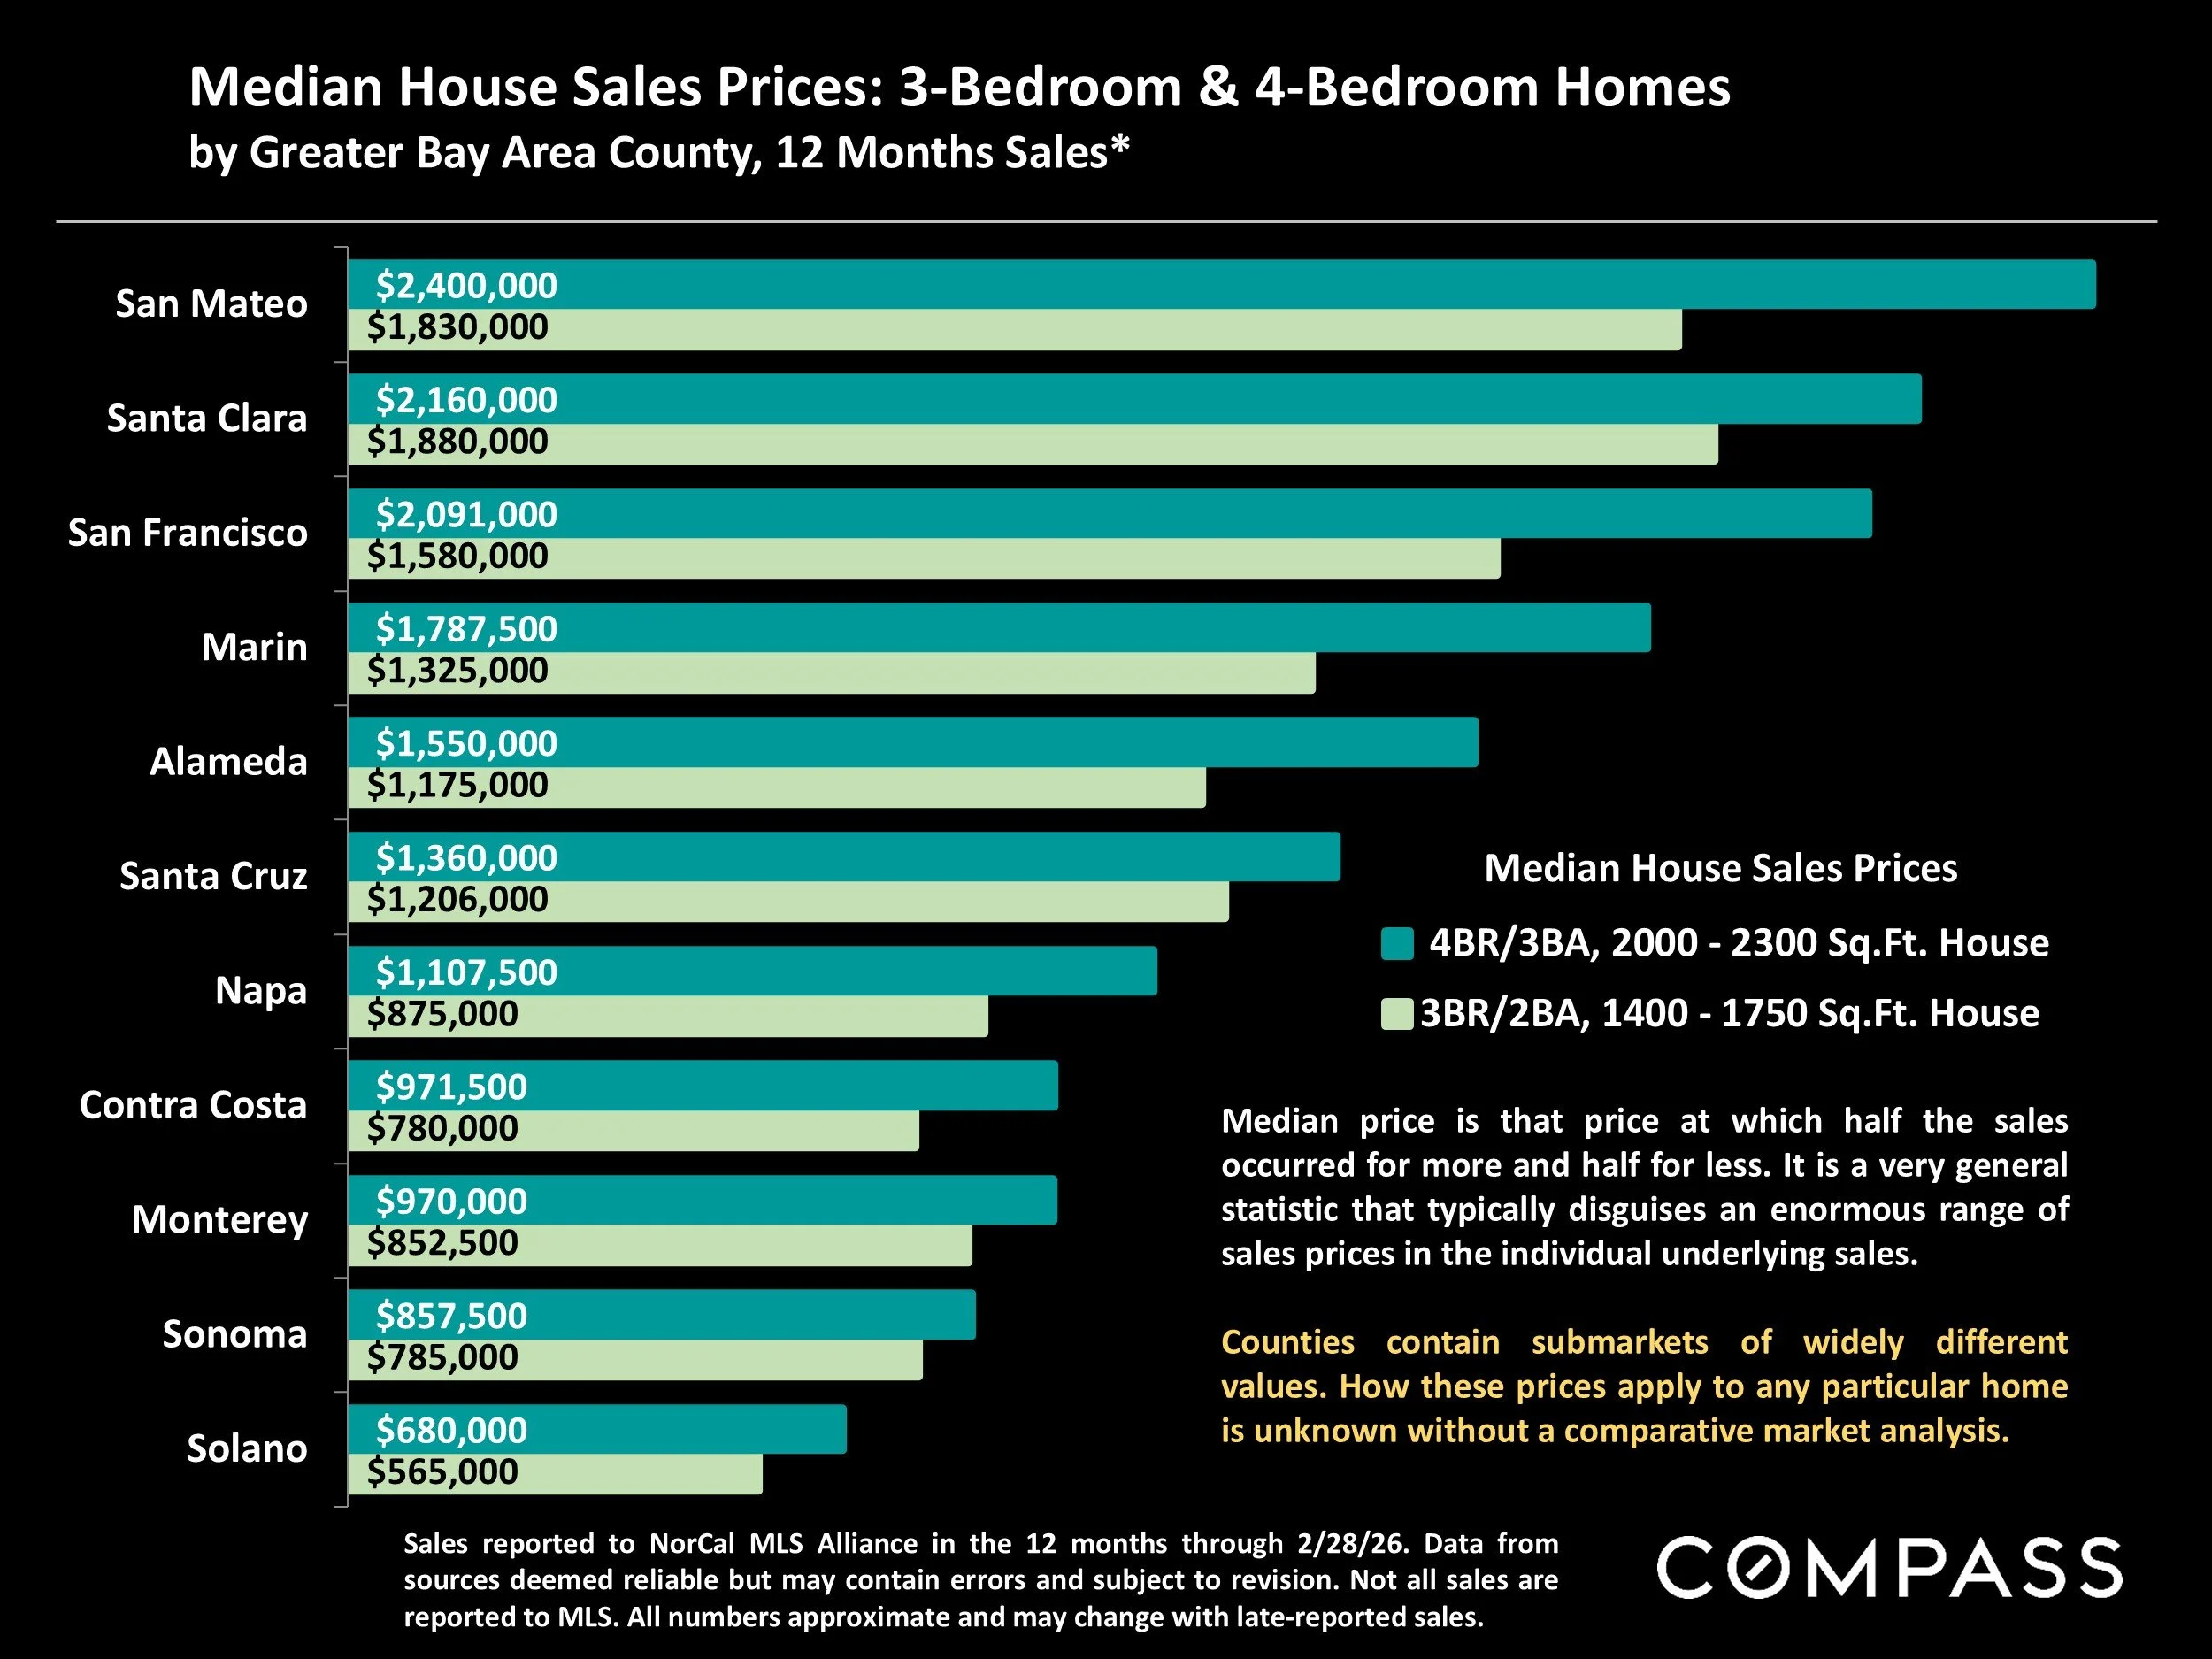
Sales reported to NorCal MLS Alliance in the 12 months through 2/28/26. Data from sources deemed reliable but may contain errors and subject to revision. Not all sales are reported to MLS. All numbers approximate and may change with late-reported sales.
Median price is that price at which half the sales occurred for more and half for less. It is a very general statistic that typically disguises an enormous range of sales prices in the individual underlying sales.
Counties contain submarkets of widely different values. How these prices apply to any particular home is unknown without a comparative market analysis.
Median House Dollar per Square Foot Values
by Greater Bay Area County, 12 Months Sales*
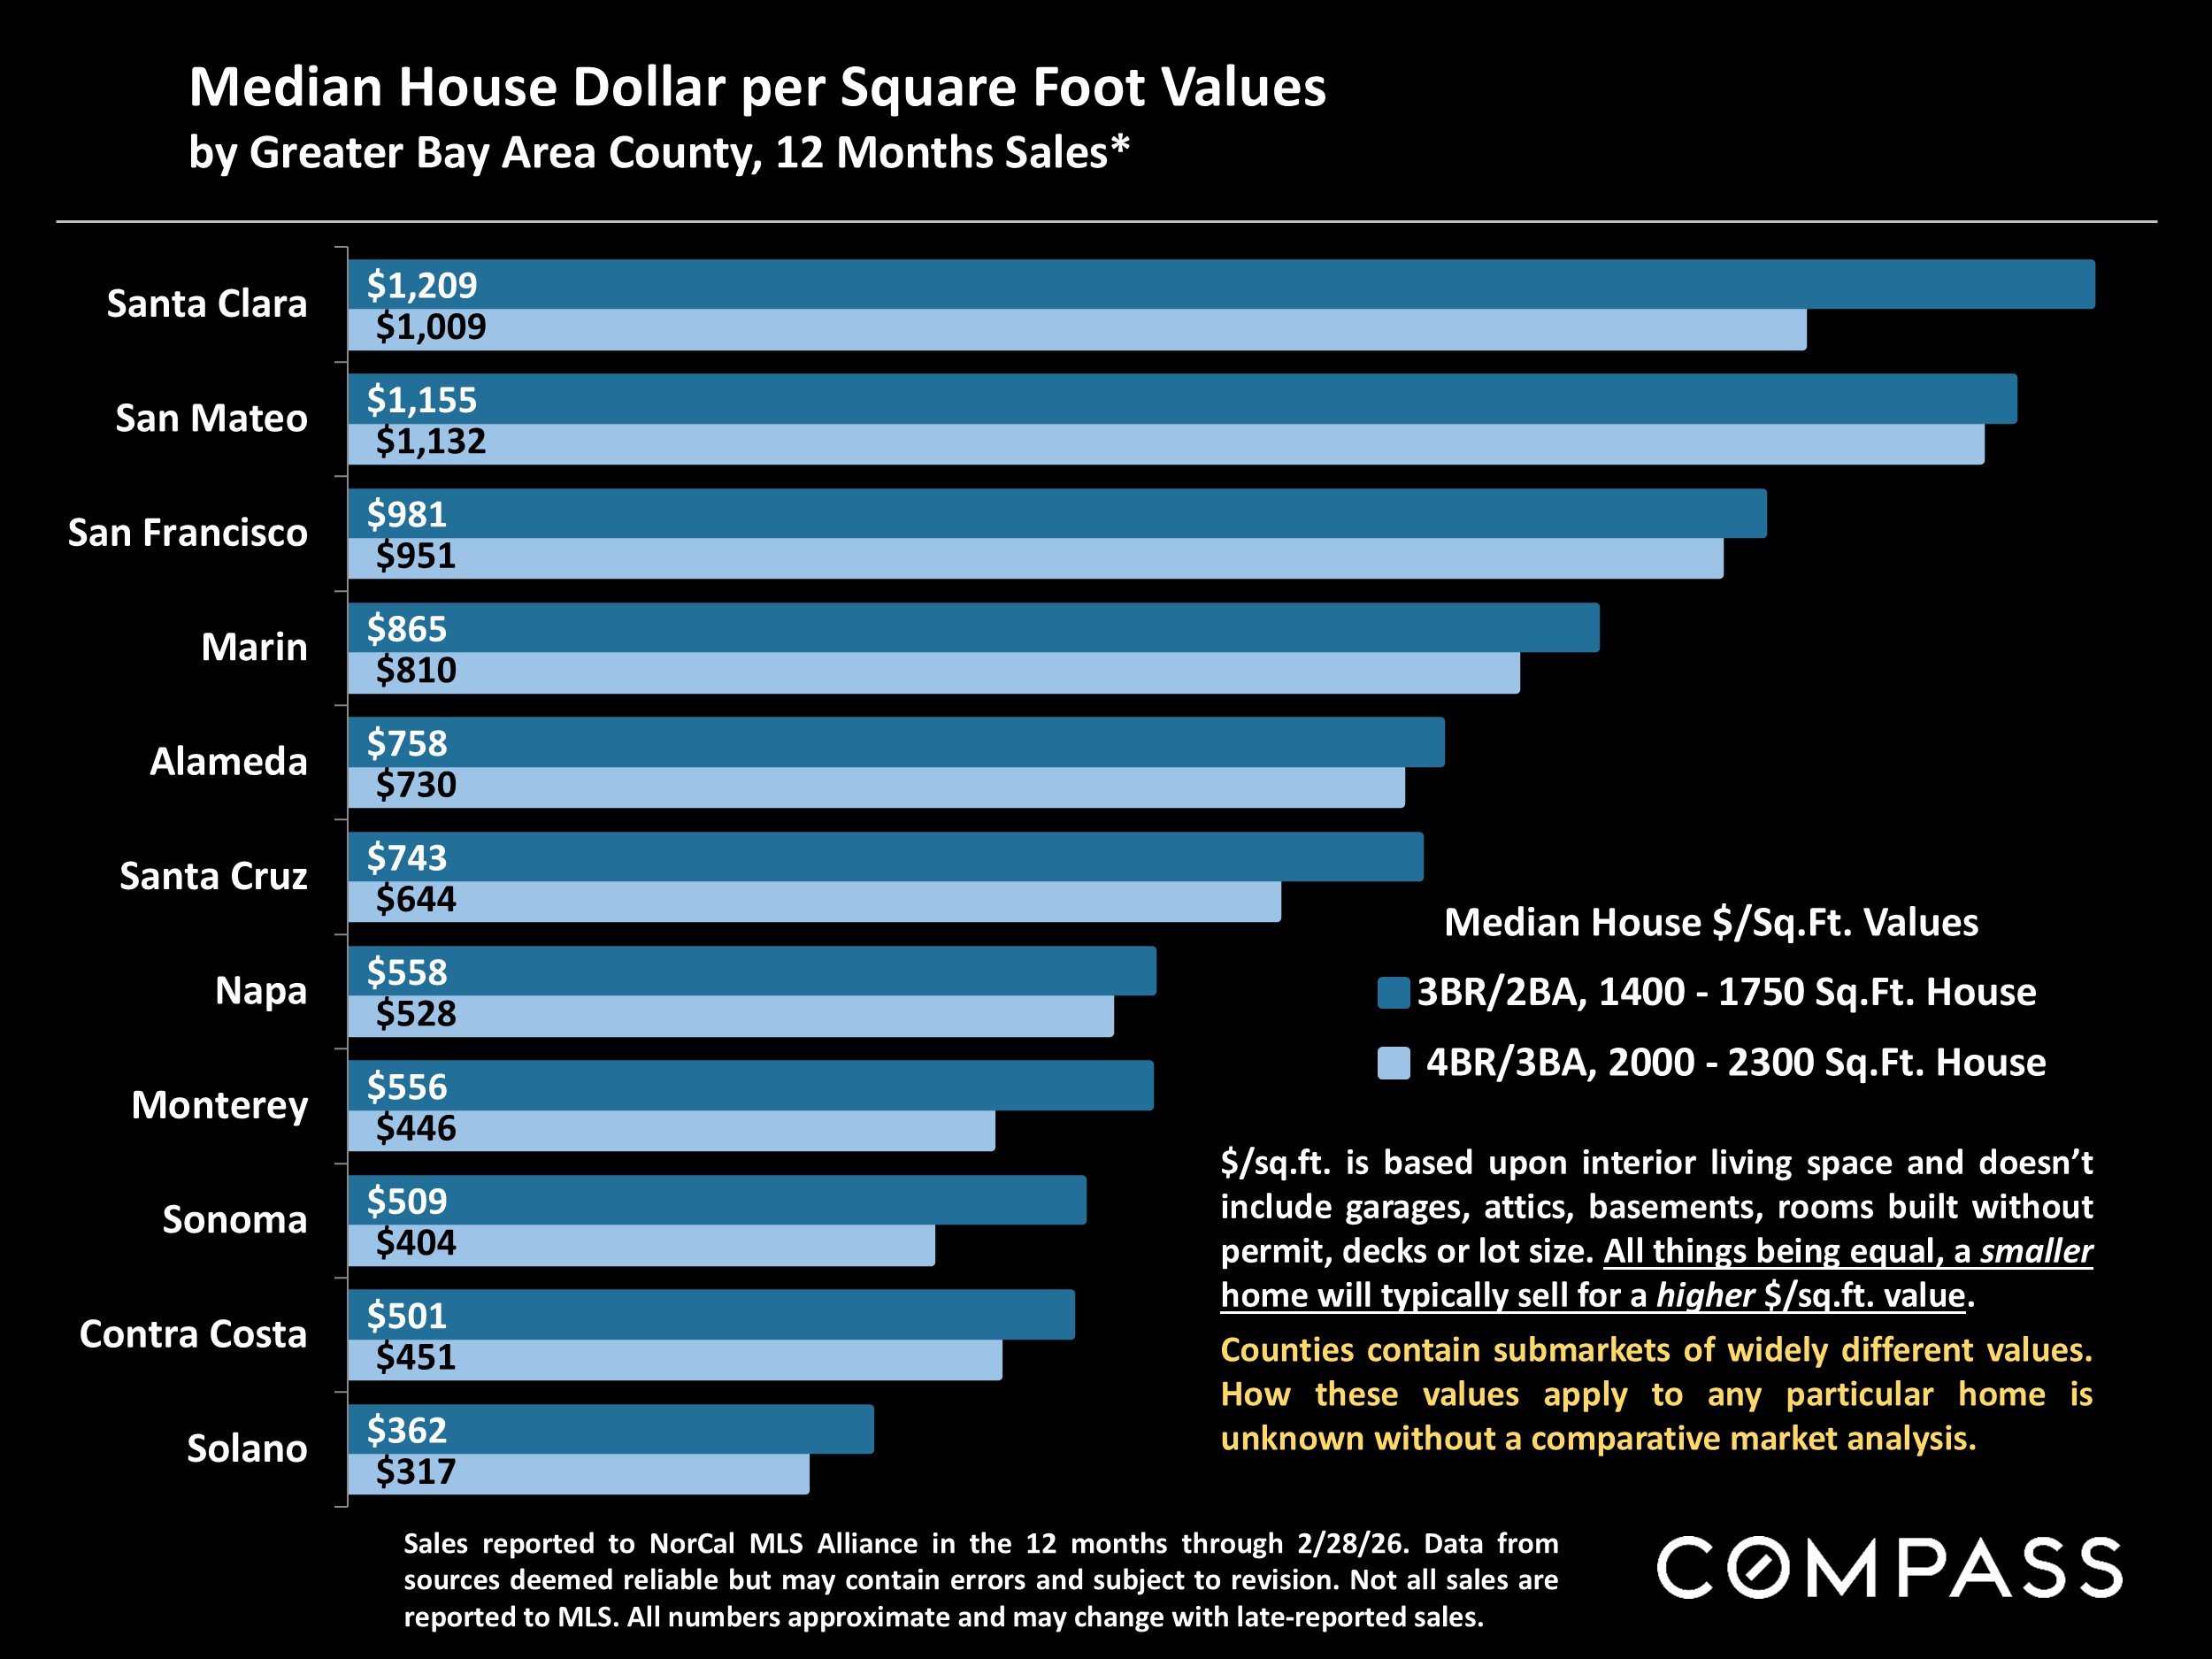
Sales reported to NorCal MLS Alliance in the 12 months through 2/28/26. Data from sources deemed reliable but may contain errors and subject to revision. Not all sales are reported to MLS. All numbers approximate and may change with late-reported sales.
$/sq.ft. is based upon interior living space and doesn’t include garages, attics, basements, rooms built without permit, decks or lot size. All things being equal, a smaller home will typically sell for a higher $/sq.ft. value.
Counties contain submarkets of widely different values. How these values apply to any particular home is unknown without a comparative market analysis.
New Listings Coming on Market
San Francisco Market Dynamics & Seasonality*
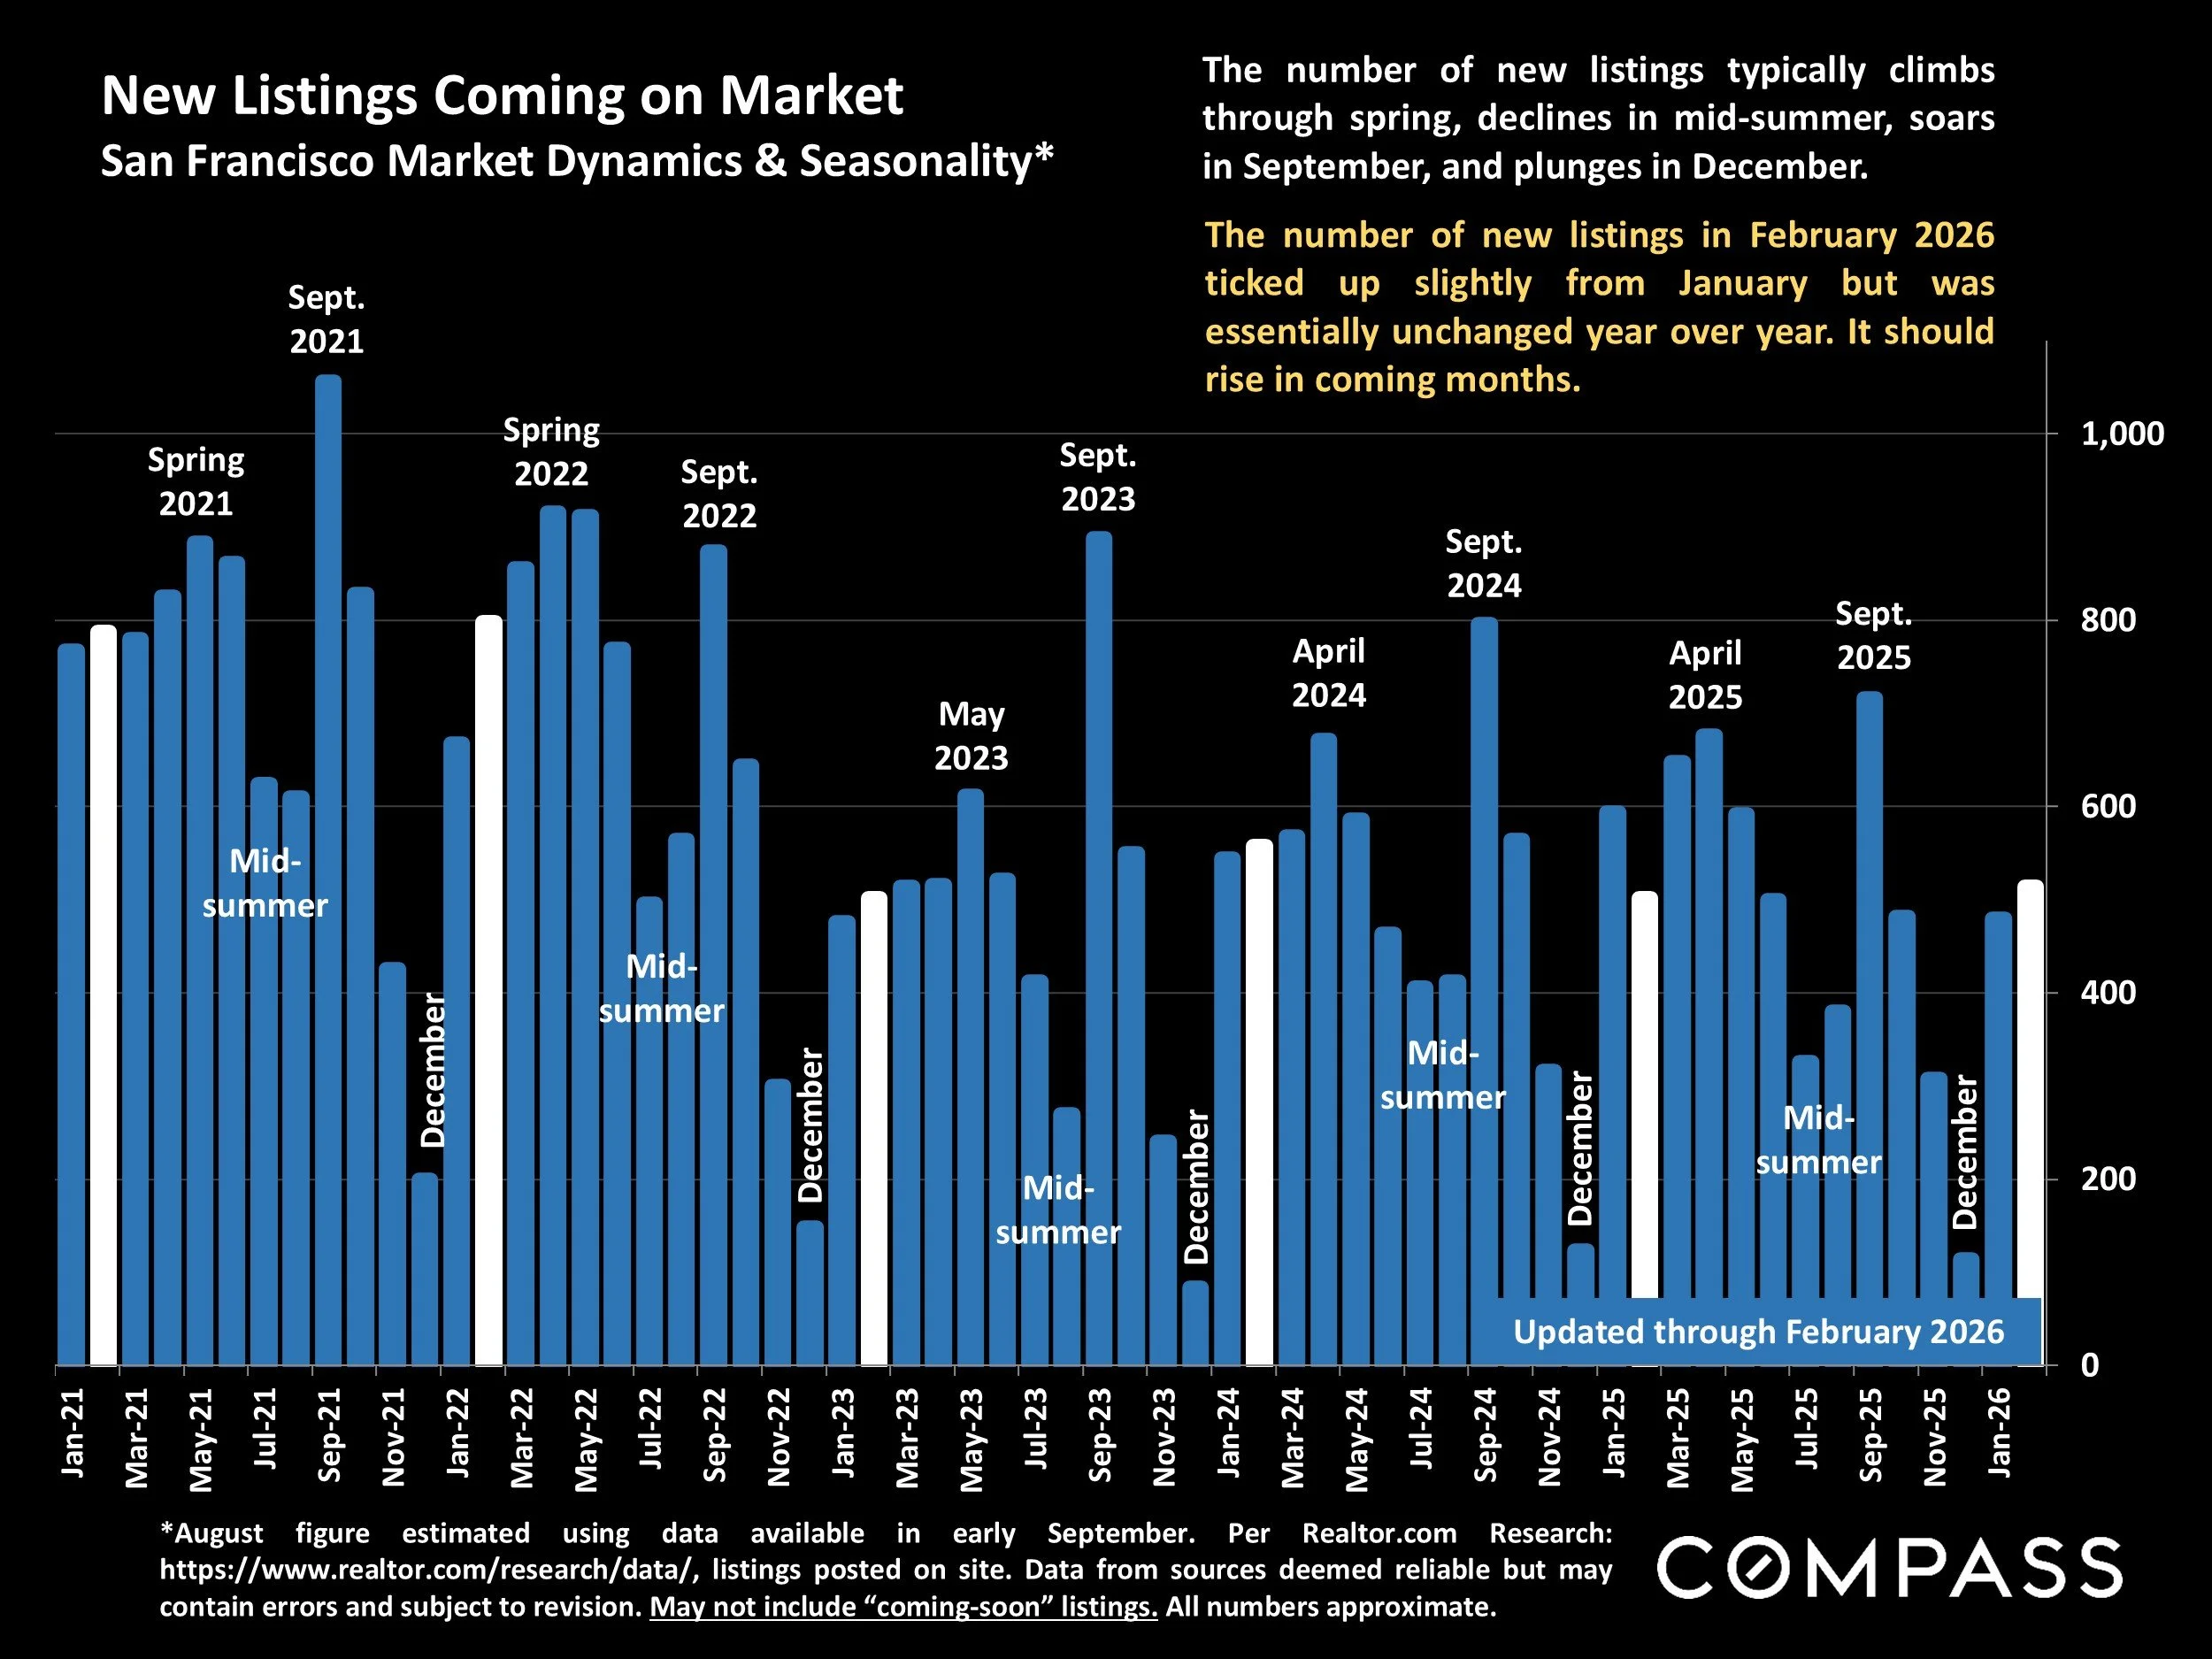
*August figure estimated using data available in early September. Per Realtor.com Research: https://www.realtor.com/research/data/, listings posted on site. Data from sources deemed reliable but may contain errors and subject to revision. May not include “coming-soon” listings. All numbers approximate.
The number of new listings typically climbs through spring, declines in mid-summer, soars in September, and plunges in December.
The number of new listings in February 2026 ticked up slightly from January but was essentially unchanged year over year. It should rise in coming months.
Active & Coming-Soon Listings on 1st of Month*
San Francisco Homes Market
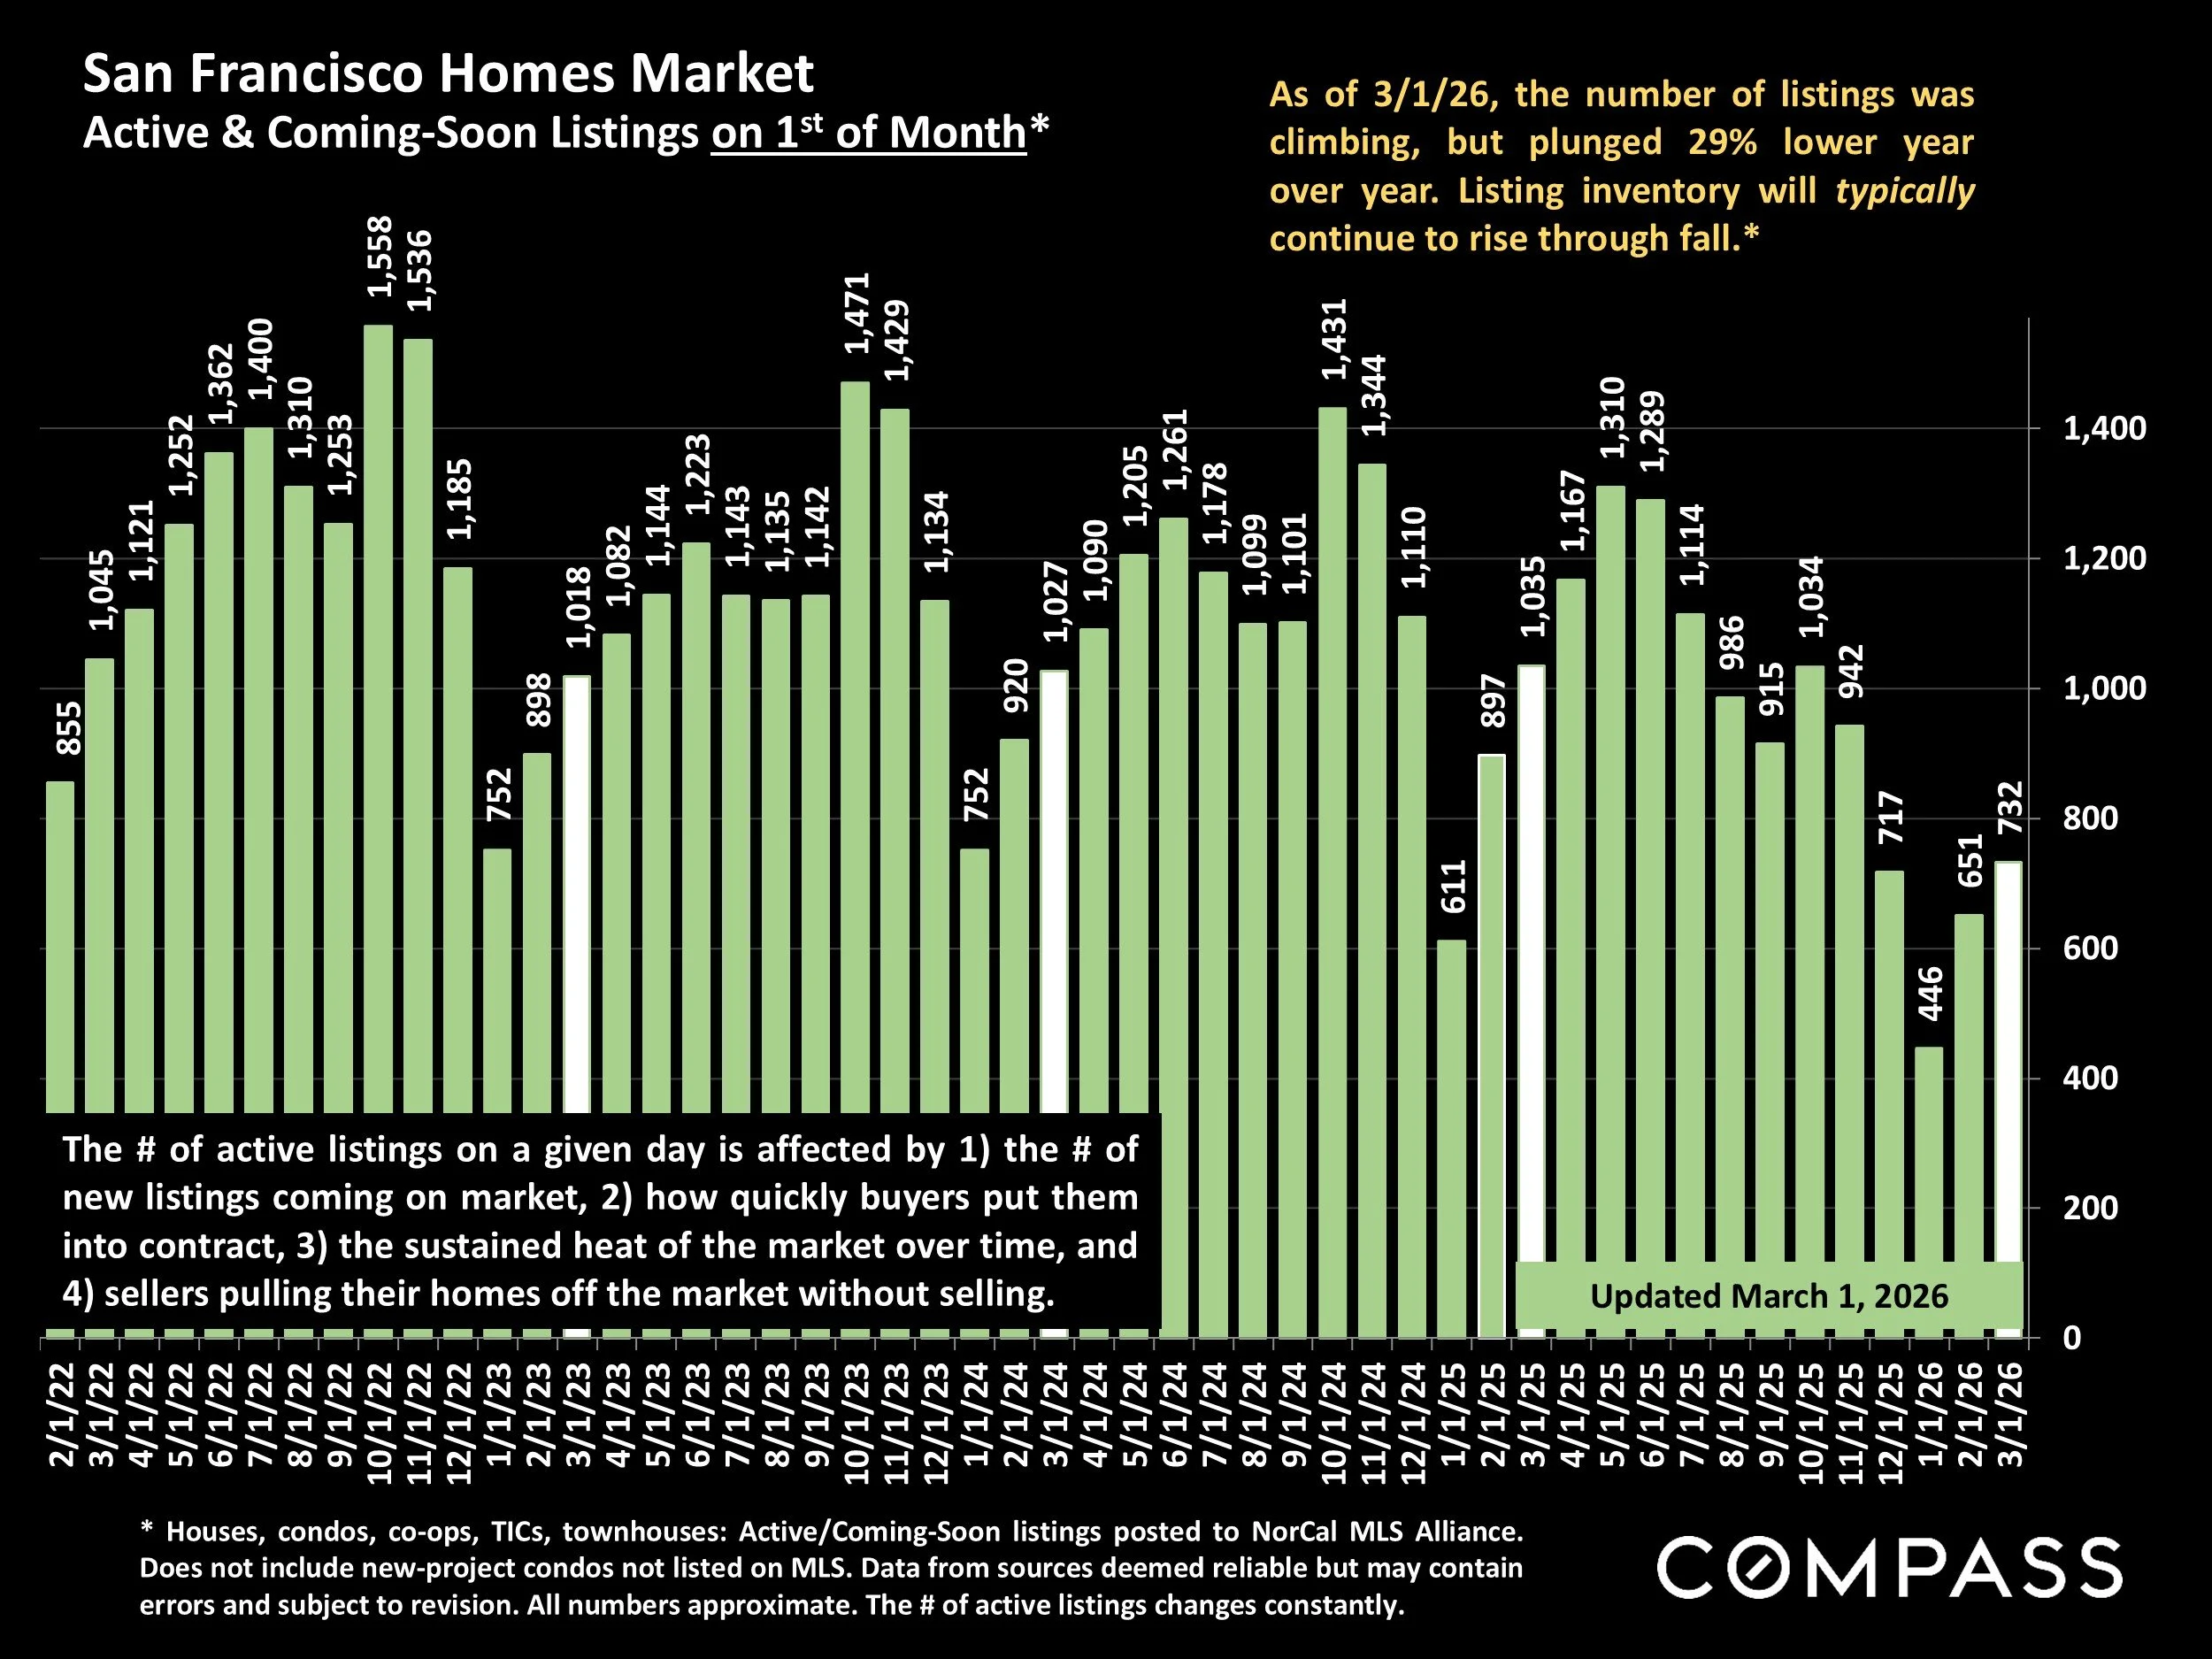
* Houses, condos, co-ops, TICs, townhouses: Active/Coming-Soon listings posted to NorCal MLS Alliance. Does not include new-project condos not listed on MLS. Data from sources deemed reliable but may contain errors and subject to revision. All numbers approximate. The # of active listings changes constantly.
As of 3/1/26, the number of listings was climbing, but plunged 29% lower year over year. Listing inventory will typically continue to rise through fall.*
The # of active listings on a given day is affected by 1) the # of new listings coming on market, 2) how quickly buyers put them into contract, 3) the sustained heat of the market over time, and 4) sellers pulling their homes off the market without selling.
# of Listings on Market vs. Average Monthly Sales*
San Francisco: Supply vs. Demand

Active/coming-soon listings posted to NorCal Alliance on 2/27/26 and average monthly number of sales in the 12 months through 2/15/26. Months Supply of Inventory = Listing Count/Avg. Monthly Sales. “Condo” includes TICs and co-ops. Not all listings and sales are reported to MLS. Data derived from sources deemed reliable but may contain errors and is subject to revision. Listing and sales counts change constantly. All numbers are approximate.
MSI measures how long it would take to sell the current inventory of active listings at the 12-month rate of sale. The lower the MSI, the stronger the buyer demand as compared to the supply of listings on the market.
As buyers jump back into the market in the new year faster than sellers list their homes, March is typically one of the months in which the supply of listings is lowest as compared to demand. These extremely low listing counts and MSI readings signify exceptionally heated and competitive markets across the board but especially for houses.
Listings Accepting Offers (Going into Contract)
San Francisco Market Dynamics & Seasonality
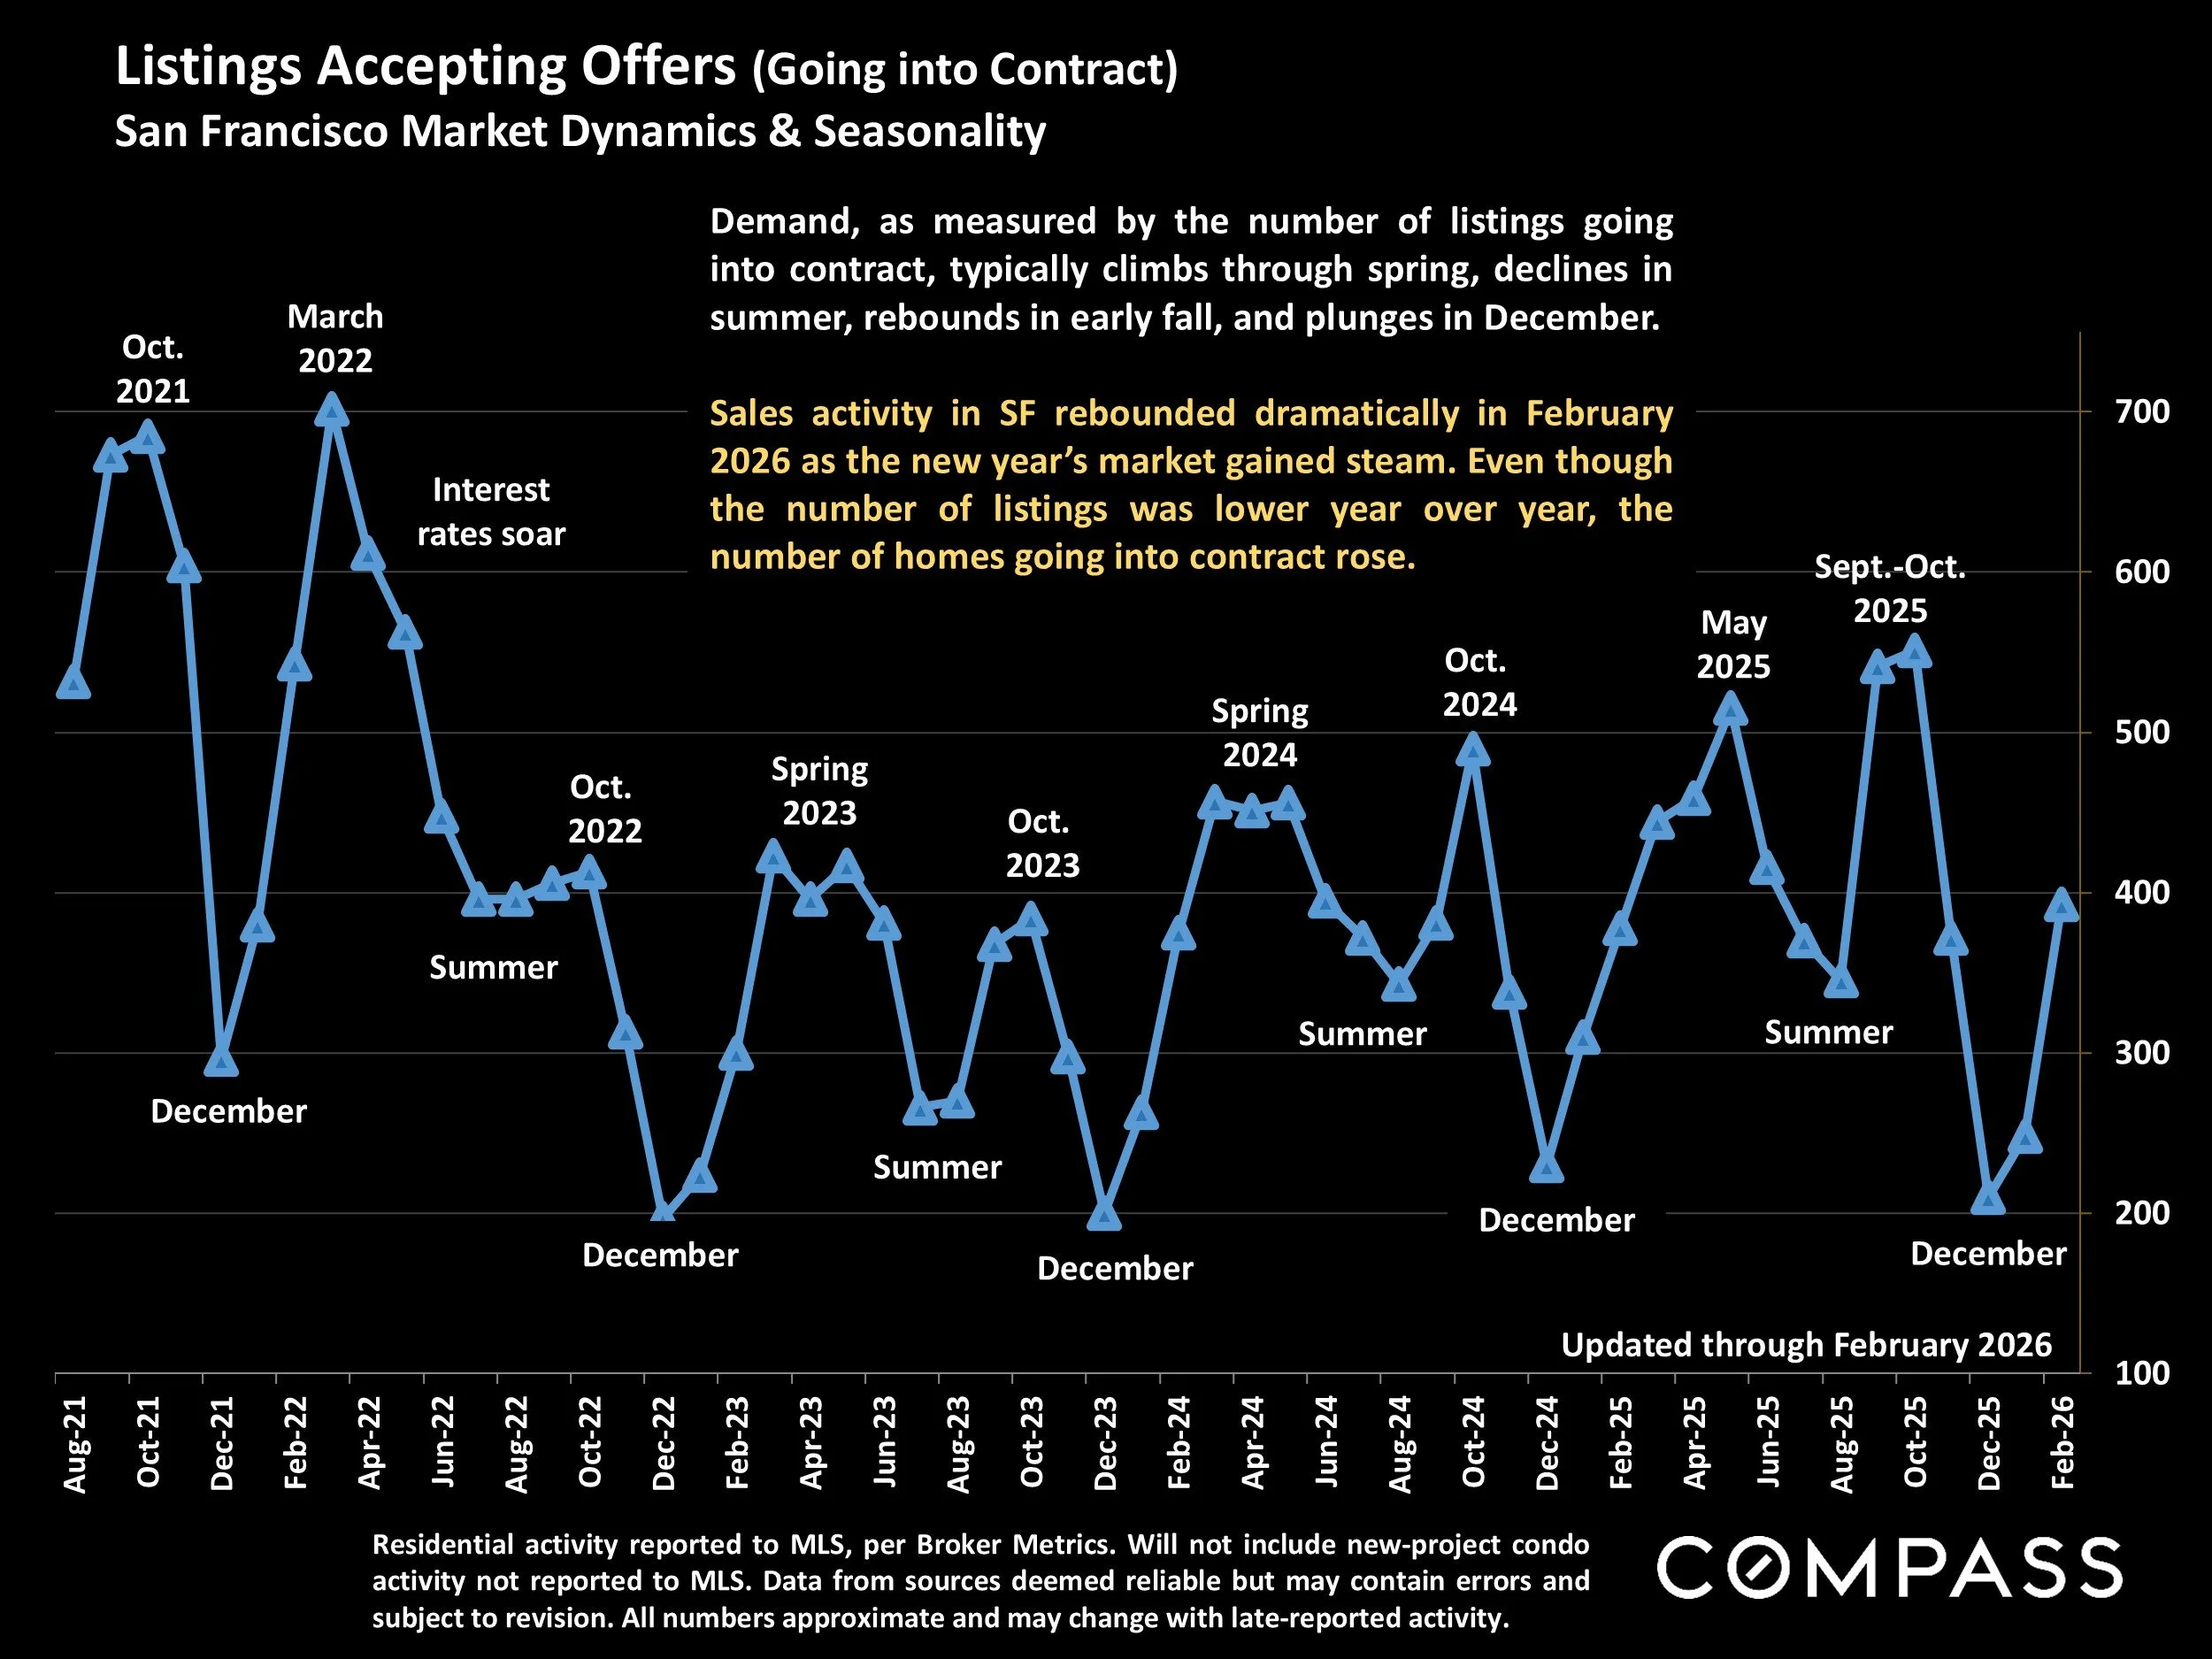
Residential activity reported to MLS, per Broker Metrics. Will not include new-project condo activity not reported to MLS. Data from sources deemed reliable but may contain errors and subject to revision. All numbers approximate and may change with late-reported activity.
Demand, as measured by the number of listings going into contract, typically climbs through spring, declines in summer, rebounds in early fall, and plunges in December.
Sales activity in SF rebounded dramatically in February 2026 as the new year’s market gained steam. Even though the number of listings was lower year over year, the number of homes going into contract rose.
Percentage of Listings Accepting Offers
San Francisco: Absorption Rate by Month

*SFARMLS reported data, per Broker Metrics. Not all new-condo project activity is reported to MLS. Last month’s data estimated using available data and may change with late reported activity. Data from sources deemed reliable but may contain errors and subject to revision. All numbers approximate.
Absorption rate measures buyer demand vs. the supply of listings for sale: The higher the percentage, the more heated and competitive the market. The SF market shifted dramatically in fall 2025. With inventory declining and demand increasing, the absorption rate in February 2026 was about 60% higher than in February 2025.
Overbidding List Prices in San Francisco
Percentage of Home Sales Closing over List Price
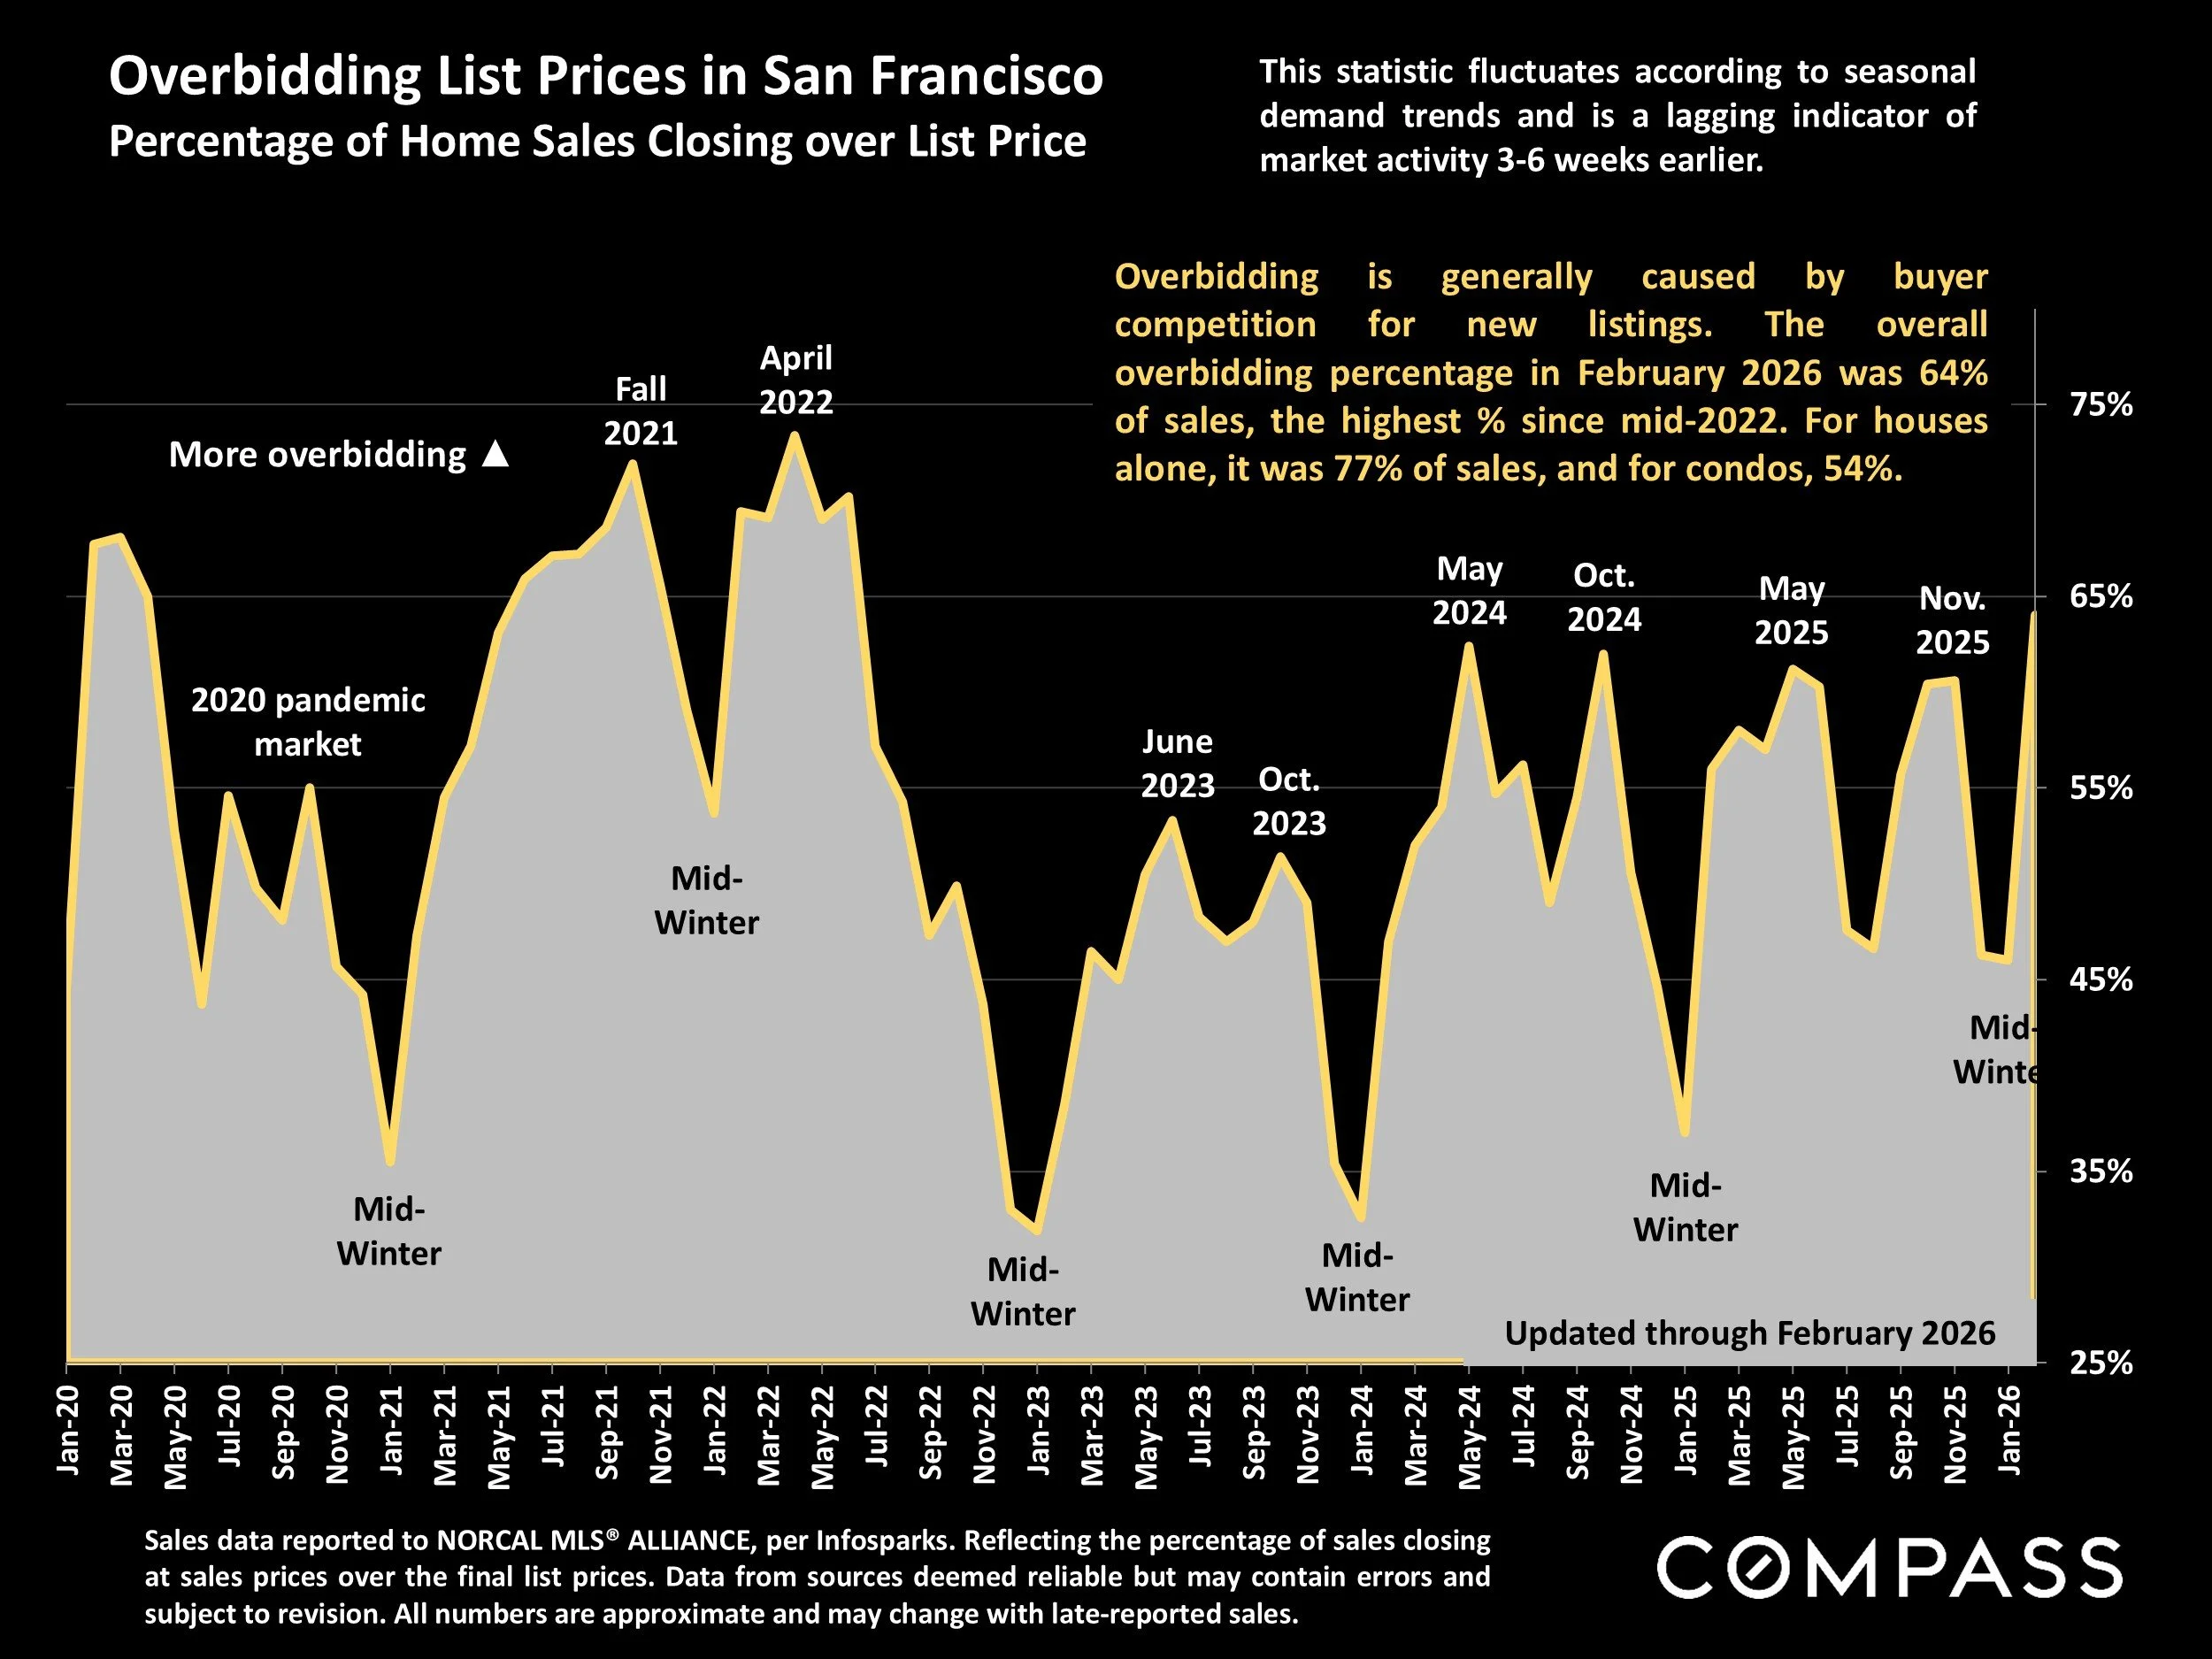
Sales data reported to NORCAL MLS® ALLIANCE, per Infosparks. Reflecting the percentage of sales closing at sales prices over the final list prices. Data from sources deemed reliable but may contain errors and subject to revision. All numbers are approximate and may change with late-reported sales.
Overbidding is generally caused by buyer competition for new listings. The overall overbidding percentage in February 2026 was 64% of sales, the highest % since mid-2022. For houses alone, it was 77% of sales, and for condos, 54%.
This statistic fluctuates according to seasonal demand trends and is a lagging indicator of market activity 3-6 weeks earlier.
Average Sales Price to Original List Price Percentage
San Francisco Over/Under Bidding: Market Dynamics & Seasonality

Sales reported to NorCal MLS Alliance, per Infosparks. Data derived from sources deemed reliable but may contain errors and subject to revision. All numbers approximate and may change with late-reported sales.
The average Sales Price to Original List Price Percentage in February 2026 was 10% above list price, the highest reading since spring 2022. For houses alone the average was 16.5% above list price, and for condos, 4.5% over list price.
This statistic can be distorted by strategic underpricing strategies by listing agents.
Average Days on Market – Speed of Sale
San Francisco Market Dynamics & Seasonality
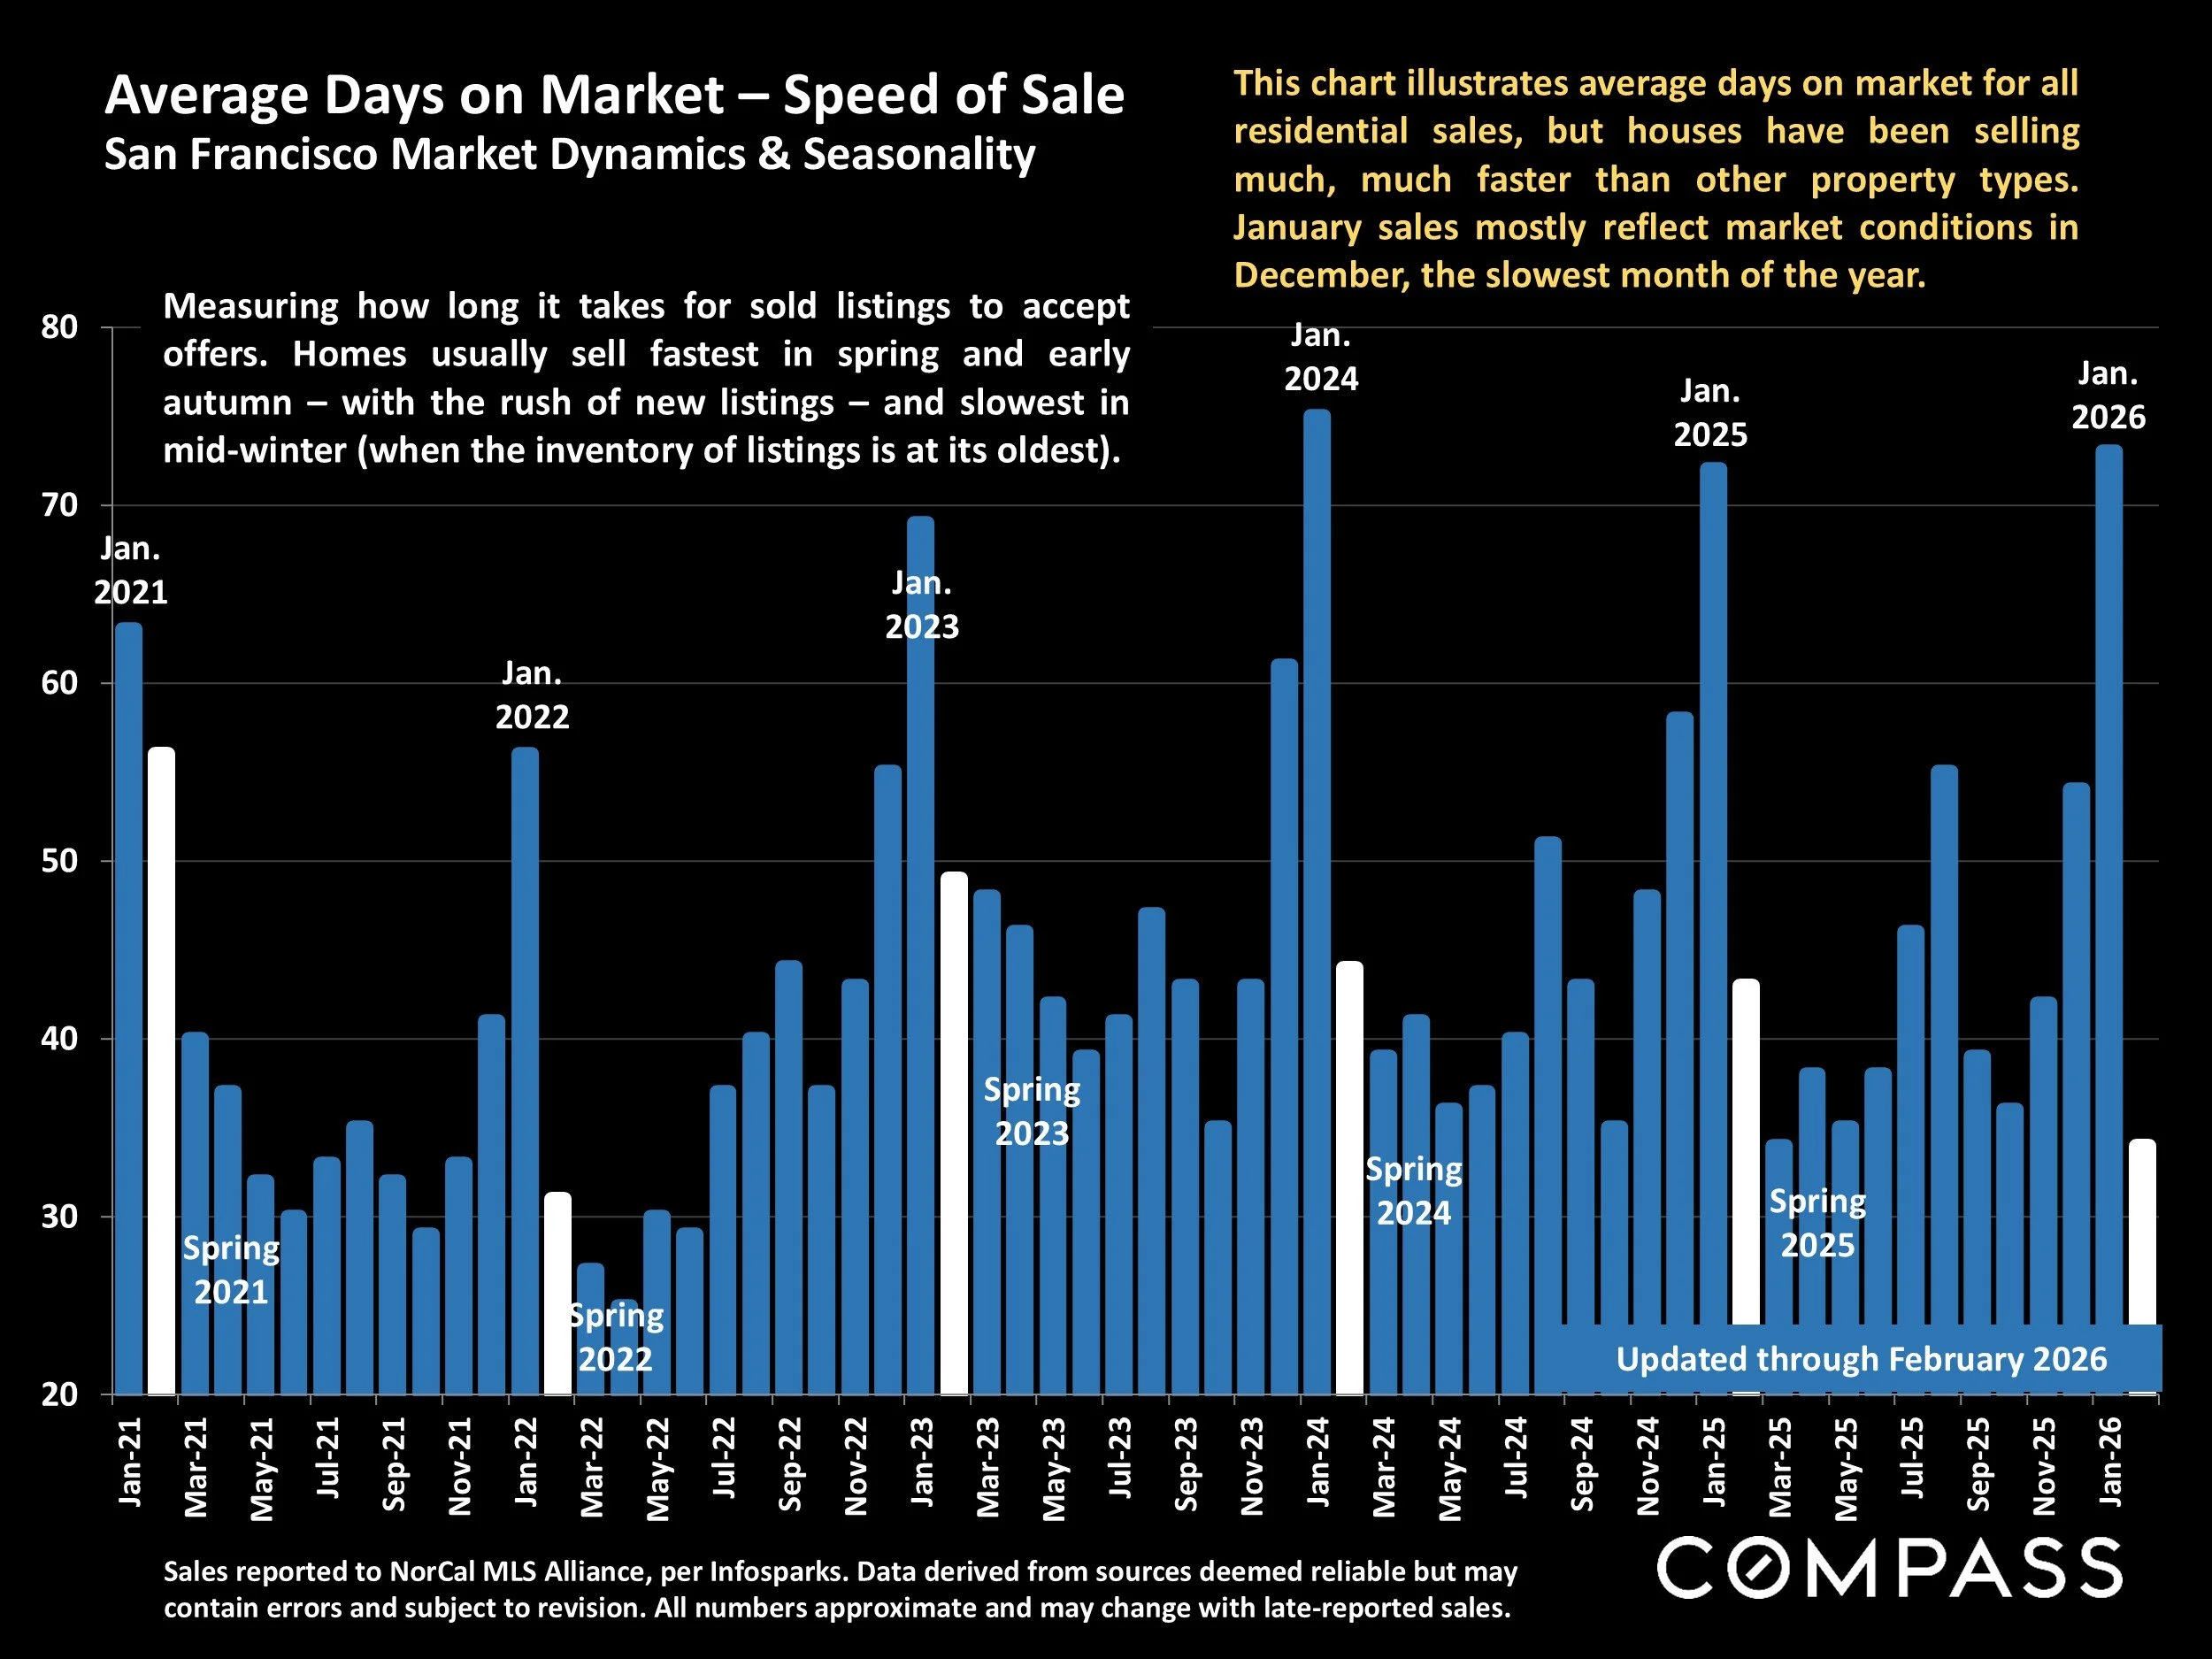
Sales reported to NorCal MLS Alliance, per Infosparks. Data derived from sources deemed reliable but may contain errors and subject to revision. All numbers approximate and may change with late-reported sales.
This chart illustrates average days on market for all residential sales, but houses have been selling much, much faster than other property types. January sales mostly reflect market conditions in December, the slowest month of the year.
Measuring how long it takes for sold listings to accept offers. Homes usually sell fastest in spring and early autumn – with the rush of new listings – and slowest in mid-winter (when the inventory of listings is at its oldest).
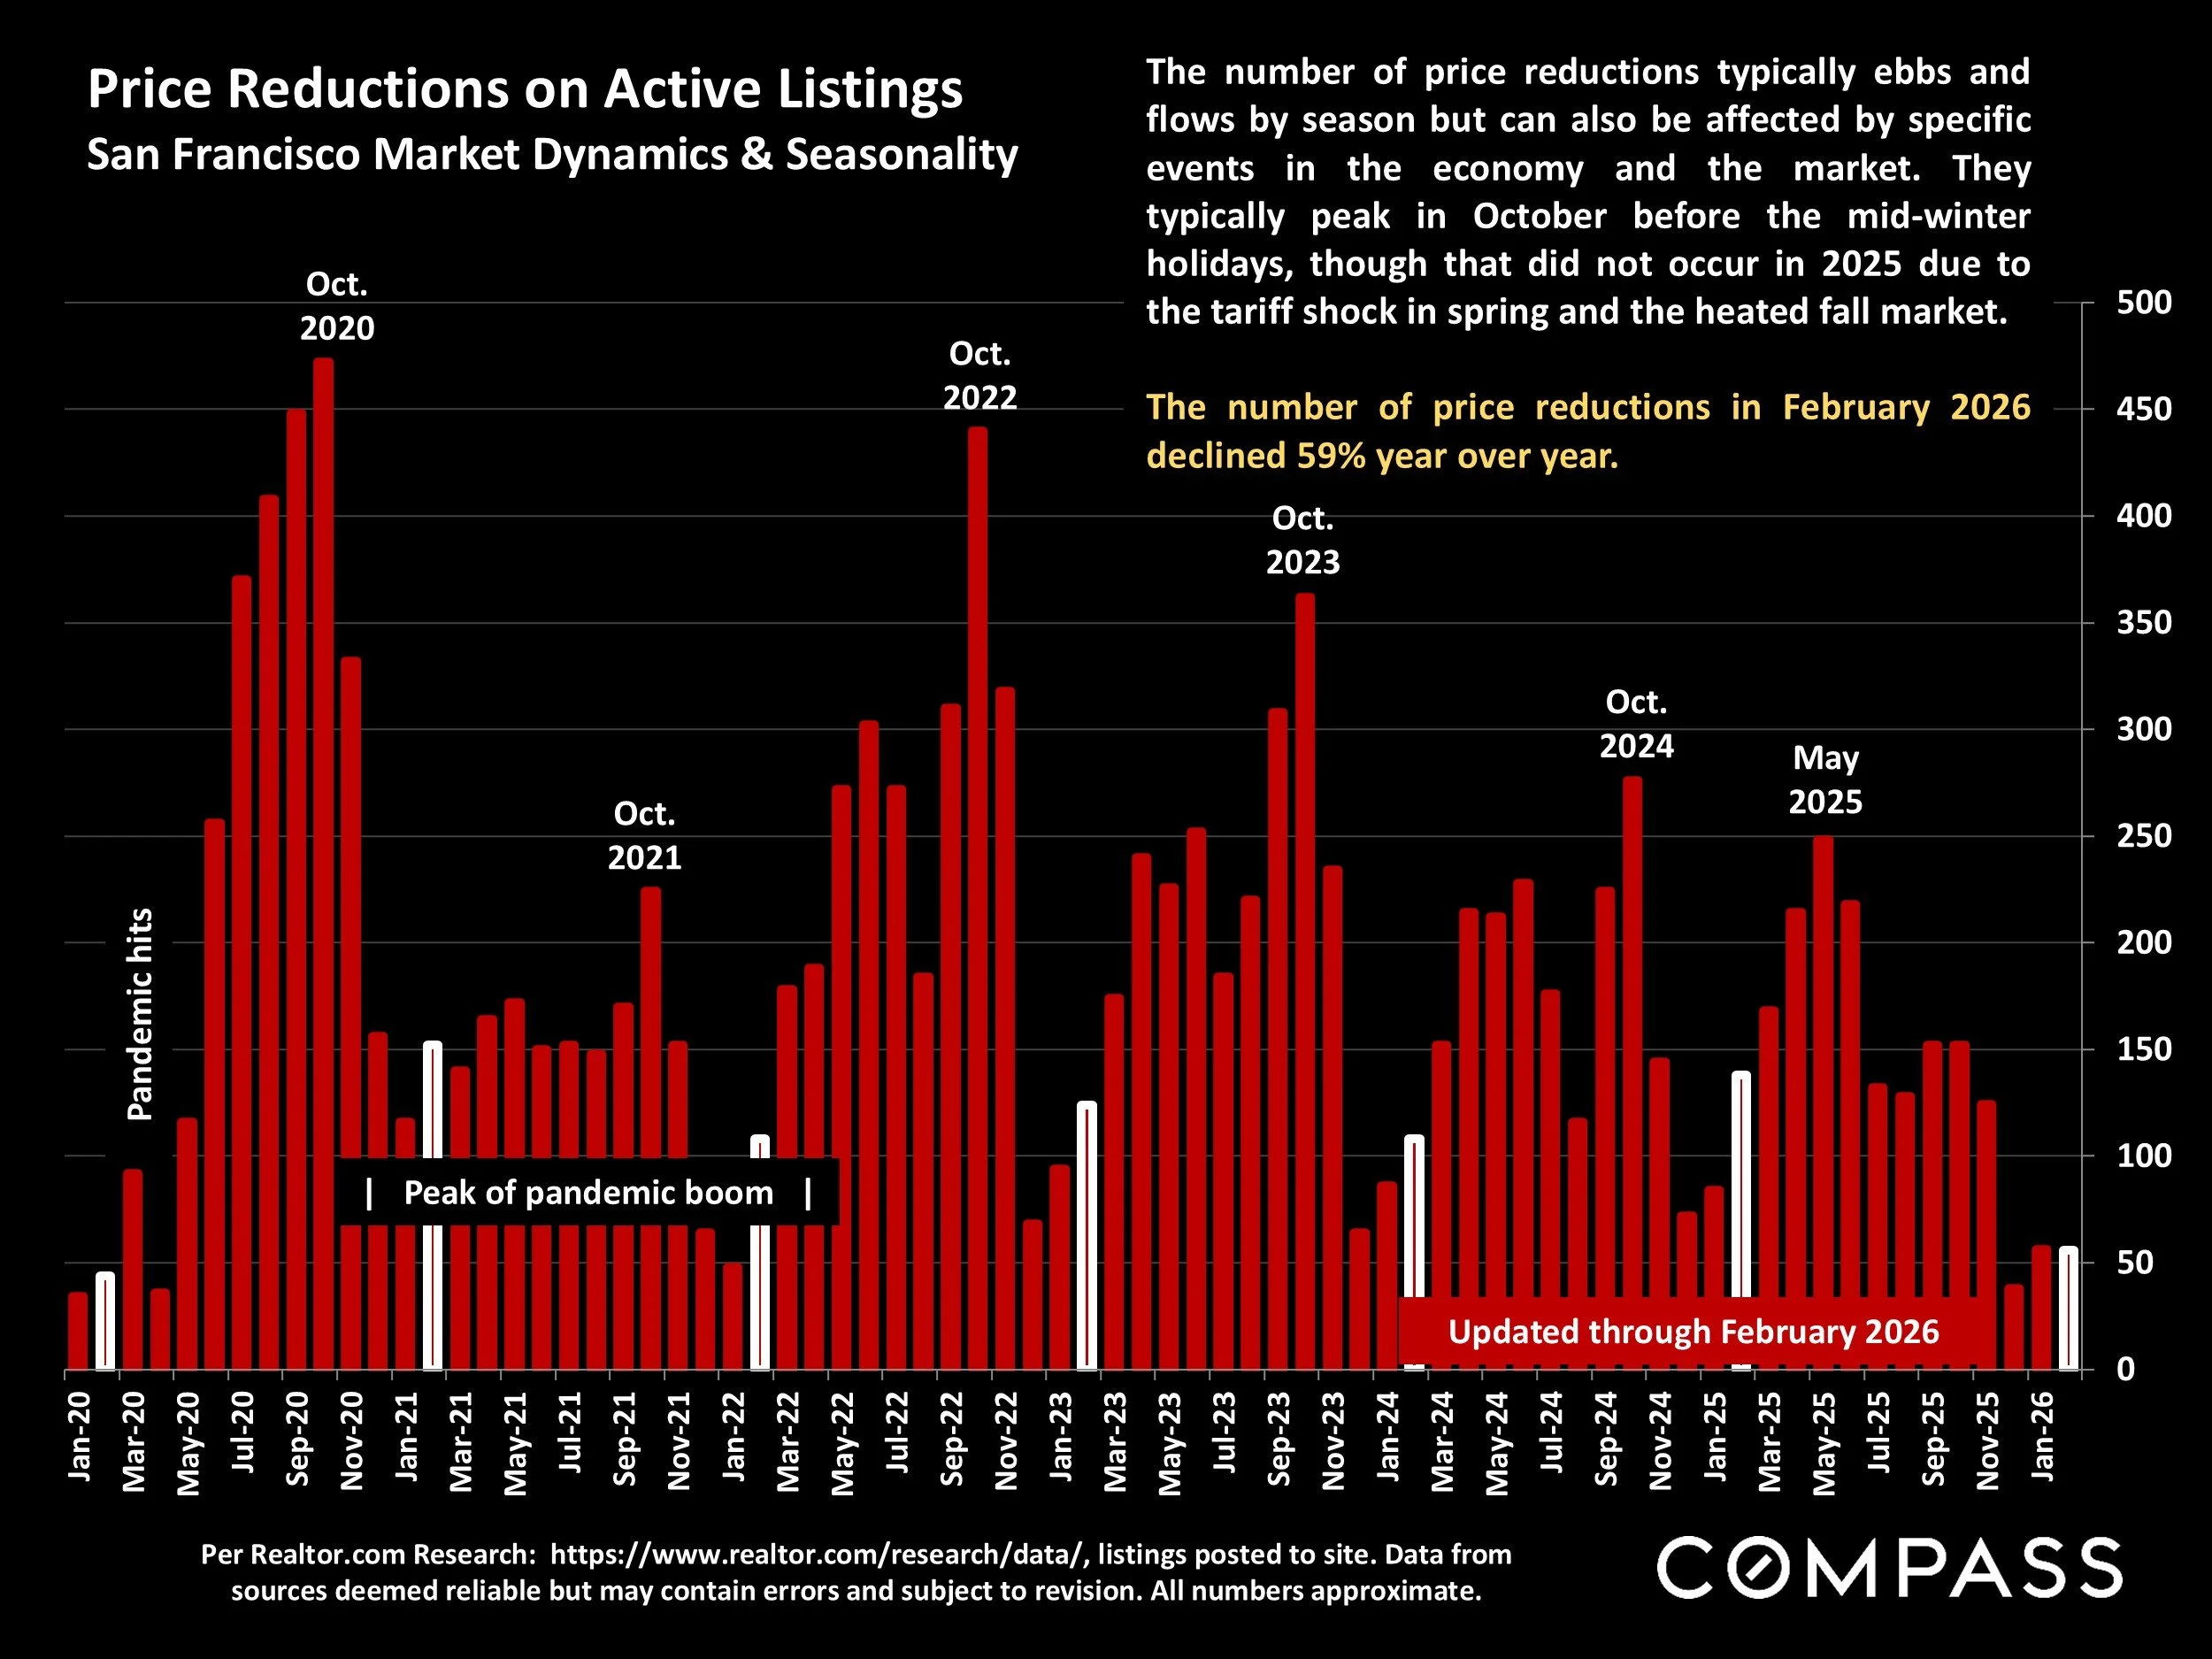
Price Reductions on Active Listings
San Francisco Market Dynamics & Seasonality
Per Realtor.com Research: https://www.realtor.com/research/data/, listings posted to site. Data from sources deemed reliable but may contain errors and subject to revision. All numbers approximate.
The number of price reductions typically ebbs and flows by season but can also be affected by specific events in the economy and the market. They typically peak in October before the mid-winter holidays, though that did not occur in 2025 due to the tariff shock in spring and the heated fall market.
The number of price reductions in February 2026 declined 59% year over year.
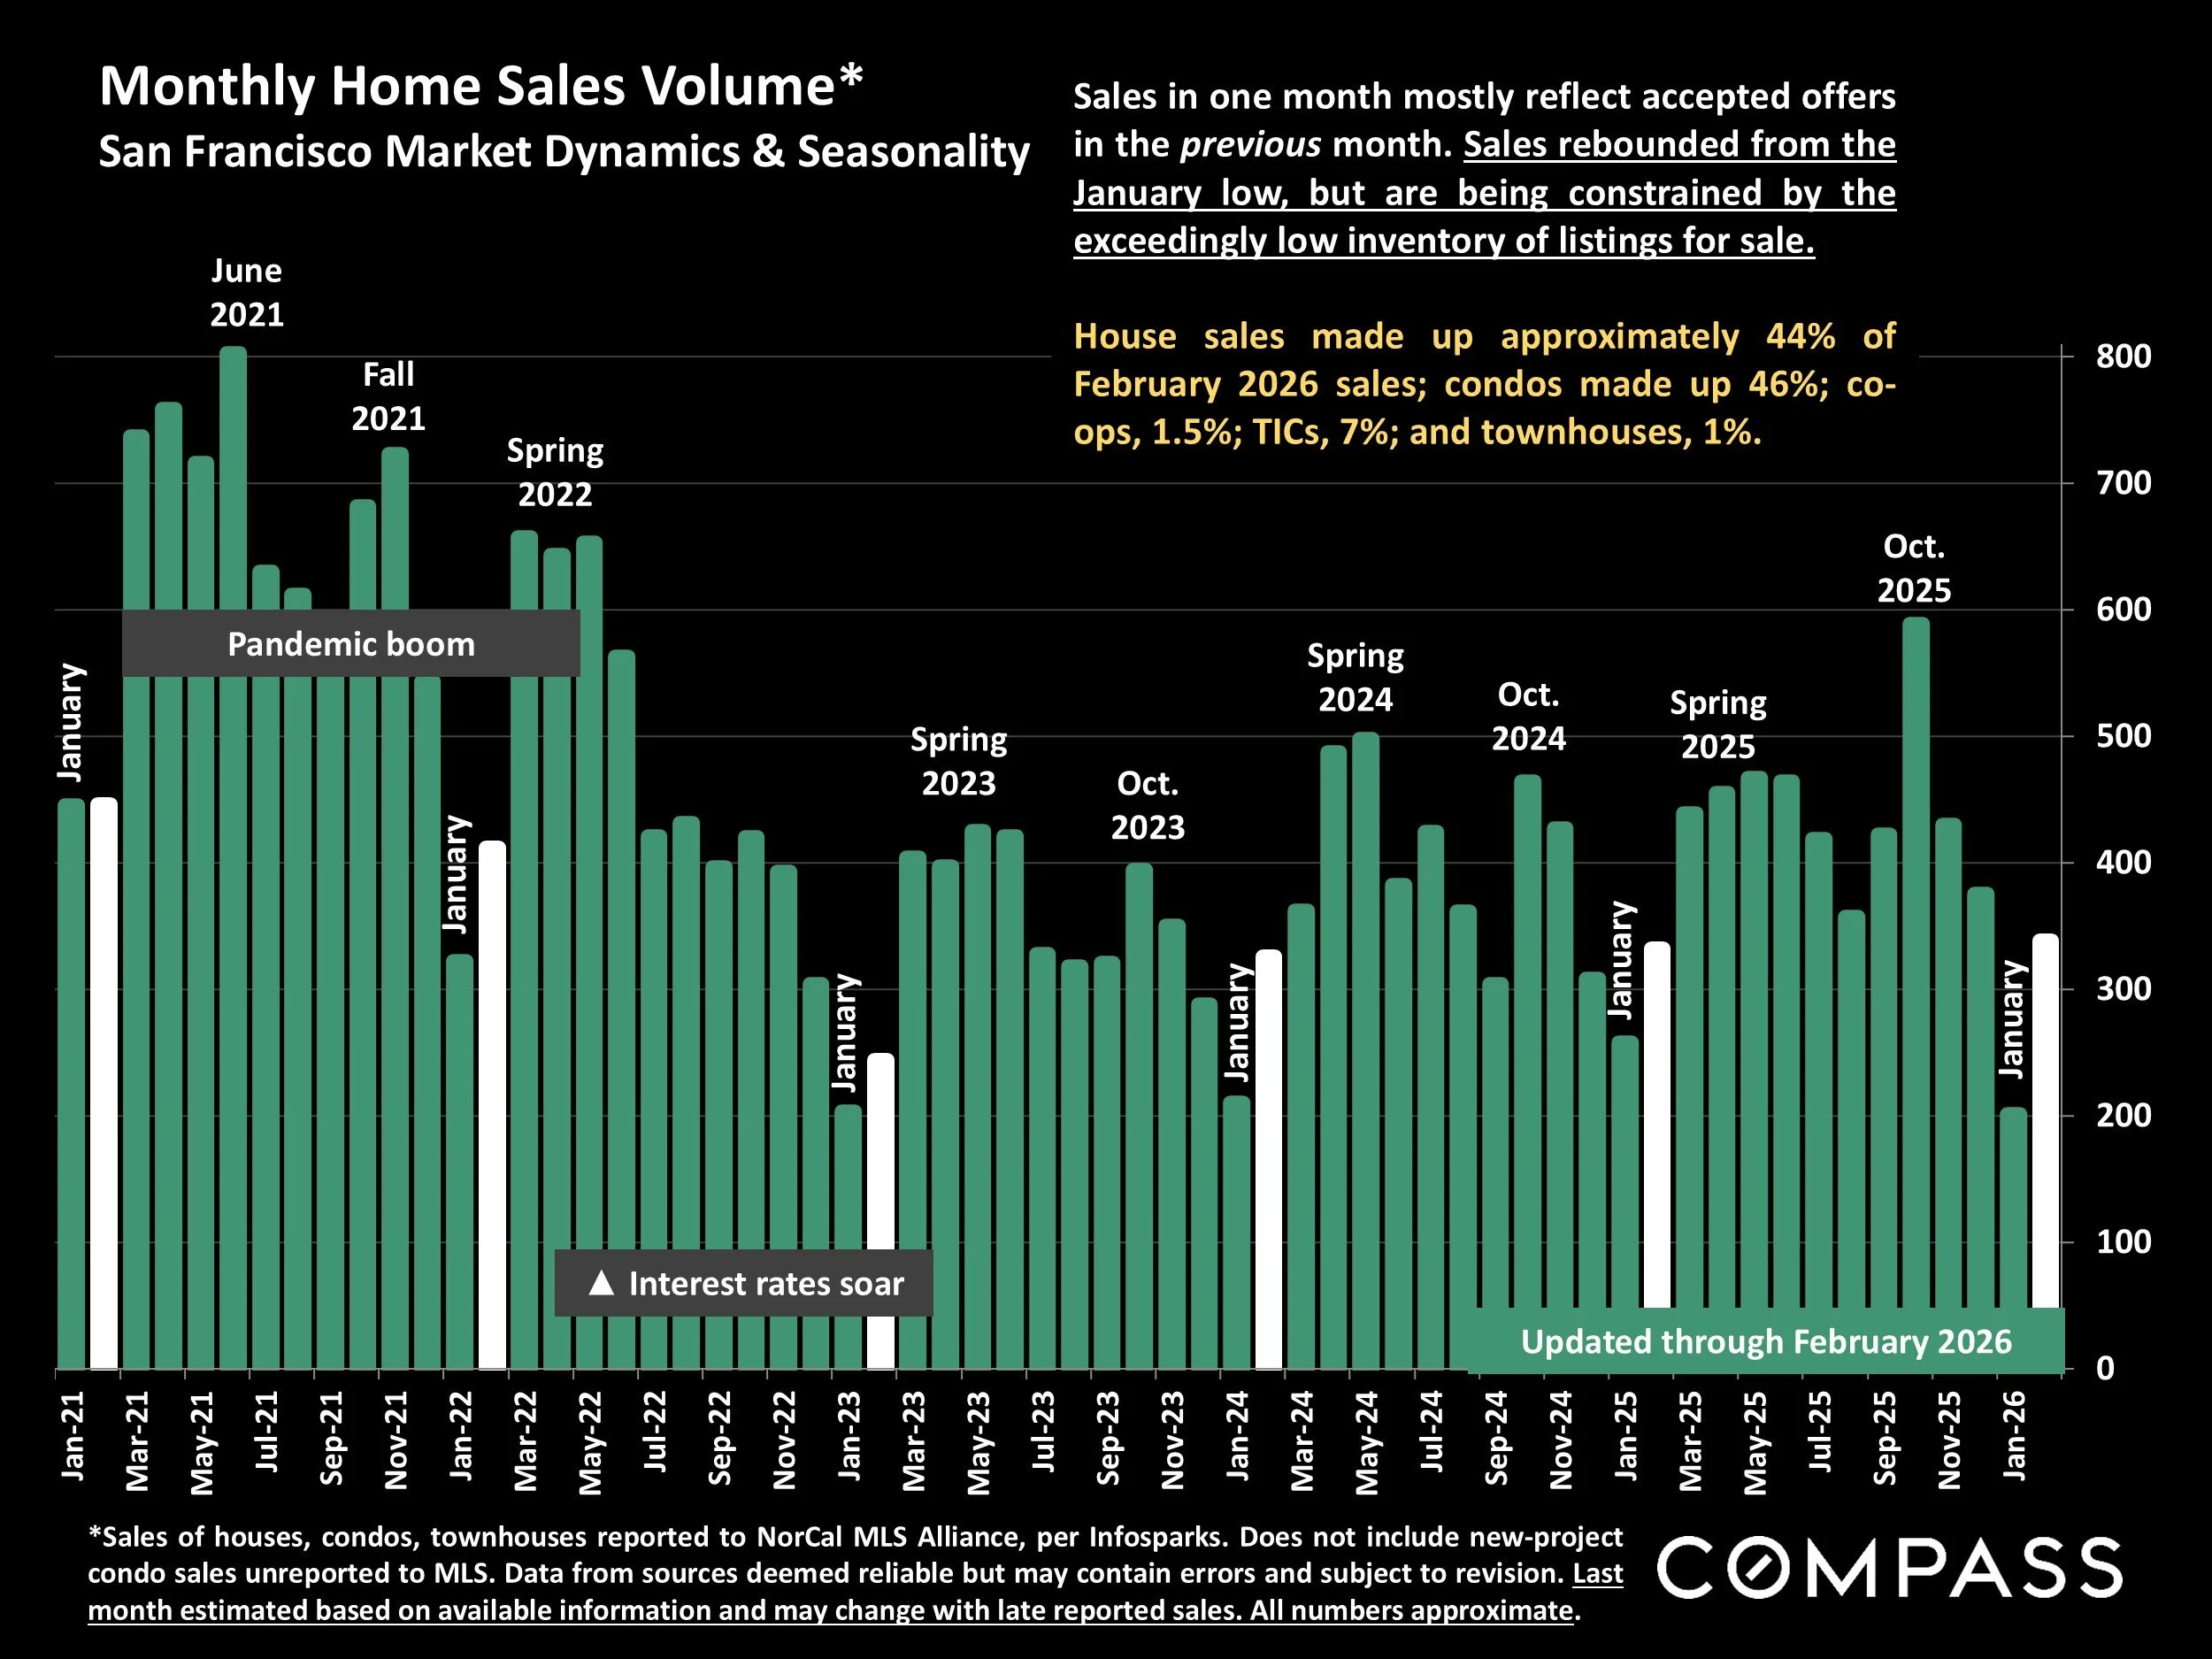
Monthly Home Sales Volume*
San Francisco Market Dynamics & Seasonality
*Sales of houses, condos, townhouses reported to NorCal MLS Alliance, per Infosparks. Does not include new-project condo sales unreported to MLS. Data from sources deemed reliable but may contain errors and subject to revision. Last month estimated based on available information and may change with late reported sales. All numbers approximate.
Sales in one month mostly reflect accepted offers in the previous month. Sales rebounded from the January low, but are being constrained by the exceedingly low inventory of listings for sale.
House sales made up approximately 44% of February 2026 sales; condos made up 46%; co-ops, 1.5%; TICs, 7%; and townhouses, 1%.
Selected Economic & Demographic Data
San Francisco Population
Breakdown Estimates by Race/Ancestry
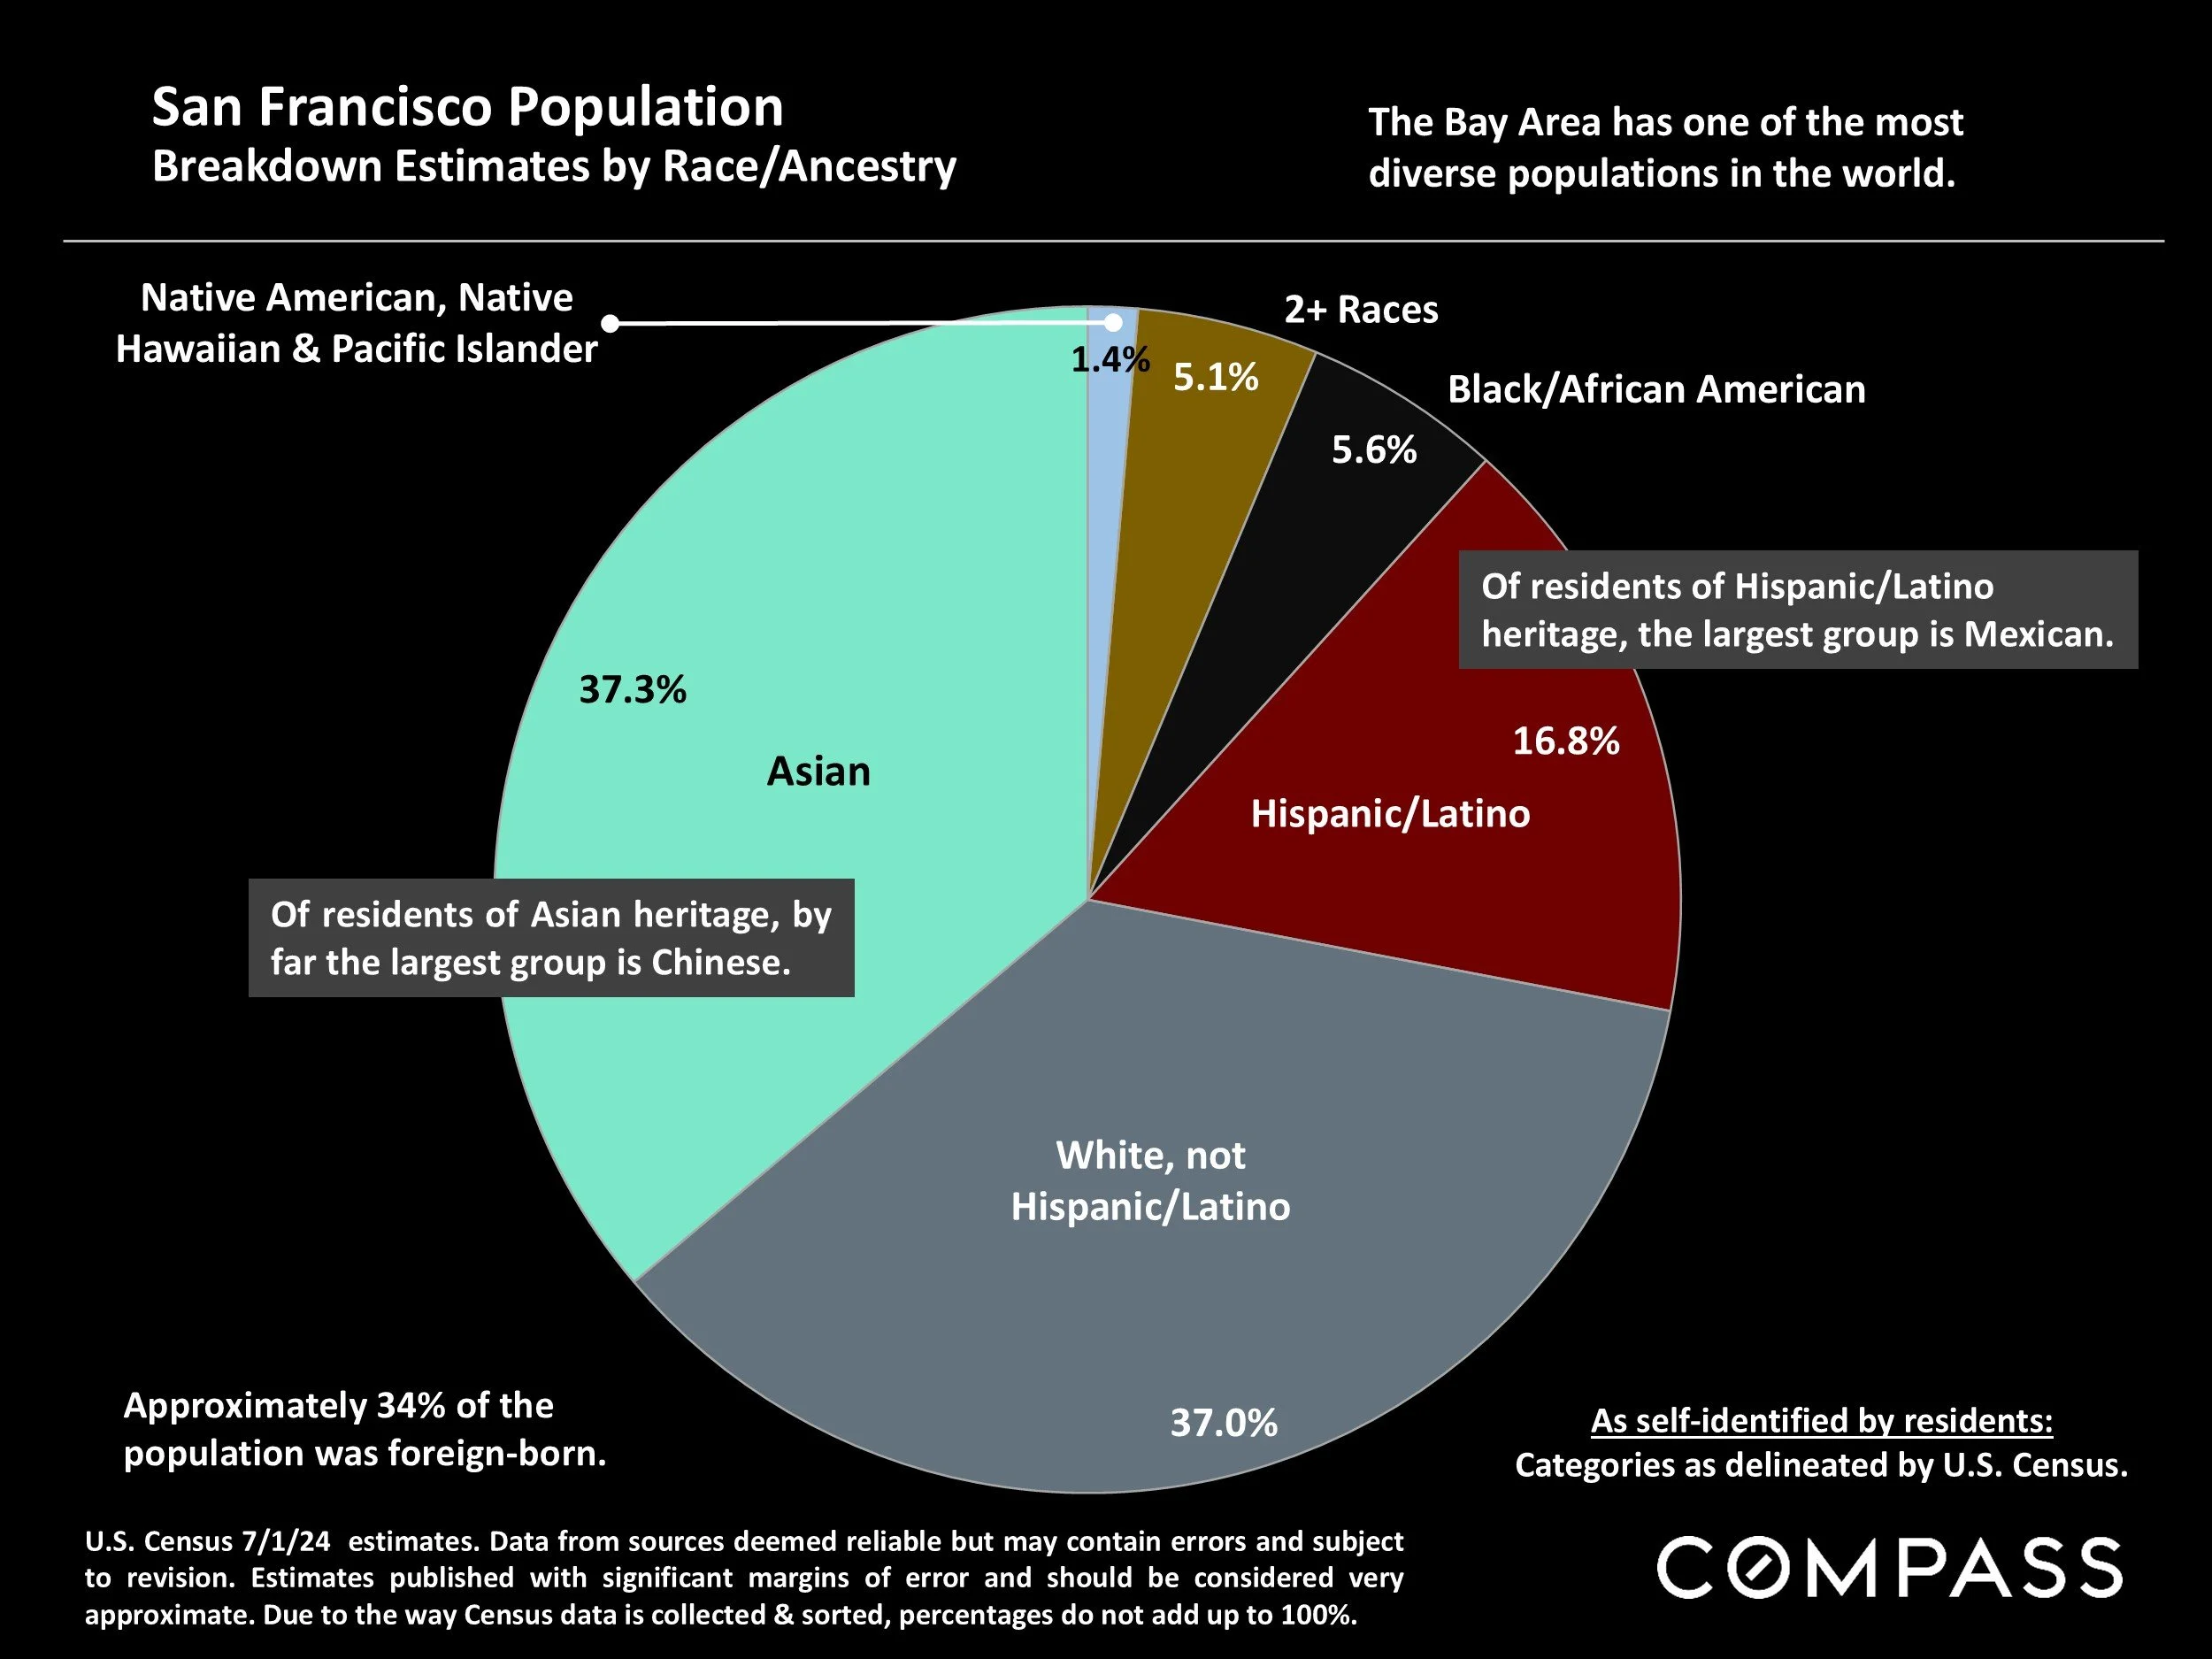
U.S. Census 7/1/24 estimates. Data from sources deemed reliable but may contain errors and subject to revision. Estimates published with significant margins of error and should be considered very approximate. Due to the way Census data is collected & sorted, percentages do not add up to 100%.
The Bay Area has one of the most diverse populations in the world.
Mortgage Interest Rates, August 2022 to 2026 YTD
30-Year Conforming Fixed-Rate Loans, Weekly Average Readings*
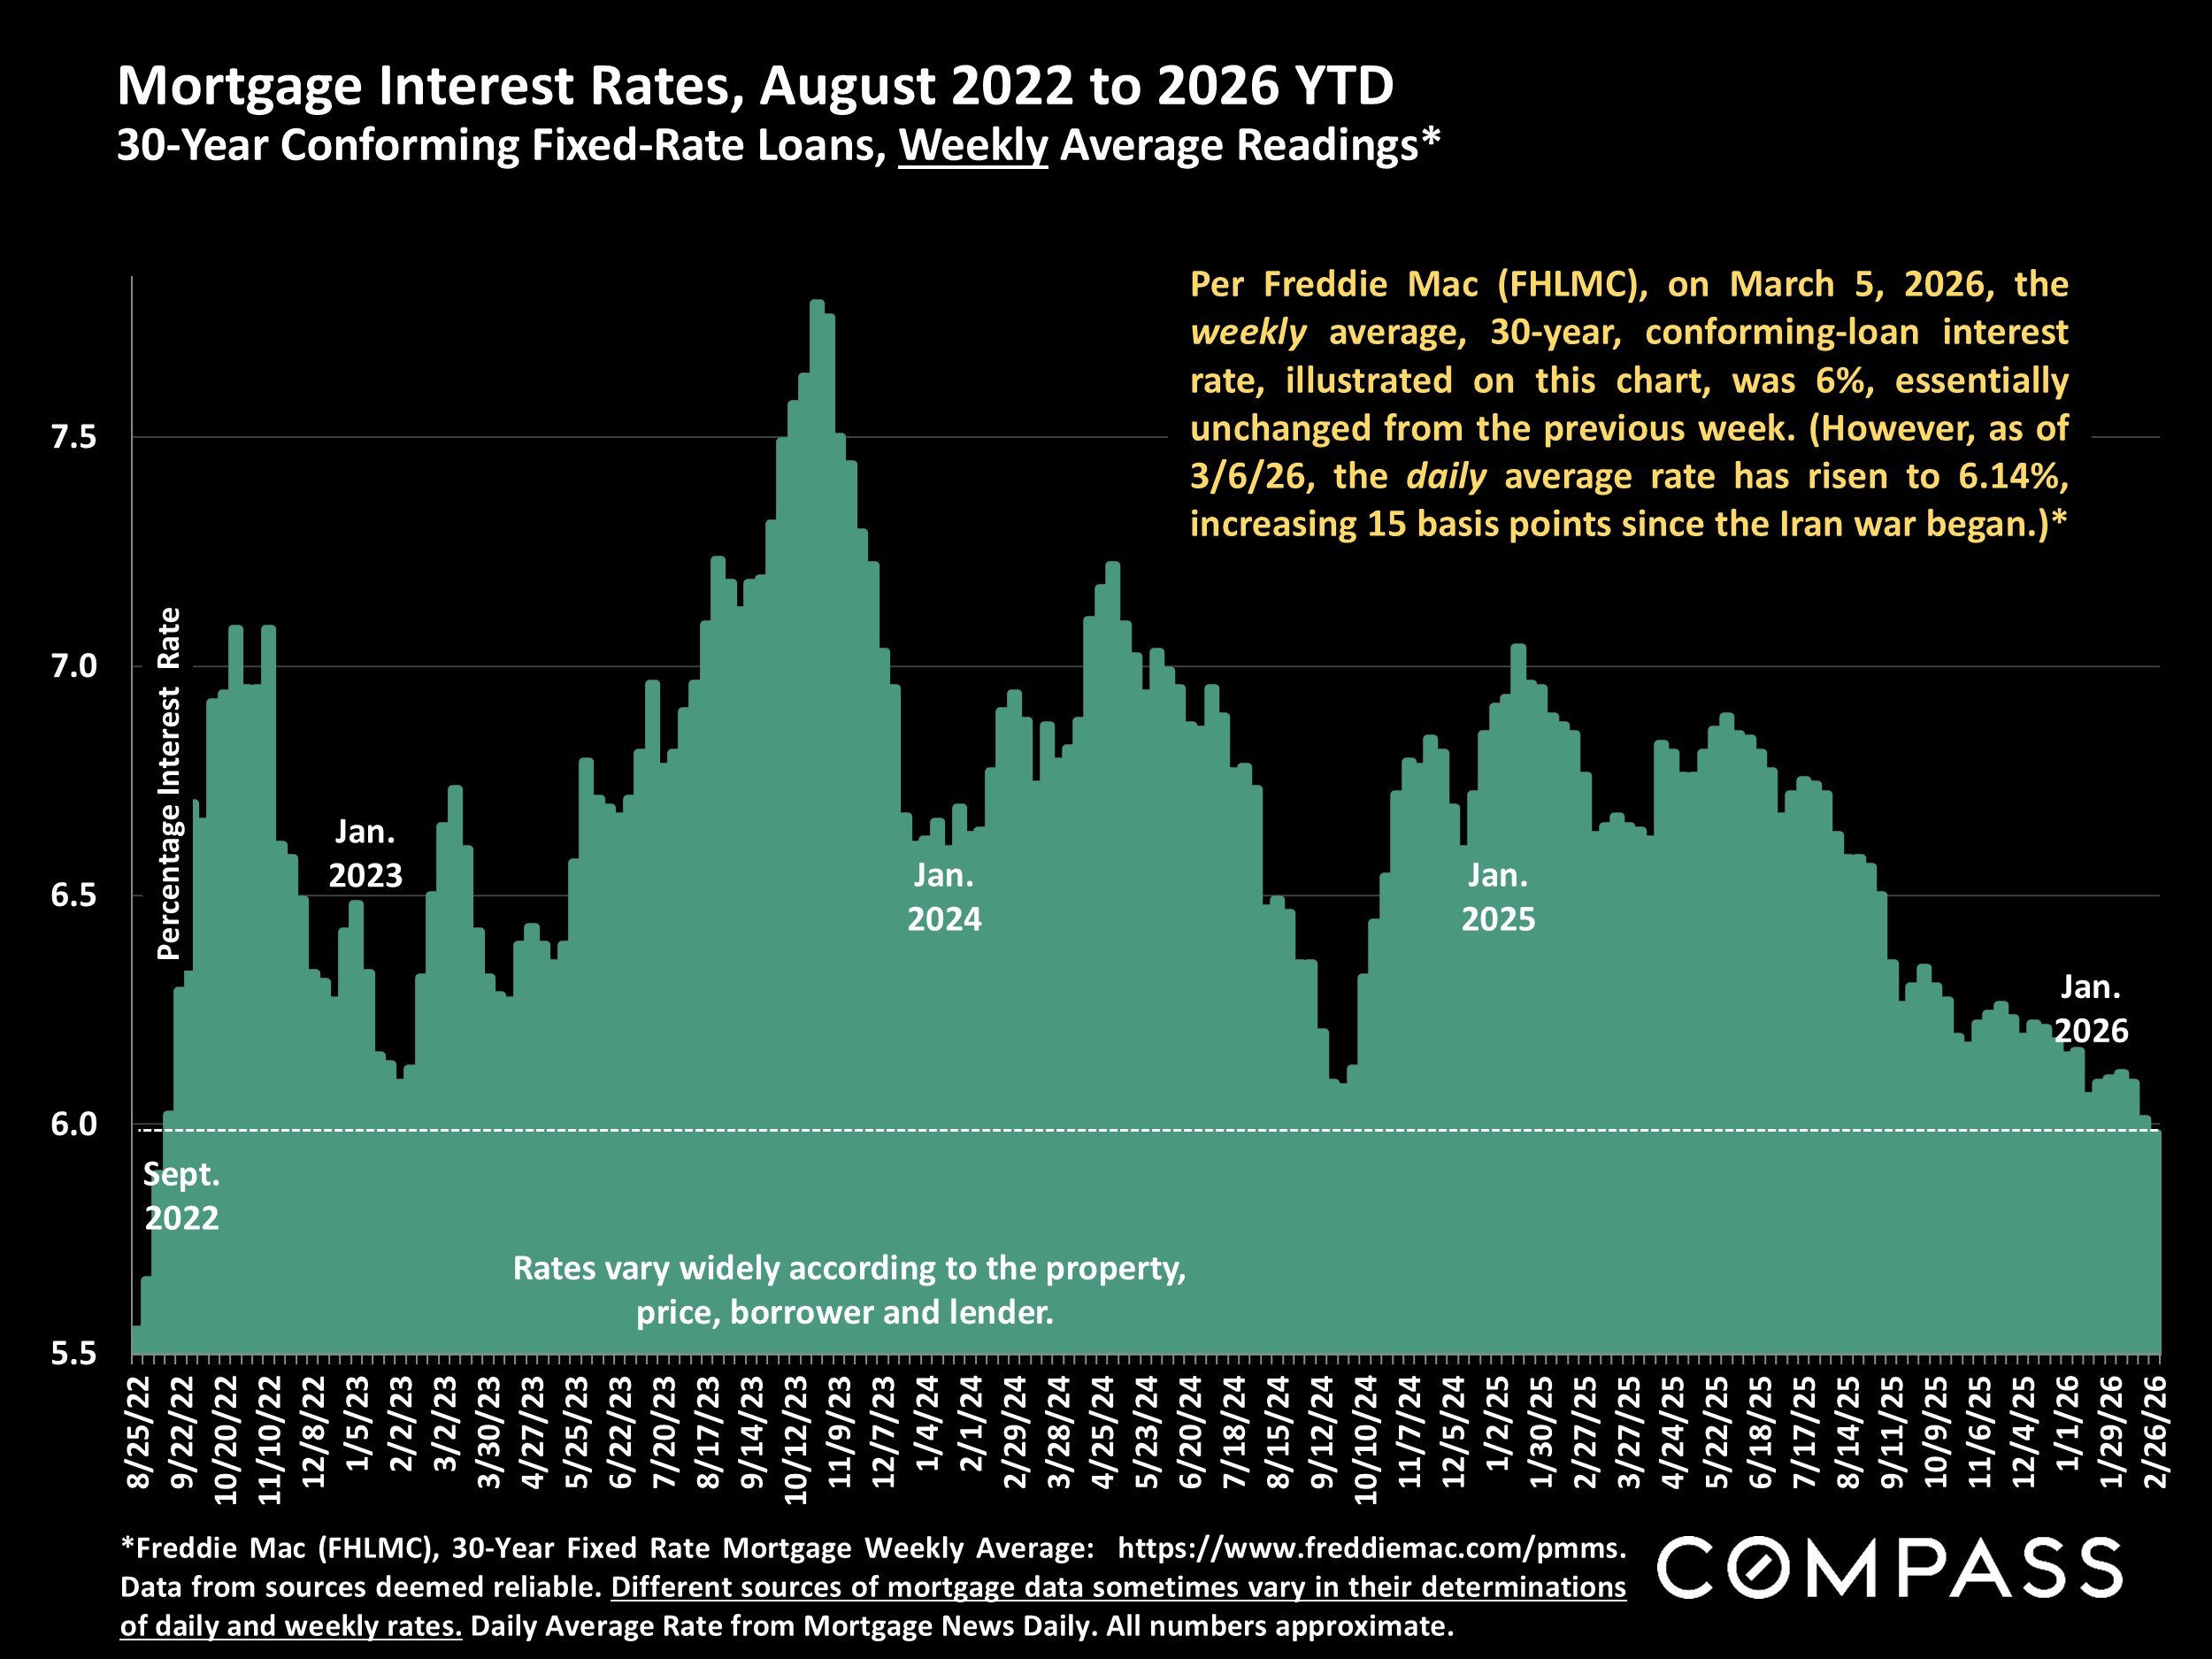
*Freddie Mac (FHLMC), 30-Year Fixed Rate Mortgage Weekly Average: https://www.freddiemac.com/pmms. Data from sources deemed reliable. Different sources of mortgage data sometimes vary in their determinations of daily and weekly rates. Daily Average Rate from Mortgage News Daily. All numbers approximate.
Per Freddie Mac (FHLMC), on March 5, 2026, the weekly average, 30-year, conforming-loan interest rate, illustrated on this chart, was 6%, essentially unchanged from the previous week. (However, as of 3/6/26, the daily average rate has risen to 6.14%, increasing 15 basis points since the Iran war began.)*
Crude Oil, Price per Barrel
Since February 2, 2026*
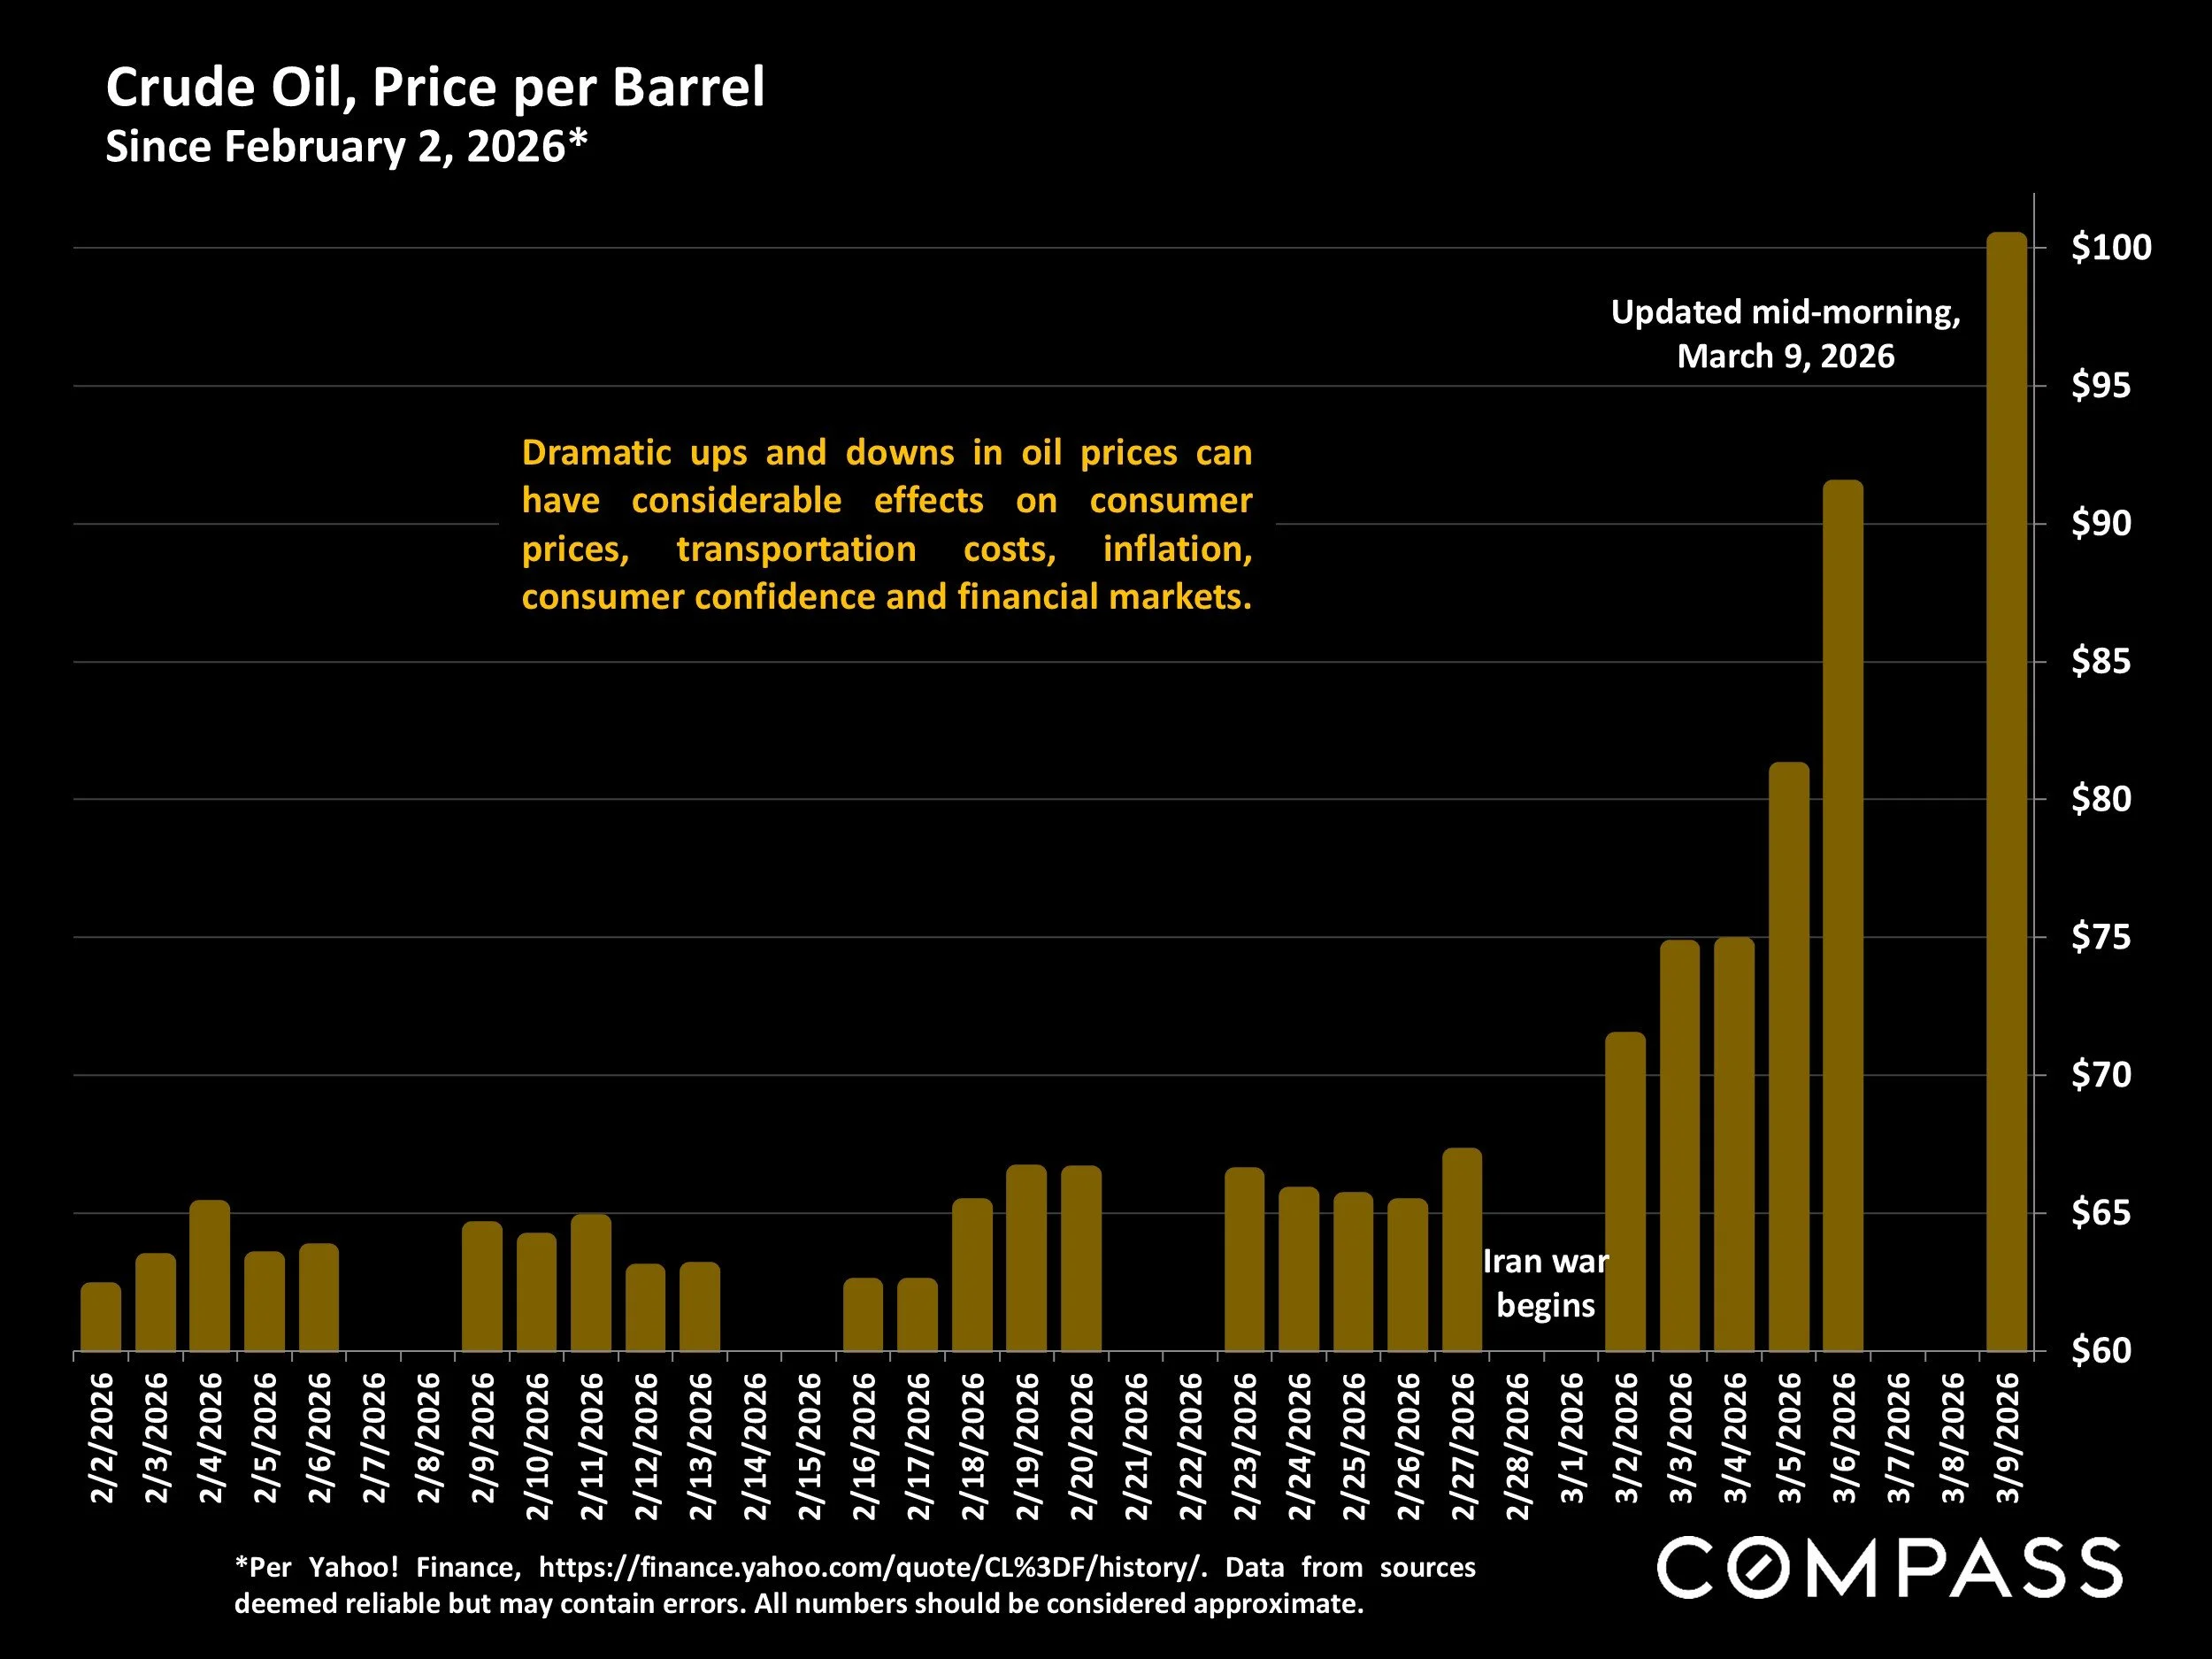
*Per Yahoo! Finance, https://finance.yahoo.com/quote/CL%3DF/history/. Data from sources deemed reliable but may contain errors. All numbers should be considered approximate.
Dramatic ups and downs in oil prices, if sustained, can have considerable effects on consumer prices, transportation costs, inflation, consumer confidence and financial markets.
Financial Markets, 2025 – 2026 YTD
Percentage Increases in S&P 500 & Nasdaq since 1/2/25
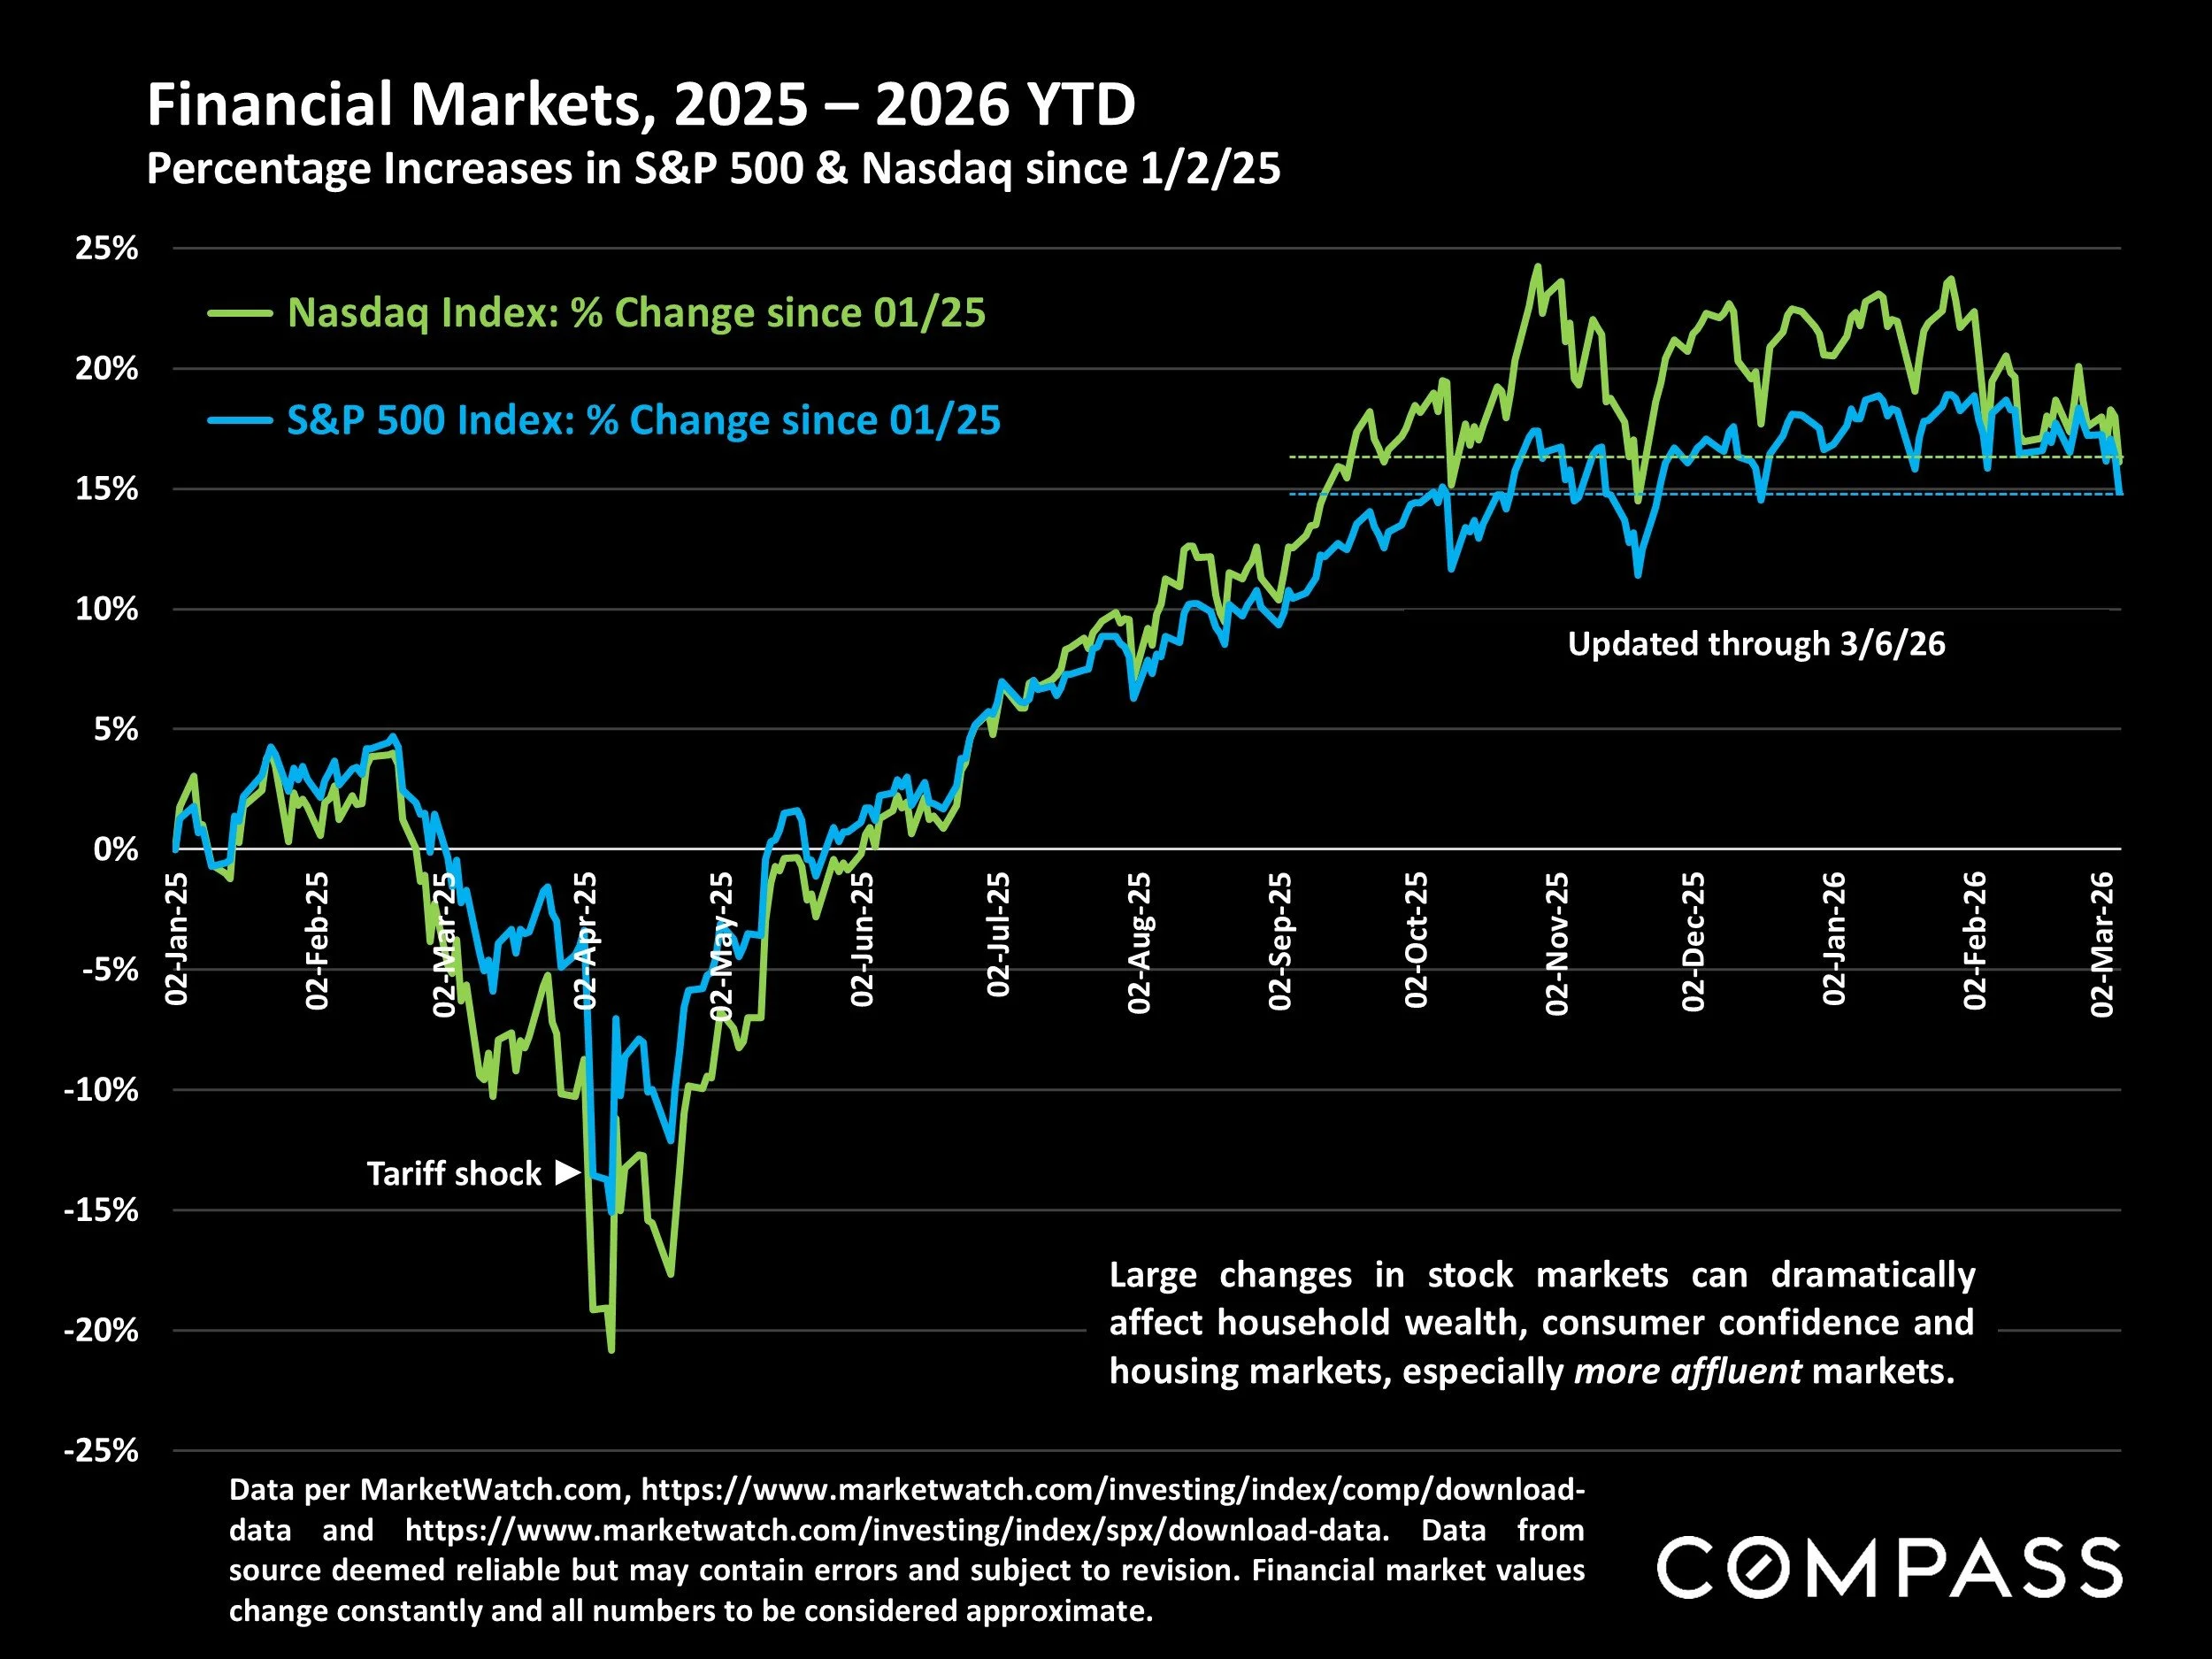
Data per MarketWatch.com, https://www.marketwatch.com/investing/index/comp/download-data and https://www.marketwatch.com/investing/index/spx/download-data. Data from source deemed reliable but may contain errors and subject to revision. Financial market values change constantly and all numbers to be considered approximate.
Large changes in stock markets can dramatically affect household wealth, consumer confidence and housing markets, especially more affluent markets.
VIX Volatility Index*
By Day in 2025
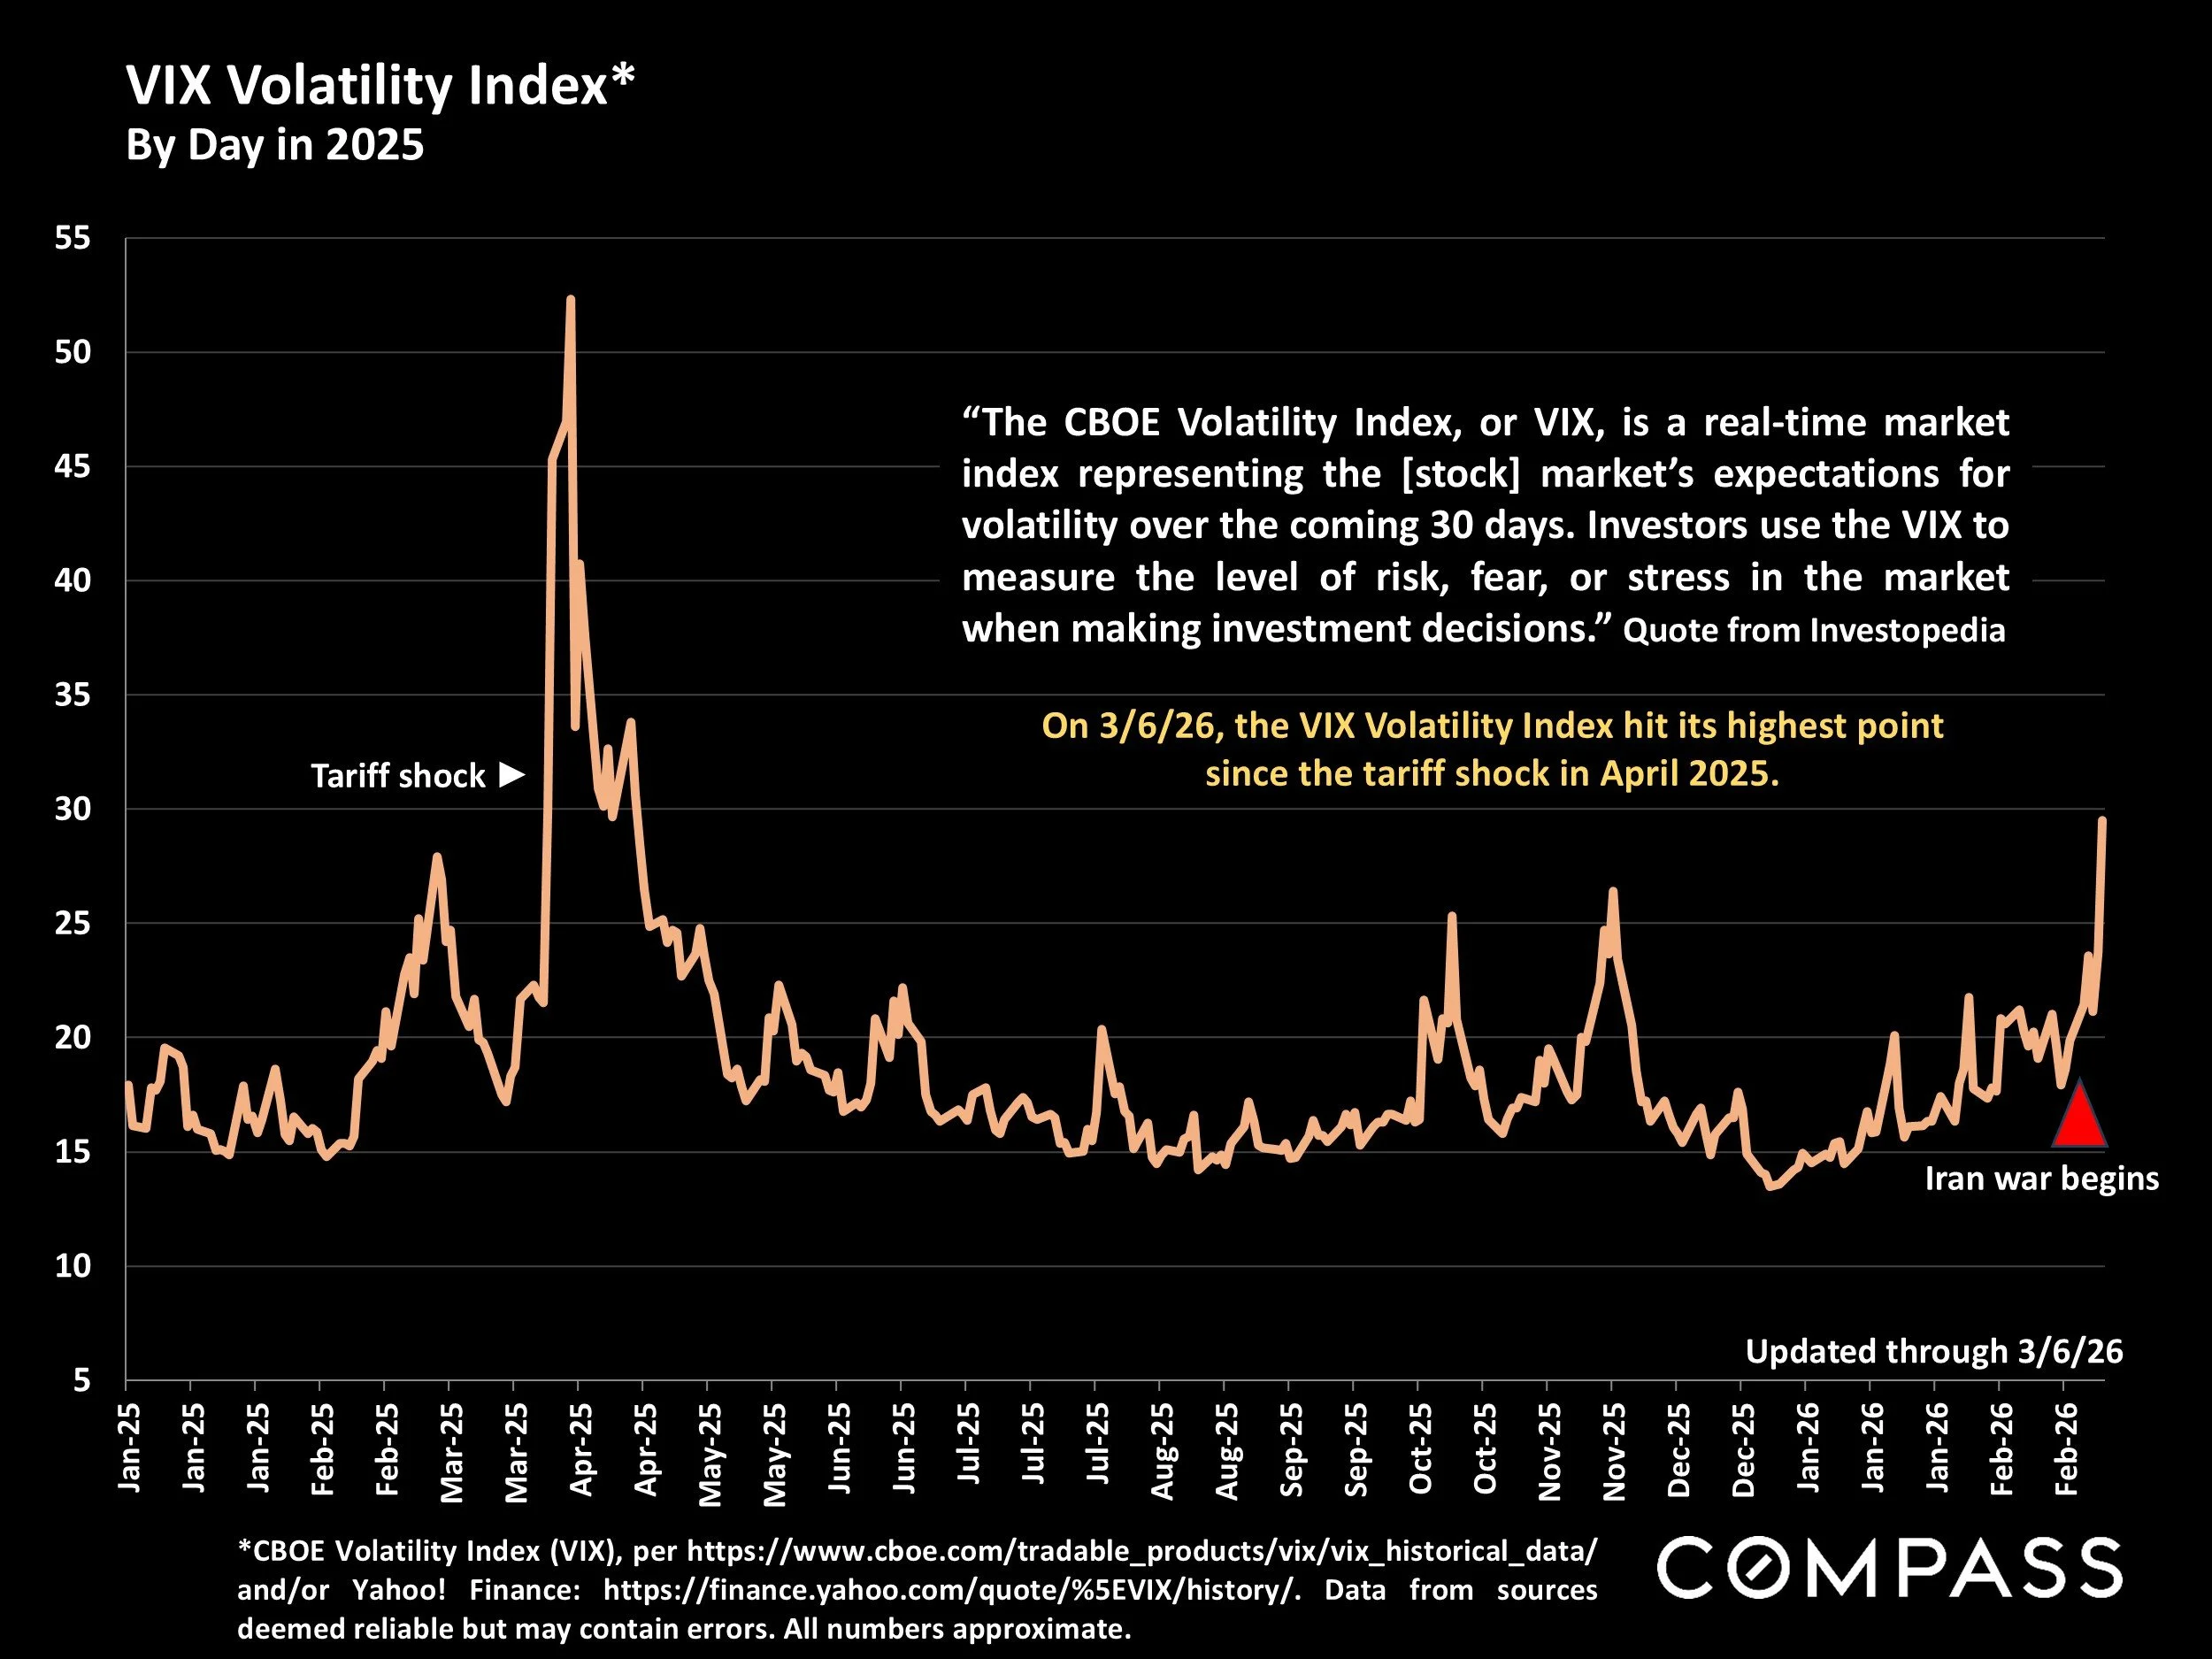
*CBOE Volatility Index (VIX), per https://www.cboe.com/tradable_products/vix/vix_historical_data/and/or Yahoo! Finance: https://finance.yahoo.com/quote/%5EVIX/history/. Data from sources deemed reliable but may contain errors. All numbers approximate.
“The CBOE Volatility Index, or VIX, is a real-time market index representing the [stock] market’s expectations for volatility over the coming 30 days. Investors use the VIX to measure the level of risk, fear, or stress in the market when making investment decisions.” Quote from Investopedia
On 3/6/26, the VIX Volatility Index hit its highest point since the tariff shock in April 2025.
S&P 500 Cyclically-Adjusted Price to Earnings (CAPE) Ratio*
By Month since January 1985
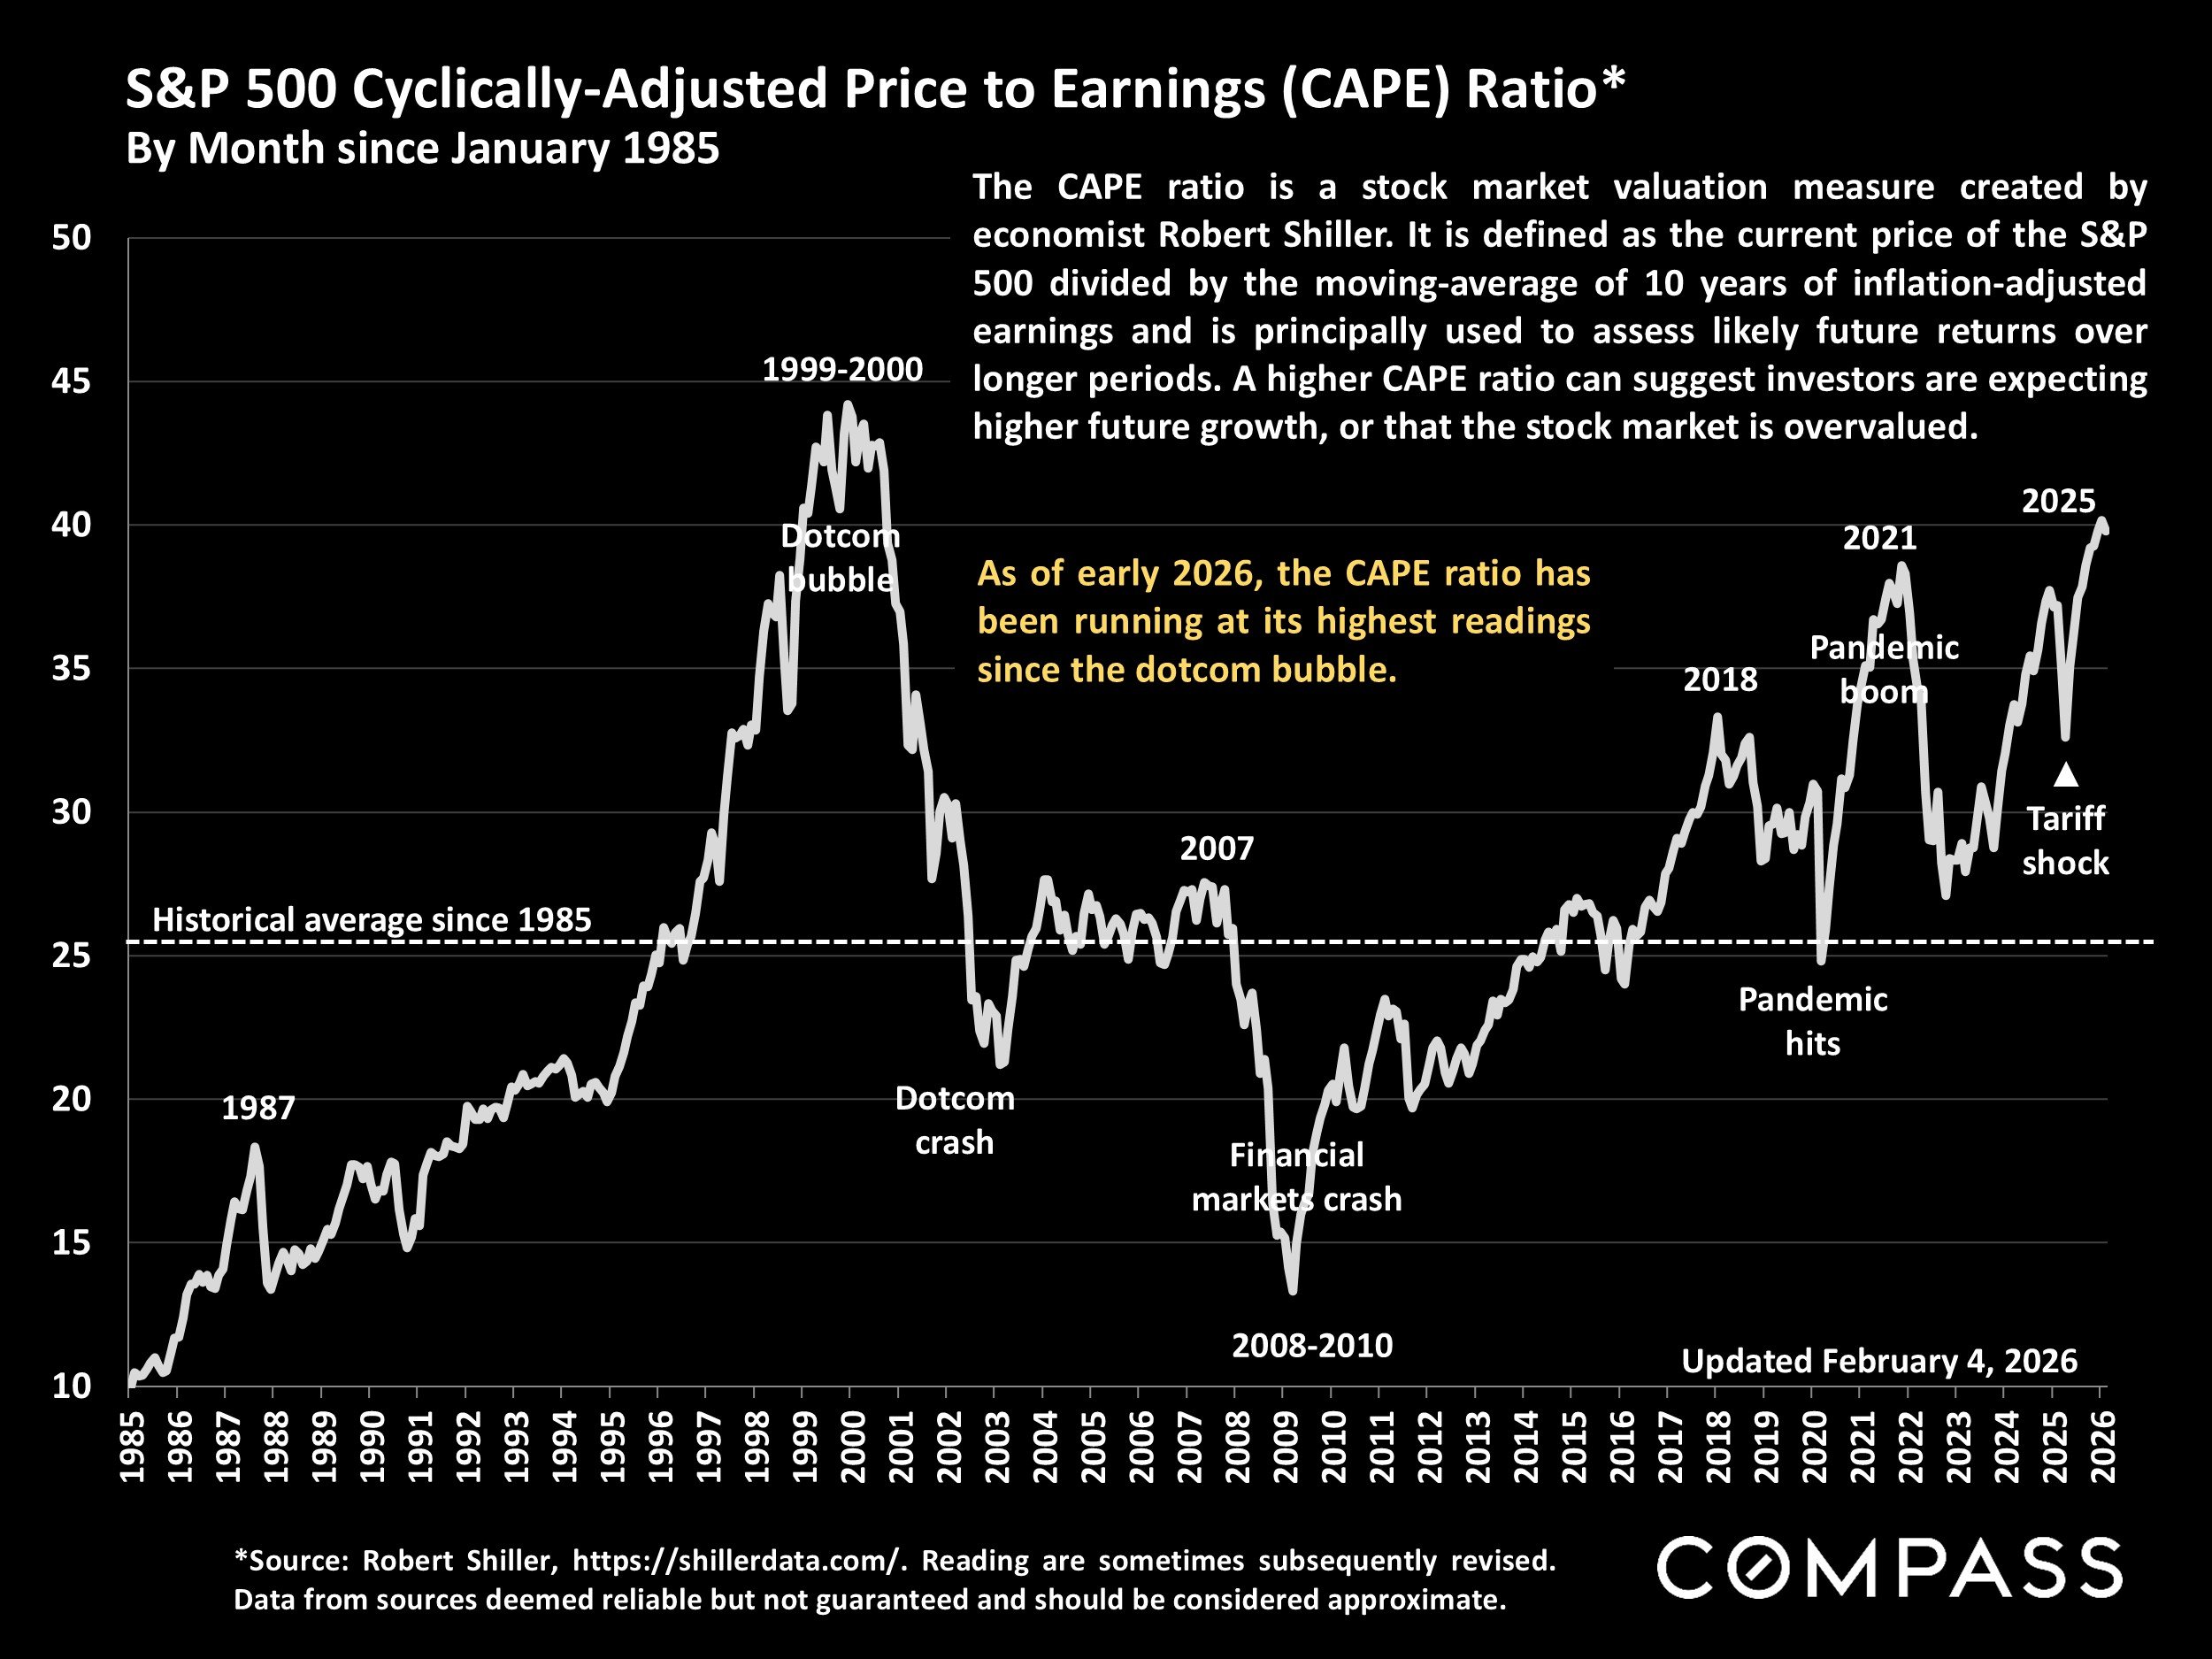
*Source: Robert Shiller, https://shillerdata.com/. Reading are sometimes subsequently revised. Data from sources deemed reliable but not guaranteed and should be considered approximate.
The CAPE ratio is a stock market valuation measure created by economist Robert Shiller. It is defined as the current price of the S&P 500 divided by the moving-average of 10 years of inflation-adjusted earnings and is principally used to assess likely future returns over longer periods. A higher CAPE ratio can suggest investors are expecting higher future growth, or that the stock market is overvalued.
As of early 2026, the CAPE ratio has been running at its highest readings since the dotcom bubble.
Economic Policy Uncertainty Index*
By Month since January 2000
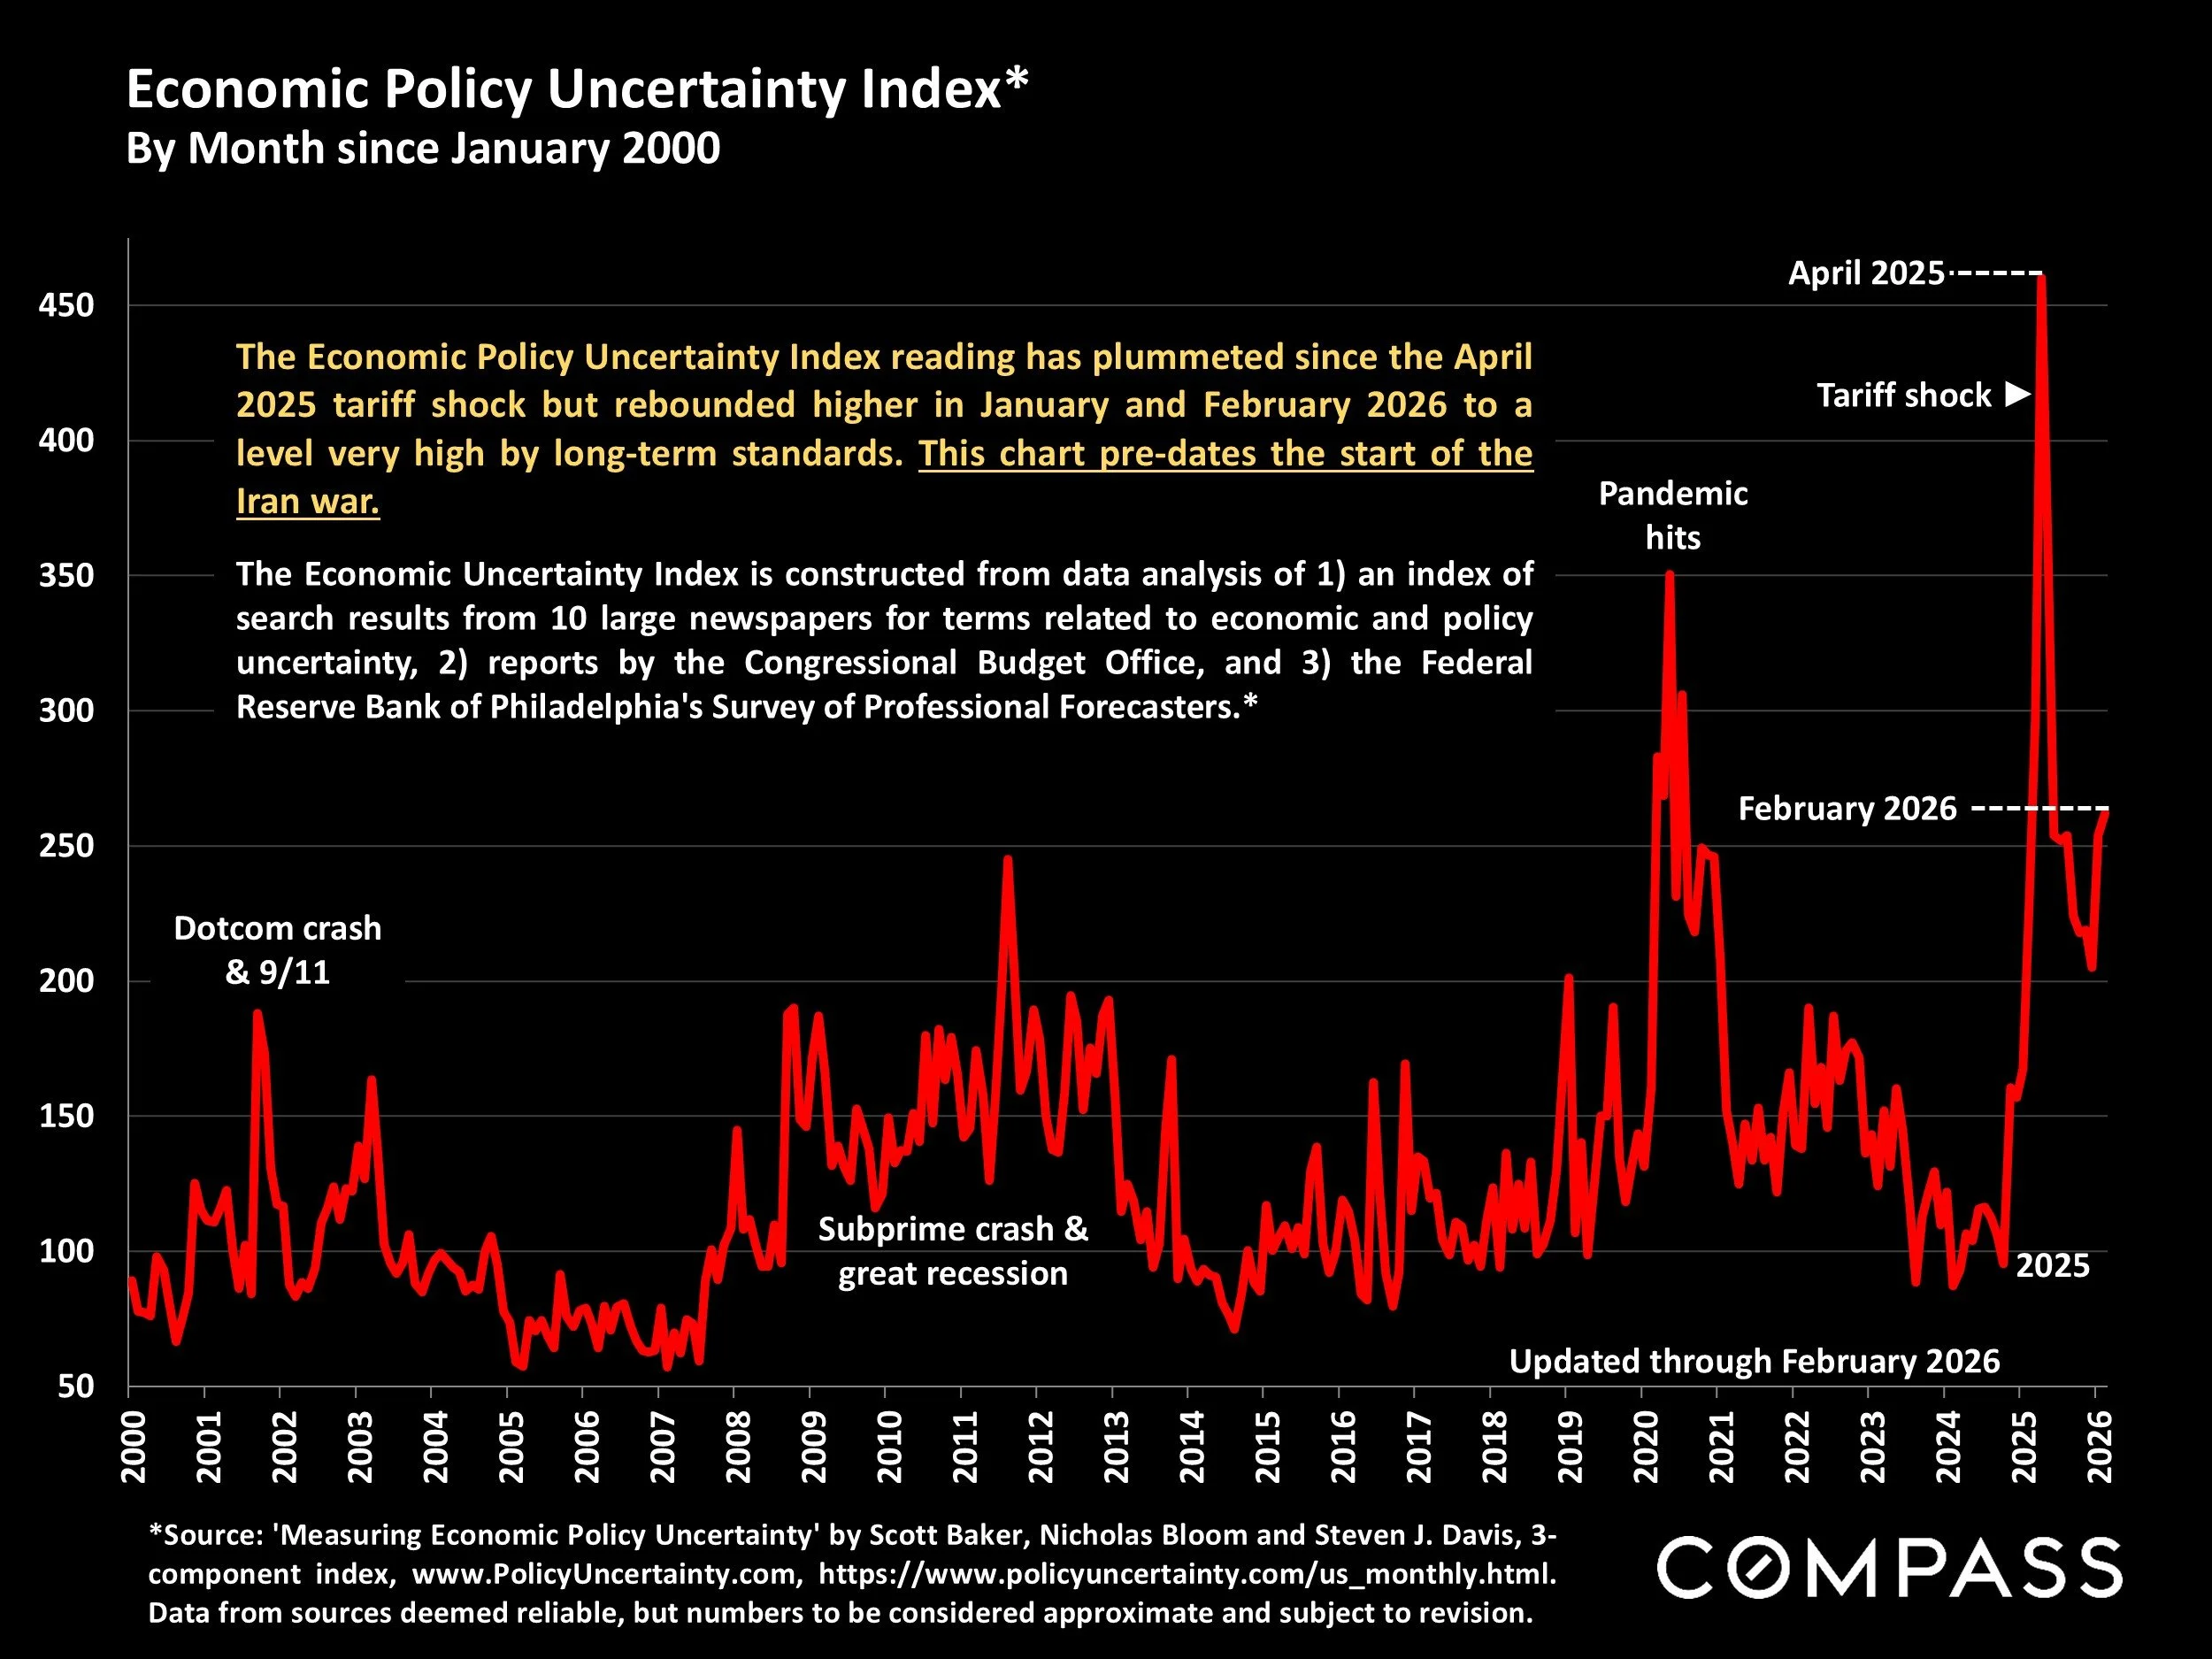
*Source: 'Measuring Economic Policy Uncertainty' by Scott Baker, Nicholas Bloom and Steven J. Davis, 3-component index, www.PolicyUncertainty.com, https://www.policyuncertainty.com/us_monthly.html. Data from sources deemed reliable, but numbers to be considered approximate and subject to revision.
The Economic Policy Uncertainty Index reading has plummeted since the April 2025 tariff shock but rebounded higher in January and February 2026 to a level very high by long-term standards. This chart pre-dates the start of the Iran war.
The Economic Uncertainty Index is constructed from data analysis of 1) an index of search results from 10 large newspapers for terms related to economic and policy uncertainty, 2) reports by the Congressional Budget Office, and 3) the Federal Reserve Bank of Philadelphia's Survey of Professional Forecasters.*
U.S. Jobs Report*
Monthly Change in Number of Jobs, in Thousands*
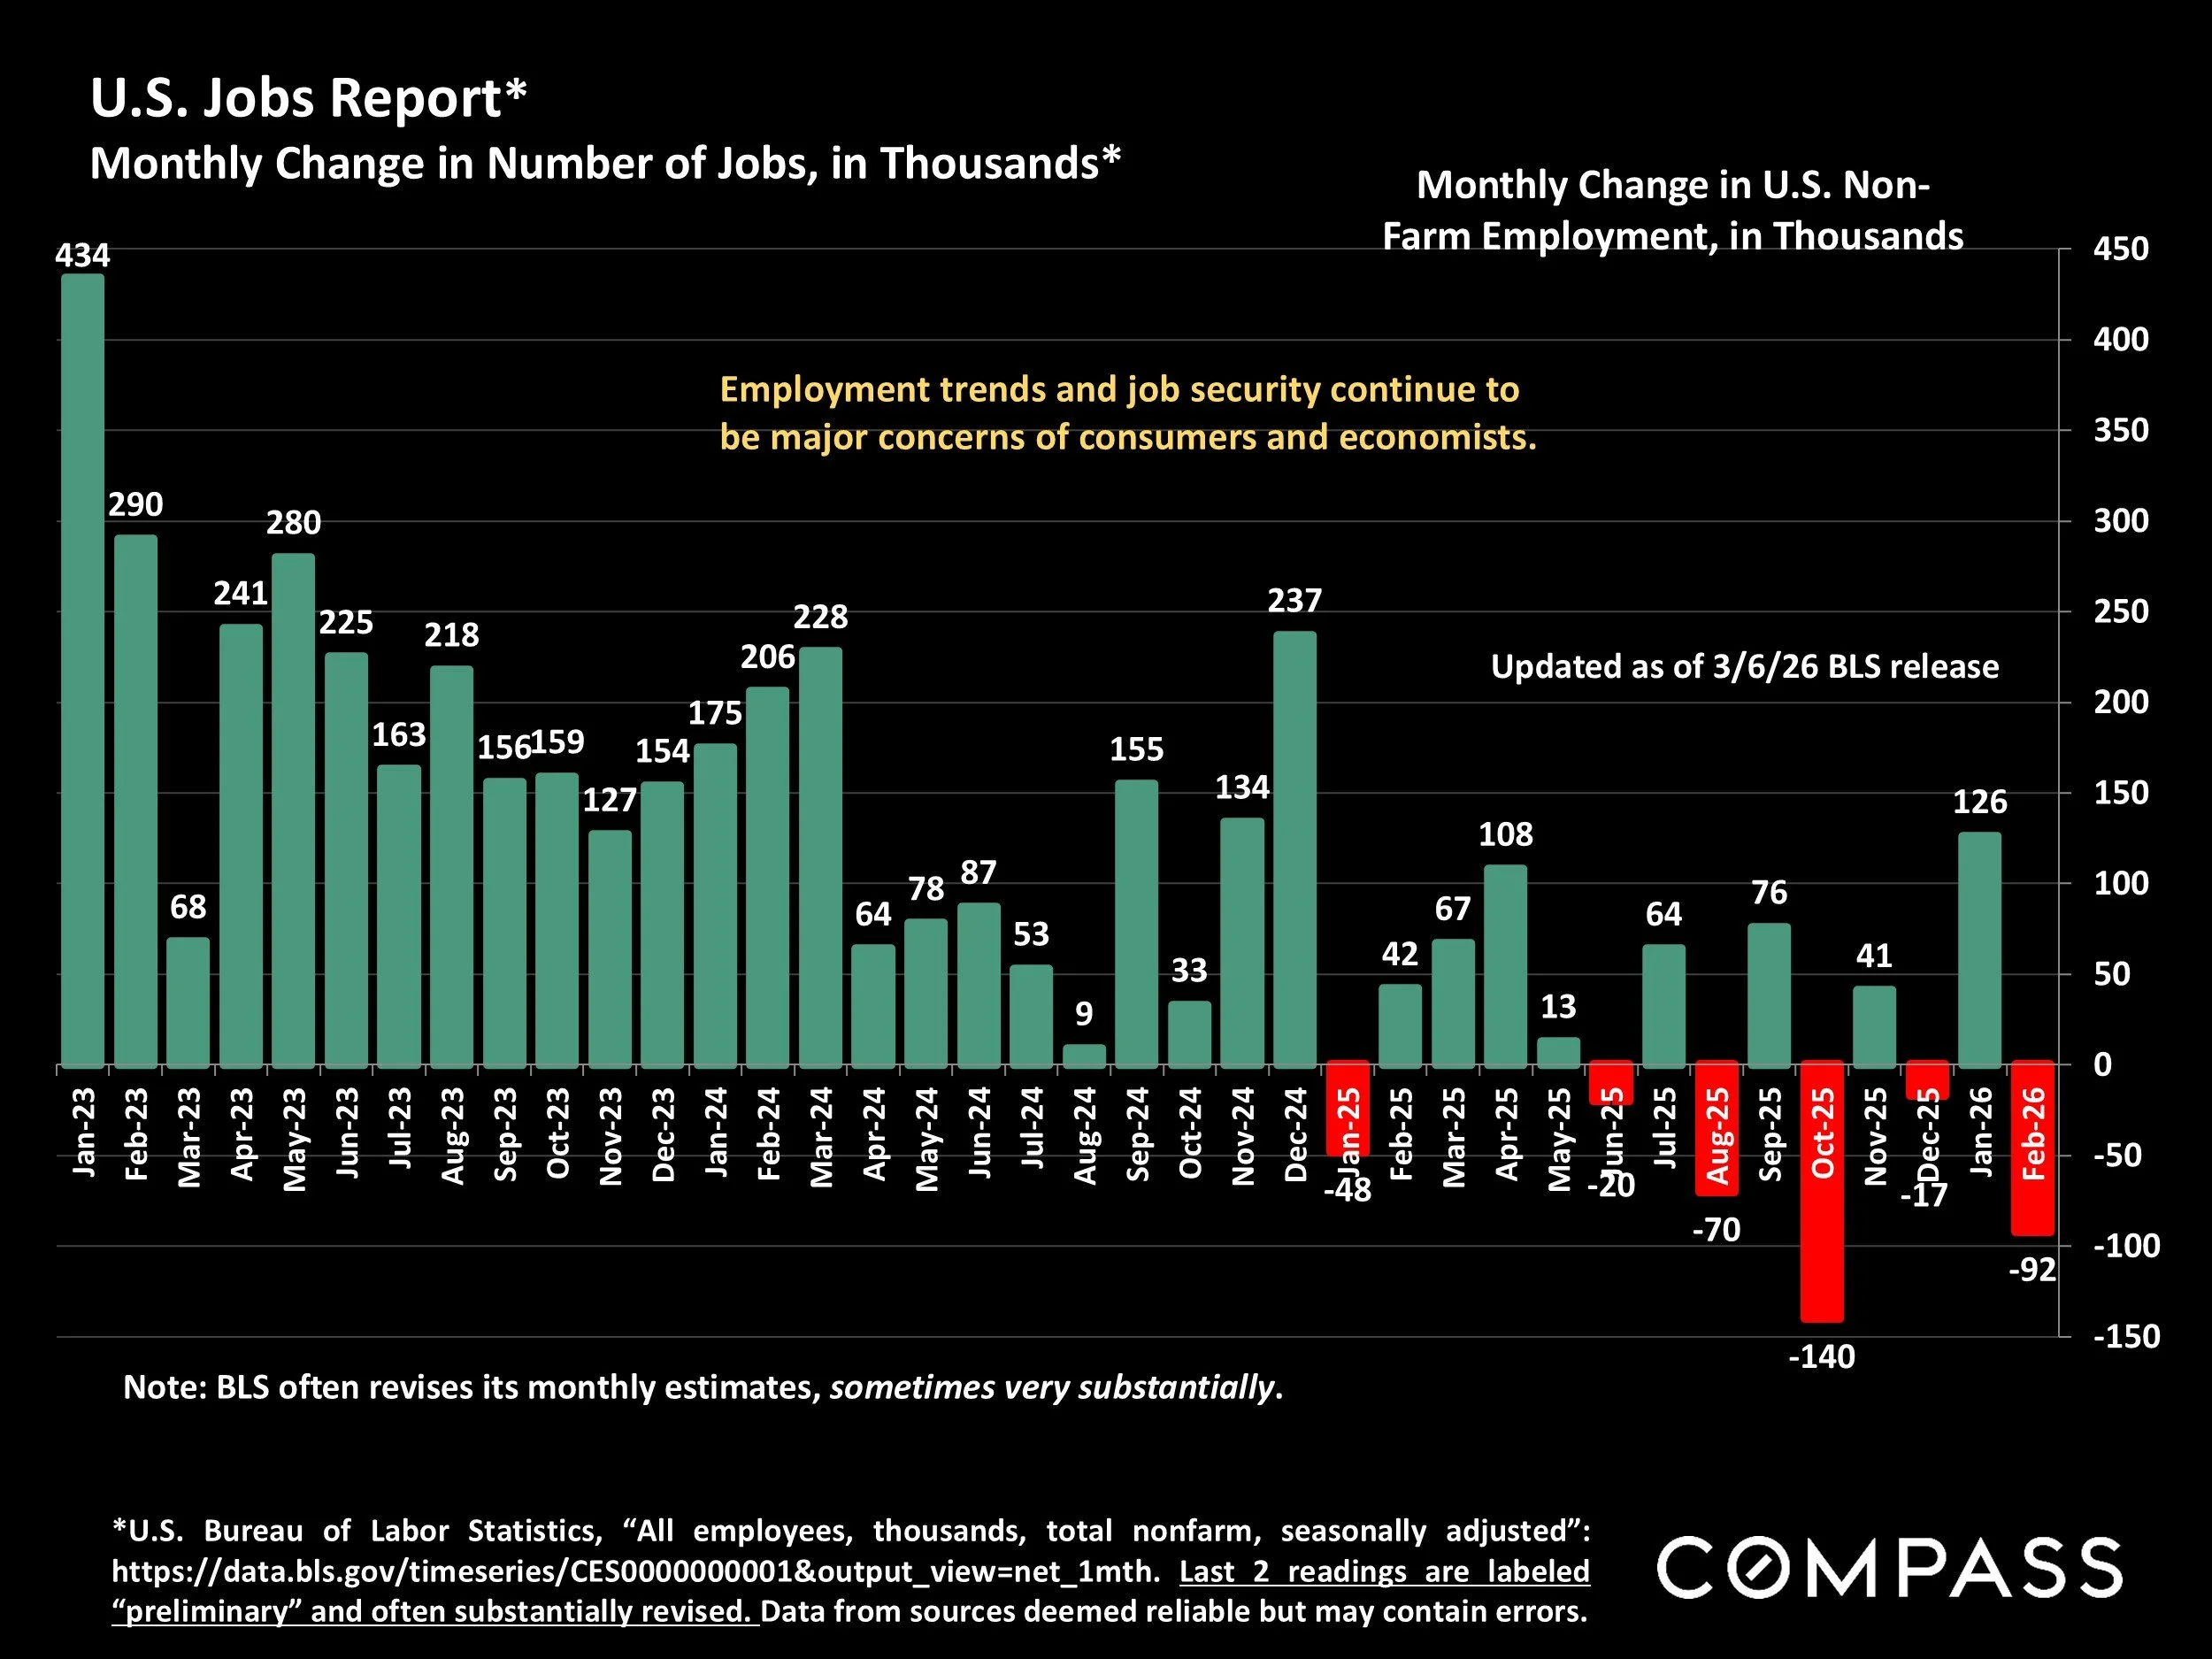
*U.S. Bureau of Labor Statistics, “All employees, thousands, total nonfarm, seasonally adjusted”: https://data.bls.gov/timeseries/CES0000000001&output_view=net_1mth. Last 2 readings are labeled “preliminary” and often substantially revised. Data from sources deemed reliable but may contain errors.
Employment trends and job security continue to be major concerns of consumers and economists.
Statistics are generalities, essentially summaries of widely disparate data generated by dozens, hundreds or thousands of unique, individual sales occurring within different time periods. They are best seen not as precise measurements, but as broad, comparative indicators, with reasonable margins of error. Anomalous fluctuations in statistics are not uncommon, especially in smaller, expensive market segments. Last period data should be considered estimates that may change with late-reported data. Different analytics programs sometimes define statistics – such as “active listings,” “days on market,” and “months supply of inventory” – differently: what is most meaningful are not specific calculations but the trends they illustrate. Most listing and sales data derives from the local or regional multi-listing service (MLS) of the area specified in the analysis, but not all listings or sales are reported to MLS and these won’t be reflected in the data. “Homes” signifies real-property, single-household housing units: houses, condos, co-ops, townhouses, duets and TICs (but not mobile homes), as applicable to each market. City/town names refer specifically to the named cities and towns, unless otherwise delineated. Multi-county metro areas will be specified as such. Data from sources deemed reliable, but may contain errors and subject to revision. All numbers to be considered approximate.
Many aspects of value cannot be adequately reflected in median and average statistics: curb appeal, age, condition, amenities, views, lot size, quality of outdoor space, “bonus” rooms, additional parking, quality of location within the neighborhood, and so on. How any of these statistics apply to any particular home is unknown without a specific comparative market analysis.
Median Sales Price is that price at which half the properties sold for more and half for less. It may be affected by seasonality, “unusual” events, or changes in inventory and buying trends, as well as by changes in fair market value. The median sales price for an area will often conceal an enormous variety of sales prices in the underlying individual sales.
Dollar per Square Foot is based upon the home’s interior living space and does not include garages, unfinished attics and basements, rooms built without permit, patios, decks or yards (though all those can add value to a home). These figures are usually derived from appraisals or tax records, but are sometimes unreliable (especially for older homes) or unreported altogether. The calculation can only be made on those home sales that reported square footage.
Compass is a real estate broker licensed by the State of California, DRE 01527235. Equal Housing Opportunity. This report has been prepared solely for information purposes. The information herein is based on or derived from information generally available to the public and/or from sources believed to be reliable. No representation or warranty can be given with respect to the accuracy or completeness of the information. Compass disclaims any and all liability relating to this report, including without limitation any express or implied representations or warranties for statements contained in, and omissions from, the report. Nothing contained herein is intended to be or should be read as any regulatory, legal, tax, accounting or other advice and Compass does not provide such advice. All opinions are subject to change without notice. Compass makes no representation regarding the accuracy of any statements regarding any references to the laws, statutes or regulations of any state are those of the author(s). Past performance is no guarantee of future results.