May 2024 Market Report

Photo by Edgar Chaparro on Unsplash
Highlights:
Home prices, sales volume, luxury sales, the number of new listings, and overbidding all increased as the market moved deeper into spring.
But not every listing sells; price reductions also rose in April. Preparing, pricing and marketing the home properly still matter.
This report also includes breakouts of home values and market conditions in neighborhoods & Realtor® districts within the city.
Inflation & interest rates: The general inflation reading for March – released in April – unexpectedly ticked up to 3.5%, significantly higher than the Fed’s goal of 2%. This caused mortgage interest rates to climb back above 7% – though remaining well below rates seen last fall. Speculation as to what the Fed may or may not do with its benchmark rate has been shifting for months from optimistic (will cut rates, perhaps several times in 2024) to pessimistic (won’t cut rates this year), back and forth, with the release of each new economic indicator. For the time being, the Fed has been standing pat, as it has since August. In any case, buyers and sellers seem to be taking the recent rise in interest rates in stride, and moving forward with life plans.
Report created in good faith with data from sources deemed reliable, but may contain errors and subject to revision. Last period figures may change with late-reported activity. All numbers to be considered approximate. Economic conditions can be subject to significant volatility, even over the short term.
San Francisco HOUSE Price Trends since 1990
Monthly Median House Sales Prices, 3-Month Rolling

3-month rolling average of monthly median sales prices for “existing” houses, per CA Association of Realtors or 3-month rolling median per NorCal MLS Alliance. Analysis may contain errors and subject to revision. All numbers approximate, and may change with late-reported sales.
Year-over-year, the 3-month-rolling San Francisco median house sales price in April 2024 was up 9.5%.
Median sales price is that price at which half the sales occurred for more and half for less. It is a very general statistic, disguising an enormous range of sales prices in the underlying sales. It is often affected by other factors besides changes in fair market value. Monthly and seasonal fluctuations are common, which explain many of the regular ups and downs in this chart. More often than not, median sales prices peak for the year in spring.
San Francisco: Year-over-Year (YOY) House Appreciation Rates
YOY Percentage Change in Quarterly Median HOUSE Sales Price*

*Per sales reported to NorCal MLS Alliance. Median sales prices can be affected by a variety of factors other than changes in fair market value. Data from sources deemed reliable, but may contain errors and subject to revision. Percentages rounded. All numbers approximate, and may change with late-reported sales. Different sources of data sometimes calculate median sales prices slightly differently.
After interest rates surged, negative YOY appreciation rates became common in the Bay Area. However, YOY sppreciation rebounded in Q124.
Comparing the quarterly median house sales price with the same quarter of the previous year to calculate the percentage change. Appreciation is typically calculated year-over-year to adjust for the effects of market seasonality on home prices. Quarterly YOY appreciation percentages cannot be totaled to calculate cumulative changes over time.
San Francisco CONDO Price Trends since 2005
Median Condo Sales Price, 3-Month Rolling

3-month rolling median condo sales prices reported to NorCal MLS Alliance, per Infosparks. Analysis may contain errors and subject to revision. All numbers approximate, and may change with late-reported sales.
Median sales price is that price at which half the sales occurred for more and half for less. It is a very general statistic, often affected by other factors besides changes in fair market value. Monthly and seasonal fluctuations are common, and longer-term trends are more meaningful than short-term changes.
San Francisco CONDO Prices: Downtown vs. Non-Downtown
3-Month-Rolling, Median Condo Sales Prices since 2005*

*6-month rolling median condo sales values reported to NorCal MLS Alliance, per Infosparks. Analysis may contain errors and subject to revision. Does not include new-project sales unreported to MLS. All numbers approximate, and may change with late-reported sales.
Comparing median condo sales prices in the greater Downtown/South of Market/Civic Center area (the center of large-project, new-condo construction, office buildings and high-tech employment) – delineated by the orange line – with the rest of San Francisco (mostly smaller, older buildings, in less urban environments) – delineated by the white line.
San Francisco Value Trends since 2005
3-Month Rolling, Median Dollar per Square Foot Values*
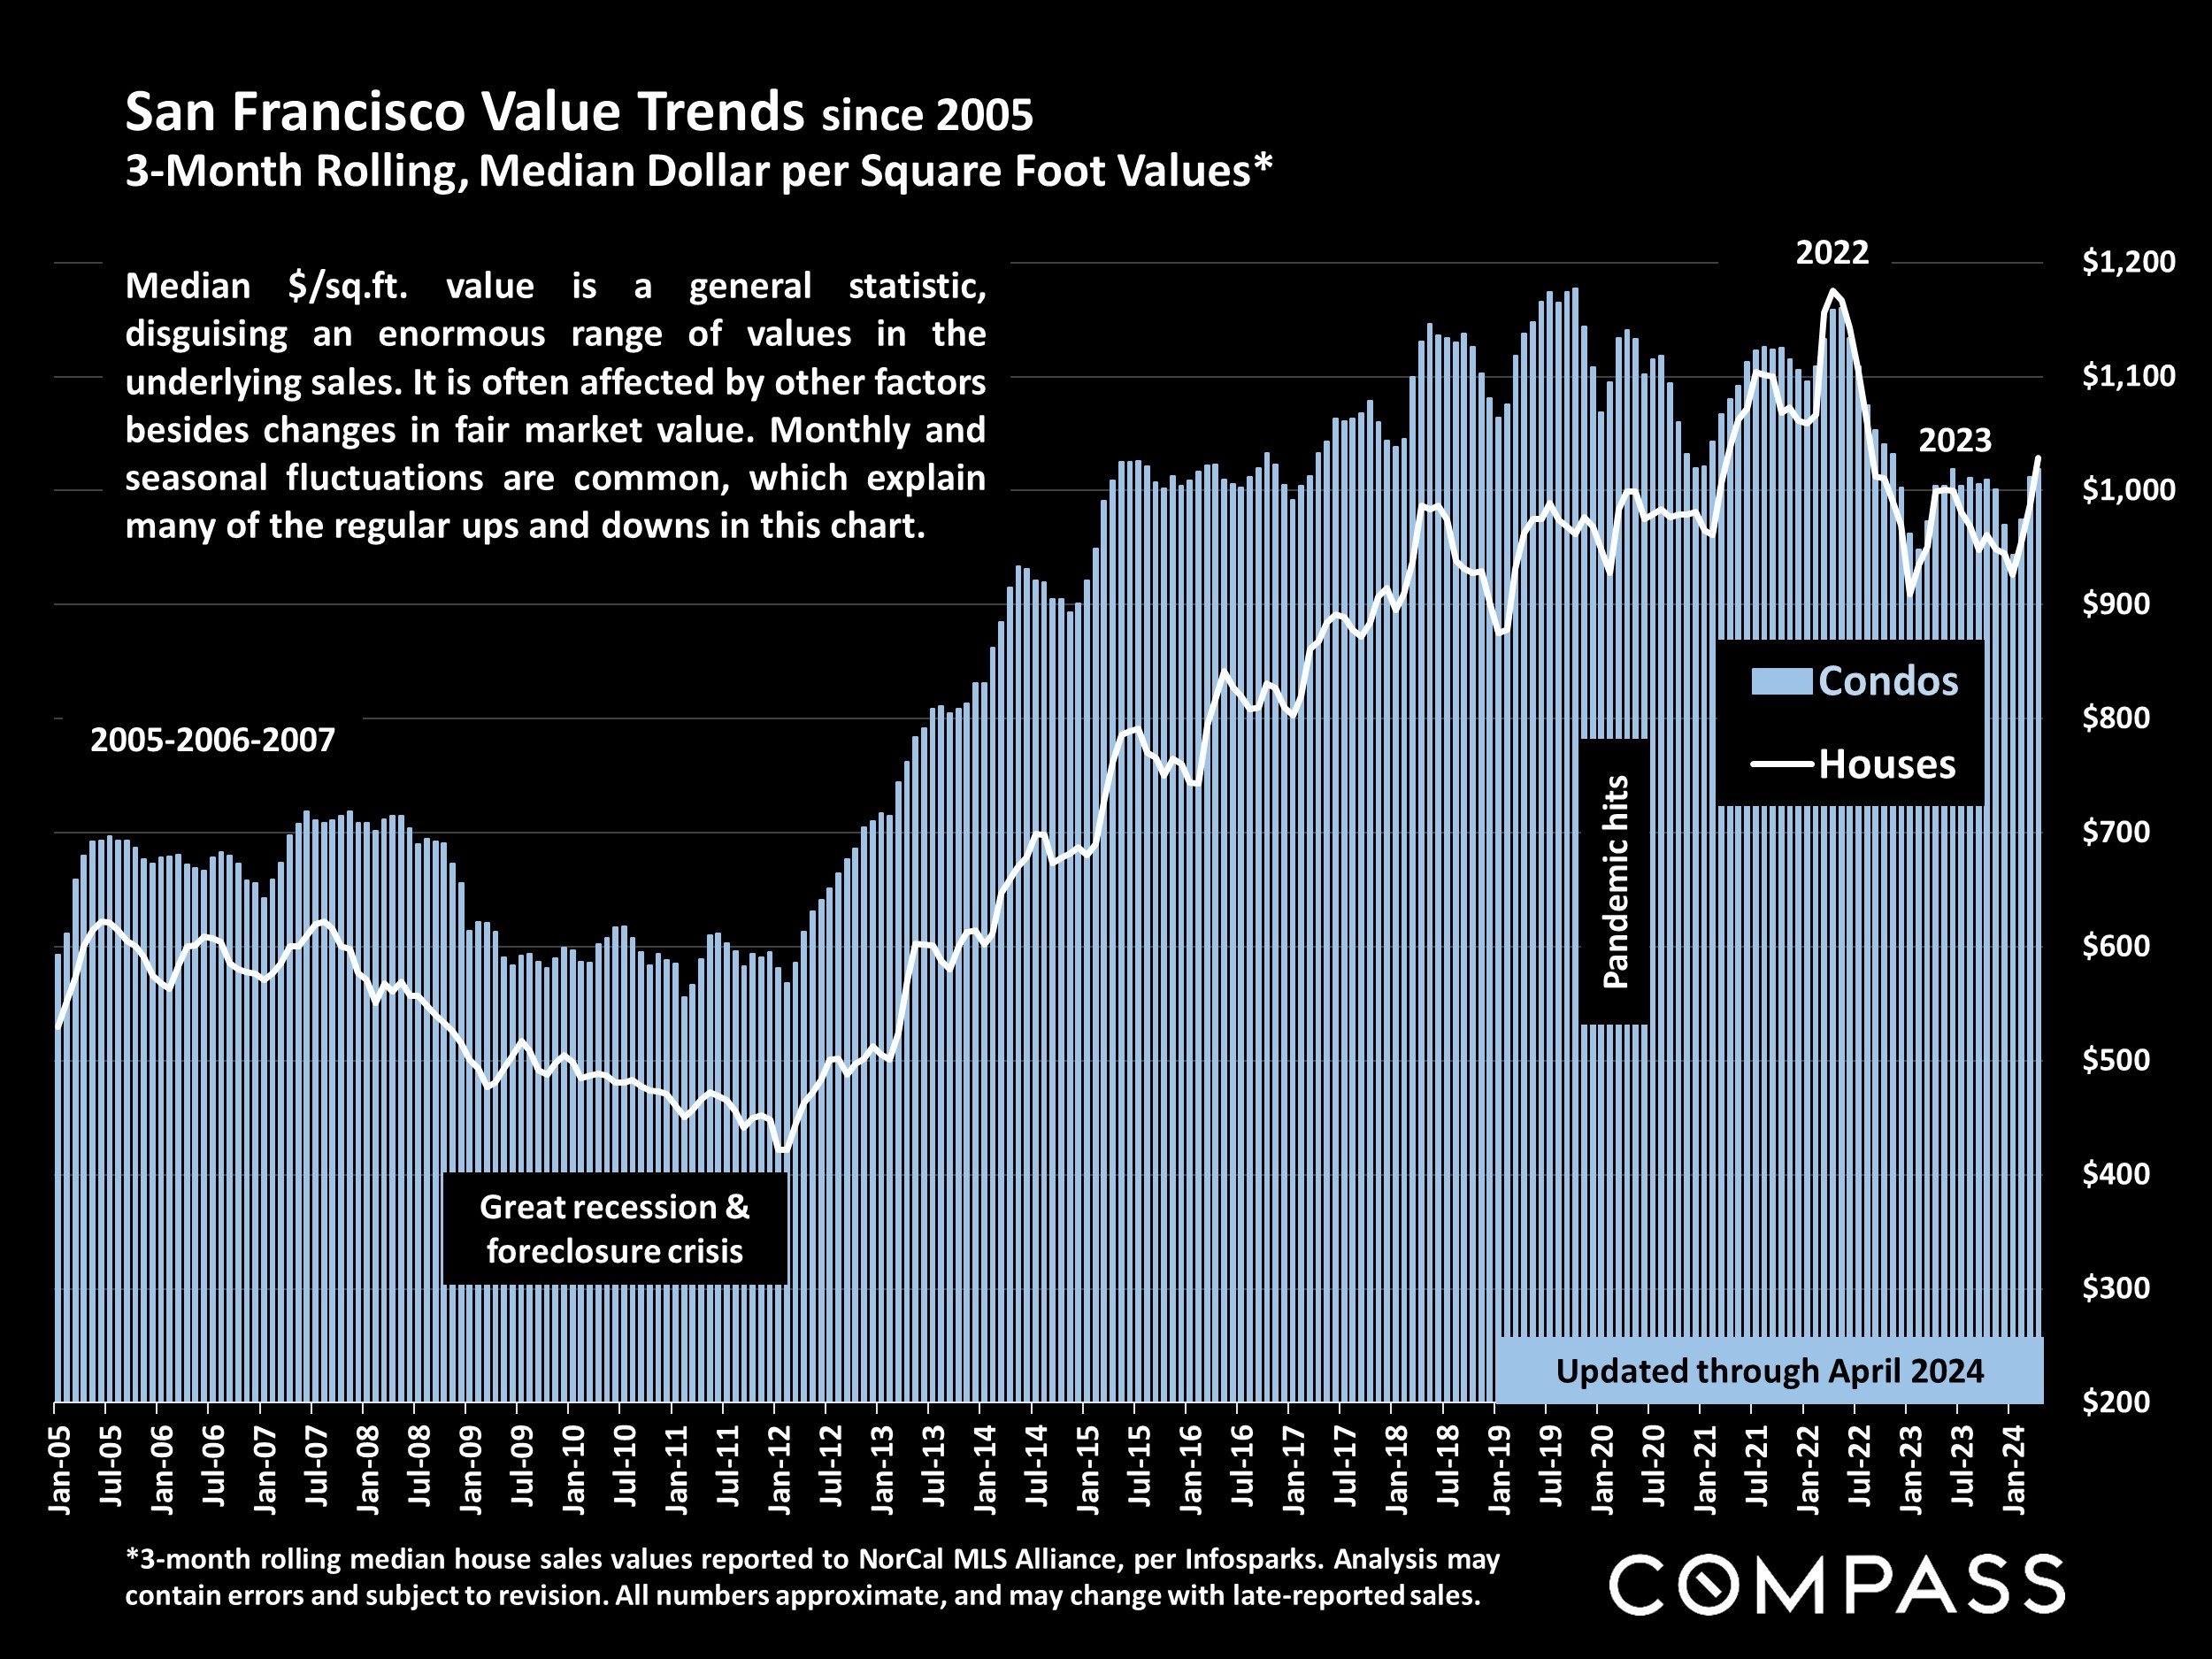
*3-month rolling median house sales values reported to NorCal MLS Alliance, per Infosparks. Analysis may contain errors and subject to revision. All numbers approximate, and may change with late-reported sales.
Median $/sq.ft. value is a general statistic, disguising an enormous range of values in the underlying sales. It is often affected by other factors besides changes in fair market value. Monthly and seasonal fluctuations are common, which explain many of the regular ups and downs in this chart.
New Listings Coming on Market
San Francisco Market Dynamics & Seasonality

Per Realtor.com Research: https://www.realtor.com/research/data/, listings posted on site. Data from sources deemed reliable, but may contain errors and subject to revision. May not include “coming-soon” listings. All numbers should be considered approximate.
The number of new listings in April 2024 rose 18% from March, and 30% year over year. However, this is still comparatively low to historical averages.
Active & Coming-Soon Listings on 1st of Month*
San Francisco Homes Market

* Houses, condos, co-ops, TICs, townhouses: Active/Coming-Soon listings posted to NorCal MLS Alliance. Does not include new-project condos not listed on MLS. Data from sources deemed reliable, but may contain errors and subject to revision. All numbers approximate. The # of active listings changes constantly.
Of the listings for sale on May 1, 2024, 26% were houses, and 74% were condos, co-ops, TICs & townhouses.*
The # of active listings on a given day is affected by 1) the # of new listings coming on market, 2) how quickly buyers put them into contract, 3) the sustained heat of the market over time, and 4) sellers pulling their homes off the market without selling.
Listings Accepting Offers (Going into Contract)
San Francisco Market Dynamics & Seasonality

Residential activity reported to MLS, per Broker Metrics. Data from sources deemed reliable, but may contain errors and subject to revision. All numbers approximate, and may change with late-reported activity.
The March and April 2024 numbers of listings going into contract (pending sale) were the highest since mid-2022.
The # of listings going into contract measures buyer demand, but is also deeply impacted by the supply of new listings available to buy.
Monthly Home Sales Volume
San Francisco Market Dynamics & Seasonality

Sales of houses, condos, townhouses reported to NorCal MLS Alliance, per Infosparks. Data from sources deemed reliable but may contain errors and subject to revision. Last month estimated based on available information and may change with late reported sales. All numbers approximate.
The number of sales in April 2024 surged to its highest monthly count since mid-2022, and was up 22% year over year.
Sales in one month mostly reflect accepted offers in the previous month.
San Francisco Luxury Home Sales*
Homes Selling for $5 Million+

*Houses, condos, co-ops, townhouses, TICs: Sales reported to NorCal MLS Alliance, per Infosparks. Does not include sales unreported to MLS. Data from sources deemed reliable but may contain errors and subject to revision. All numbers approximate, and may change with late-reported activity.
In April 2024, the number of $5 million+ home sales hit the highest monthly count since spring 2022.
The number of luxury home sales typically ebbs and flows dramatically by season, with spring and fall usually the biggest selling seasons.
Median HOUSE Sales Prices – Selected Neighborhoods*
San Francisco House Prices

12 months sales reported to NorCal MLS Alliance through late April 2024. Data from sources deemed reliable, but may contain errors and subject to revision. All numbers are approximate.
Median sales price is that price at which half the sales occurred for more and half for less. It is a very general measurement of value that disguises a wide range of prices in the underlying sales, and how it applies to any particular home is unknown without a specific comparative market analysis.
This is a sampling of values across some of San Francisco’s 70+ neighborhoods. Presidio Heights typically sees the highest median house sales prices in the city.
Many factors affect home values: architectural style, quality of construction, size, condition, amenities, light, views, privacy, outdoor space,“bonus” rooms, additional parking, quality of location within the neighborhood, and so on.
Median HOUSE $/Sq.Ft. Values – Selected Neighborhoods*

12 months sales reported to NorCal MLS Alliance through late April 2024. Data from sources deemed reliable, but may contain errors and subject to revision. All numbers are approximate.
Median value is a very general measurement, and how it applies to any particular home is unknown without a specific comparative market analysis. All things being equal, a smaller home will typically sell for a higher $/sq.ft. value.
The calculation of dollar per square foot is based on interior living space and doesn’t include garages, attics, basements, rooms built without permit, decks, patios or lot size (though all these can add value to the home).
This is a sampling of values across some of San Francisco’s 70+ neighborhoods.
San Francisco Median House Sizes
Median HOUSE Square Footage – Selected Neighborhoods*

12 months sales reported to NorCal MLS Alliance through late April 2024. Median home sizes can vary widely between time periods. Within neighborhoods home sizes vary enormously. Data from sources deemed reliable, but may contain errors and subject to revision. All numbers are approximate.
Comparing median sales prices between neighborhoods is not apples to apples, since the median sizes of homes (and other characteristics) vary so widely. Generally speaking, the most expensive neighborhoods have both the largest homes and the highestdollar per square foot values.
Square footage is based upon interior living space and doesn’t include garages, attics, basements, rooms built without permit, decks, patios or lot size.
Median CONDO Sales Prices – Selected Neighborhoods*

12 months sales reported to NorCal MLS Alliance through late April 2024. Data from sources deemed reliable, but may contain errors and subject to revision. All numbers are approximate.
Median sales price is that price at which half the sales occurred for more and half for less. Many factors affect condo prices: size, architectural style, views, age, quality of construction, the floor the unit is on, condition, HOA amenities, deeded outdoor space, parking, and so on.
Median CONDO $/Sq.Ft. Values – Selected Neighborhoods*

12 months sales reported to NorCal MLS Alliance through late April 2024. Data from sources deemed reliable, but may contain errors and subject to revision. All numbers are approximate.
The calculation of dollar per square foot is based on interior living space and doesn’t include common areas, parking spaces, rooms built without permit, storage rooms, decks or patios. All things being equal, a smaller unit will typically sell for a higher dollar per square foot value.
Median CONDO Square Footage – Selected Neighborhoods*

12 months sales reported to NorCal MLS Alliance through late April 2024. Data from sources deemed reliable, but may contain errors and subject to revision. All numbers are approximate.
Comparing median sales prices between neighborhoods is not apples to apples, since the median sizes of units (as well as many other characteristics) vary so widely.
Average Days on Market – Speed of Sale
San Francisco Market Dynamics & Seasonality

Sales reported to NorCal MLS Alliance, per Infosparks. Data derived from sources deemed reliable, but may contain errors and subject to revision. All numbers approximate, and may change with late-reported sales.
Houses (green line) continue to sell significantly faster than condos (blue line).
Overbidding List Prices in San Francisco
Percentage of Home Sales Closing over List Price
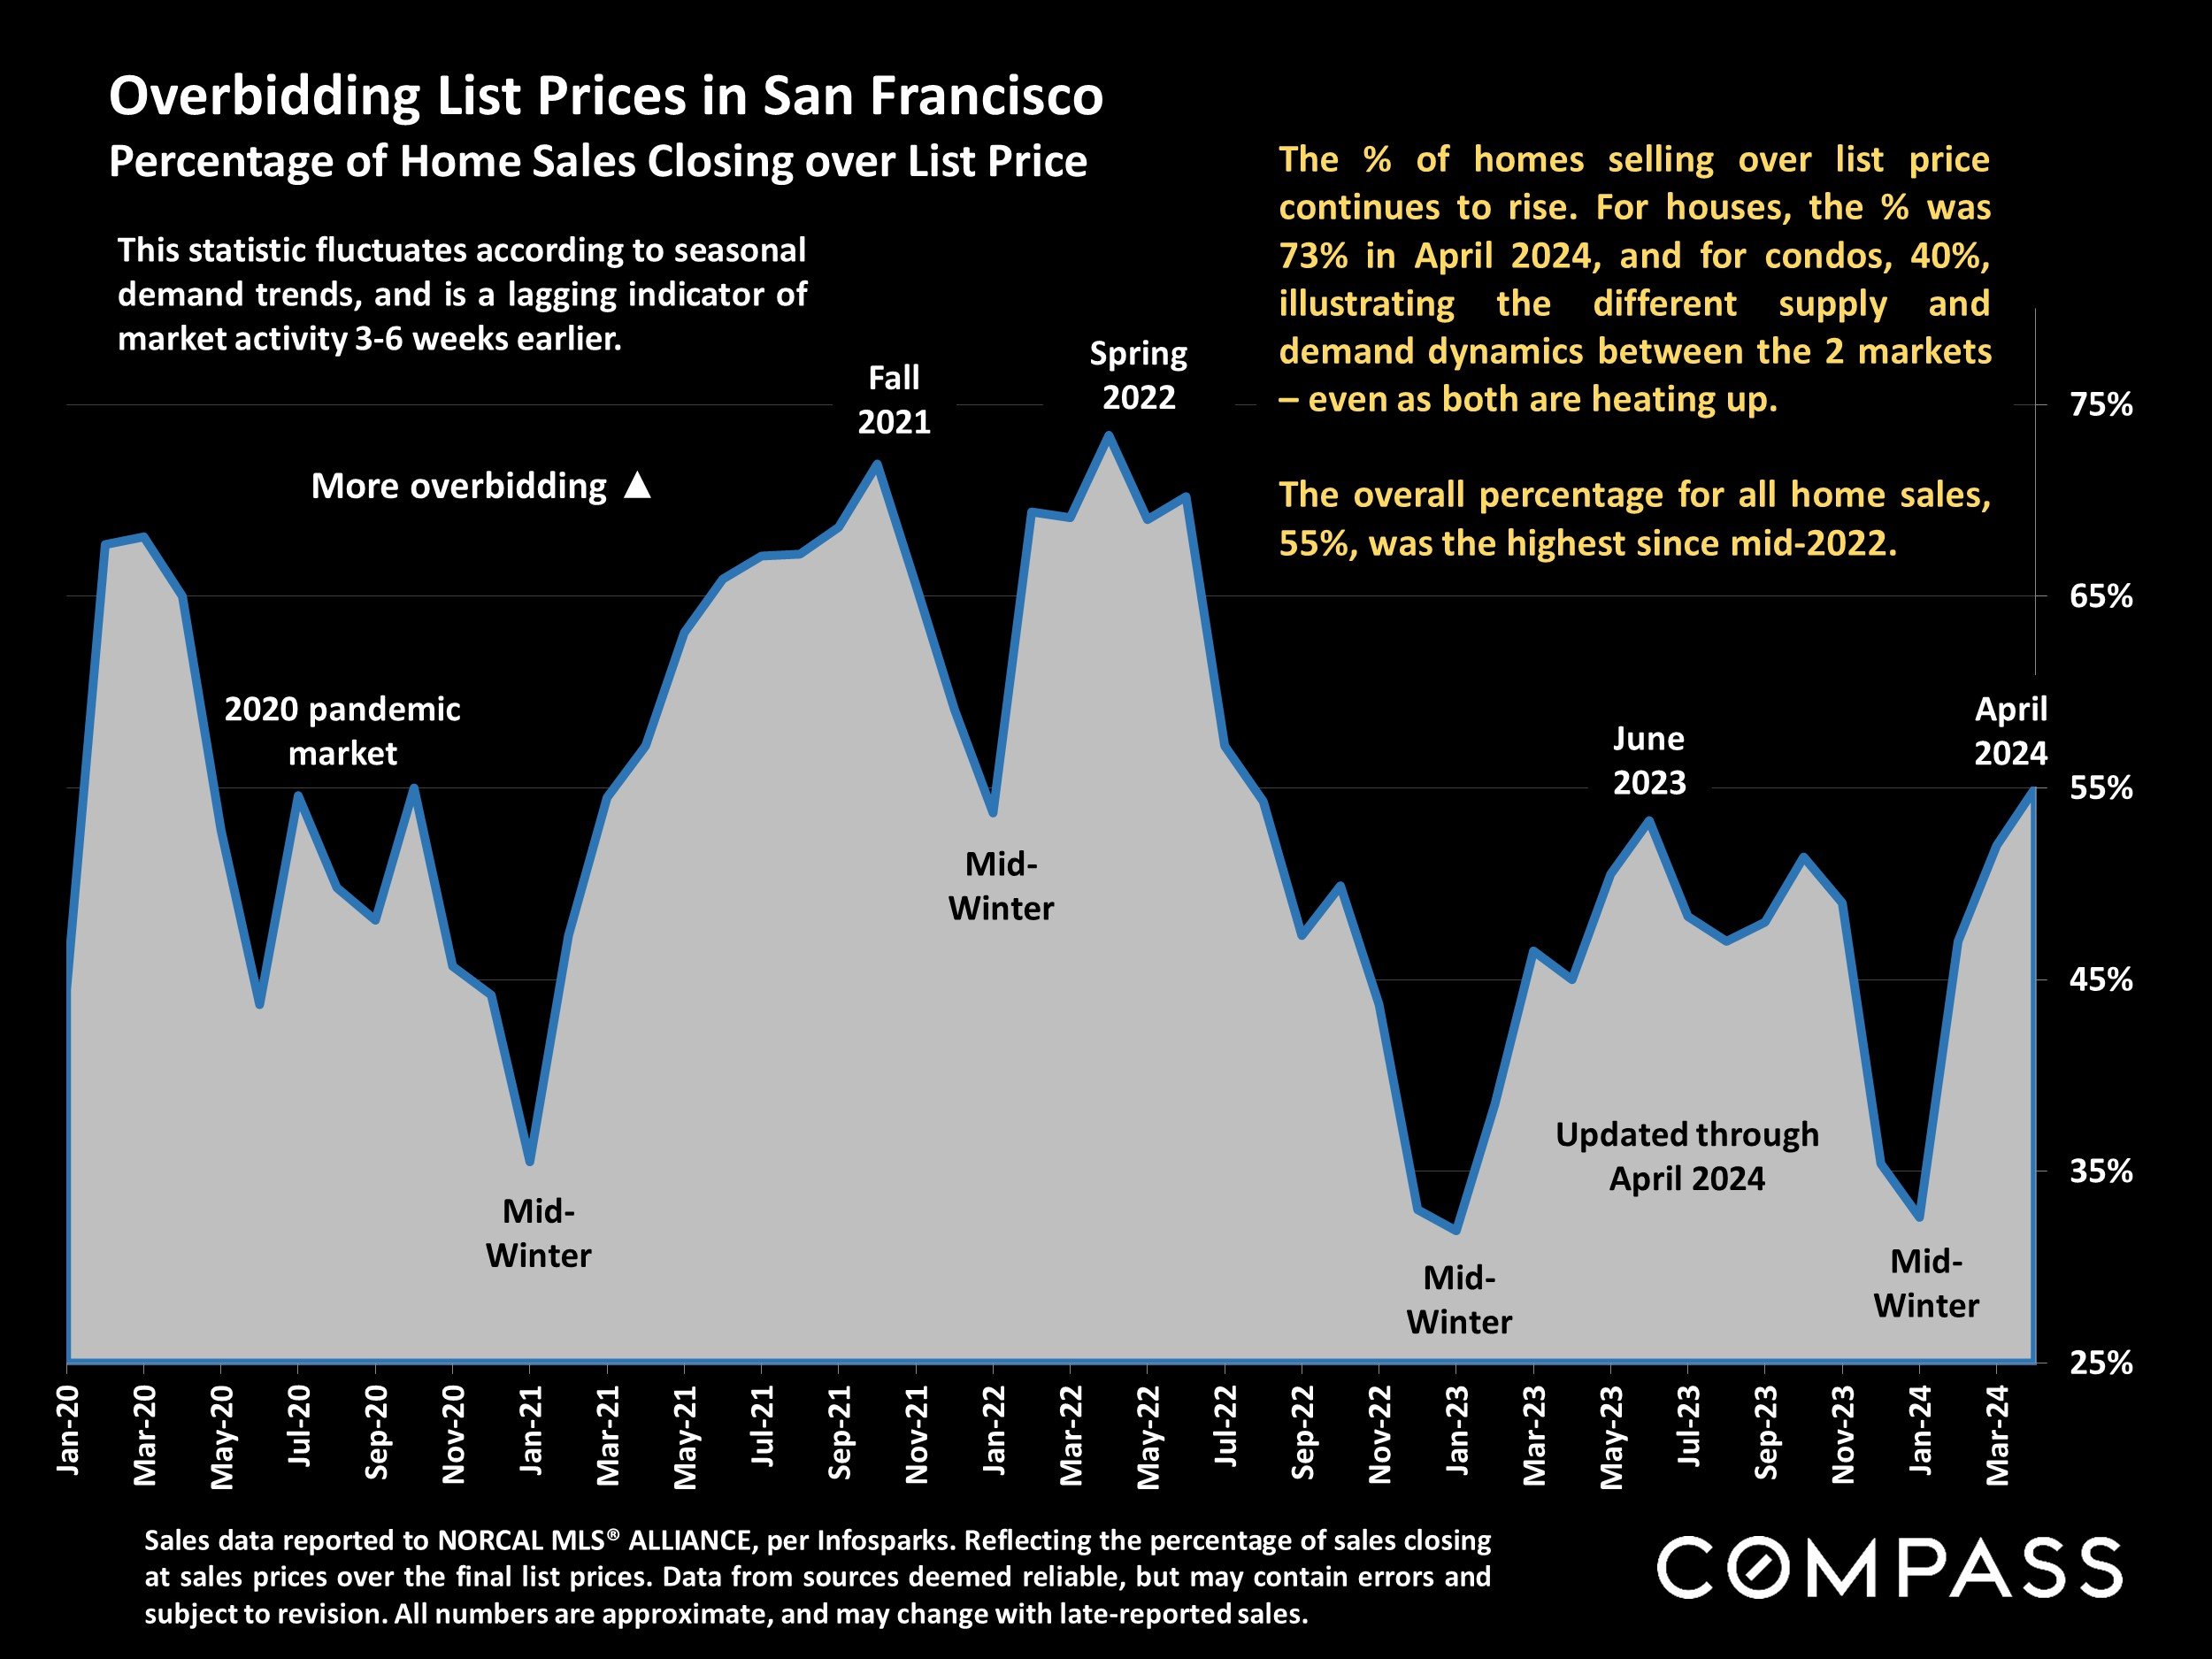
Sales data reported to NORCAL MLS® ALLIANCE, per Infosparks. Reflecting the percentage of sales closing at sales prices over the final list prices. Data from sources deemed reliable, but may contain errors and subject to revision. All numbers are approximate, and may change with late-reported sales.
The % of homes selling over list price continues to rise. For houses, the % was 73% in April 2024, and for condos, 40%, illustrating the different supply and demand dynamics between the 2 markets – even as both are heating up.
The overall percentage for all home sales, 55%, was the highest since mid-2022.
This statistic fluctuates according to seasonal demand trends, and is a lagging indicator of market activity 3-6 weeks earlier.
Average Sales Price to Original List Price Percentage
San Francisco Over/Under Bidding: Market Dynamics & Seasonality

Sales reported to NorCal MLS Alliance, per Infosparks. Data derived from sources deemed reliable, but may contain errors and subject to revision. All numbers approximate, and may change with late-reported sales.
Overbidding has been much more common in house sales than condo sales.
House sales (yellow line) averaged a sales price 12.5% over asking price in April 2024, while condos (orange line) averaged a sale at asking price. Both were the highest percentages since mid-2022.
Price Reductions on Active Listings
San Francisco Market Dynamics & Seasonality
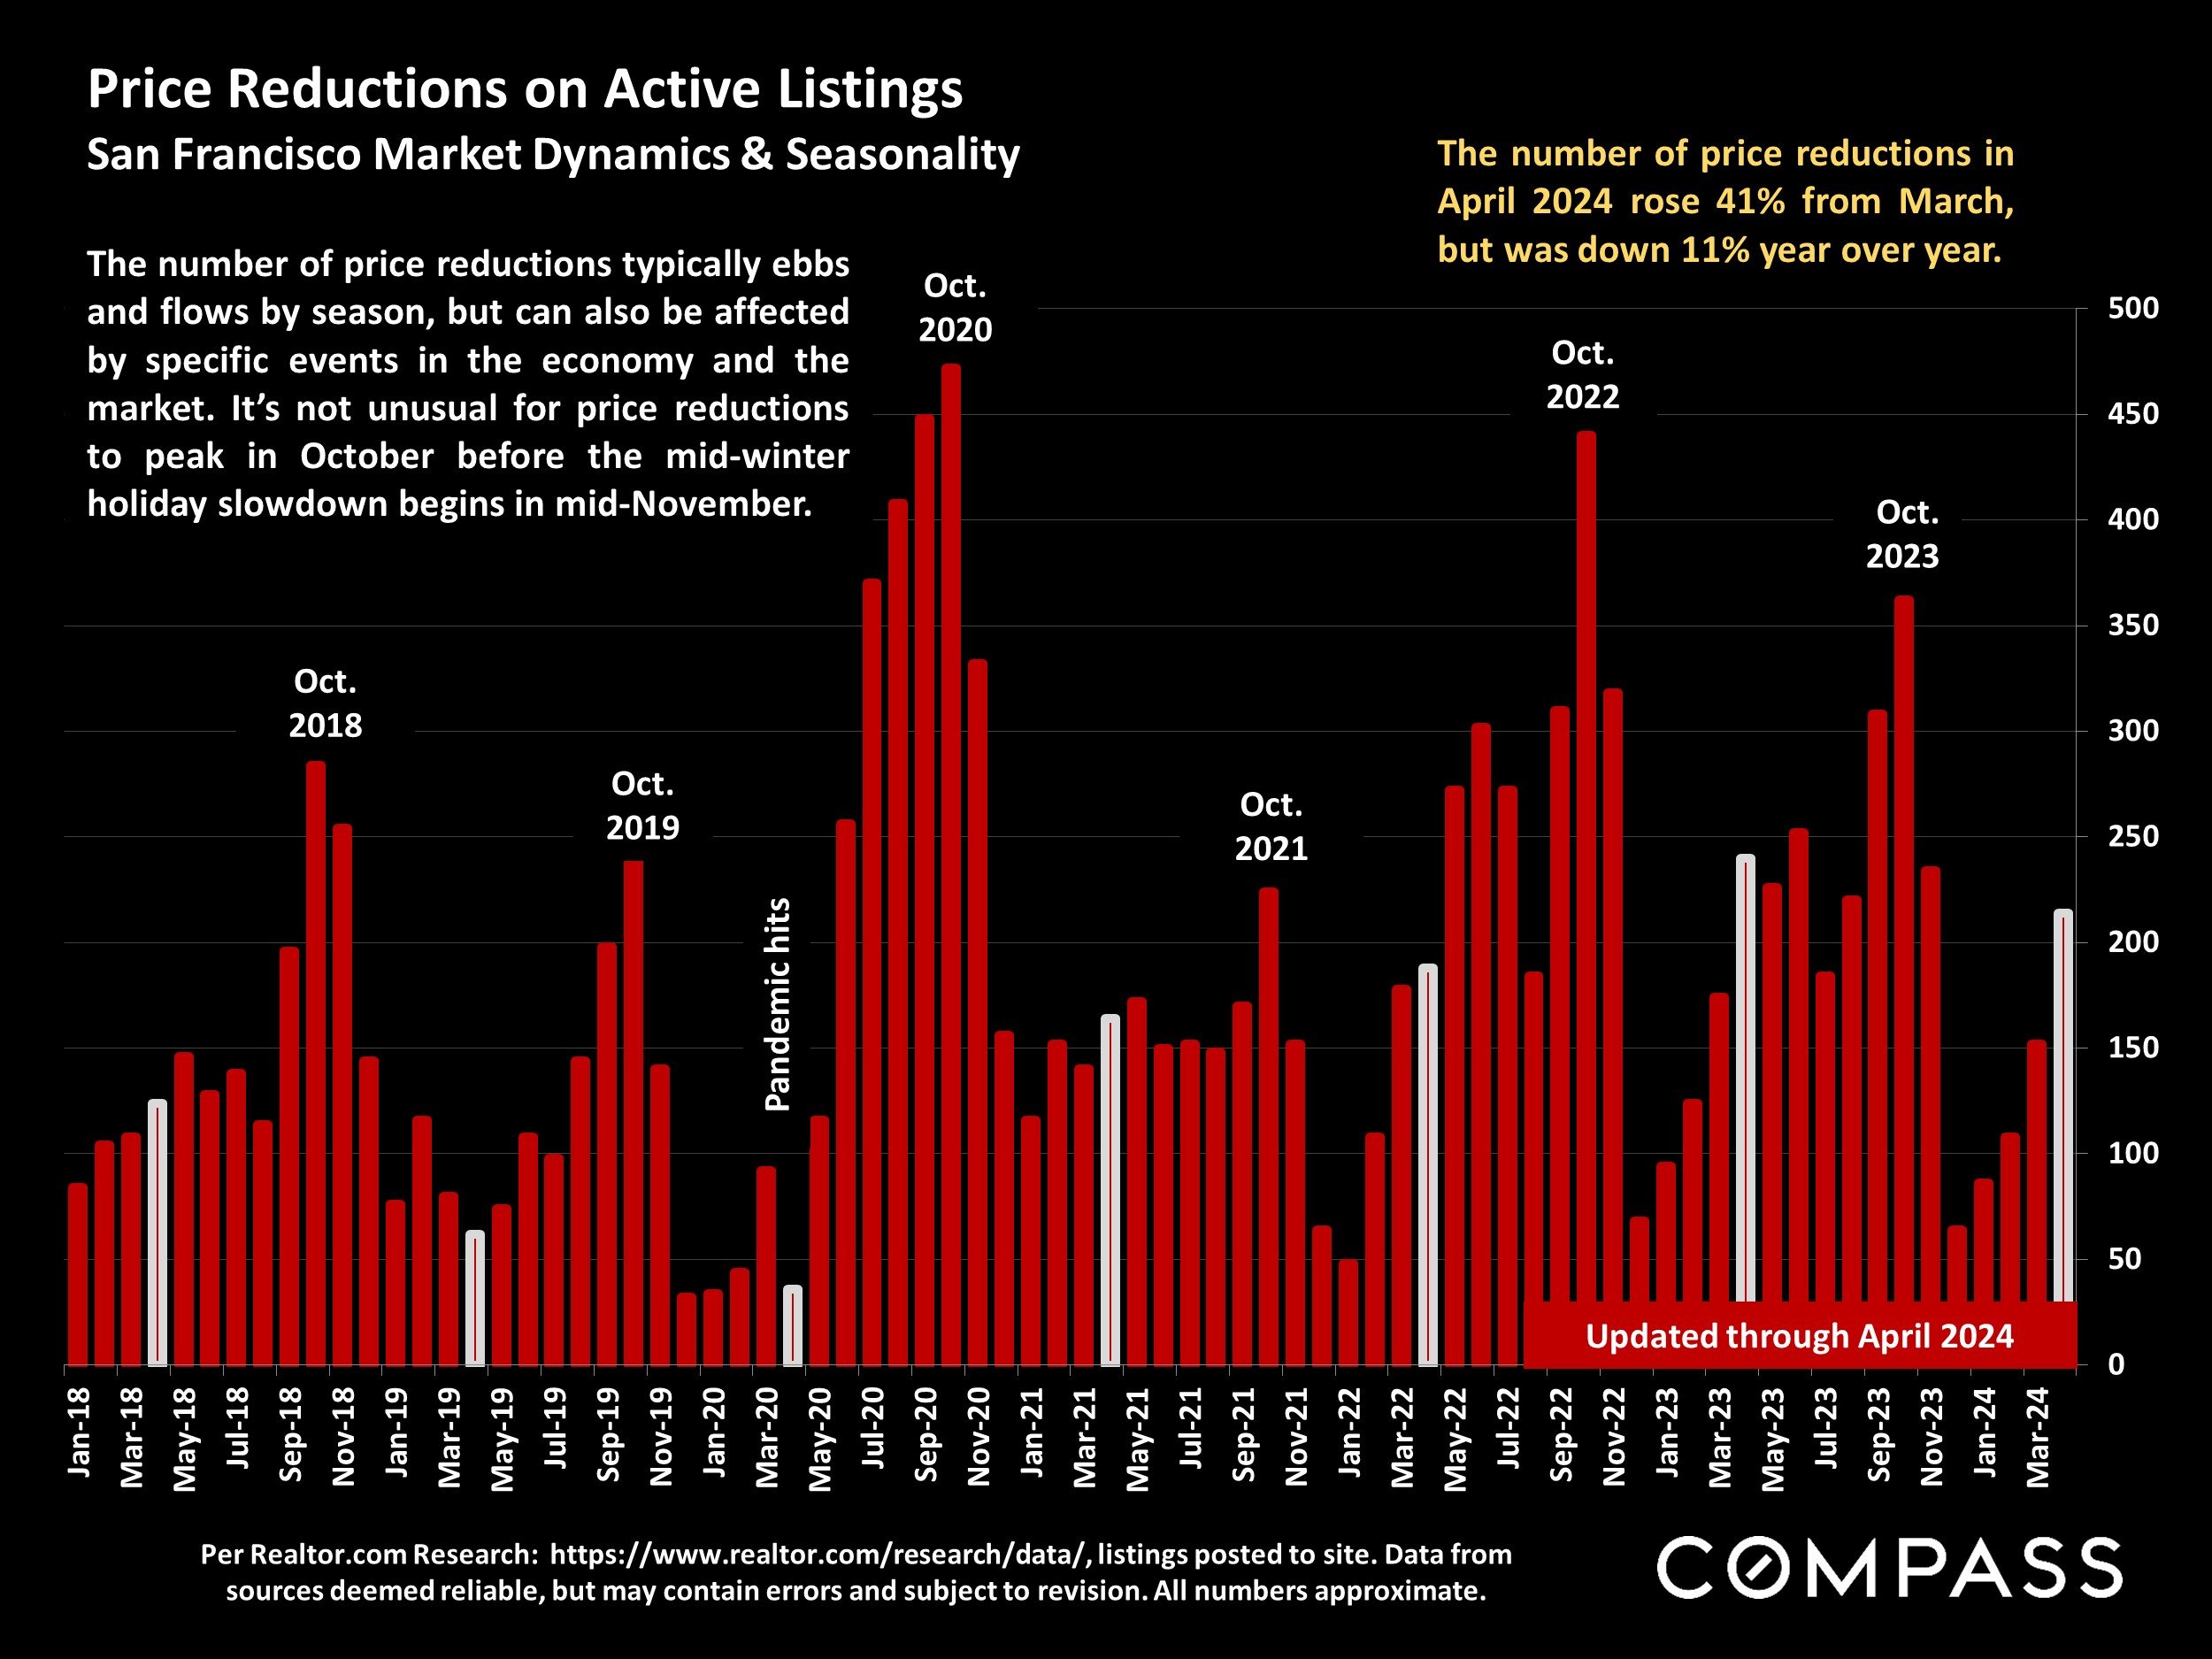
Per Realtor.com Research: https://www.realtor.com/research/data/, listings posted to site. Data from sources deemed reliable, but may contain errors and subject to revision. All numbers approximate.
The number of price reductions in April 2024 rose 41% from March, but was down 11% year over year.
The number of price reductions typically ebbs and flows by season, but can also be affected by specific events in the economy and the market. It’s not unusual for price reductions to peak in October before the mid-winter holiday slowdown begins in mid-November.
House Sales Volumes & Median Sales Prices by Realtor District
San Francisco, 12 Months House Sales*
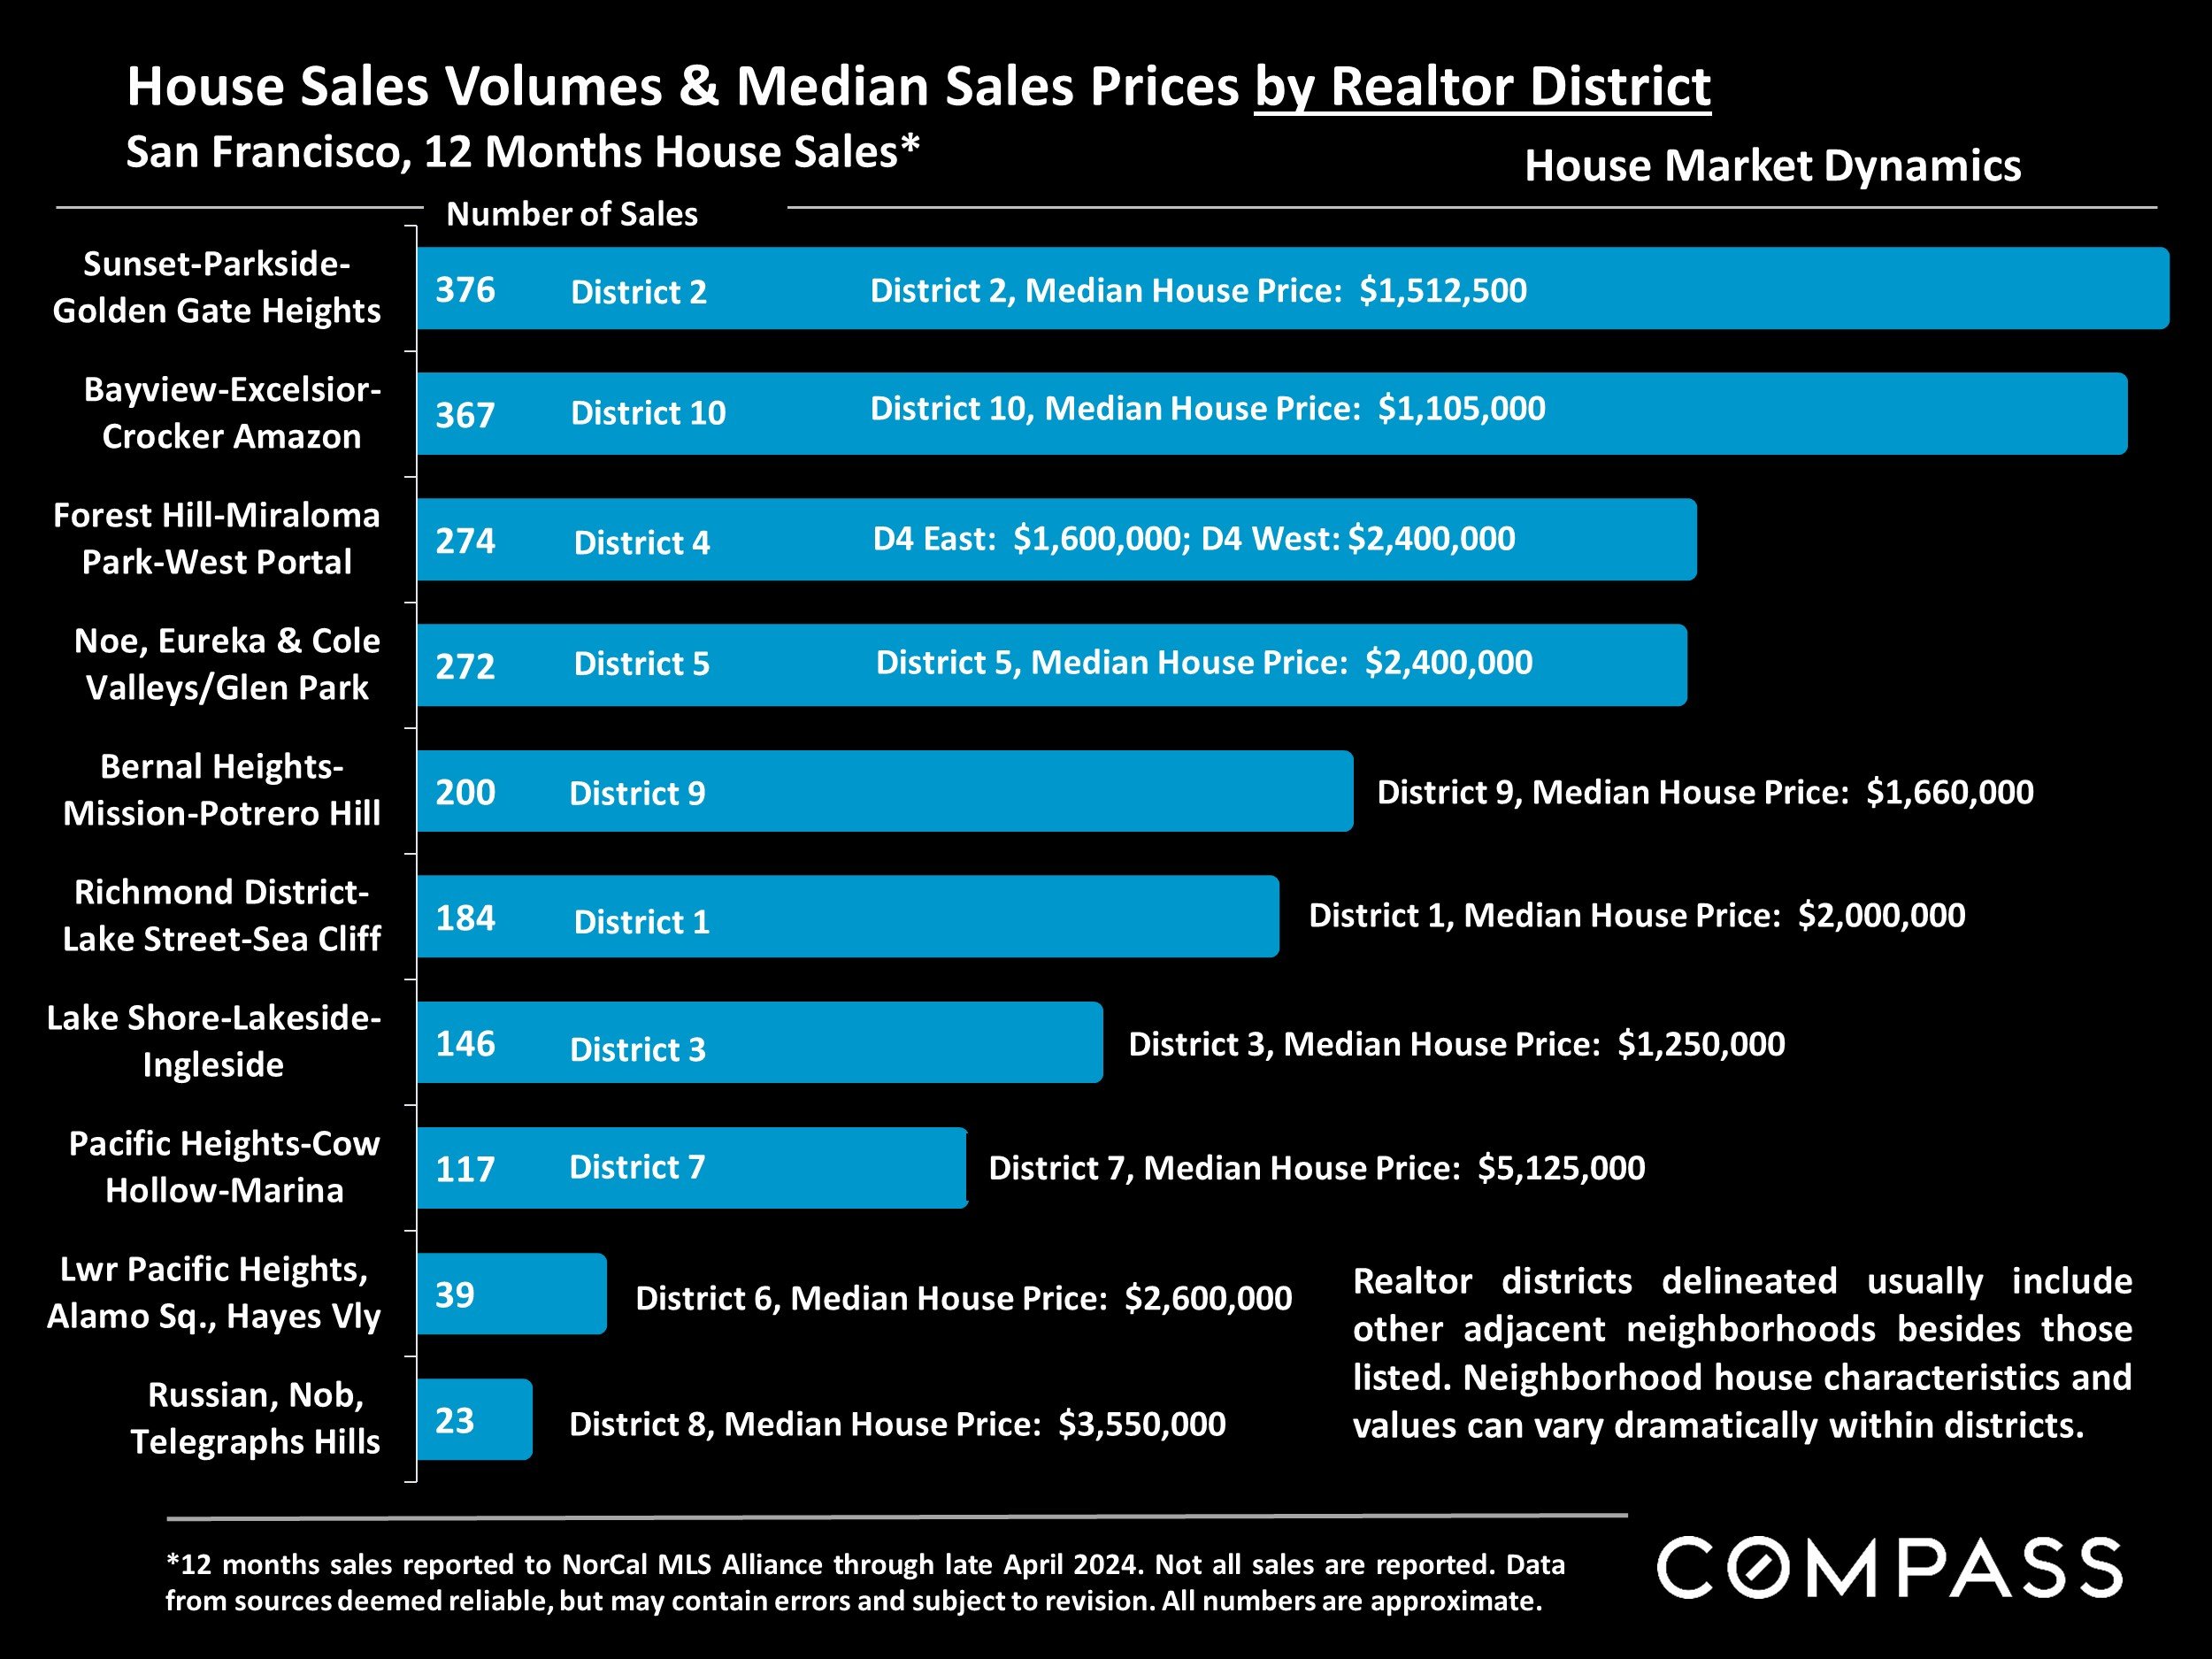
*12 months sales reported to NorCal MLS Alliance through late April 2024. Not all sales are reported. Data from sources deemed reliable, but may contain errors and subject to revision. All numbers are approximate.
Realtor districts delineated usually include other adjacent neighborhoods besides those listed. Neighborhood house characteristics and values can vary dramatically within districts.
Average Days on Market to Acceptance of Offer
San Francisco HOUSE Markets by Realtor District*
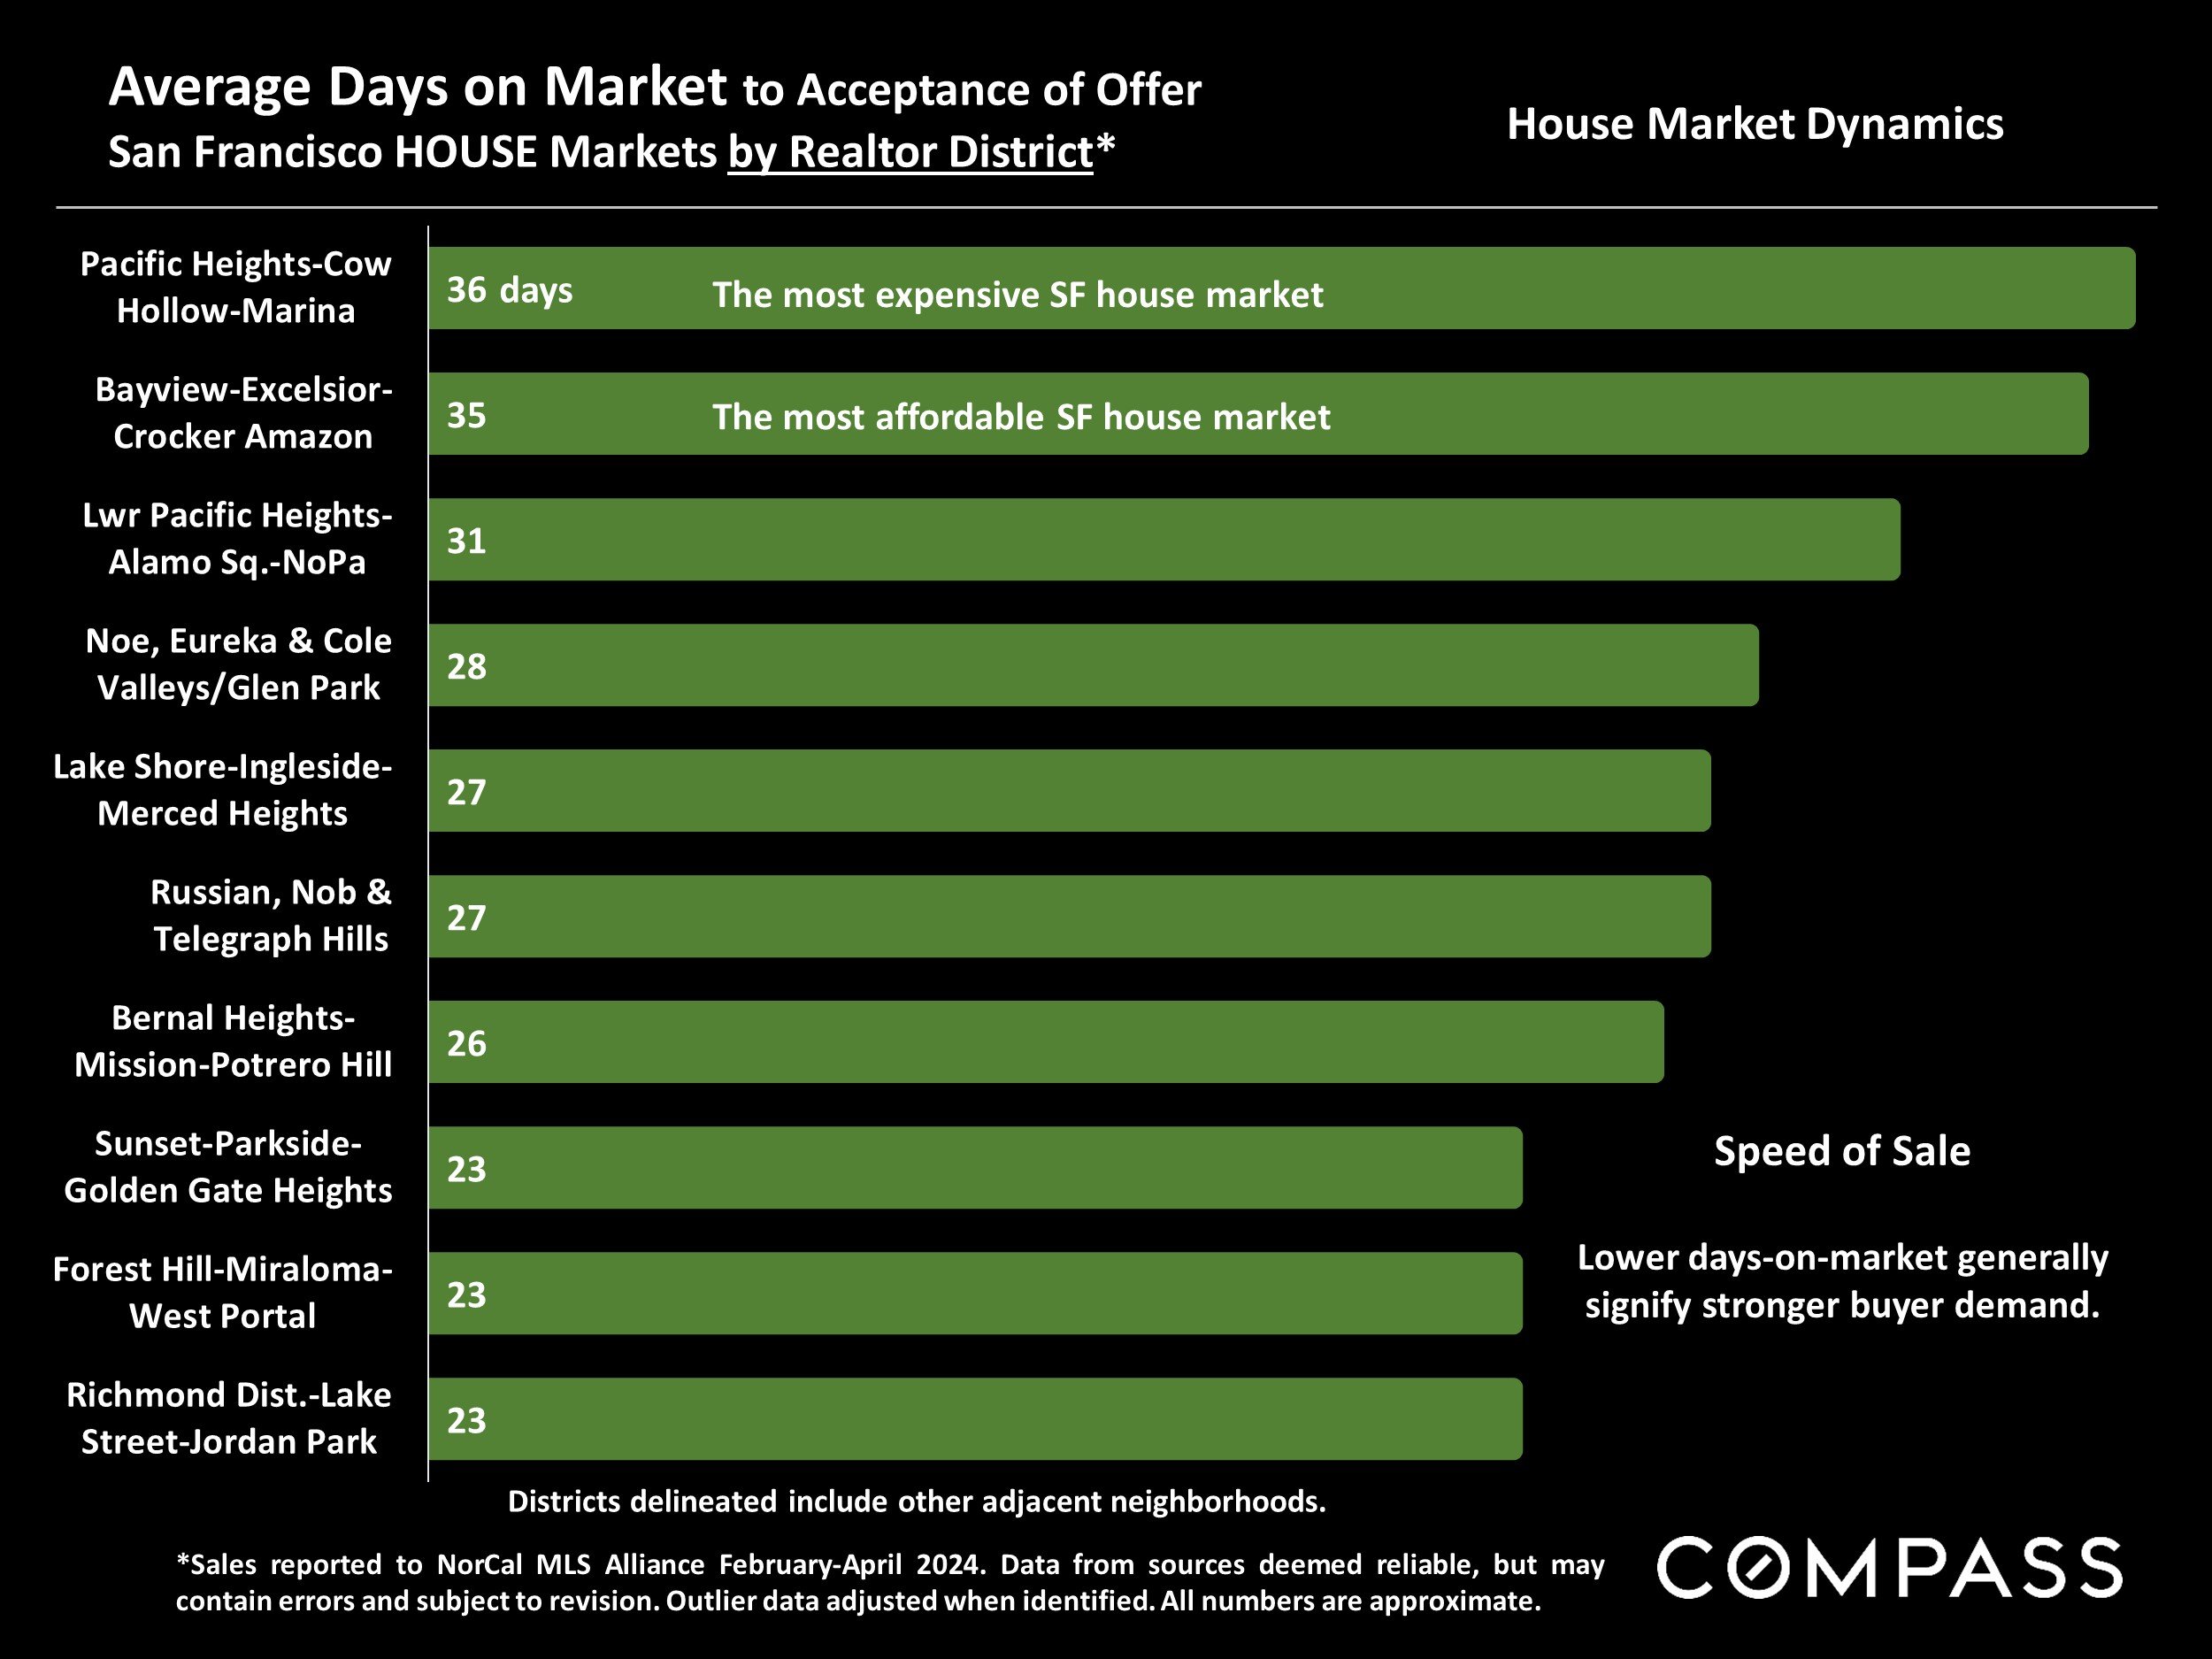
*Sales reported to NorCal MLS Alliance February-April 2024. Data from sources deemed reliable, but may contain errors and subject to revision. Outlier data adjusted when identified. All numbers are approximate.
Lower days-on-market generally signify stronger buyer demand.
Percentage of Listings Selling Over List Price
San Francisco HOUSE Markets by Realtor District*

*Sales reported to NorCal MLS Alliance February-April 2024. Data from sources deemed reliable, but may contain errors and subject to revision. Outlier data adjusted when identified. All numbers are approximate.
Higher percentages of sales over list price typically signify greater buyer competition for new listings.
Average Overbid & Underbid Percentages
San Francisco HOUSE Markets by Realtor District*

*Sales reported to NorCal MLS Alliance February-April 2024. Data from sources deemed reliable, but may contain errors and subject to revision. Outlier data adjusted when identified. All numbers are approximate.
Generally speaking, the more that buyers compete for a limited supply of appealing and well-priced listings, the higher the average overbid percentage above asking price. It’s not unusual for the most expensive markets to see lower or negative percentages, though that is not always the case.
In San Francisco, the house market has typically seen much more heated overbidding than the condo market in recent years.
Condo Sales Volumes & Median Sales Prices by Realtor District

*12 months sales reported to NorCal MLS Alliance through late April 2024. Many new-project sales are not reported to MLS. Data from sources deemed reliable, but may contain errors and subject to revision. All numbers are approximate.
Realtor districts delineated usually include other adjacent neighborhoods besides those listed. Neighborhood condo characteristics and values can vary dramatically within districts.
Average Days on Market to Acceptance of Offer
Major San Francisco CONDO Markets by Realtor District*
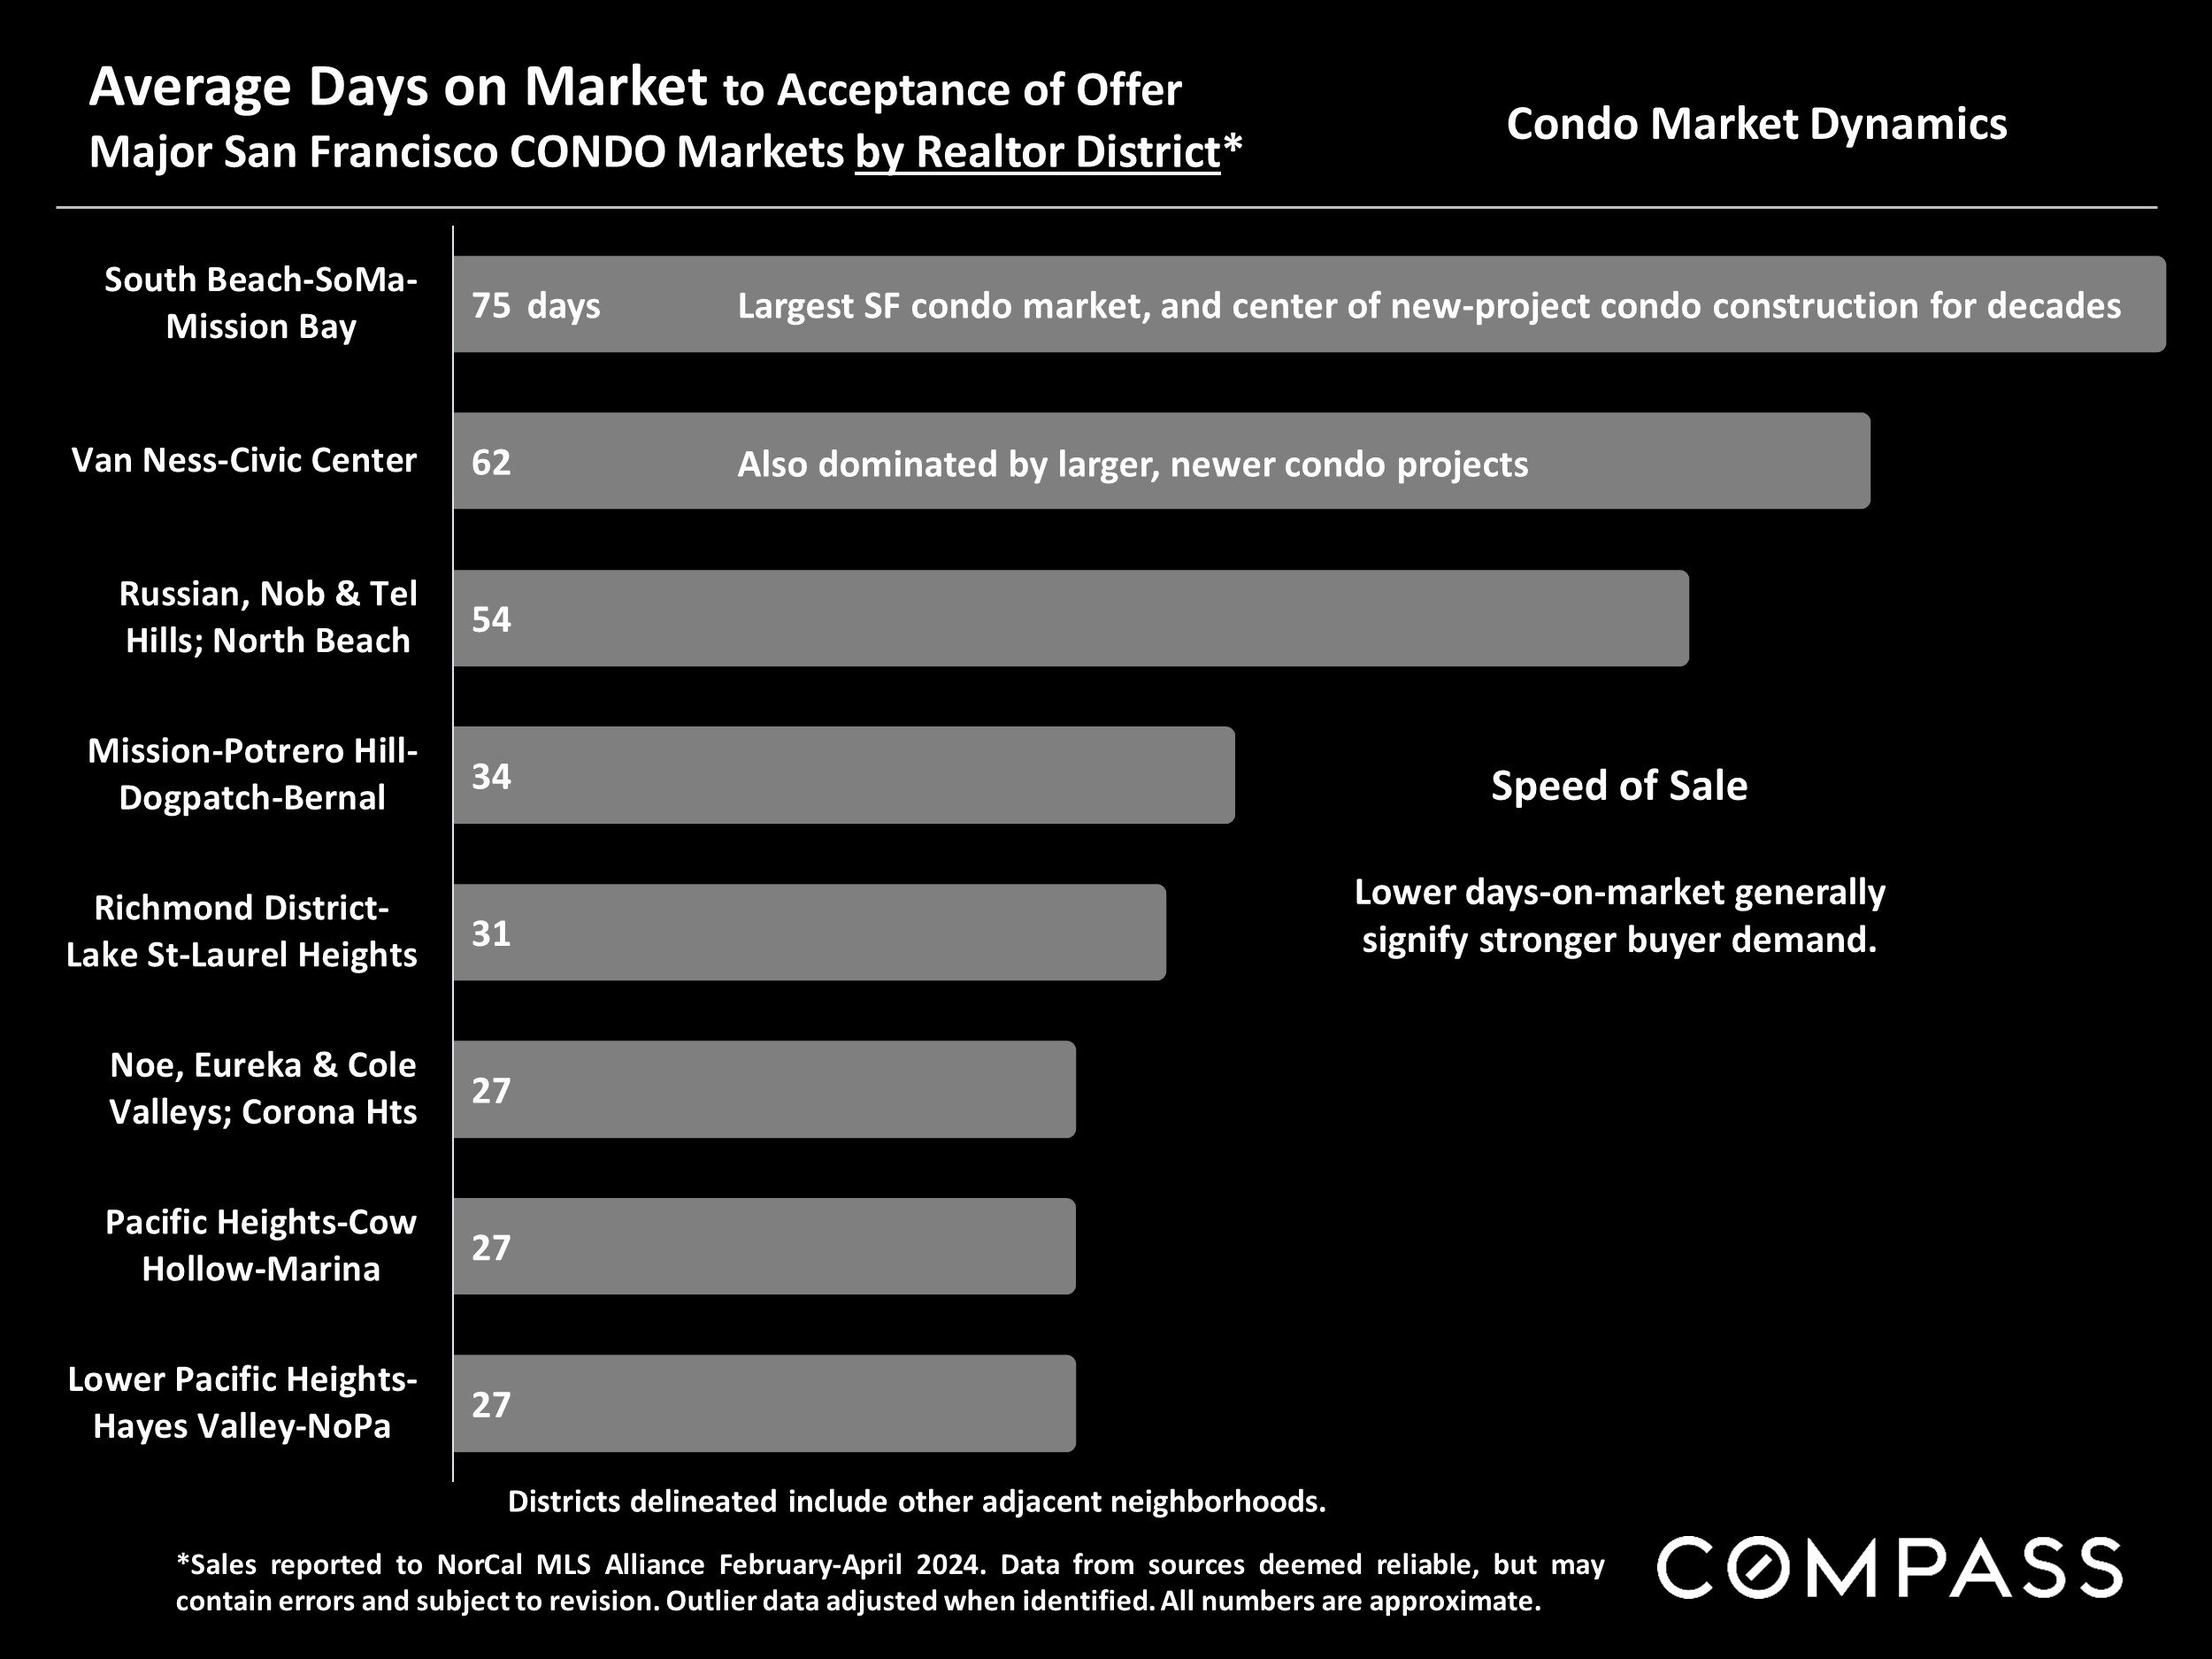
*Sales reported to NorCal MLS Alliance February-April 2024. Data from sources deemed reliable, but may contain errors and subject to revision. Outlier data adjusted when identified. All numbers are approximate.
Lower days-on-market generally signify stronger buyer demand.
The largest SF condo market and center of new-project condo construction for decades, South Beach-SoMa-Mission Bay, has the highest DOM, followed by Van Ness-Civic Center, which is also dominated by larger, newer condo projects.
Percentage of Listings Selling Over List Price
Major San Francisco CONDO Markets by Realtor District*
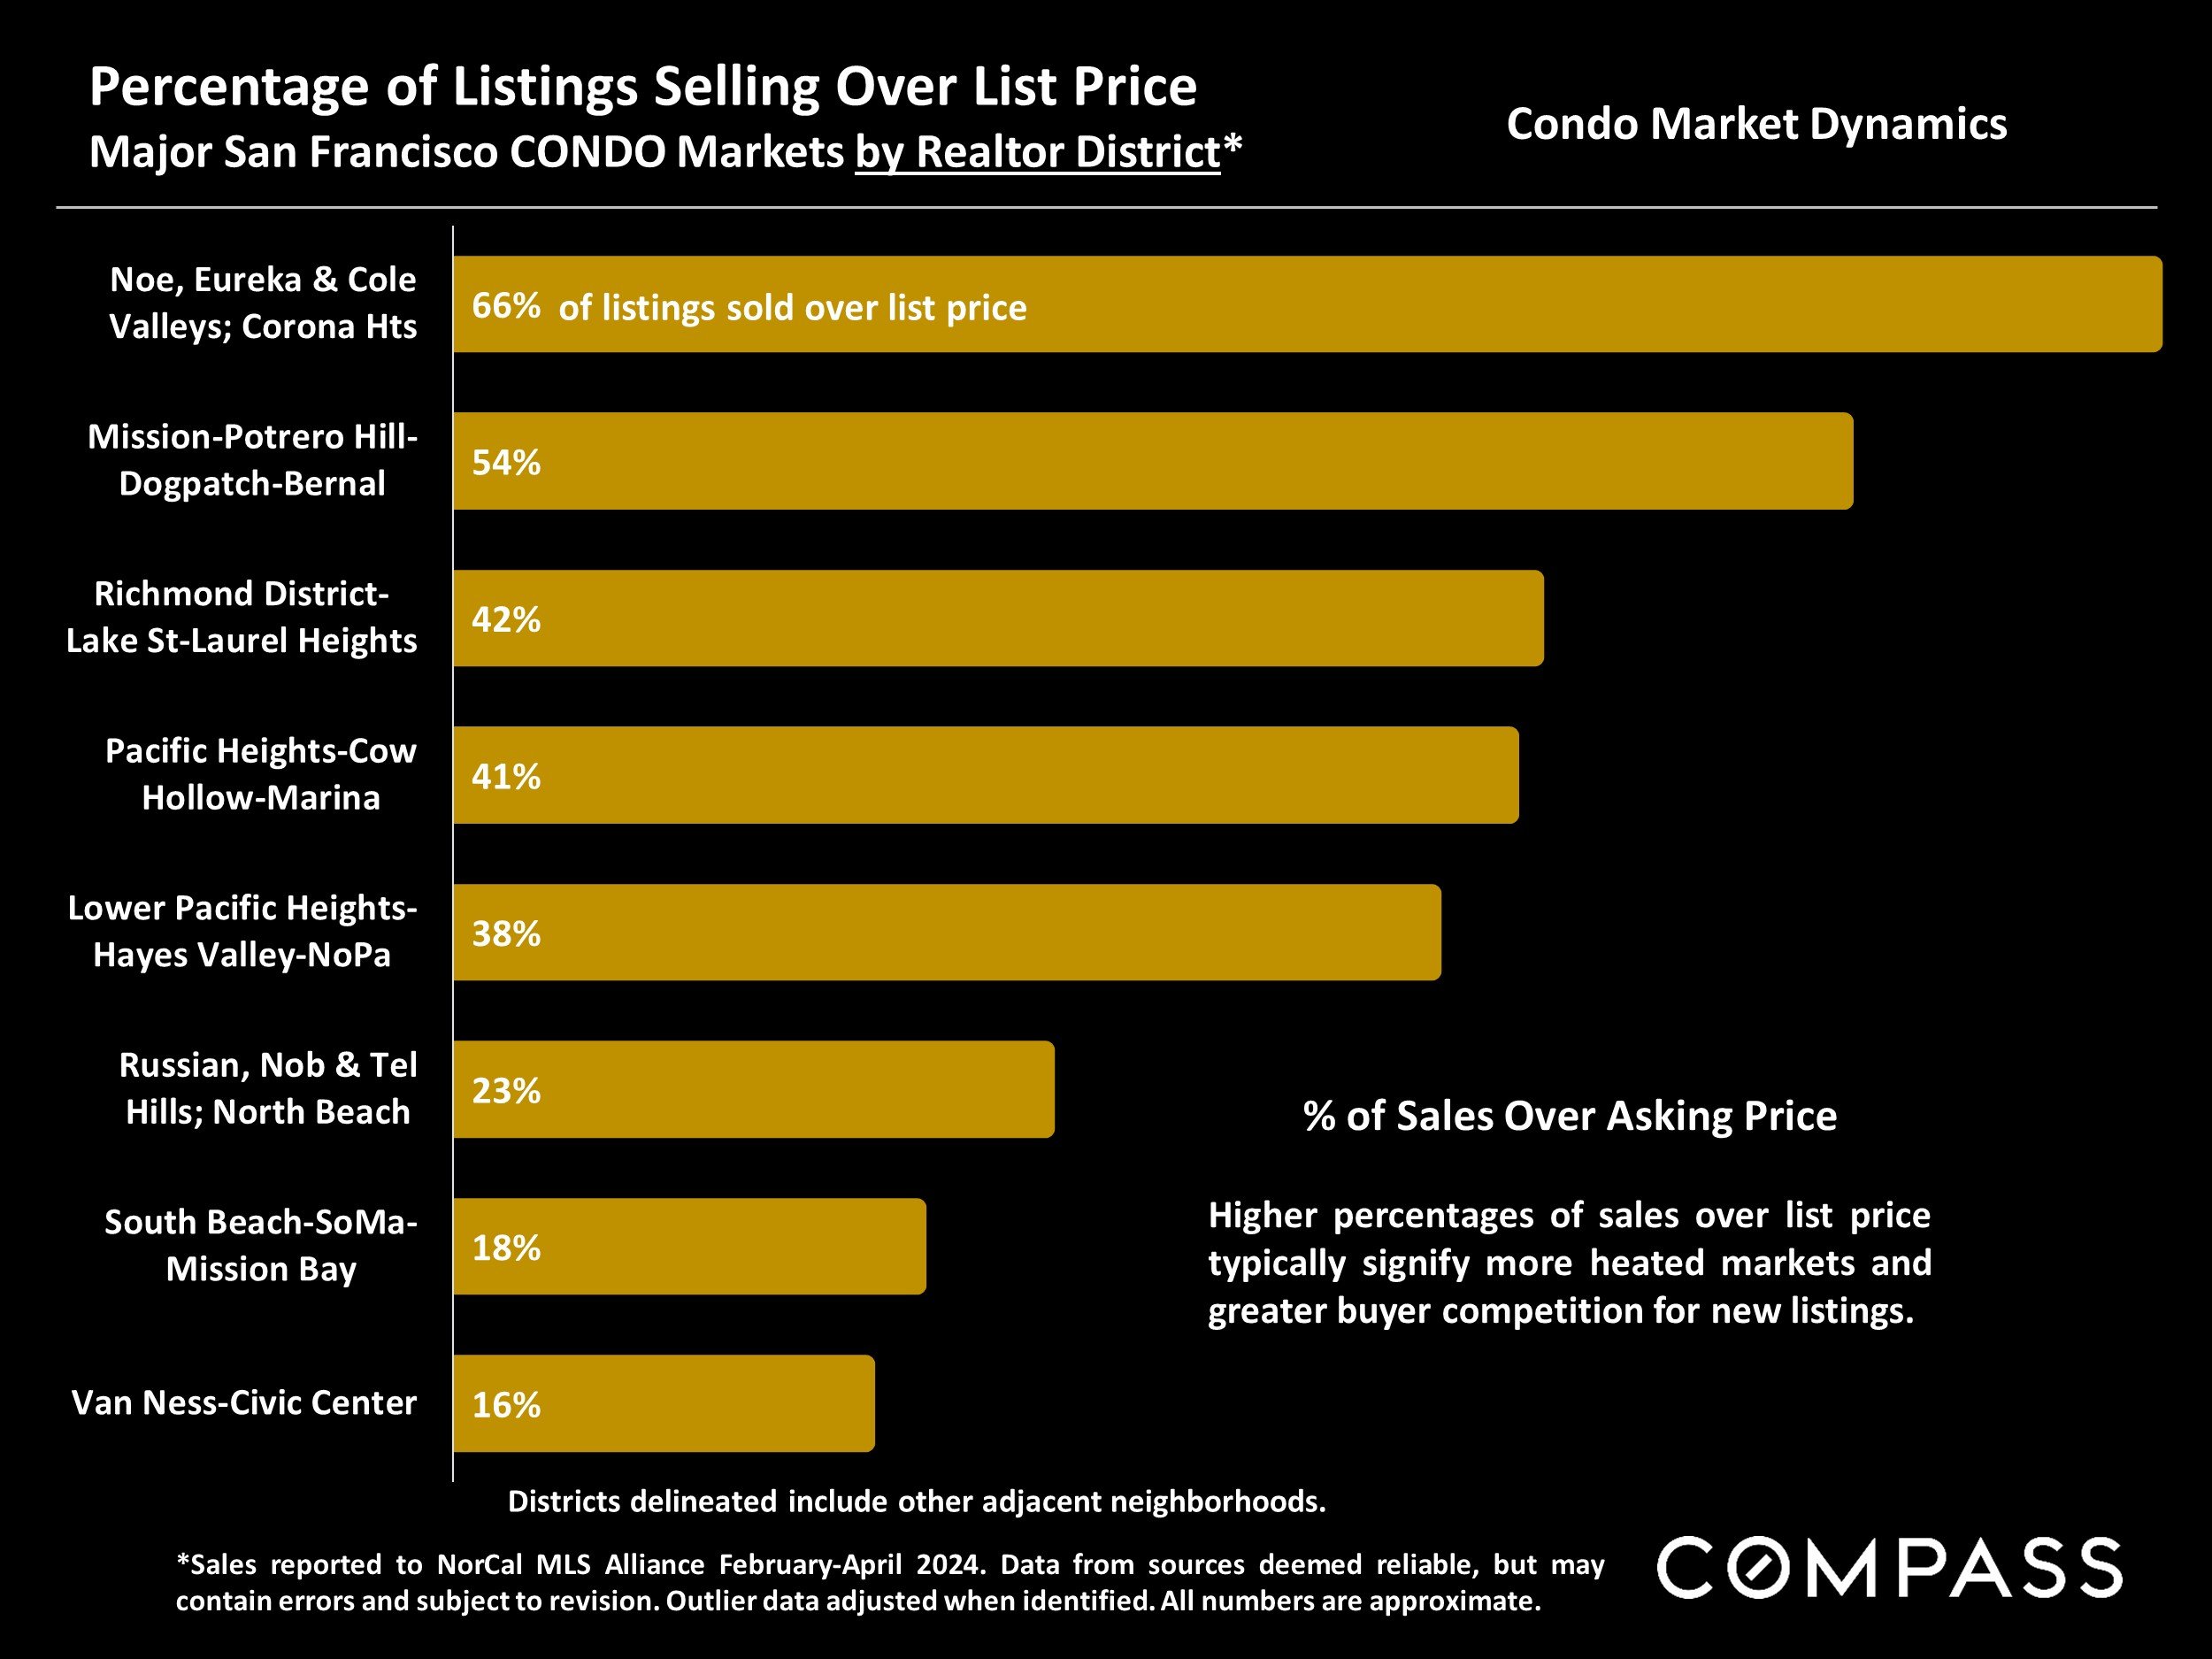
*Sales reported to NorCal MLS Alliance February-April 2024. Data from sources deemed reliable, but may contain errors and subject to revision. Outlier data adjusted when identified. All numbers are approximate.
Higher percentages of sales over list price typically signify more heated markets and greater buyer competition for new listings.
Noe, Eureka & Cole Valleys and Corona Heights saw the greatest number of overbidding on condos, at 66% of listings sold over asking price.
Average Overbid & Underbid Percentages
Major San Francisco CONDO Markets by Realtor District*
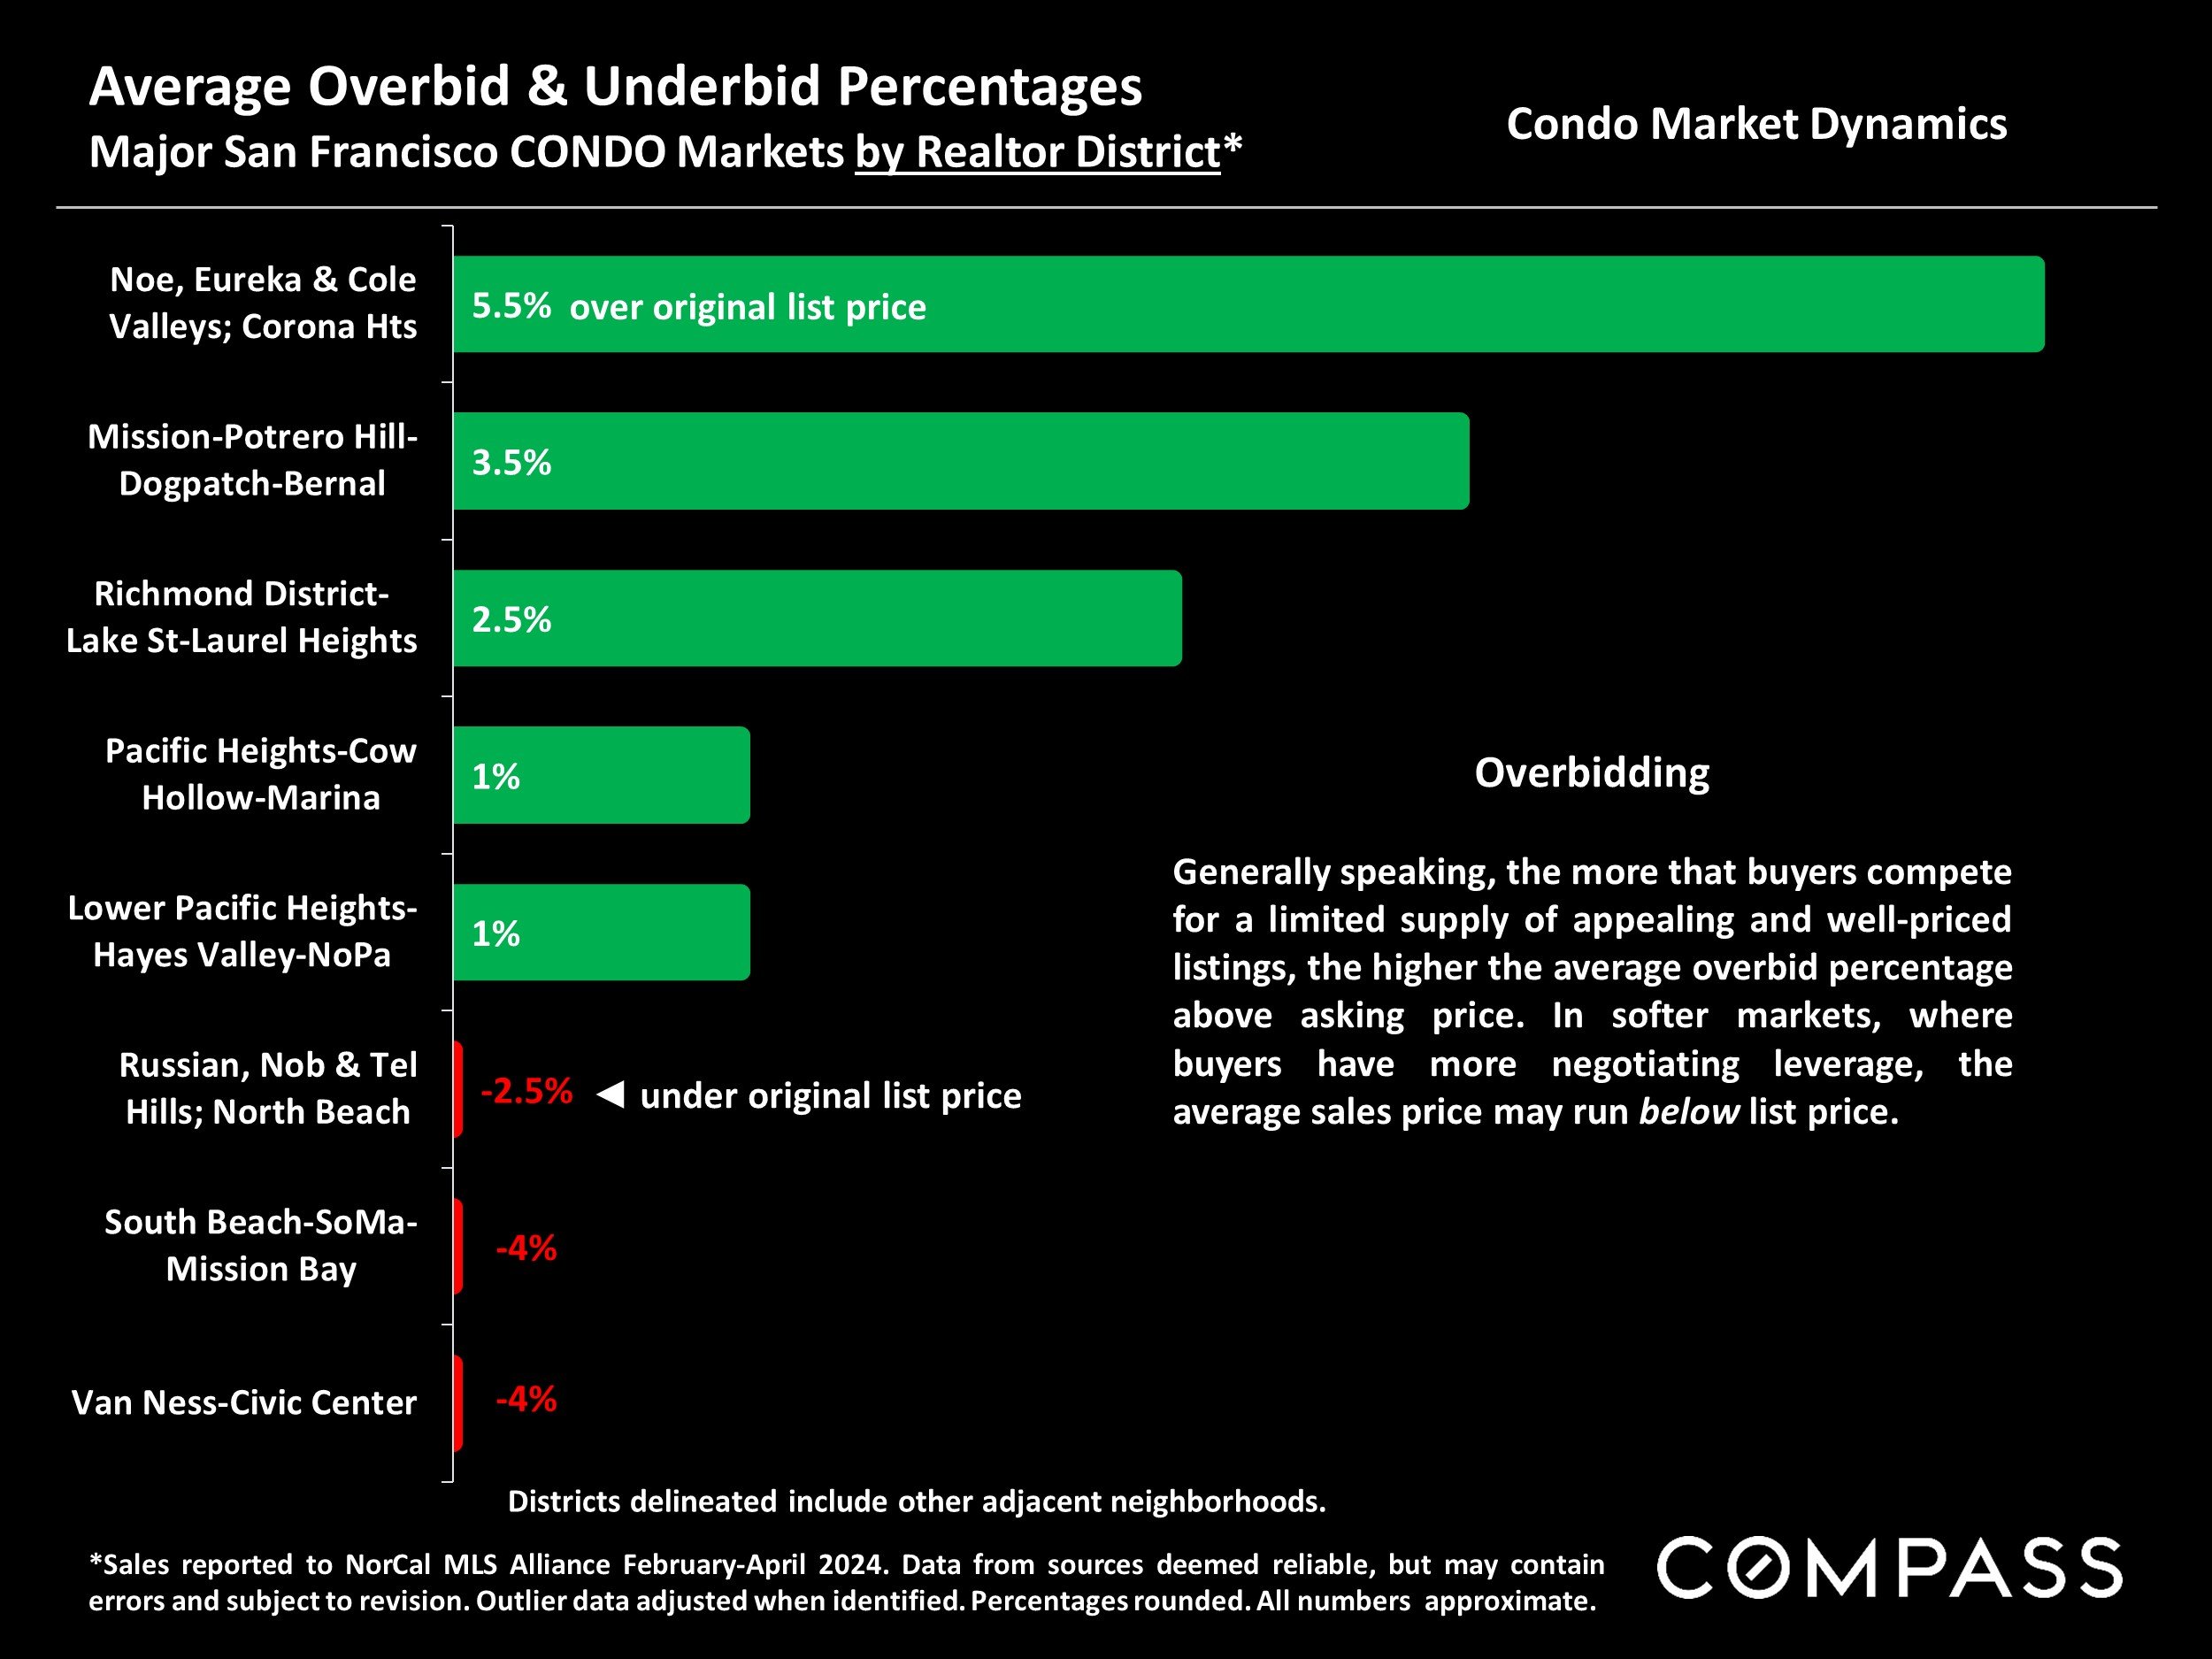
*Sales reported to NorCal MLS Alliance February-April 2024. Data from sources deemed reliable, but may contain errors and subject to revision. Outlier data adjusted when identified. Percentages rounded. All numbers approximate.
Generally speaking, the more that buyers compete for a limited supply of appealing and well-priced listings, the higher the average overbid percentage above asking price. In softer markets, where buyers have more negotiating leverage, the average sales price may run below list price.
Noe, Eureka & Cole Valleys and Corona Heights saw the greatest amount of overbidding on condos, with listings selling 5.5% over asking price on average.
Statistics are generalities, essentially summaries of widely disparate data generated by dozens, hundreds or thousands of unique, individual sales occurring within different time periods. They are best seen not as precise measurements, but as broad, comparative indicators, with reasonable margins of error. Anomalous fluctuations in statistics are not uncommon, especially in smaller, expensive market segments. Last period data should be considered estimates that may change with late-reported data. Different analytics programs sometimes define statistics – such as “active listings,” “days on market,” and “months supply of inventory” – differently: what is most meaningful are not specific calculations but the trends they illustrate. Most listing and sales data derives from the local or regional multi-listing service (MLS) of the area specified in the analysis, but not all listings or sales are reported to MLS and these won’t be reflected in the data. “Homes” signifies real-property, single-household housing units: houses, condos, co-ops, townhouses, duets and TICs (but not mobile homes), as applicable to each market. City/town names refer specifically to the named cities and towns, unless otherwise delineated. Multi-county metro areas will be specified as such. Data from sources deemed reliable, but may contain errors and subject to revision. All numbers to be considered approximate.
Many aspects of value cannot be adequately reflected in median and average statistics: curb appeal, age, condition, amenities, views, lot size, quality of outdoor space, “bonus” rooms, additional parking, quality of location within the neighborhood, and so on. How any of these statistics apply to any particular home is unknown without a specific comparative market analysis.
Median Sales Price is that price at which half the properties sold for more and half for less. It may be affected by seasonality, “unusual” events, or changes in inventory and buying trends, as well as by changes in fair market value. The median sales price for an area will often conceal an enormous variety of sales prices in the underlying individual sales.
Dollar per Square Foot is based upon the home’s interior living space and does not include garages, unfinished attics and basements, rooms built without permit, patios, decks or yards (though all those can add value to a home). These figures are usually derived from appraisals or tax records, but are sometimes unreliable (especially for older homes) or unreported altogether. The calculation can only be made on those home sales that reported square footage.
Photo use under the Creative Commons License: https://creativecommons.org/licenses/by-sa/2.0/
Compass is a real estate broker licensed by the State of California, DRE 01527235. Equal Housing Opportunity. This report has been prepared solely for information purposes. The information herein is based on or derived from information generally available to the public and/or from sources believed to be reliable. No representation or warranty can be given with respect to the accuracy or completeness of the information. Compass disclaims any and all liability relating to this report, including without limitation any express or implied representations or warranties for statements contained in, and omissions from, the report. Nothing contained herein is intended to be or should be read as any regulatory, legal, tax, accounting or other advice and Compass does not provide such advice. All opinions are subject to change without notice. Compass makes no representation regarding the accuracy of any statements regarding any references to the laws, statutes or regulations of any state are those of the author(s). Past performance is no guarantee of future results.