November 2023 Market Report

Photo by Jose Antonio Gallego Vázquez on Unsplash
The heart of the autumn selling season was dominated by global conflict, falling stock markets — and interest rates jumping to their highest point in 23 years, further discouraging buyers who require financing, and prospective sellers reluctant to abandon their current loan terms. Then on November 1st, the October jobs report came out, the Fed extended their pause on raising its benchmark rate, and the Treasury Department issued revised guidance pertaining to upcoming bond sales. By November 3rd, stock markets had logged their best week of the year, and interest rates had seen a near-record decline. The housing market typically begins its big, holiday slowdown in mid-November, with listing and sales activity declining to annual lows. Considering the volatility that has characterized economic and political conditions, it’s too early to speculate on how these shifts will play out in the coming days, weeks and months. Ideally, rates will continue to normalize and consumer confidence to recover into the new year, with significant improvements to both housing affordability and the equation for homeowners contemplating a sale.
Even if the expected holiday slowdown occurs, sellers of appealing, well-prepared and well-priced homes may still see a quick sale with multiple offers: There are still qualified buyers actively looking to purchase (with financing or all cash). For buyers, mid-winter usually offers reduced competition for listings, and an enhanced ability to aggressively negotiate prices on unsold properties: It can be an excellent time to buy for those who stay in the game.
This report will review trends in home prices, new and active listings, speed of sale, overbidding, listings going into contract, and sales volumes in both the general market and the luxury segment.
Mortgage Interest Rates since February 2023
30-Year Fixed-Rate Loans, Daily Average Readings*

*Per https://www.mortgagenewsdaily.com/: “Rate offerings vary—sometimes substantially—from lender to lender... The index is expressed as an average.” Data from sources deemed reliable, but not guaranteed. All numbers approximate.
On November 1st, the Fed decided to once again refrain from an increase in its benchmark rate, one of several factors behind the dramatic, interest rate decline in early November.
San Francisco HOUSE Price Trends since 1990
Monthly Median House Sales Prices, 3-Month Rolling

3-month rolling average of monthly median sales prices for “existing” houses, per CA Association of Realtors or 3-month rolling median per NorCal MLS Alliance. 2-period moving trend line. Analysis may contain errors and subject to revision. All numbers approximate, and may change with late-reported sales.
On a year-over-year basis, the 3-month-rolling SF median house sales price in October 2023 was down a little more than 2%.
Median sales price is that price at which half the sales occurred for more and half for less. It is a very general statistic, disguising an enormous range of sales prices in the underlying sales. It is often affected by other factors besides changes in fair market value. Monthly and seasonal fluctuations are common, which explain many of the regular ups and downs in this chart.
San Francisco CONDO Price Trends since 2005
Median Condo Sales Price, 3-Month Rolling
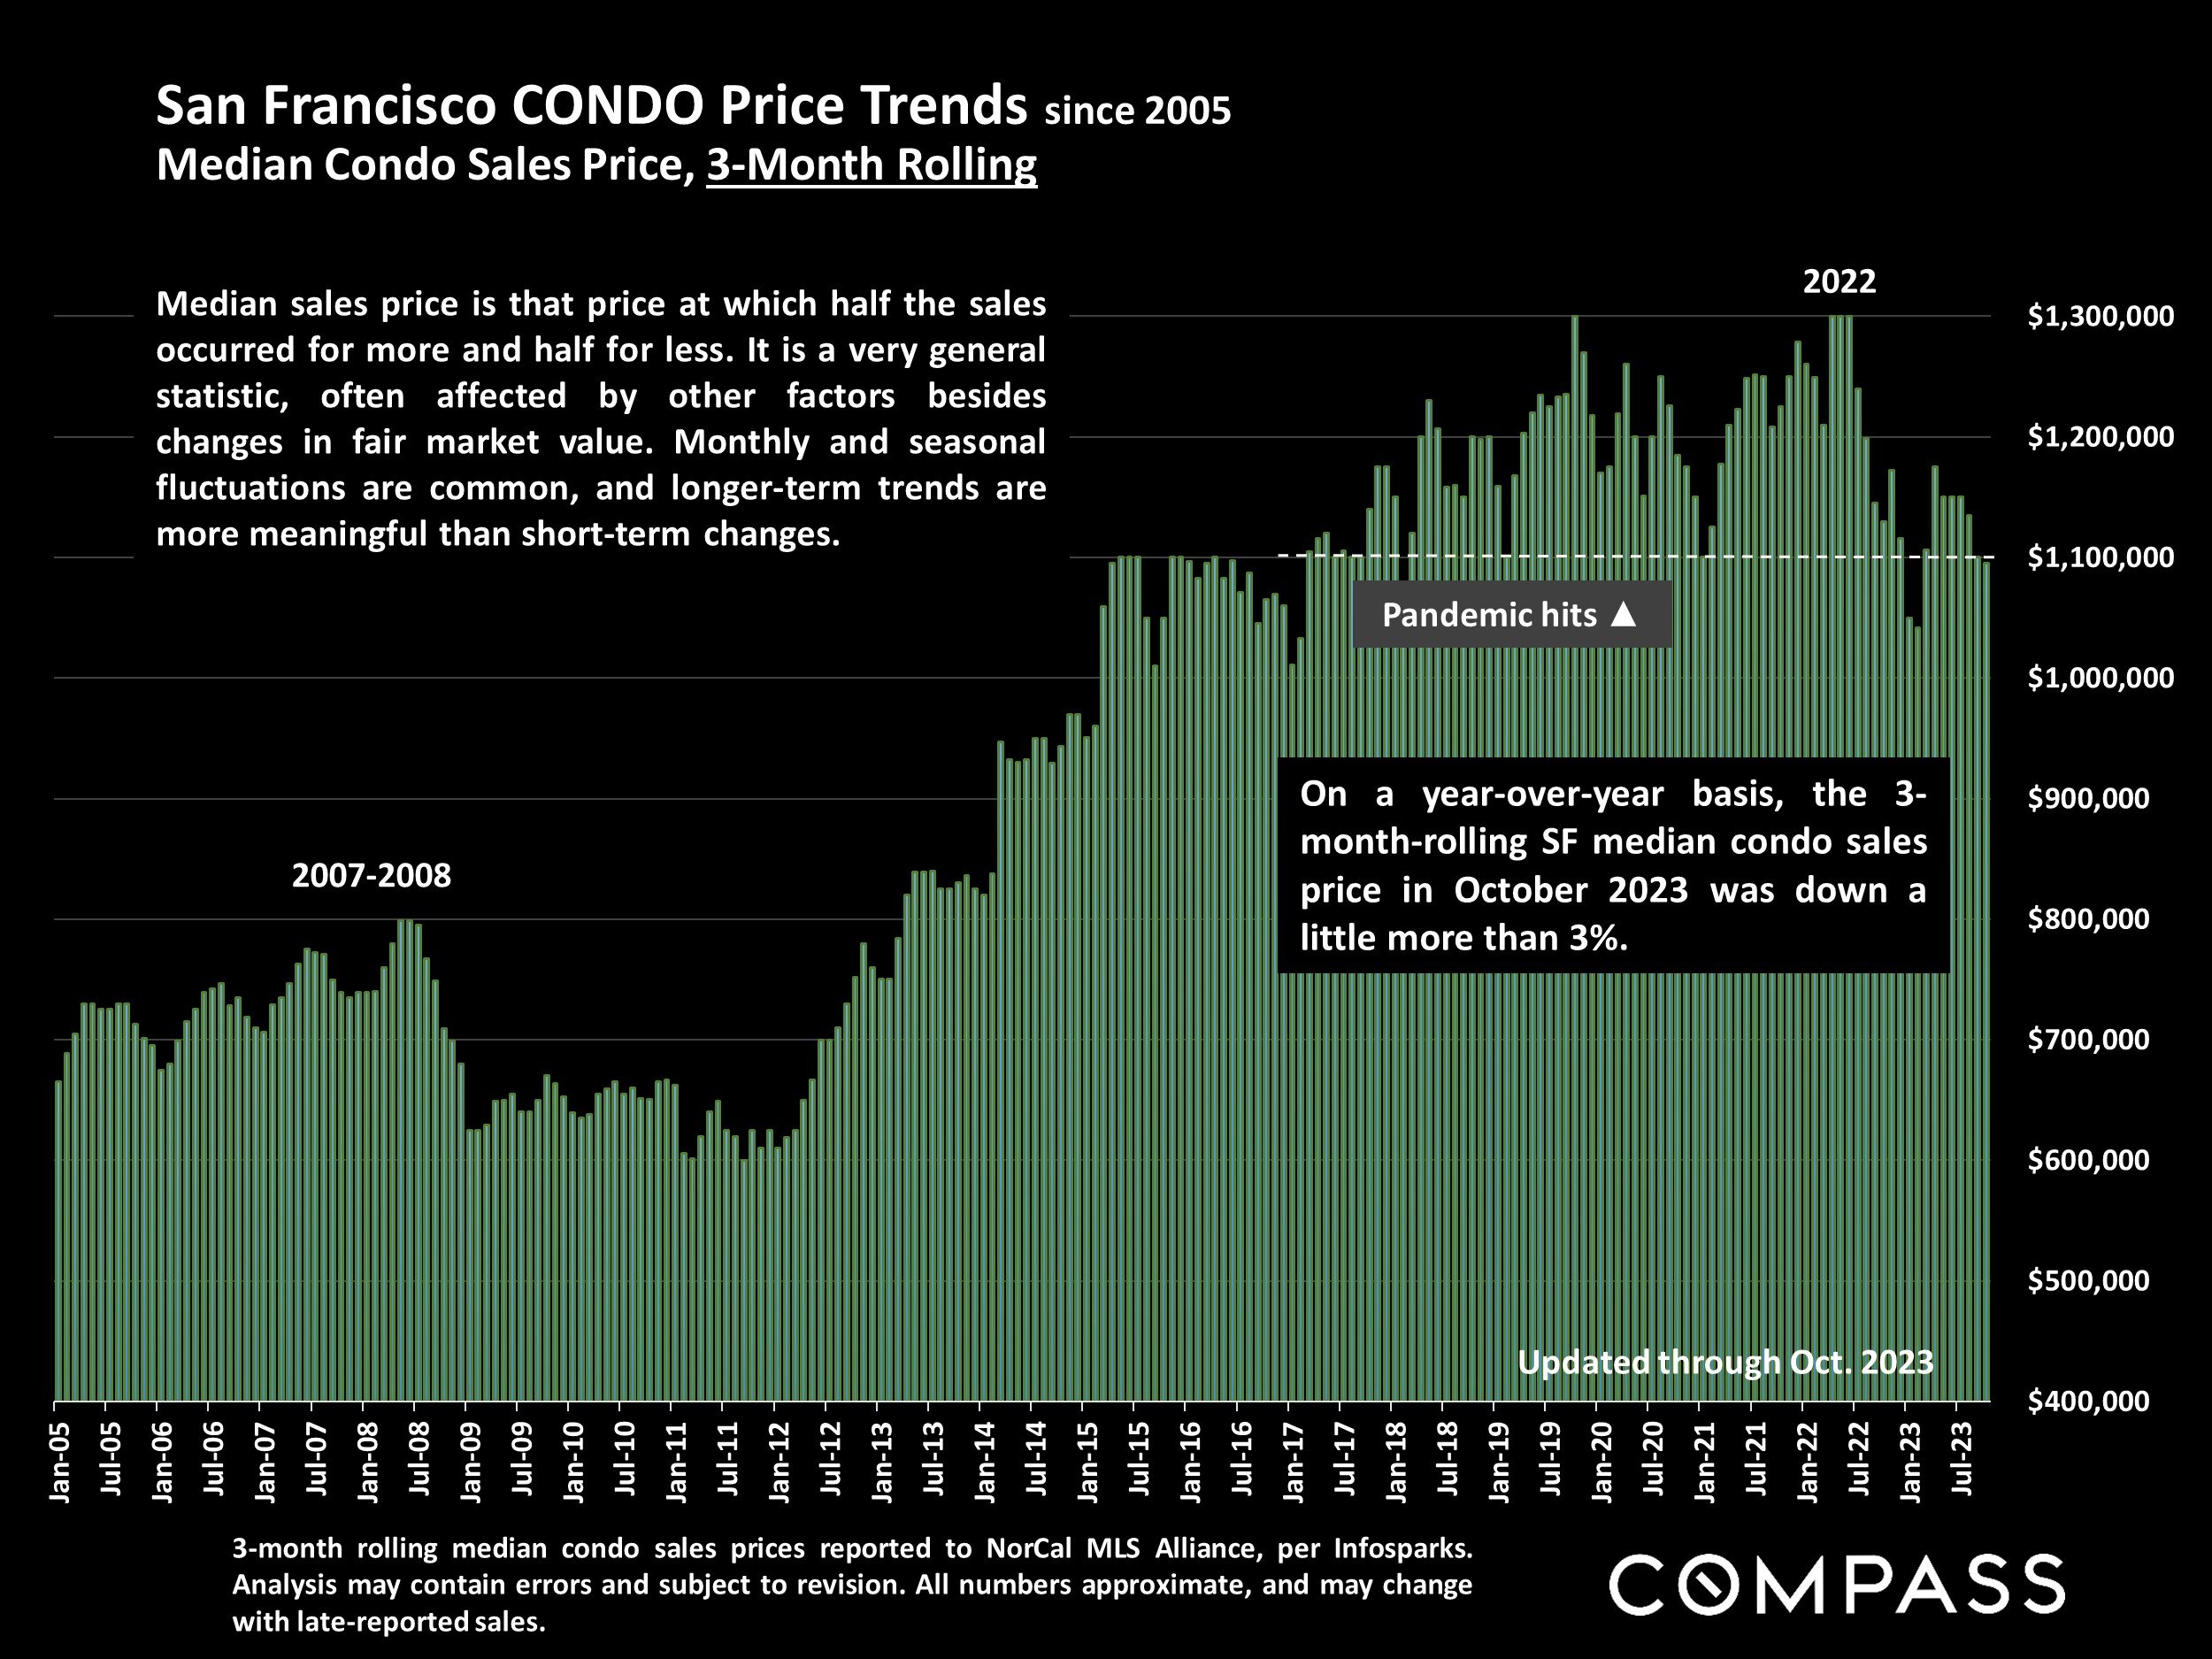
3-month rolling median condo sales prices reported to NorCal MLS Alliance, per Infosparks. Analysis may contain errors and subject to revision. All numbers approximate, and may change with late-reported sales.
Median sales price is that price at which half the sales occurred for more and half for less. It is a very general statistic, often affected by other factors besides changes in fair market value. Monthly and seasonal fluctuations are common, and longer-term trends are more meaningful than short-term changes.
On a year-over-year basis, the 3-month-rolling SF median condo sales price in Octoer 2023 was down a little more than 3%.
San Francisco CONDO Price Trends: Downtown vs. Non-Downtown
6-Month-Rolling Median Condo Sales Prices since 2005*

*6-month rolling median condo sales values reported to NorCal MLS Alliance, per Infosparks. Analysis may contain errors and subject to revision. Does not include new-project sales unreported to MLS. All numbers approximate, and may change with late-reported sales.
Comparing the median condo sales price in the greater Downtown/South of Market/Civic Center area (the center of large-project, new-condo construction, office buildings and high-tech employment) – delineated by the blue line – with the median condo sales price in the rest of San Francisco (mostly smaller, older buildings, in less urban environments) – delineated by the white line.
The greater downtown/SoMa/Civic-Center condo market has been much more negatively affected by a number of economic, demographic and social factors impacting supply and demand than condo markets in other city districts.
San Francisco Home Sales Breakdown
Sales Numbers & Median Values by Number of Bedrooms*

*4 months sales reported to NorCal MLS Alliance through late October 2023. Data from sources deemed reliable, but may contain errors and subject to revision. Selected major property configurations. All numbers approximate.
Summer-Fall 2023 Update: 4 Months Sales*
Median Sales Prices & Median $/Sq.Ft. Values
2-BR Houses: $1,200,000, $1024/sq.ft.
3-BR Houses: $1,575,000, $955/sq.ft.
4-BR Houses: $2,015,000, $919/sq.ft.
5+BR Houses: $2,455,500, $868/sq.ft.
1-BR Condos: $727,000, $982/sq.ft.
2-BR Condos: $1,215,000, $1032/sq.ft.
3-BR Condos: $1,645,000, $1016/sq.ft.
2-Unit Bldgs: $1,680,000, $687/sq.ft.
There were also 59 TICs and 16 co-ops, of various BR counts, and 30 studio condos sold during the 4-month period.
San Francisco Median Home Sales Prices
6 Months Sales, A Sampling of SF’s 70+ Neighborhoods*
Selected neighborhoods with at least 12 sales of the designated property type within the period*
Home sizes and other factors affecting value vary widely within and between neighborhoods.
| Neighborhood | Median HOUSE Sales Price* | Median Sq.Ft. | Median $/Sq.Ft. |
|---|---|---|---|
| Cow Hollow | $7,250,000 | 4910 | $1468 |
| Pacific & Presidio Hts | $6,900,000 | 4705 | $1519 |
| Lake St./Jordan Park | $3,475,000 | 2642 | $1230 |
| Cole Vly/Ashbury Hts | $3,412,500 | 2733 | $1374 |
| Noe & Eureka Valleys | $2,400,000 | 2080 | $1286 |
| Glen Park | $1,937,500 | 2054 | $1150 |
| Inner/Cent. Richmond | $1,925,000 | 2124 | $1010 |
| Potrero Hill | $1,880,000 | 1750 | $1062 |
| Lake Shore | $1,767,000 | 1739 | $998 |
| Bernal Heights | $1,640,000 | 1447 | $1142 |
| Central Sunset | $1,555,500 | 1550 | $991 |
| Miraloma Park | $1,485,000 | 1635 | $973 |
| (Central) Parkside | $1,420,000 | 1640 | $917 |
| Portola/Excelsior | $1,190,000 | 1424 | $826 |
| Visitacion Valley | $1,080,000 | 1467 | $656 |
| Bayview | $907,500 | 1450 | $632 |
| Neighborhood | Median CONDO Sales Price* | Median Sq.Ft. | Median $/Sq.Ft. |
|---|---|---|---|
| Marina | $1,785,500 | 1563 | $1225 |
| Pacific Heights | $1,610,000 | 1611 | $1104 |
| Cole Vly/Ashbury Hts | $1,580,000 | 1355 | $1077 |
| Cow Hollow | $1,525,000 | 1285 | $1160 |
| Russian Hill | $1,480,000 | 1364 | $1147 |
| Noe Valley | $1,462,500 | 1284 | $1132 |
| Mission Dolores | $1,450,000 | 1356 | $1086 |
| Inner/Cent. Richmond | $1,388,000 | 1388 | $1012 |
| Hayes Valley | $1,245,000 | 1163 | $1015 |
| South Beach | $1,180,000 | 1151 | $1073 |
| Inner Mission | $1,140,000 | 1254 | $940 |
| Nob Hill | $1,035,000 | 1077 | $987 |
| Mission Bay | $930,000 | 994 | $1001 |
| Potrero Hill | $925,000 | 950 | $1057 |
| SoMa | $755,000 | 968 | $777 |
| Van Ness/Civic Center | $624,000 | 738 | $821 |
Median sales price is that price at which half the sales occurred for more and half for less, and is affected by a wide variety of factors period to period.
“We read of challenges facing post-pandemic downtowns. The implication is that many big cities are in decline...[however] the latest data, drawn from analyses by Brookings Institution experts...show that big tech cities such as San Francisco, Seattle and New York are significantly rebounding. Their population losses have abated, and they remain major hubs for innovation.
Despite their fluctuating populations in recent years, San Francisco, New York, Los Angeles, Seattle and Boston remain the nation’s artificial intelligence capitals...Nearly one-quarter of the [job] postings were published in the Bay Area. San Francisco is hardly finished being a major tech hub; it’s the new Klondike of the generative AI gold-rush...
In short, the oft-cited ‘urban doom loop’ belies a broader resilience —demographic and economic — among U.S. cities. Yes, they still face challenges, but many are resurgent and even dominant. That’s good for the American economy.”
The Washington Post, America’s big-tech cities are thriving, not dying
by Amy Liu, interim President of the Brookings Institution, October 25, 2023
New Listings Coming on Market
San Francisco Market Dynamics & Seasonality

Per Realtor.com Research: https://www.realtor.com/research/data/, listings posted on site. Data from sources deemed reliable, but may contain errors and subject to revision. May not include “coming-soon” listings. All numbers should be considered approximate.
After the big September increase in new listings, the number plunged in October and will almost certainly continue to decline to its usual nadir in December.
Monthly Home Sales Volume
San Francisco Market Dynamics & Seasonality

Sales of houses, condos, townhouses reported to NorCal MLS Alliance, per Infosparks. Data from sources deemed reliable but may contain errors and subject to revision. Last month estimated based on available information and may change with late reported sales. All numbers approximate.
September’s surge in new listings led to increased sales in October, though still slightly down year over year, and remaining very low by long-term standards. Sales activity can be expected to decline through January before picking up again in the new year. Sales in one month mostly reflect accepted-offer activity in the previous month.
Average Days on Market – Speed of Sale

Sales reported to NorCal MLS Alliance, per Infosparks. Data derived from sources deemed reliable, but may contain errors and subject to revision. All numbers approximate, and may change with late-reported sales.
Measuring how long it takes for sold listings to accept offers. Houses (green line) have significantly lower average days-on-market readings than condos (blue columns). This statistic ebbs and flows seasonally.
Overbidding List Prices in San Francisco
Percentage of Home Sales Closing over List Price, since 2018

Sales data reported to NORCAL MLS® ALLIANCE, per Infosparks. Reflecting the percentage of sales closing at sales prices over the final list prices. Data from sources deemed reliable, but may contain errors and subject to revision. All numbers are approximate, and may change with late-reported sales.
By property type, the % selling over list price in Oct. 2023 for houses was 69%, and for condos, co-ops and TICs, 34%.
Average Sales Price to Original List Price Percentage
San Francisco Over/Under Bidding: Market Dynamics & Seasonality

Sales reported to NorCal MLS Alliance, per Infosparks. Data derived from sources deemed reliable, but may contain errors and subject to revision. All numbers approximate, and may change with late-reported sales.
On average, SF houses (yellow columns) are selling about 7% above asking price, and condos (orange line) about 2% below. This statistic fluctuates by season, and is a lagging indicator of market activity 3-6 weeks earlier.
San Francisco Homes Market
Active & Coming-Soon Listings on 1st of Month*

* Houses, condos, co-ops, TICs, townhouses: Active/Coming-Soon listings posted to NorCal MLS Alliance. Does not include new-project condos not listed on MLS. Data from sources deemed reliable, but may contain errors and subject to revision. All numbers approximate. The # of active listings changes constantly.
Of the listings for sale on November 1, 2023 31% were houses, and 69% were condos, co-ops, TICs & townhouses.
The # of active listings on a given day is affected by 1) the # of new listings coming on market, 2) how quickly buyers put them into contract, 3) the sustained heat of the market over time, and 4) sellers pulling their homes off the market without selling.
San Francisco: Homes for Sale
Active & Coming-Soon Listings by Price Segment*

*Active & coming-soon listings posted to NorCal MLS Alliance as of 10/31/23. Not all homes for sale are posted to MLS, especially many new-project condo listings. Data from sources deemed reliable, but may contain errors and subject to revision. Numbers change constantly, and all numbers approximate.
There are many more condo, co-op and TIC listings than house listings, and they especially dominate the under $1,500,000 price segments, but the city also has by far the largest luxury and ultra-luxury condo/co-op market in the Bay Area.
Generally speaking, the house market has had significantly stronger market dynamics – higher demand, lower inventory – than other property types.
Active Listings on Market – Longer-Term Trends
San Francisco Market Dynamics & Seasonality

Per Realtor.com Research: https://www.realtor.com/research/data/, house and condo listings posted on site. May not include coming-soon listings. Data from sources deemed reliable, but may contain errors and subject to revision. All numbers approximate.
This is a snapshot measure of how many active listings can be expected on any given day of the specified month.
The number of active listings on a given day is affected by 1) how many new listings come on market, 2) how quickly buyers snap them up, 3) the sustained heat of the market over time, and 4) how many sellers pull their homes off the market without selling. The number typically ebbs and flows by season.
Listings Pending Sale (in Contract, Offer Accepted)

Per Realtor.com Research: https://www.realtor.com/research/data/, house and condo listings posted on site. Data from sources deemed reliable, but may contain errors and subject to revision. All numbers are approximate.
This is a snapshot measure of how many pending listings can be expected on any given day of the specified month.
After the September jump in new listings, the number of listings going into contract increased in October – but remained very low by long-term norms.
The # of listings going into contract measures buyer demand, but is also deeply impacted by the supply of new listings available to buy.
San Francisco Higher-Price Home Sales*
Homes Selling for $3 Million+ & $5 Million+

*Houses, condos, co-ops, townhouses, TICs: Sales reported to NorCal MLS Alliance, per Infosparks. Does not include sales unreported to MLS. Data from sources deemed reliable but may contain errors and subject to revision. All numbers approximate, and may change with late-reported activity.
As is typical, with the September increase in new listings, October saw a big rebound in luxury home sales from summer – to a YTD high. Sales were slightly increased on a year-over-year basis.
The number of higher-price sales typically ebbs and flows dramatically by season, with spring usually the biggest selling season, and mid-winter the slowest. There is usually a spike up in sales in fall.
Price Reductions on Active Listings
San Francisco Market Dynamics & Seasonality

Per Realtor.com Research: https://www.realtor.com/research/data/, listings posted to site. Data from sources deemed reliable, but may contain errors and subject to revision. All numbers approximate.
The number of price reductions typically ebbs and flows by season, but can also be affected by specific events in the economy and the market. It’s not unusual for price reductions to peak in October before the mid-winter holiday slowdown begins in mid-November.
San Francisco: Not Every Home Sells
Listings Taken Off Market Without Selling
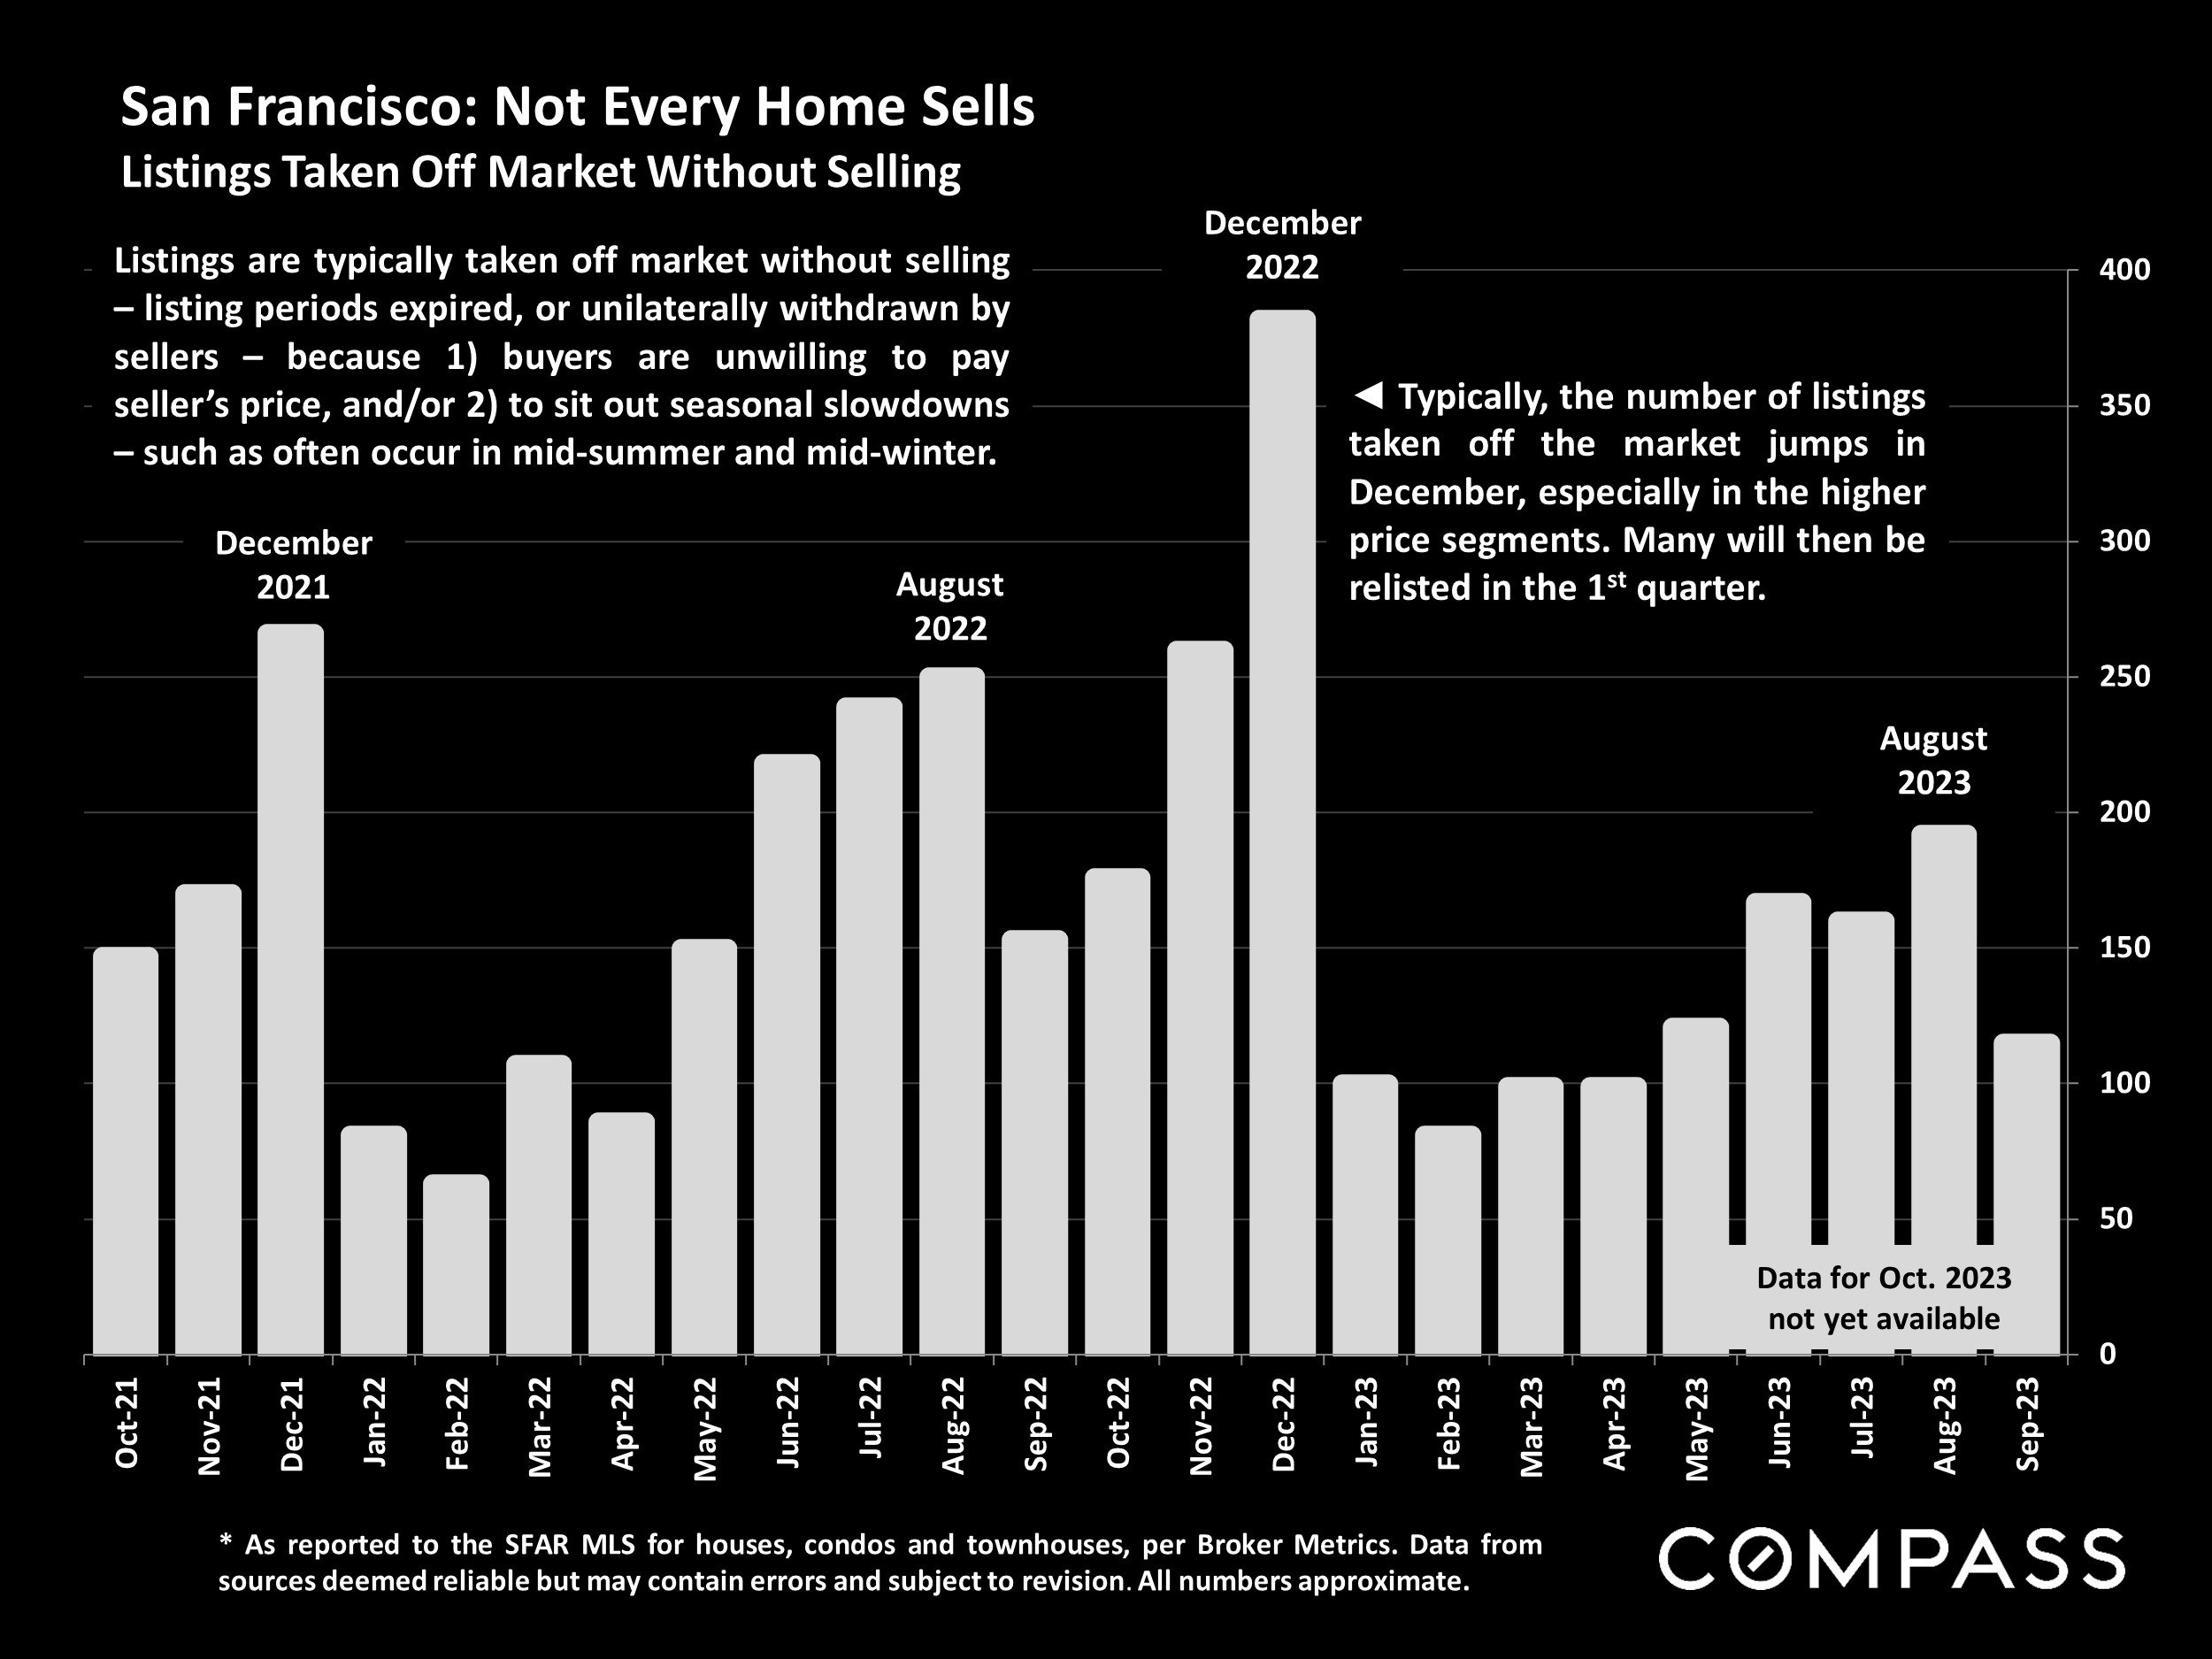
* As reported to the SFAR MLS for houses, condos and townhouses, per Broker Metrics. Data from sources deemed reliable but may contain errors and subject to revision. All numbers approximate.
Listings are typically taken off market without selling – listing periods expired, or unilaterally withdrawn by sellers – because 1) buyers are unwilling to pay seller’s price, and/or 2) to sit out seasonal slowdowns, such as often occur in mid-summer and mid-winter.
Typically, the number of listings taken off the market jumps in December, especially in the higher price segments. Many will then be relisted in the 1st quarter.
U.S. Percentage of All-Cash Buyers
National Market Dynamics since 2015, by Month*

*Realtors® Confidence Index Survey. Data copyright, National Association of Realtors®. All rights reserved. Used with permission. 3-month rolling average of NAR data. All numbers are approximate good-faith estimates based on a survey of Realtors. Data from sources deemed reliable, but may contain errors and subject to revision.
Probably due to recent increases in interest rates, national all-cash purchases in September 2023 hit their highest point as a percentage of total sales - 29% - in 9 years.
People Moving Out of CA to Another State in 2022
California Migration Trends - U.S. Census Estimates*

*Per U.S. census 1-Year ACS estimates published 10/19/23: Estimates published with margins of error. https://www.census.gov/topics/population/migration/guidance/state-to-state-migration-flows.html. Data from sources deemed reliable but may contain errors and subject to revision. All numbers approximate.
States receiving the highest number of residents LEAVING California in 2022. Note that there is heavy two-way traffic between CA and many of these states.
2022 Summary 1-Year Estimates*
Population Migration Changes:
CA residents moving to other states: 817,669
Moving to CA from another state: 475,803
Moving to CA from abroad/U.S. islands: 303,113
CA residents moving within state: 9%
CA residents moving to another state: 2%
CA residents who didn't move: 89%
Includes both homeowners and renters; estimates did not include moves from CA to foreign countries; population numbers are also affected by birth and death rates.
People Moving to CA from Another State in 2022
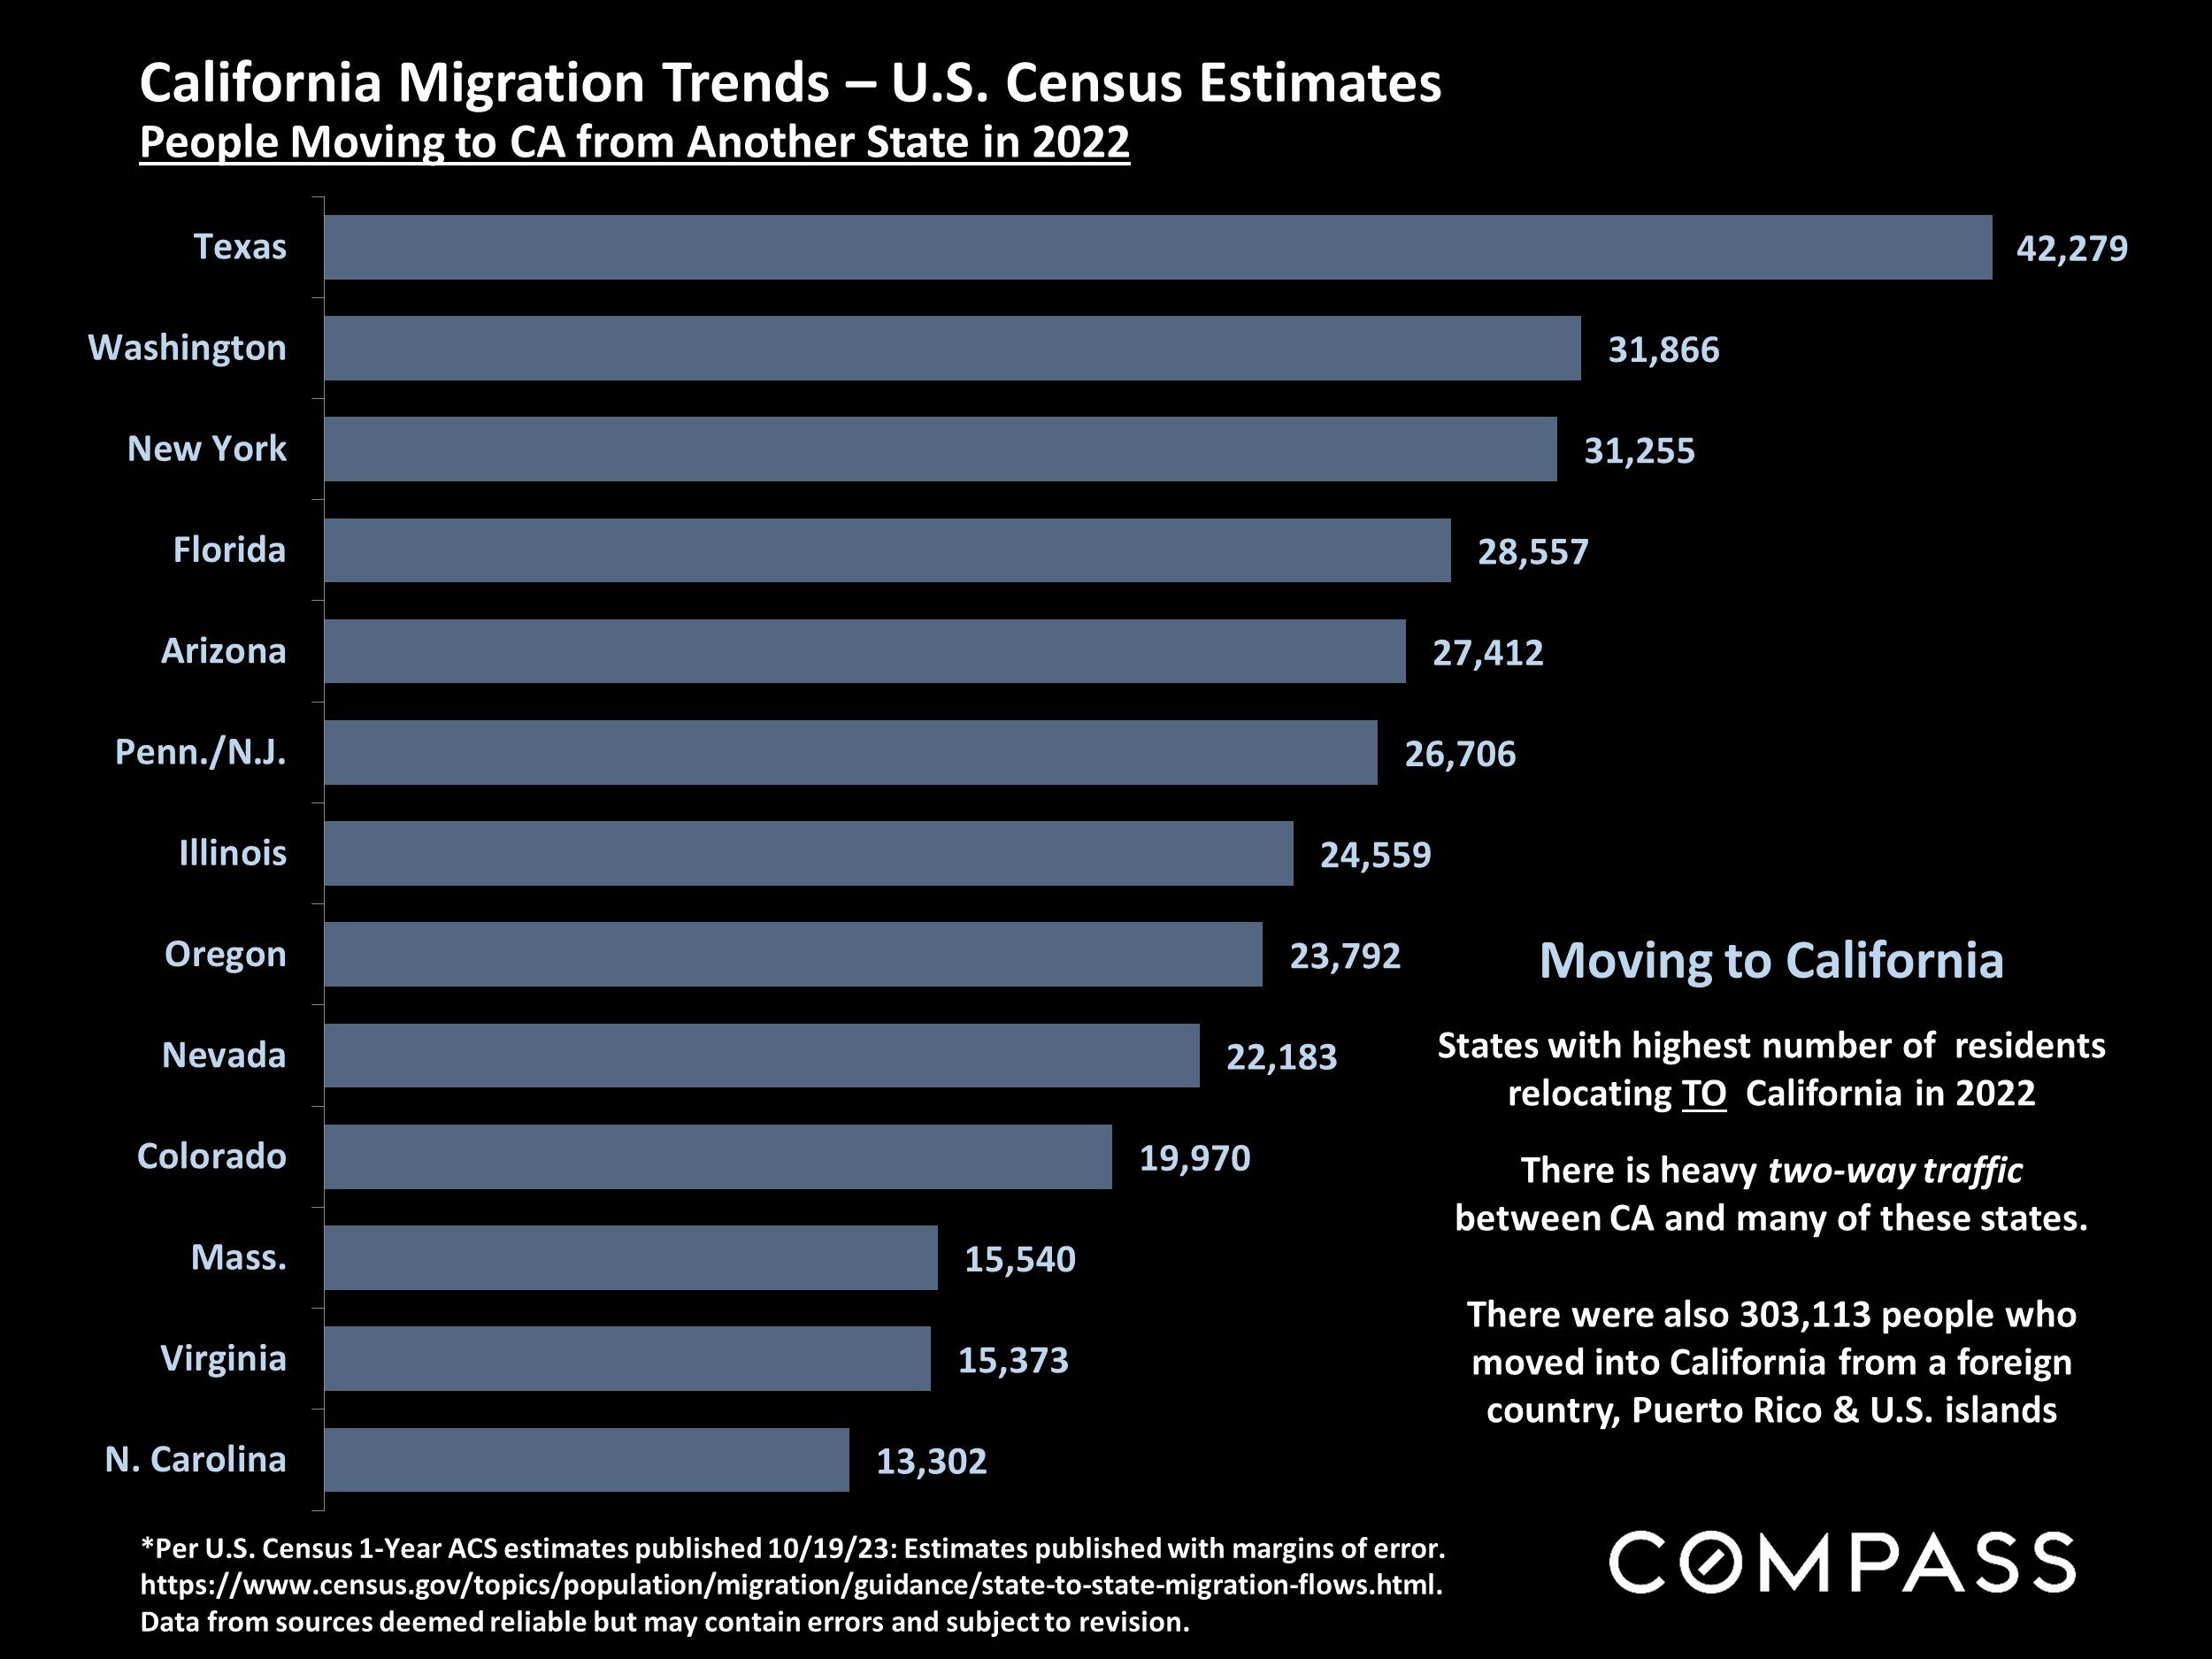
States with the highest number of residents relocating to California in 2022. Note that there is heavy two-way traffic between CA and many of these states.
There were also 303,113 people who moved into California from a foreign country, Puerto Rico, and U.S. islands.
Statistics are generalities, essentially summaries of widely disparate data generated by dozens, hundreds or thousands of unique, individual sales occurring within different time periods. They are best seen not as precise measurements, but as broad, comparative indicators, with reasonable margins of error. Anomalous fluctuations in statistics are not uncommon, especially in smaller, expensive market segments. Last period data should be considered estimates that may change with late-reported data. Different analytics programs sometimes define statistics – such as “active listings,” “days on market,” and “months supply of inventory” – differently: what is most meaningful are not specific calculations but the trends they illustrate. Most listing and sales data derives from the local or regional multi-listing service (MLS) of the area specified in the analysis, but not all listings or sales are reported to MLS and these won’t be reflected in the data. “Homes” signifies real-property, single-household housing units: houses, condos, co-ops, townhouses, duets and TICs (but not mobile homes), as applicable to each market. City/town names refer specifically to the named cities and towns, unless otherwise delineated. Multi-county metro areas will be specified as such. Data from sources deemed reliable, but may contain errors and subject to revision. All numbers to be considered approximate.
Many aspects of value cannot be adequately reflected in median and average statistics: curb appeal, age, condition, amenities, views, lot size, quality of outdoor space, “bonus” rooms, additional parking, quality of location within the neighborhood, and so on. How any of these statistics apply to any particular home is unknown without a specific comparative market analysis.
Median Sales Price is that price at which half the properties sold for more and half for less. It may be affected by seasonality, “unusual” events, or changes in inventory and buying trends, as well as by changes in fair market value. The median sales price for an area will often conceal an enormous variety of sales prices in the underlying individual sales.
Dollar per Square Foot is based upon the home’s interior living space and does not include garages, unfinished attics and basements, rooms built without permit, patios, decks or yards (though all those can add value to a home). These figures are usually derived from appraisals or tax records, but are sometimes unreliable (especially for older homes) or unreported altogether. The calculation can only be made on those home sales that reported square footage.
Photo use under the Creative Commons License: https://creativecommons.org/licenses/by-sa/2.0/
Compass is a real estate broker licensed by the State of California, DRE 01527235. Equal Housing Opportunity. This report has been prepared solely for information purposes. The information herein is based on or derived from information generally available to the public and/or from sources believed to be reliable. No representation or warranty can be given with respect to the accuracy or completeness of the information. Compass disclaims any and all liability relating to this report, including without limitation any express or implied representations or warranties for statements contained in, and omissions from, the report. Nothing contained herein is intended to be or should be read as any regulatory, legal, tax, accounting or other advice and Compass does not provide such advice. All opinions are subject to change without notice. Compass makes no representation regarding the accuracy of any statements regarding any references to the laws, statutes or regulations of any state are those of the author(s). Past performance is no guarantee of future results.