Overall Market Sentiment

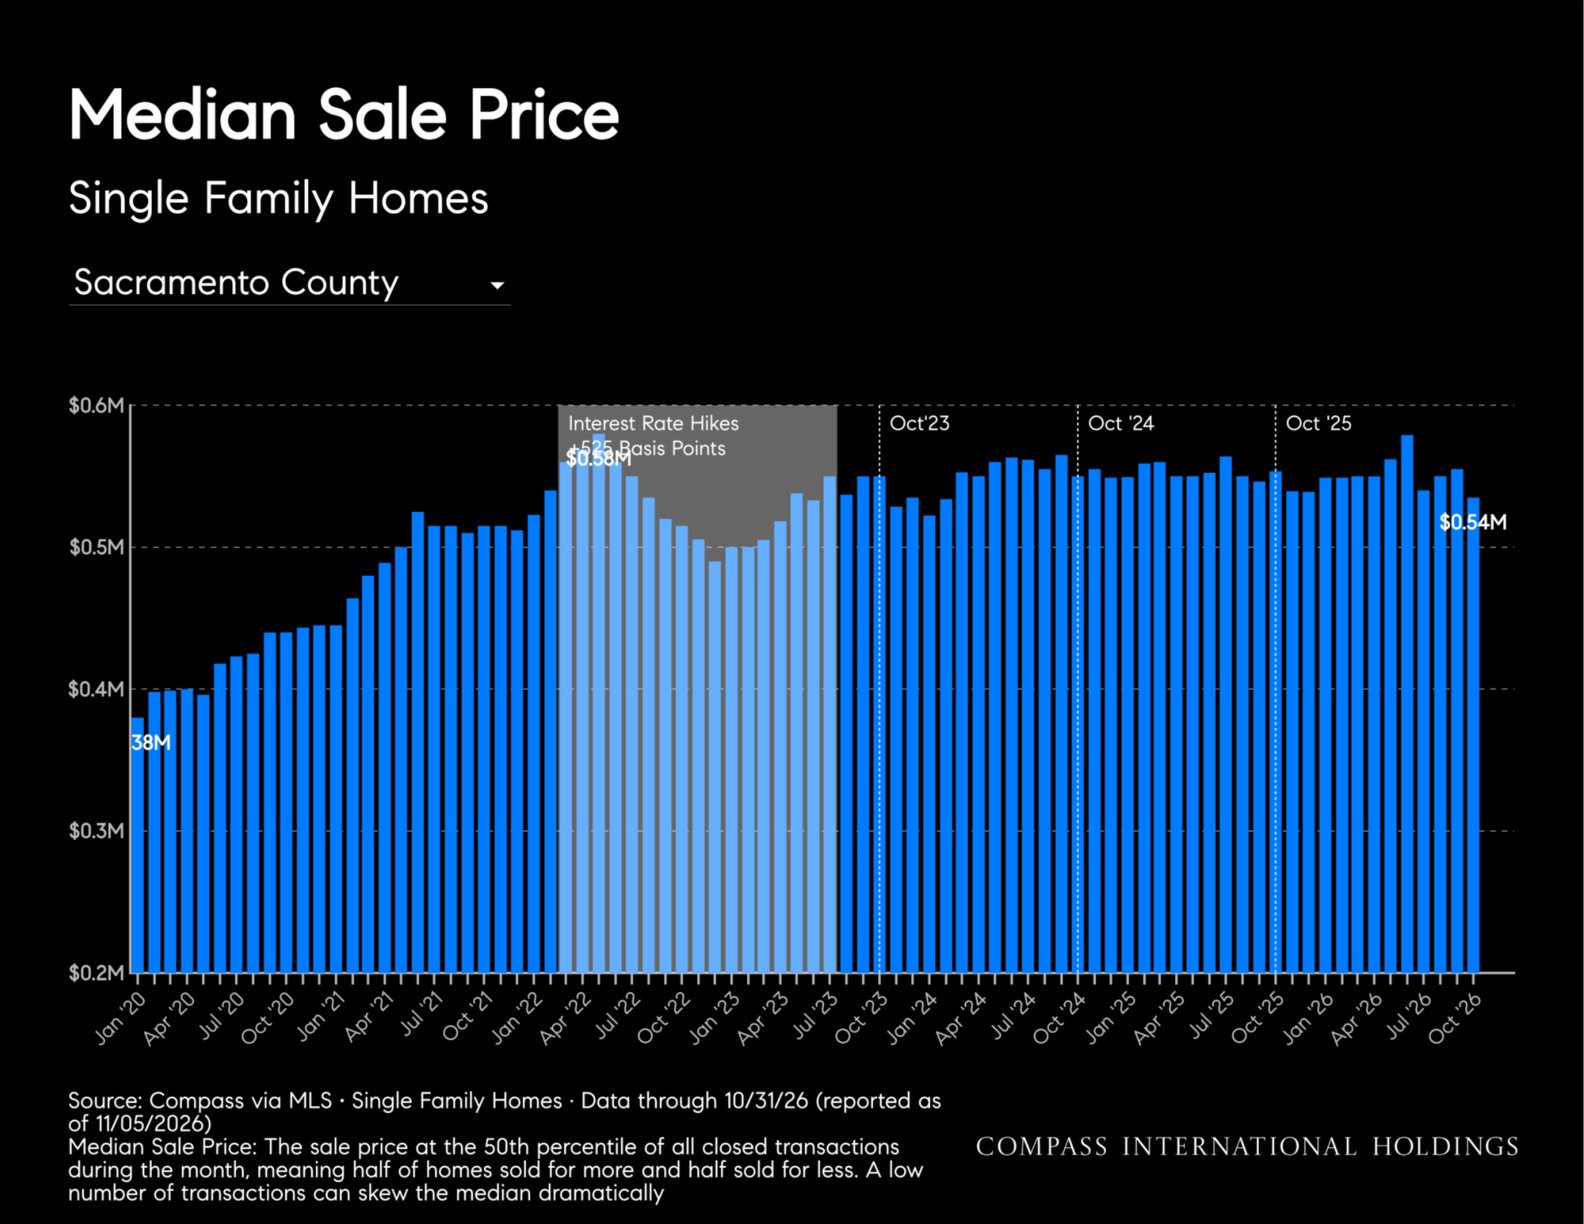
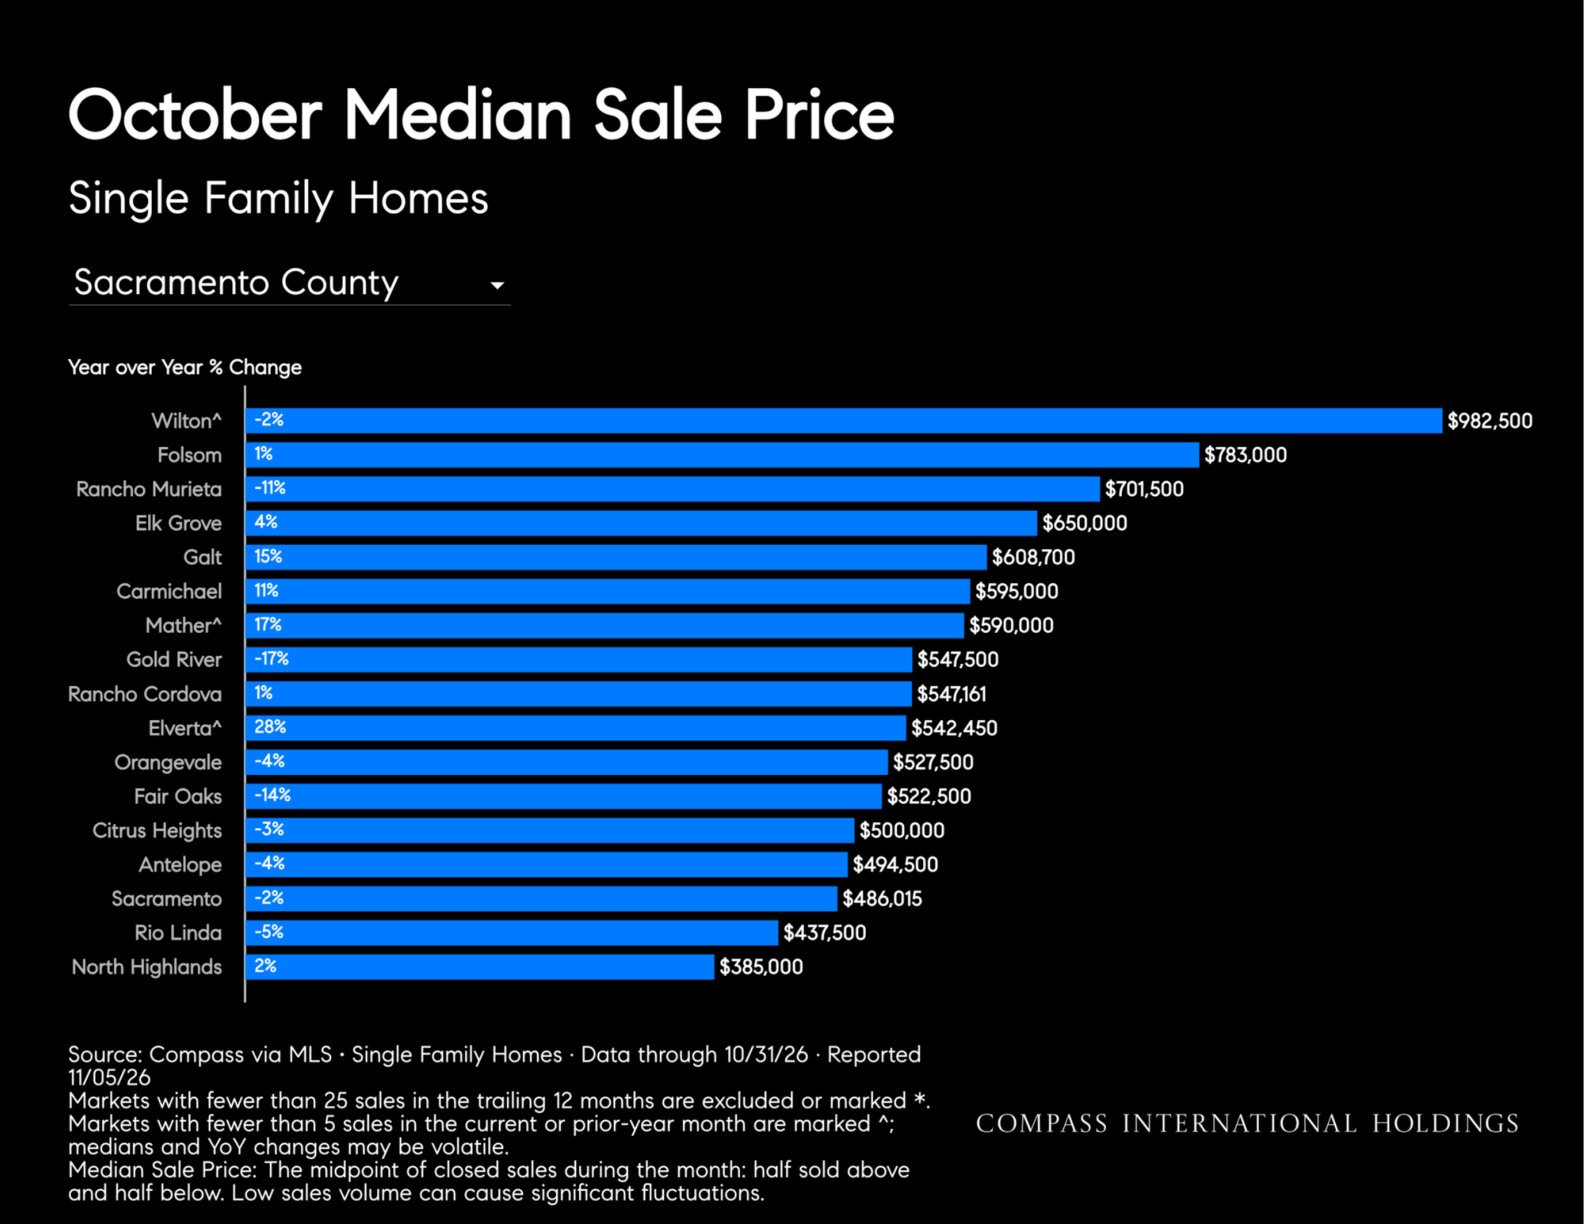
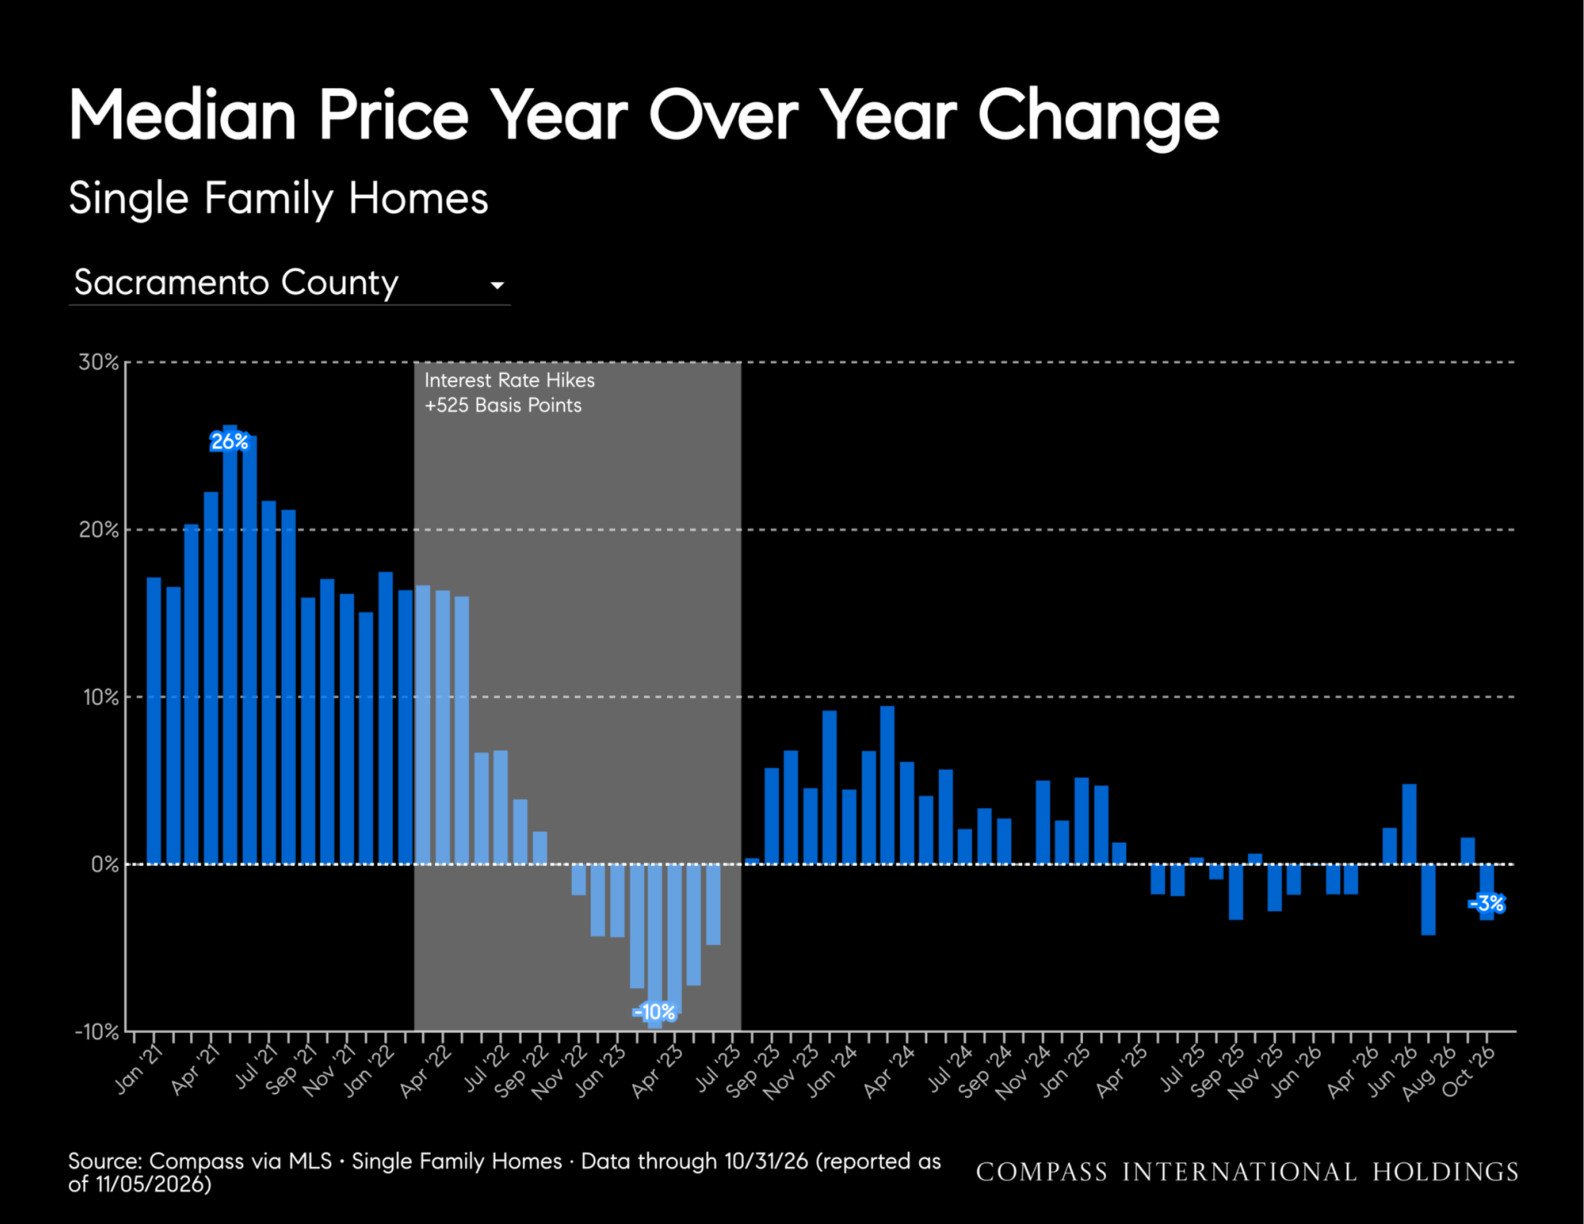
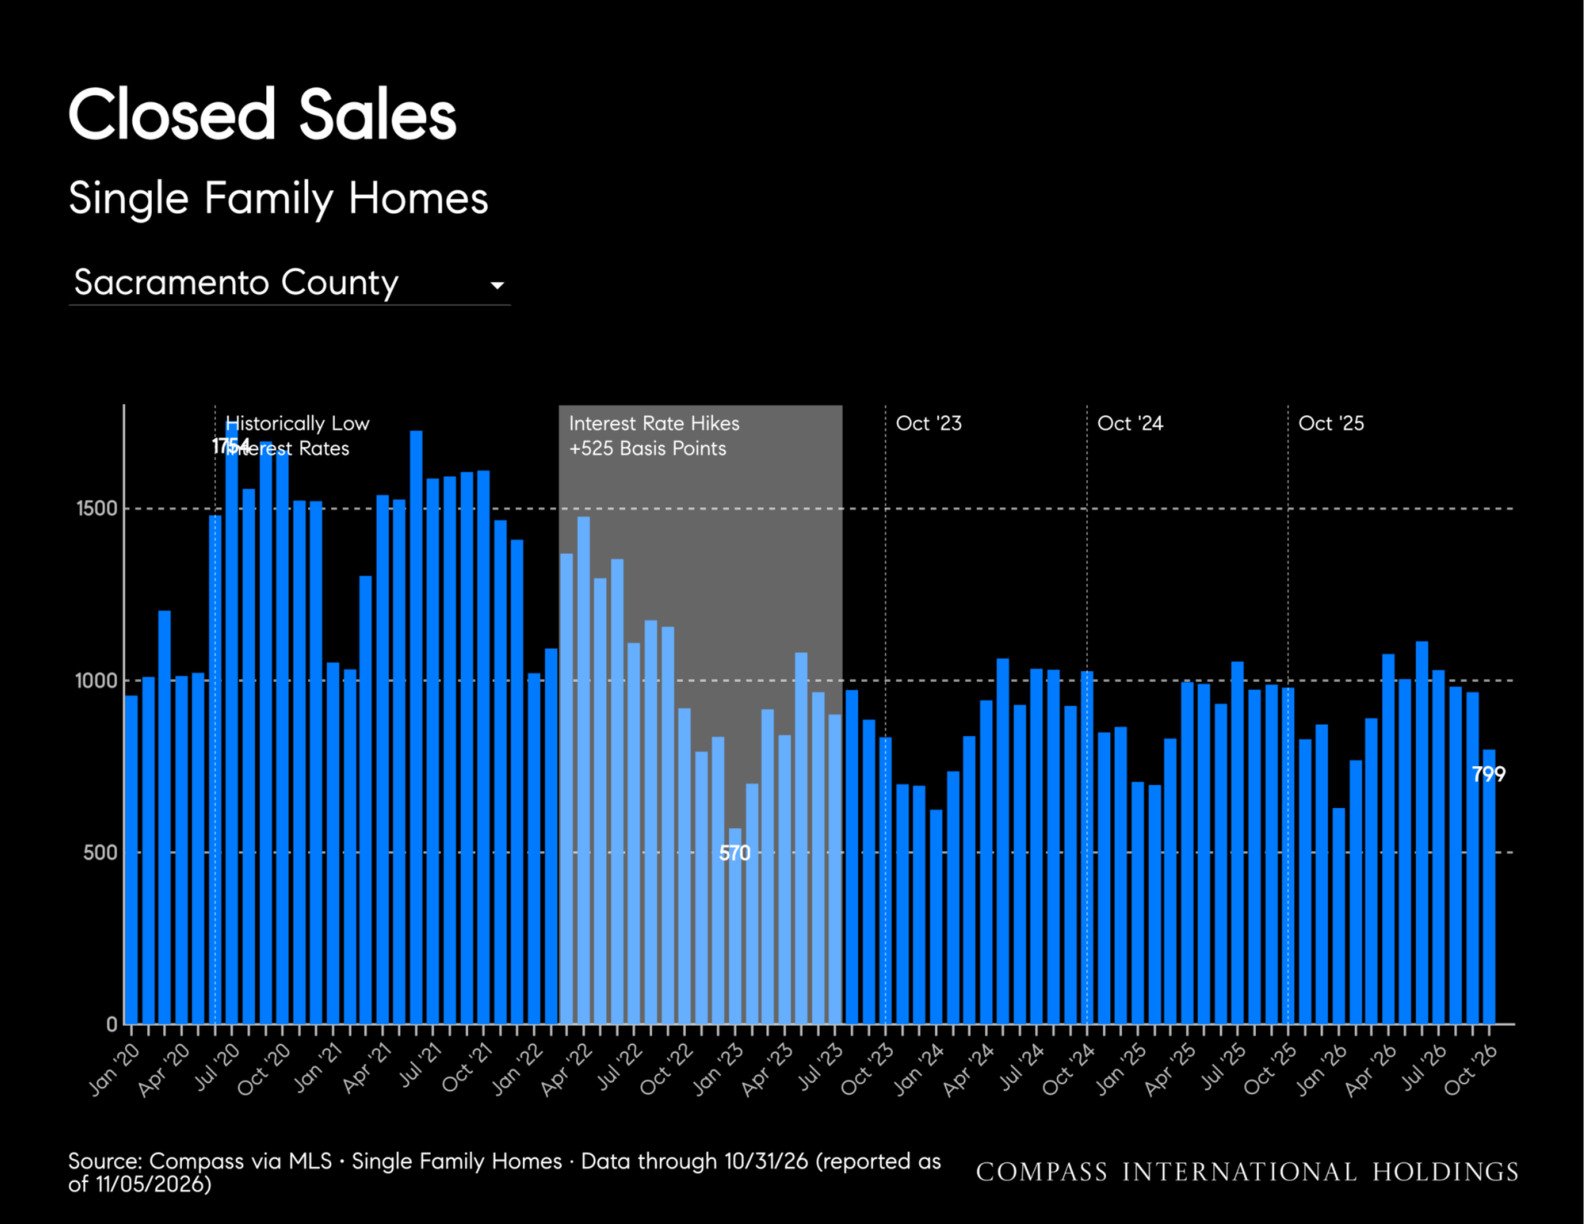
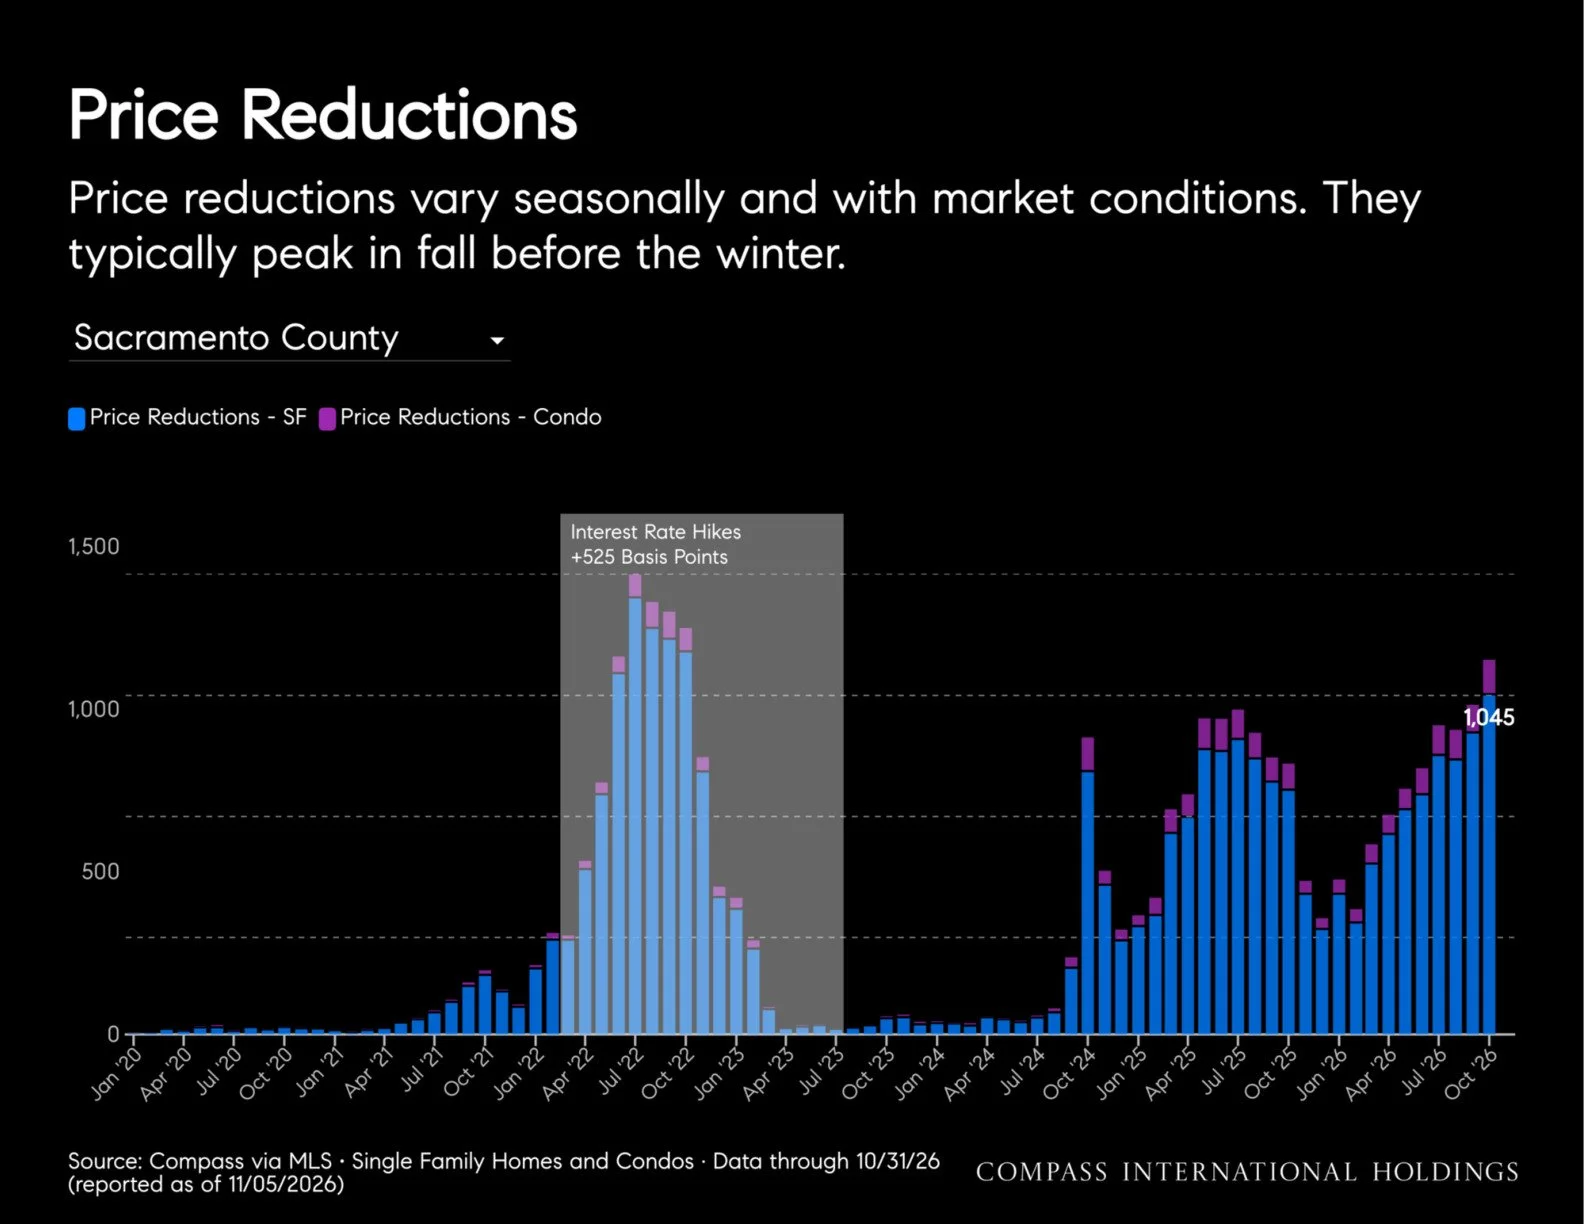
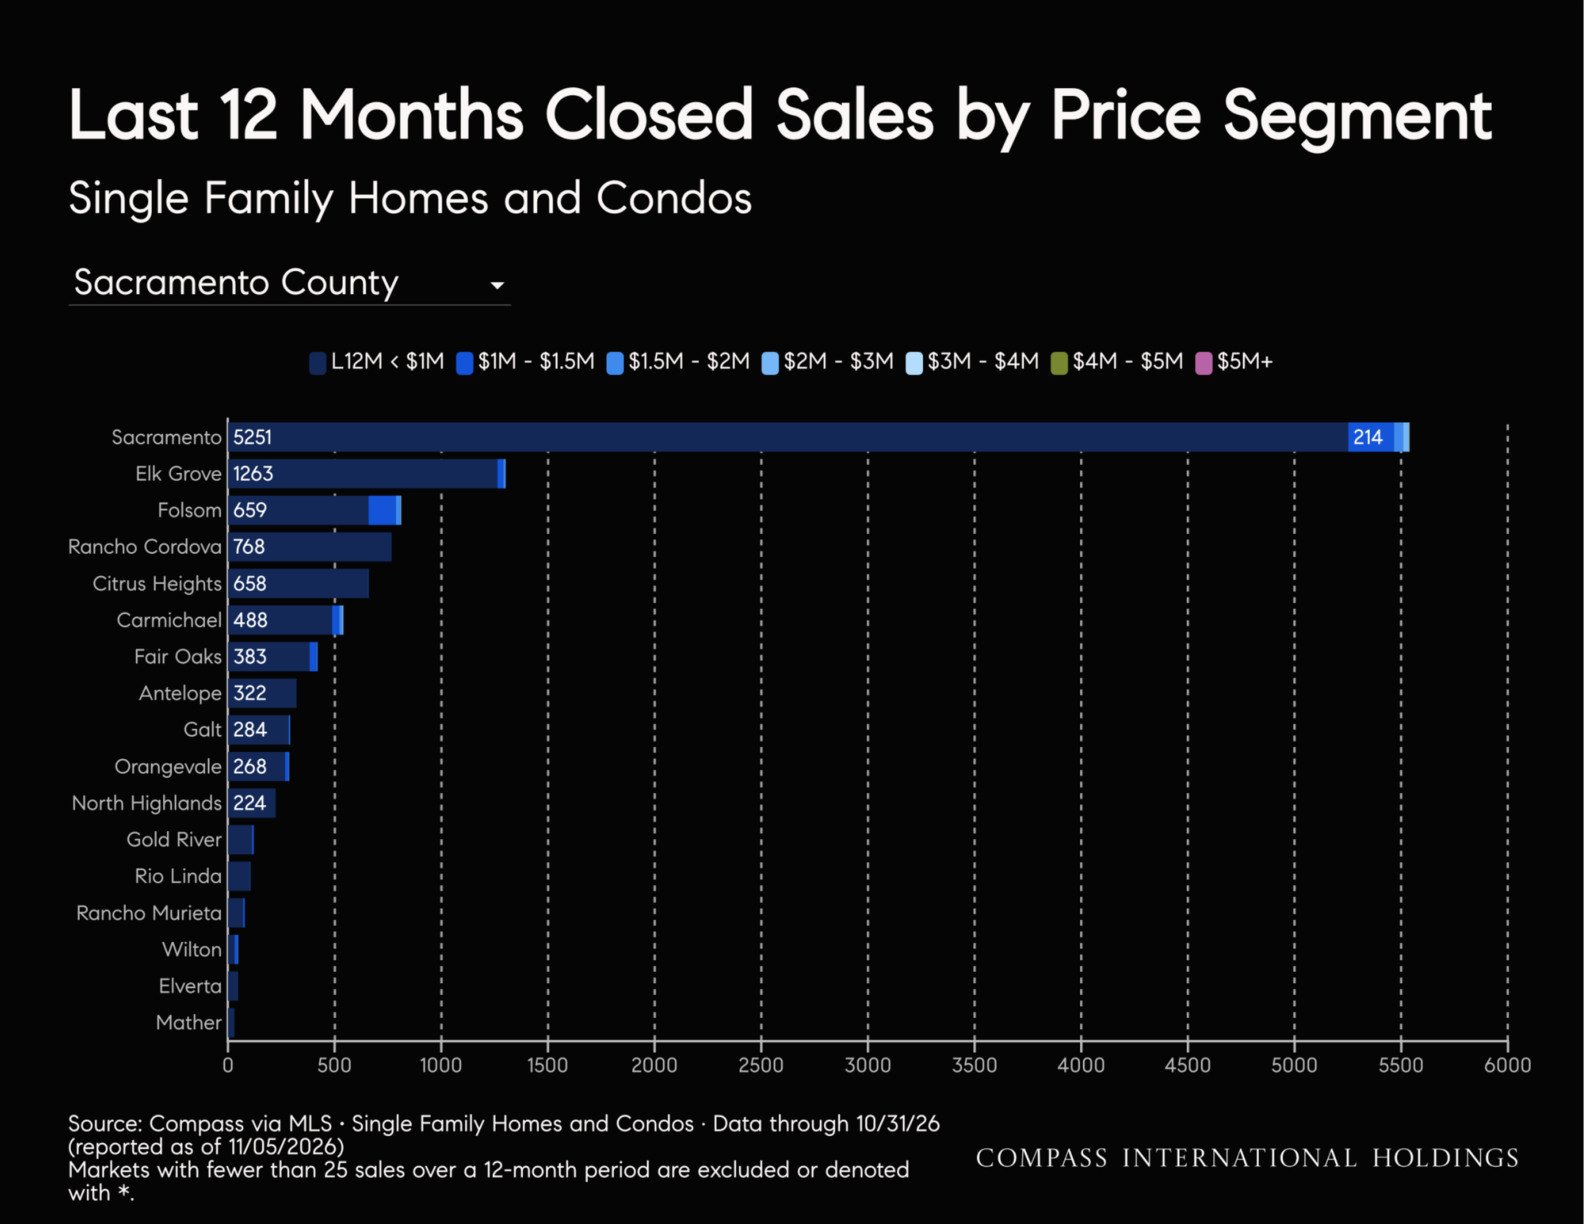
Sacramento County softened further in October as inventory built and sales slowed. Active single-family listings rose 12% from a year ago to 2,544 and months of supply rose to 3.2, both the highest of any month since at least 2020. Closings fell 18% to 799, the fewest for an October since at least 2020, and price reductions rose 39%, pushing the reduction rate to 42%. The median fell 3% to $535,000, so buyers have more choice and leverage than a year ago. Condos were weaker still.
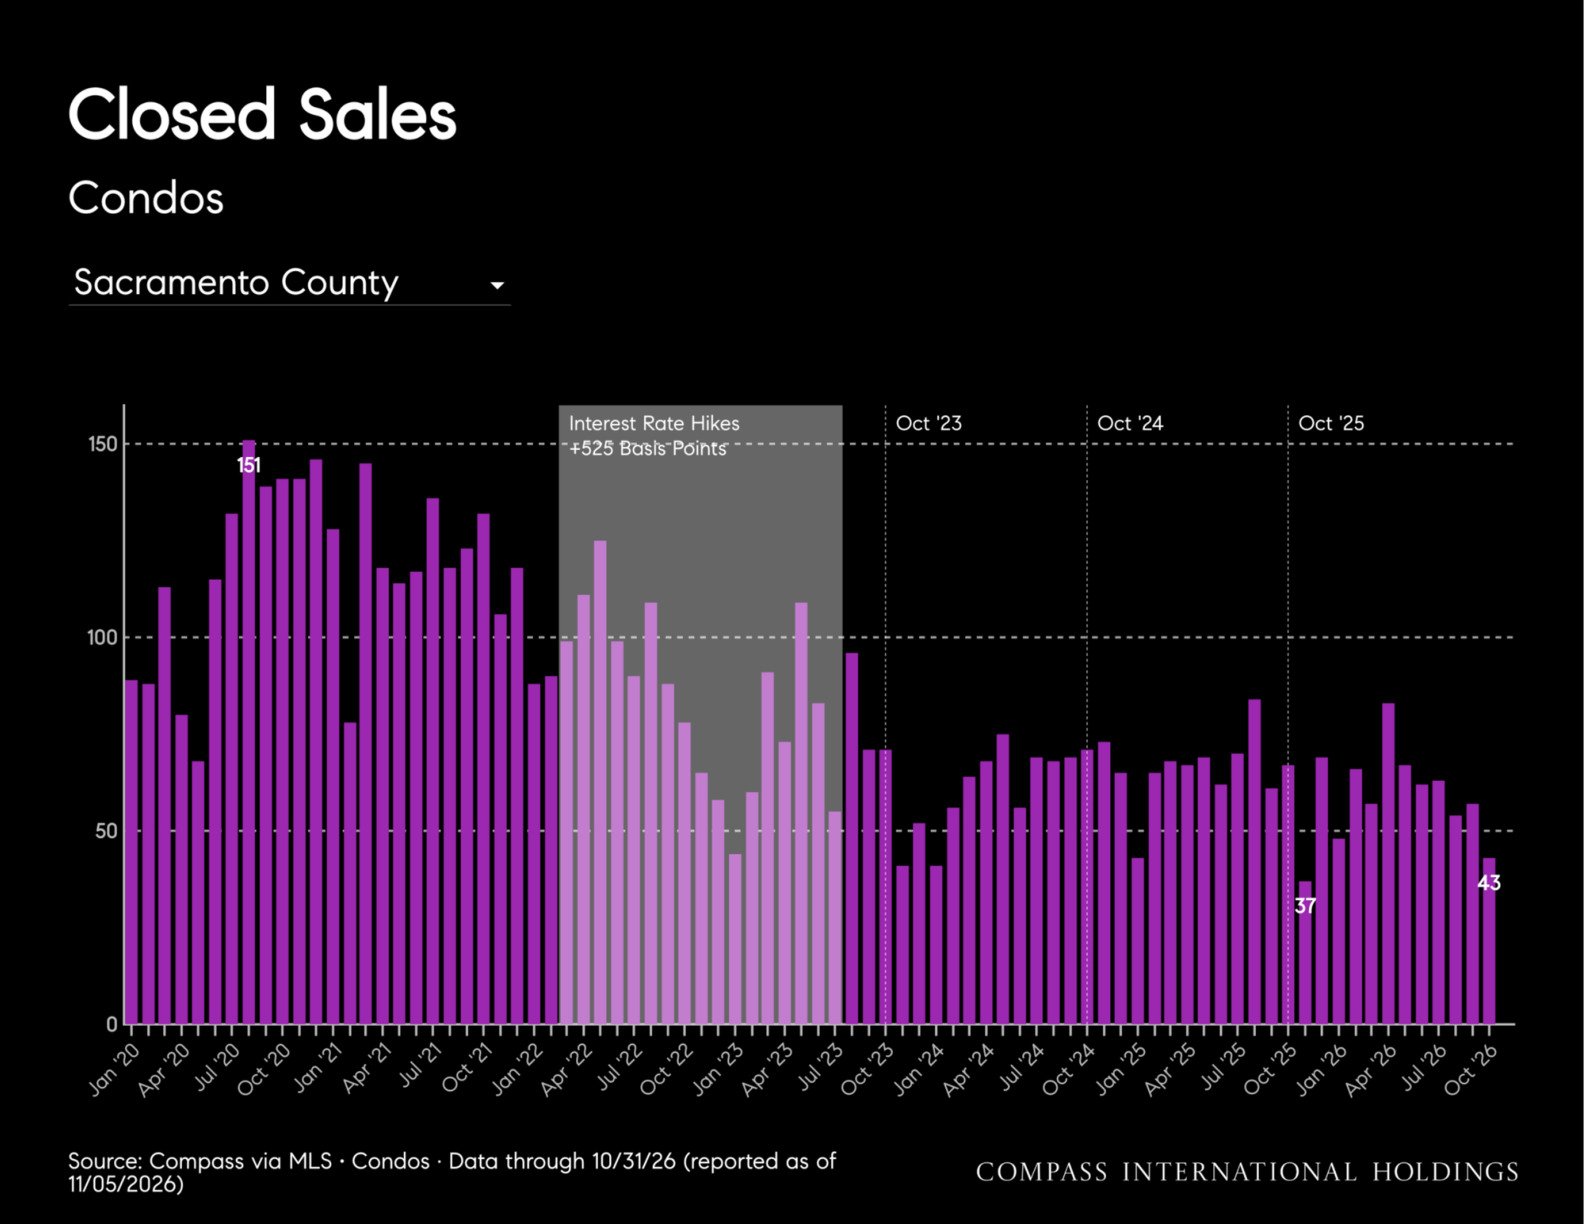
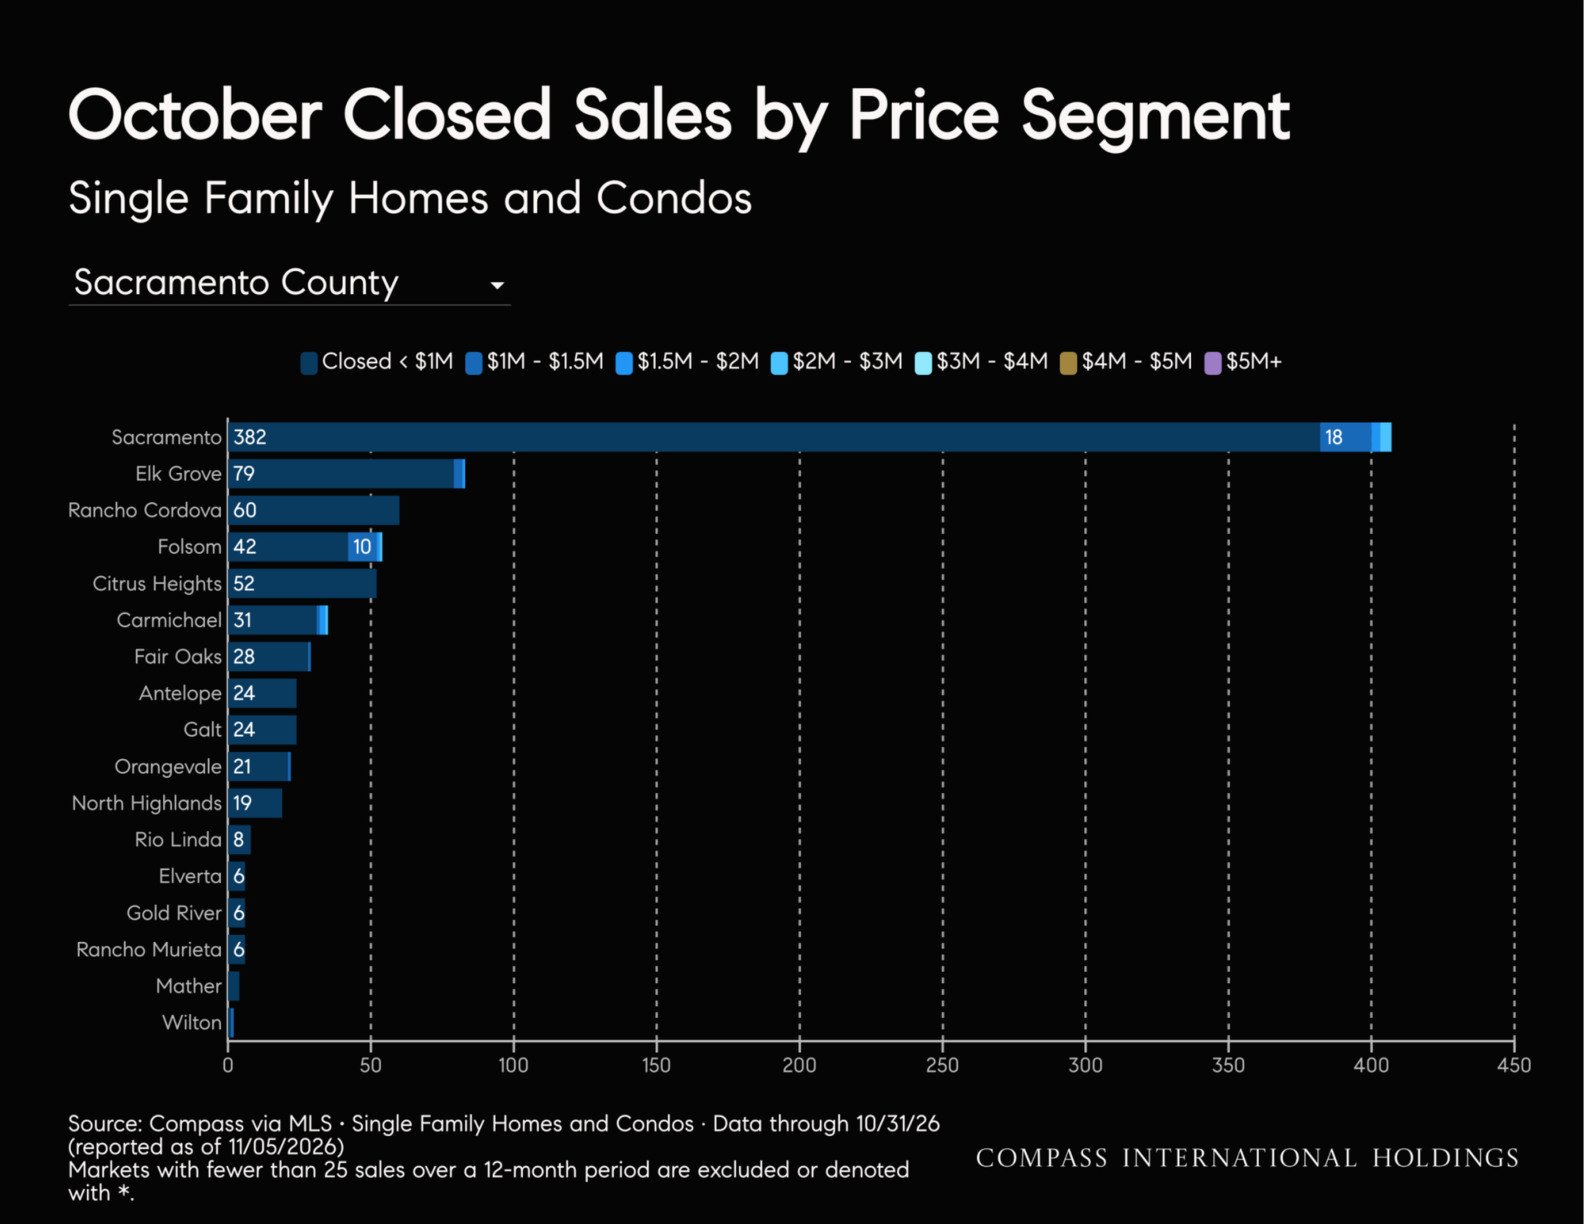
Sales: 799 single-family homes closed in October, down 18% YoY and down 17% from September. Condo closings fell 36% YoY to 43, the fewest for an October since at least 2020.
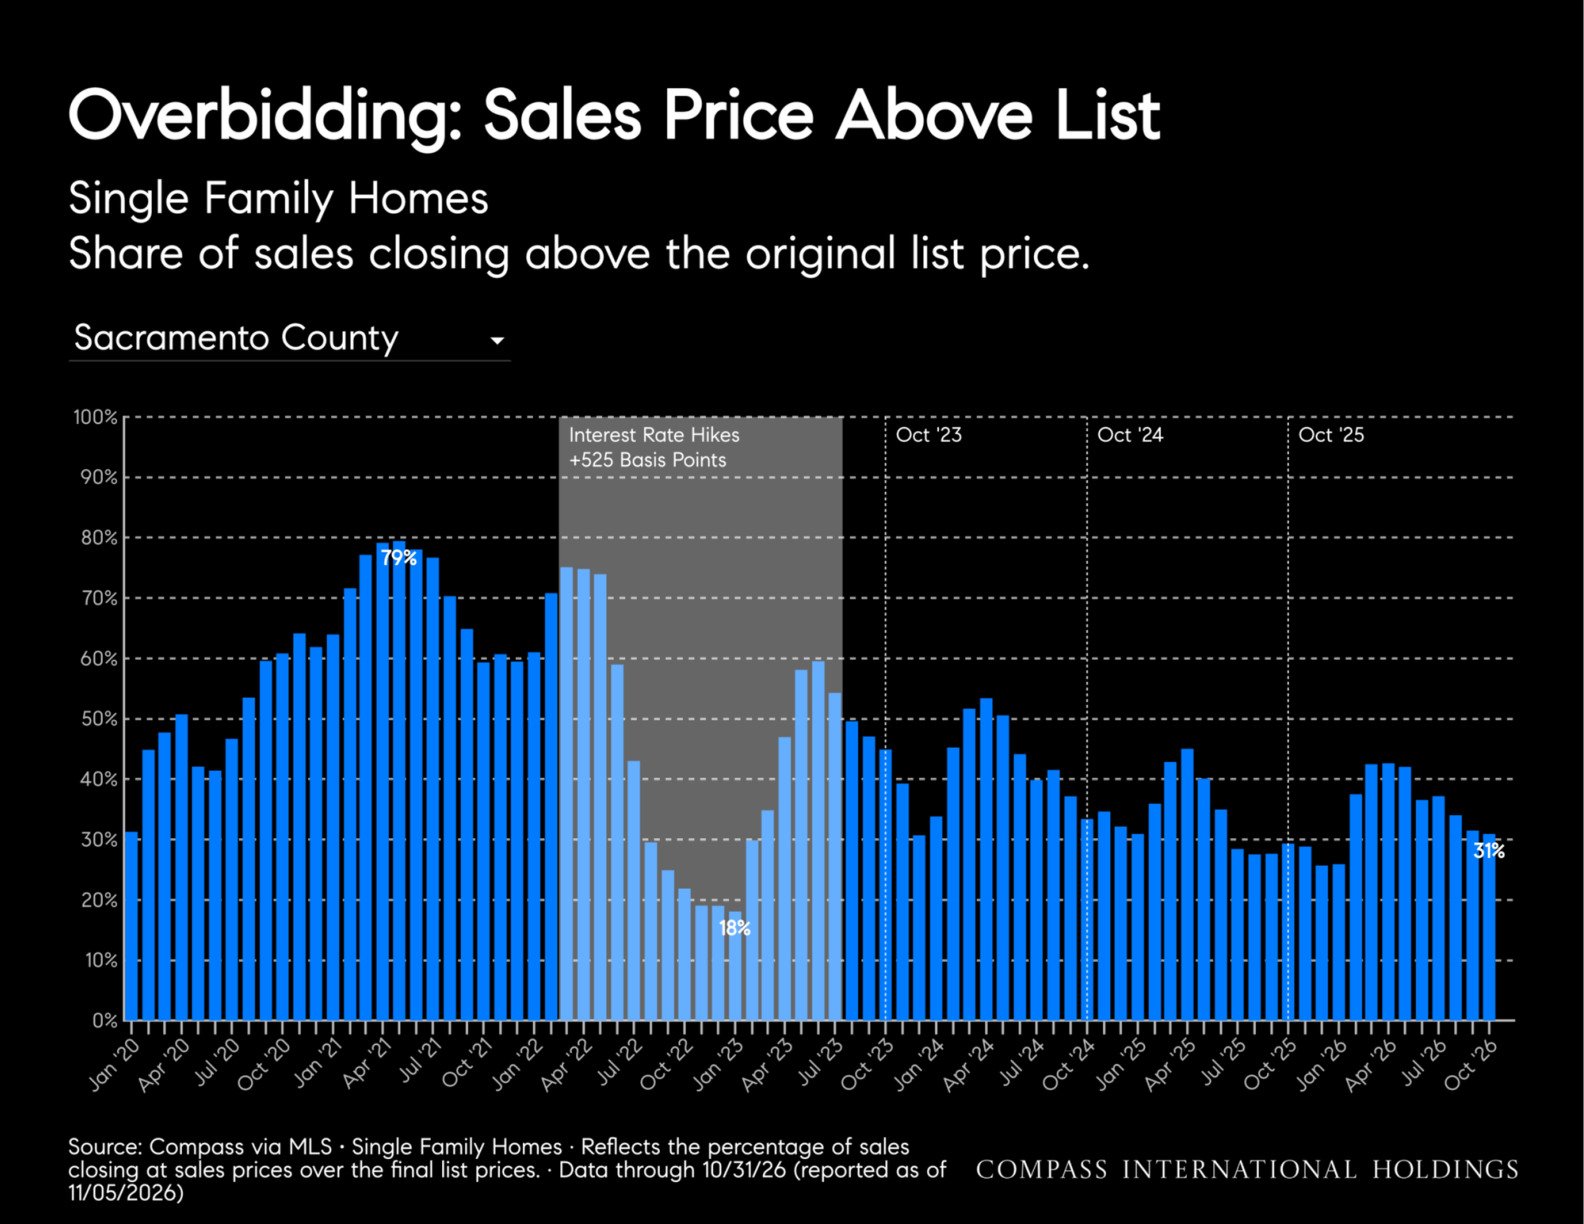
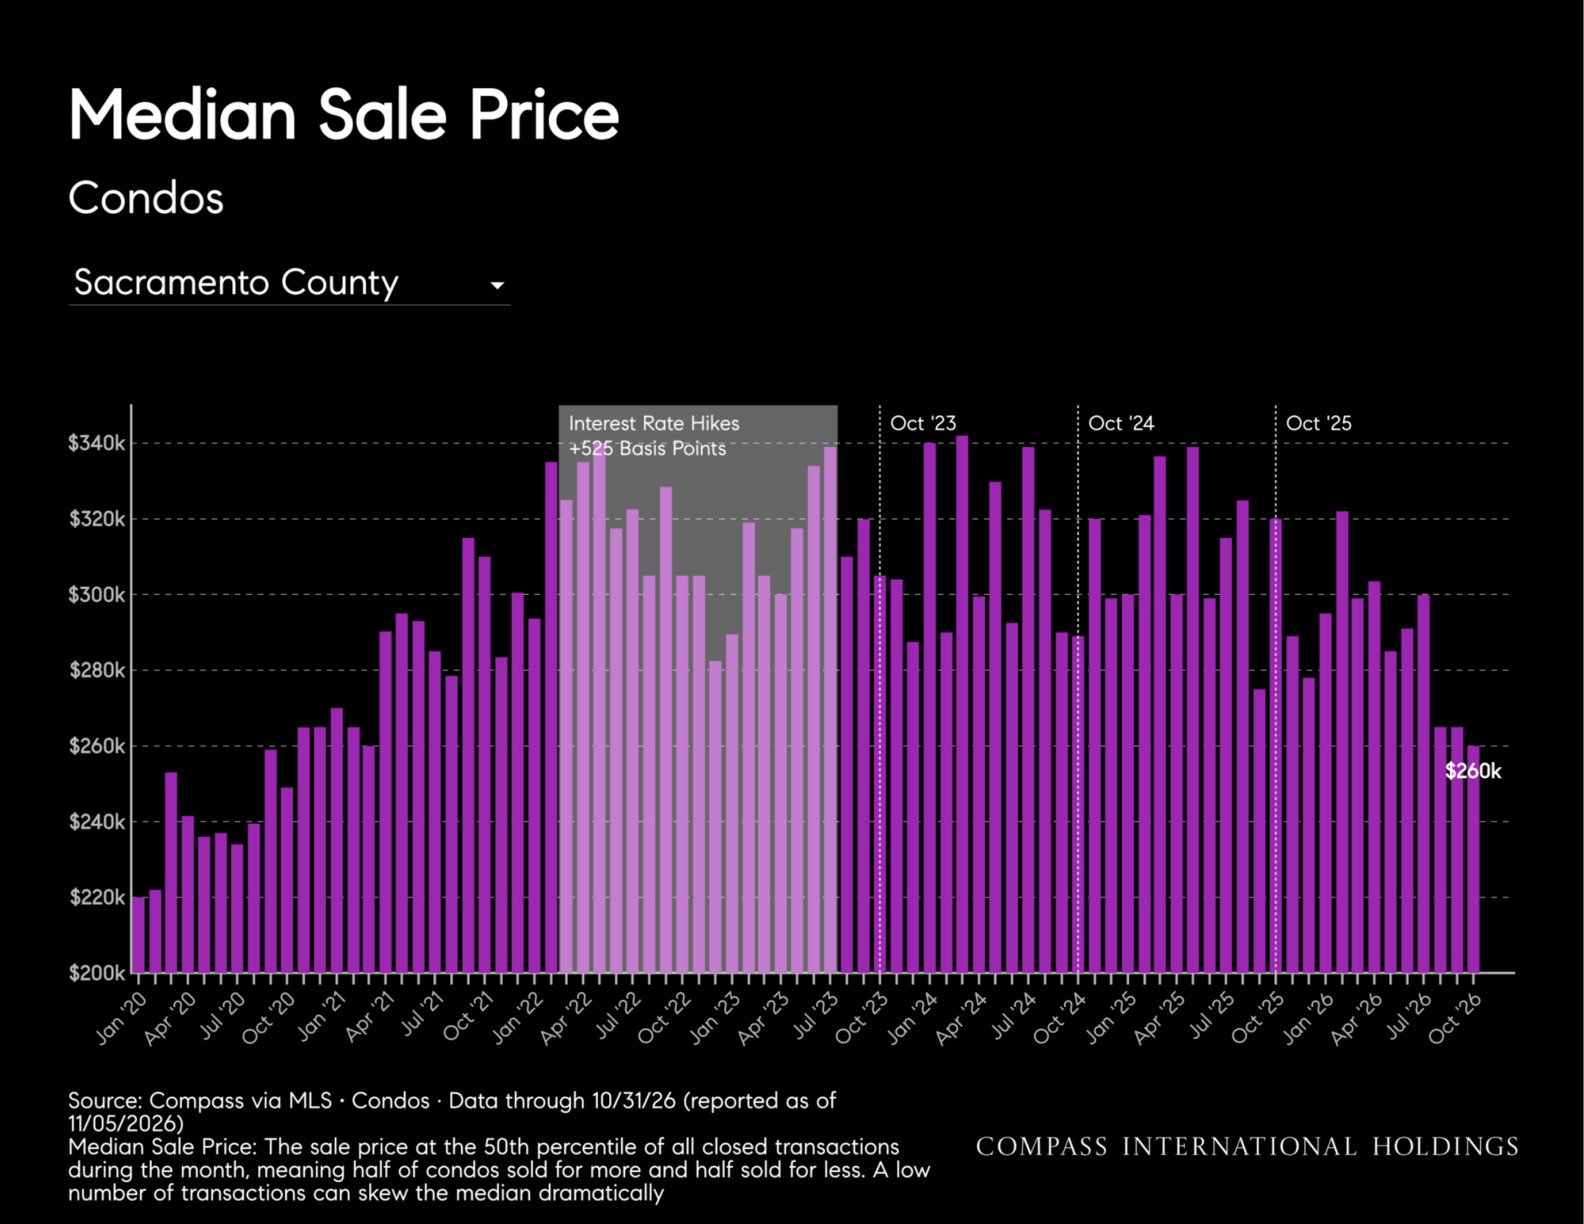
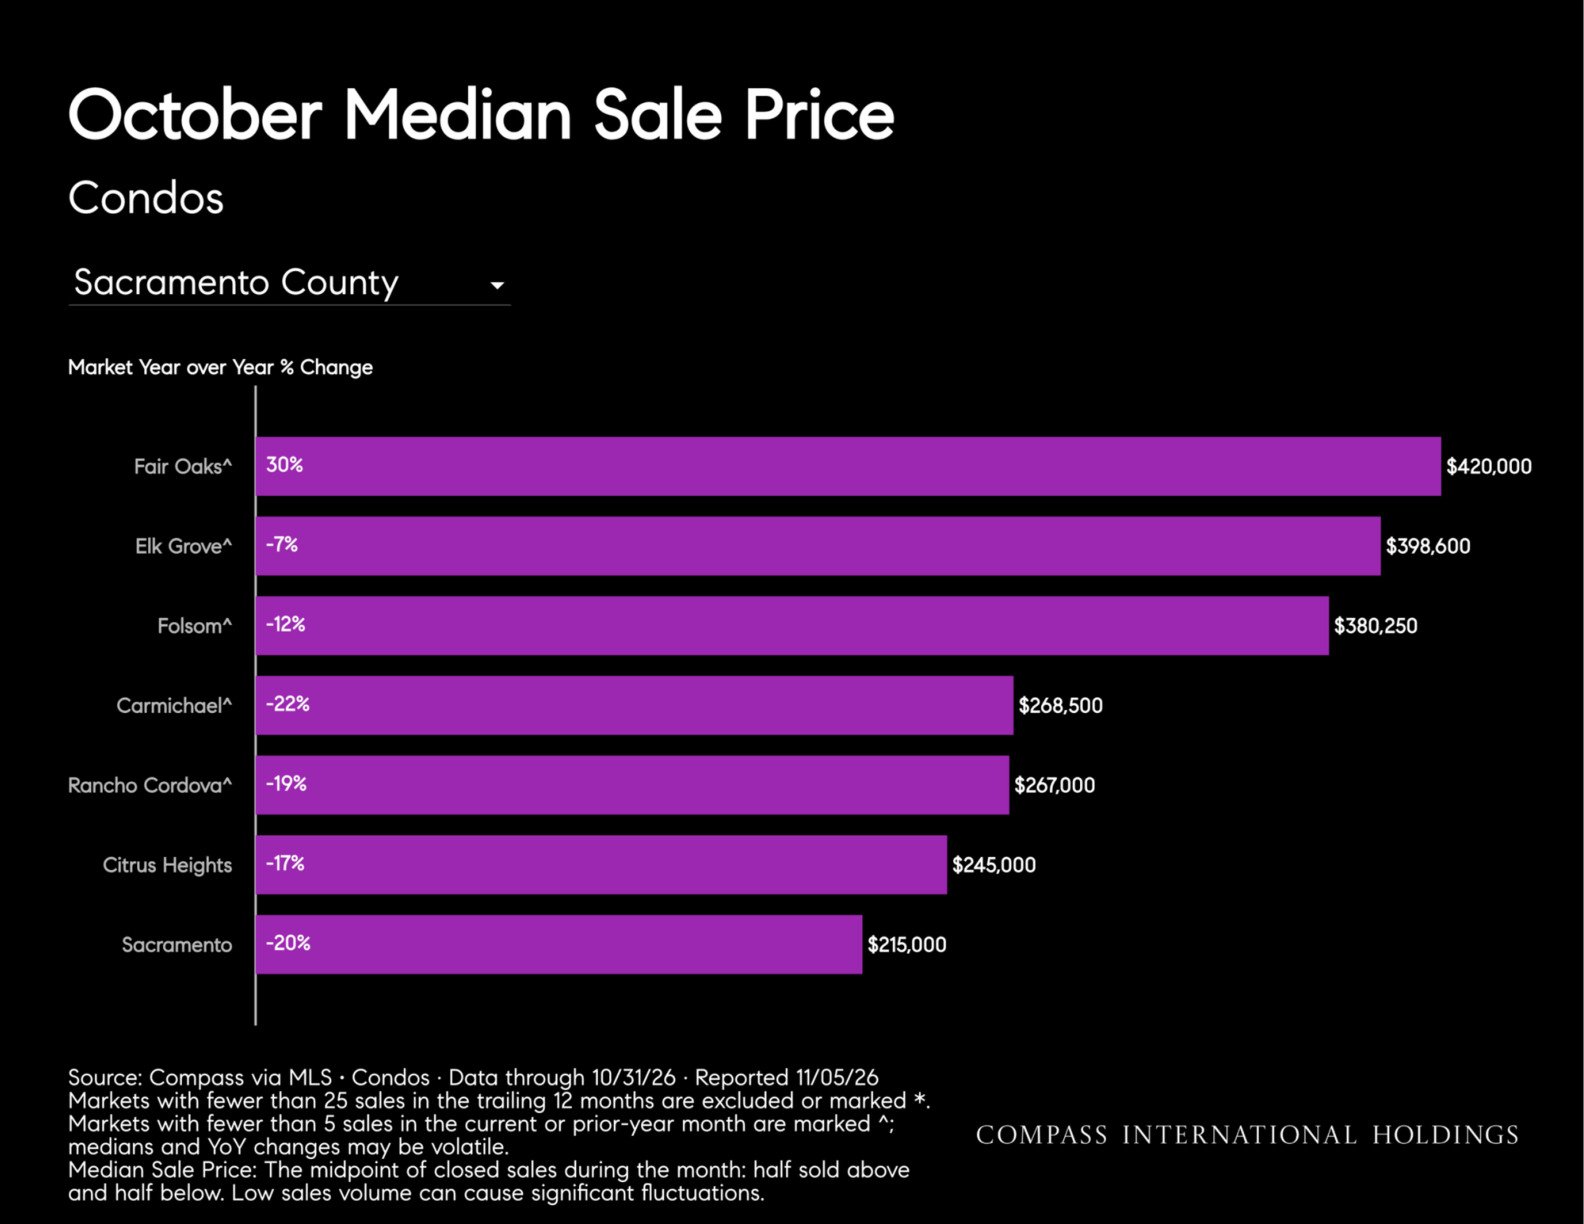
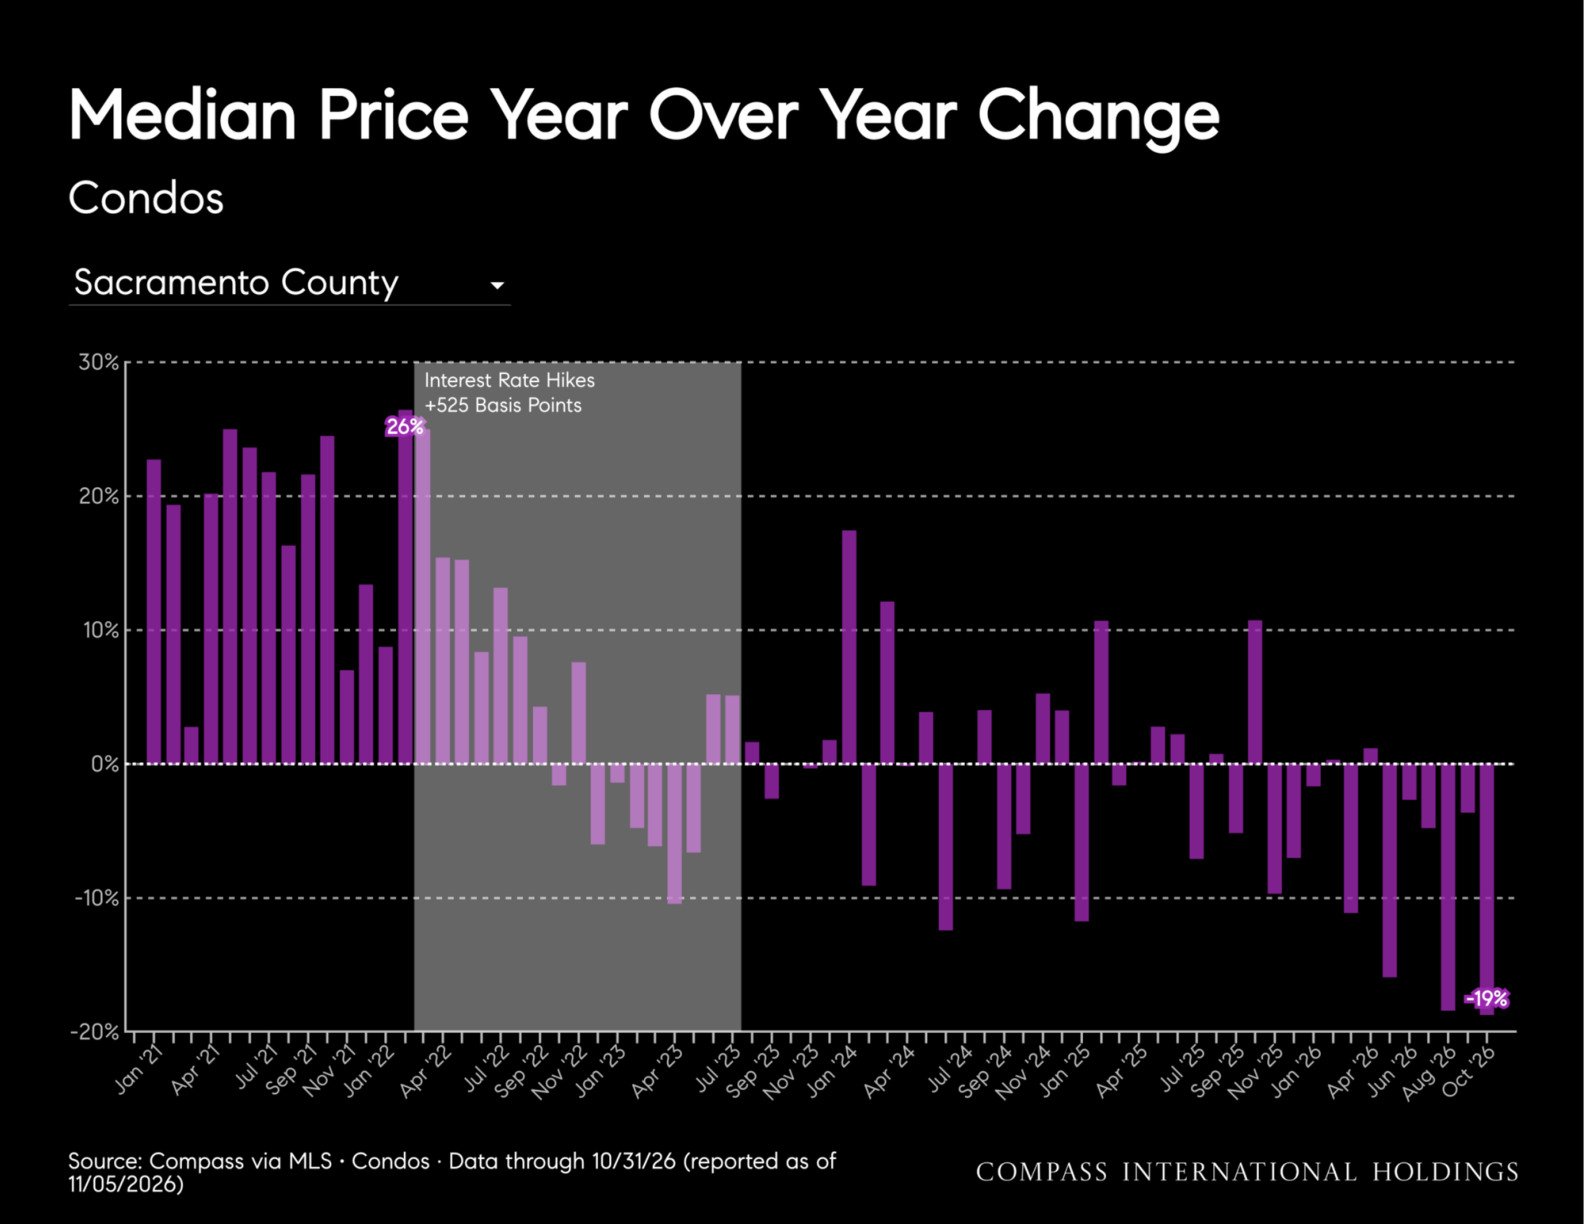
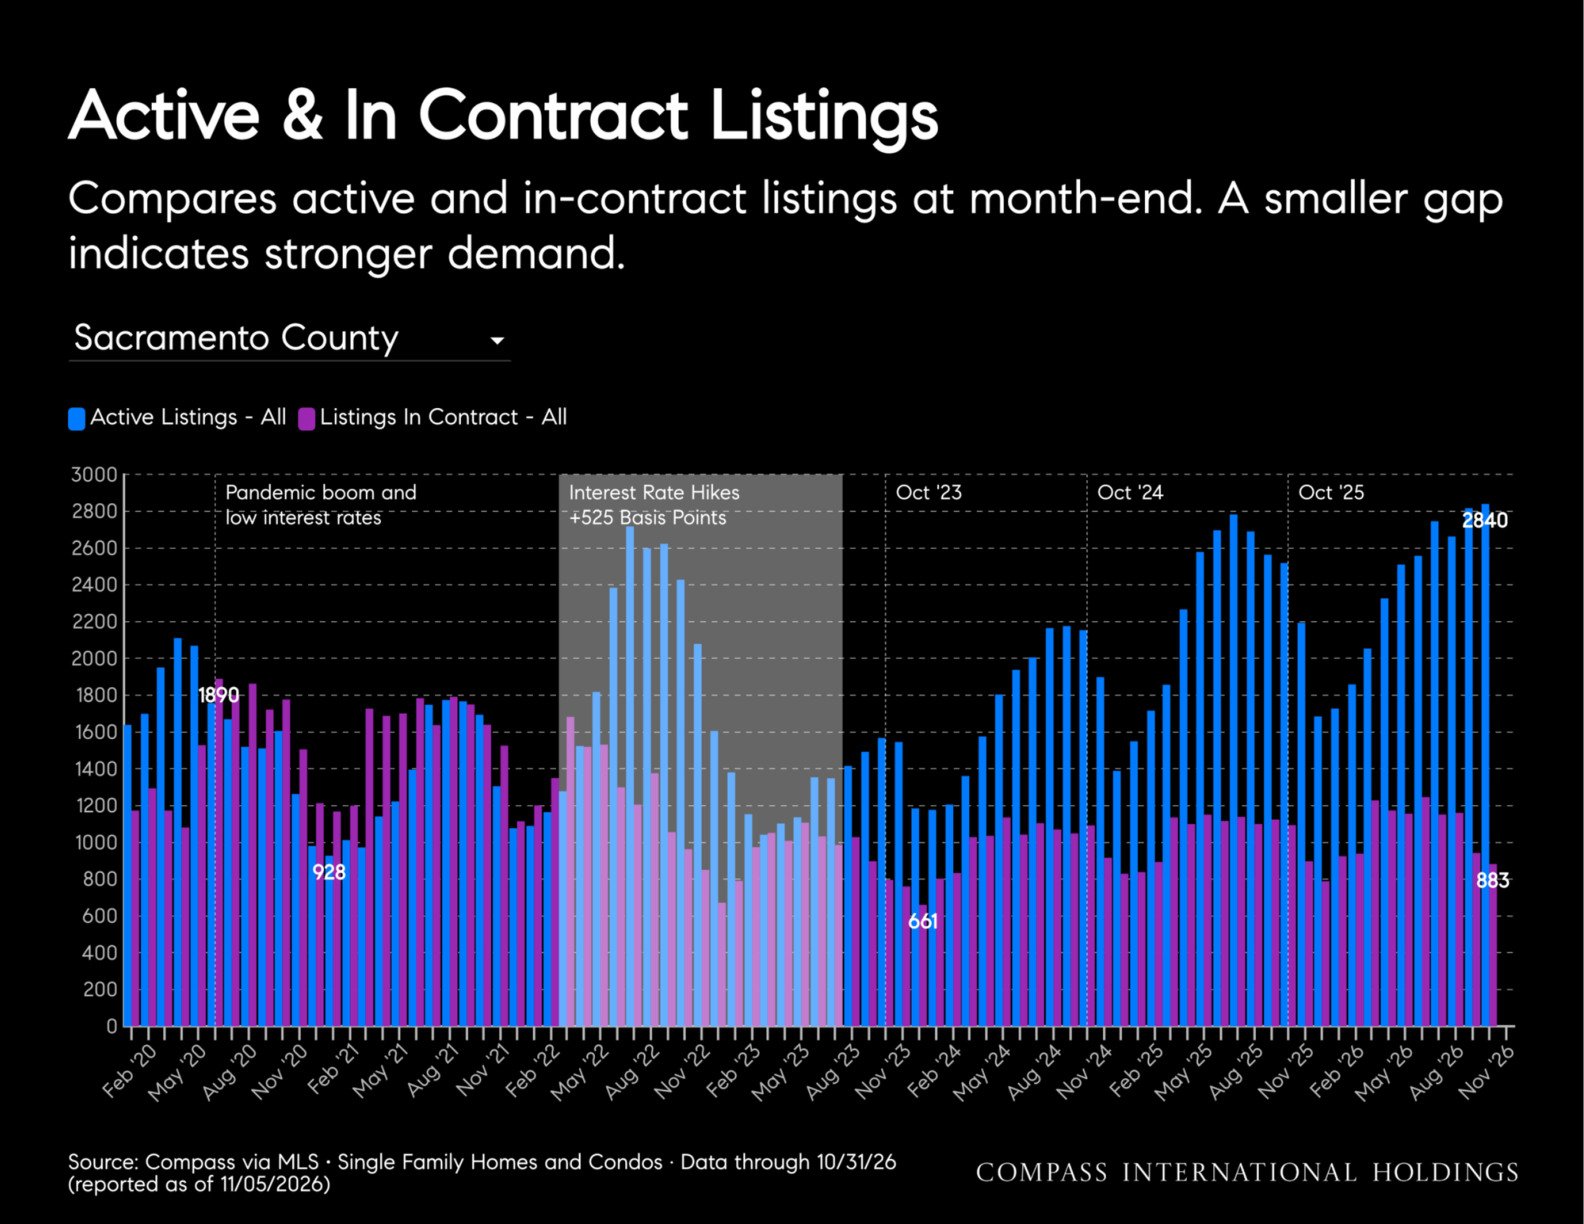
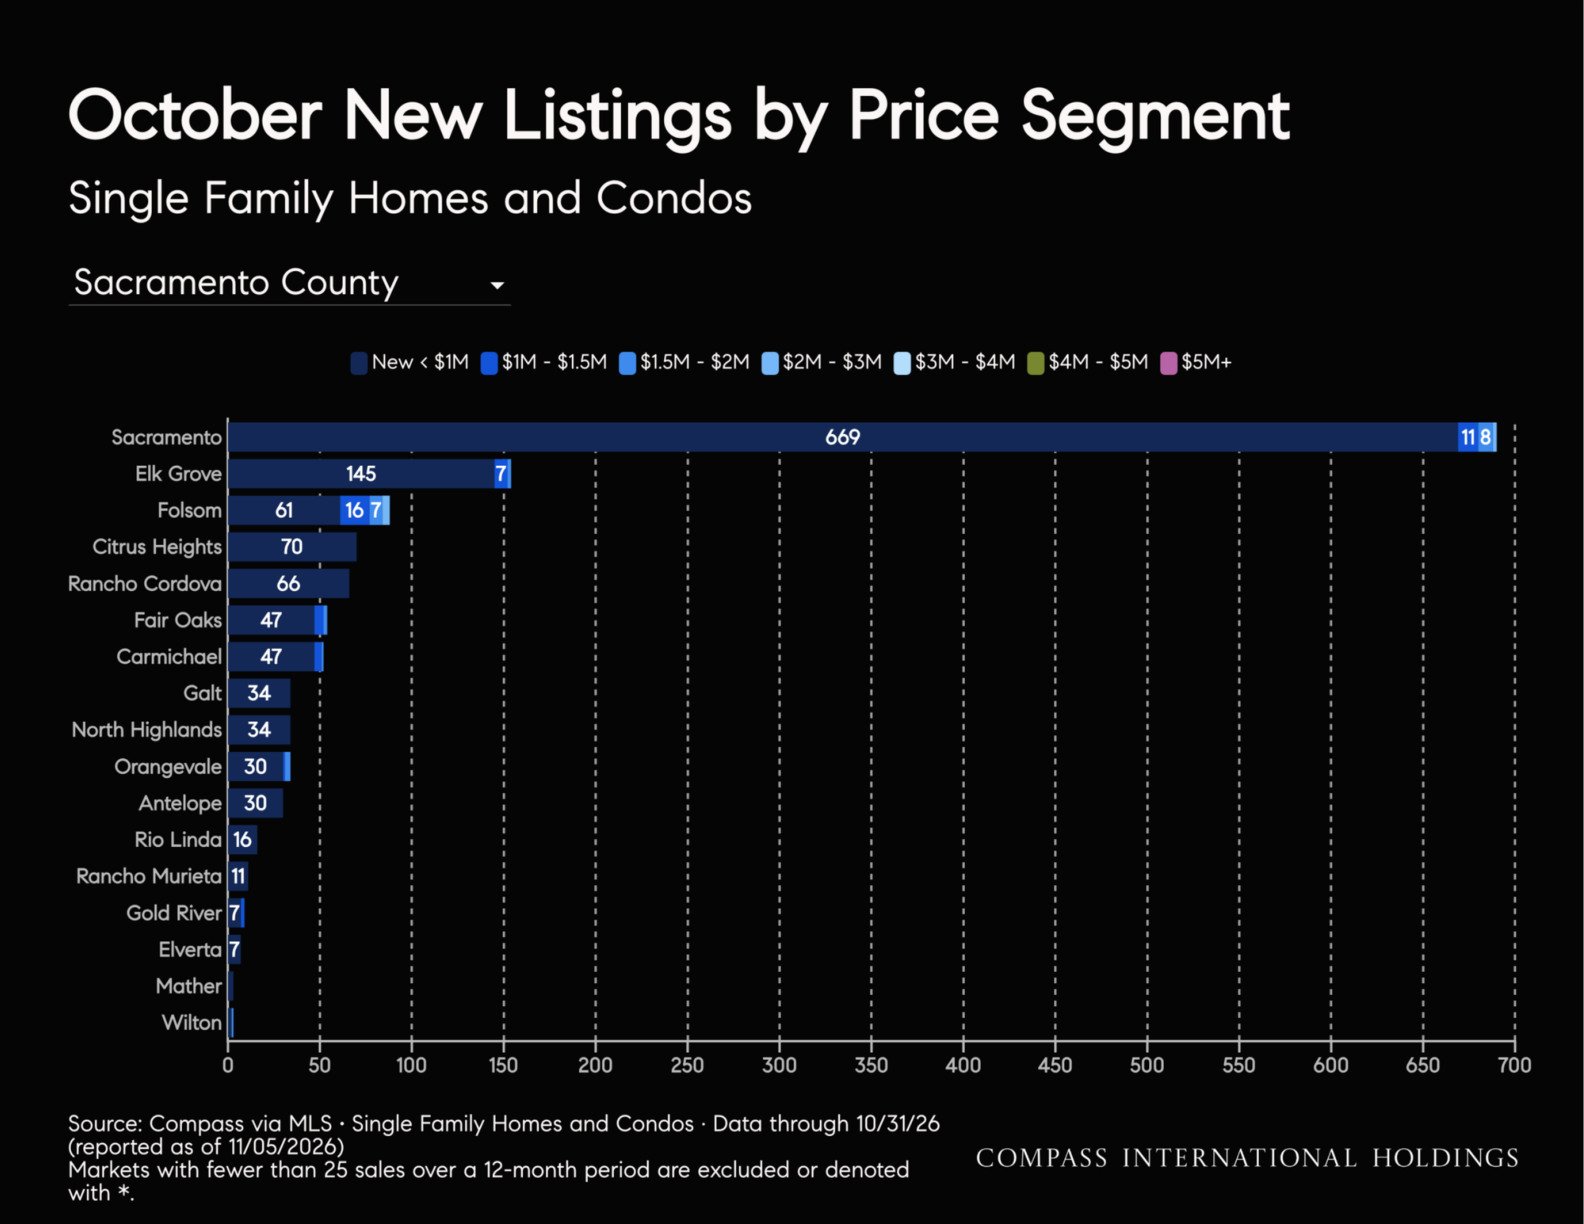
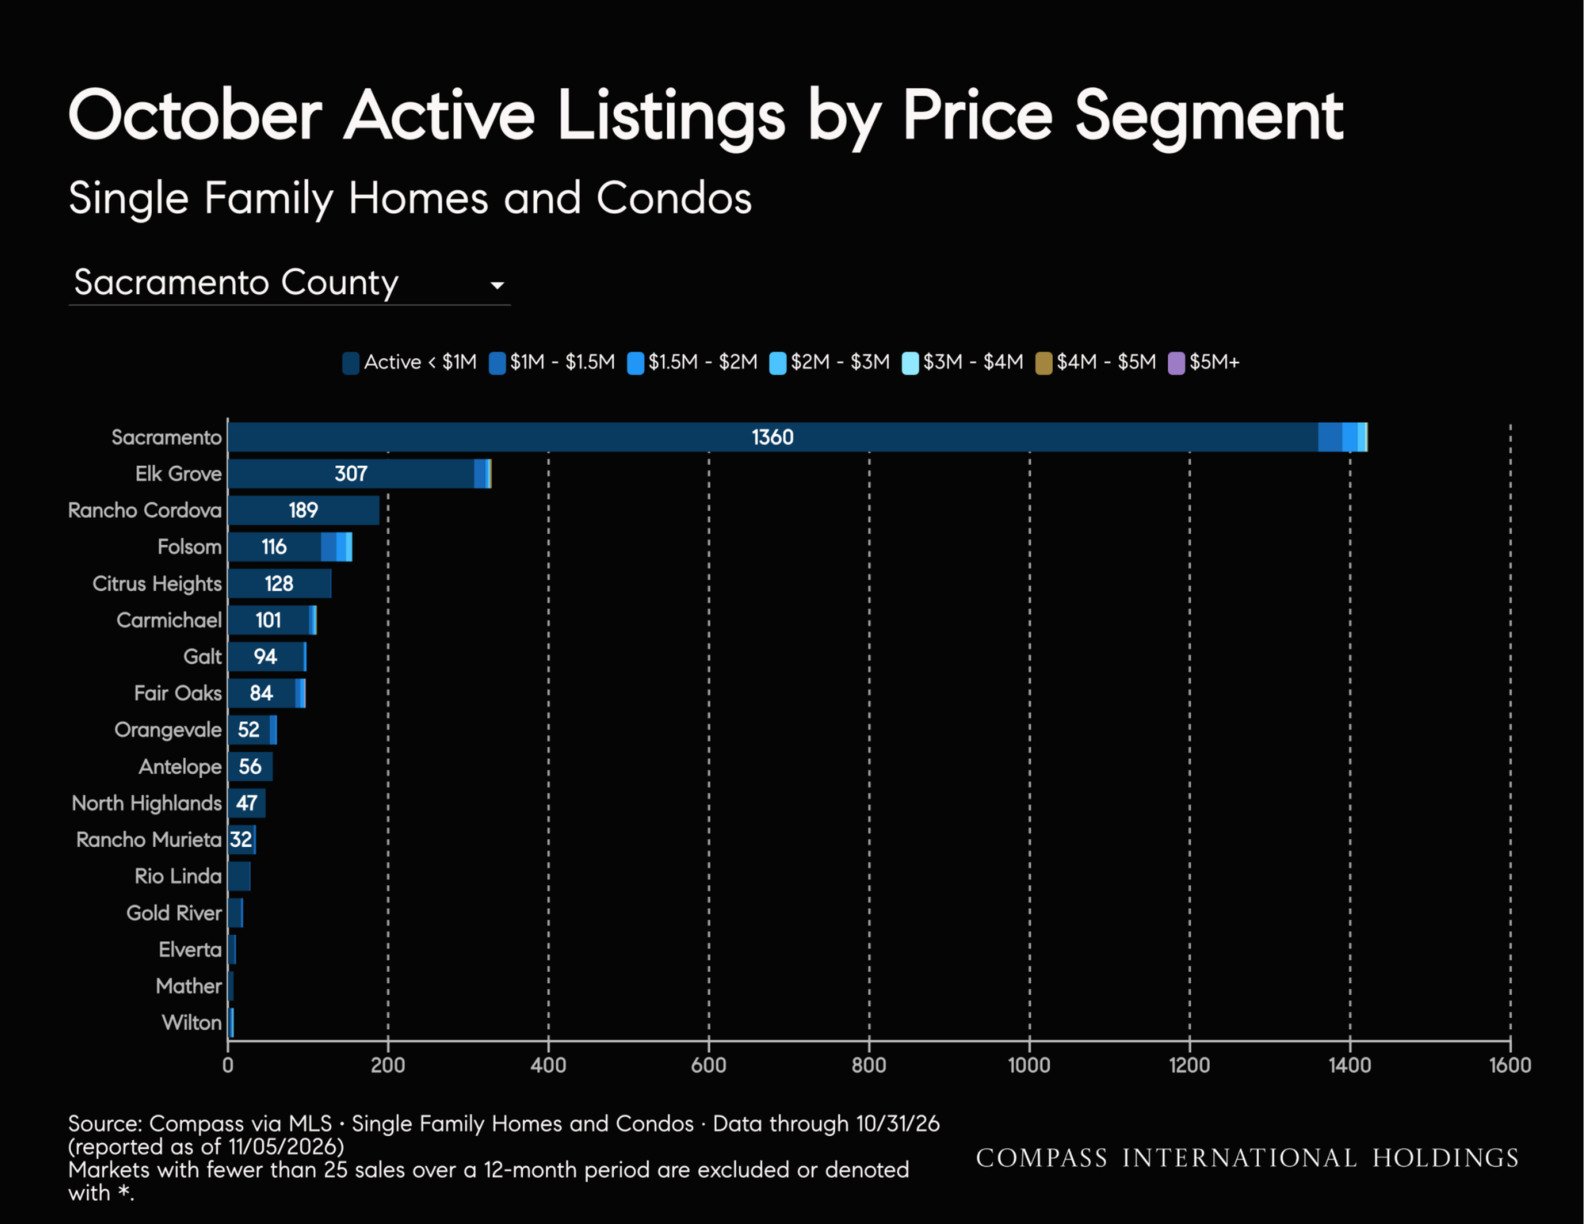
Prices: The single-family median fell 3% YoY to $535,000. The condo median fell 19% YoY to $260,000. Competition: 31% of single-family sales closed above list, up 2% YoY. Condo overbidding was 12%, up 3%. Inventory: Active single-family listings rose 12% YoY to 2,544, while new listings fell 4% to 1,262. Condo active listings rose 16% to 296, the highest October level since at least 2020.
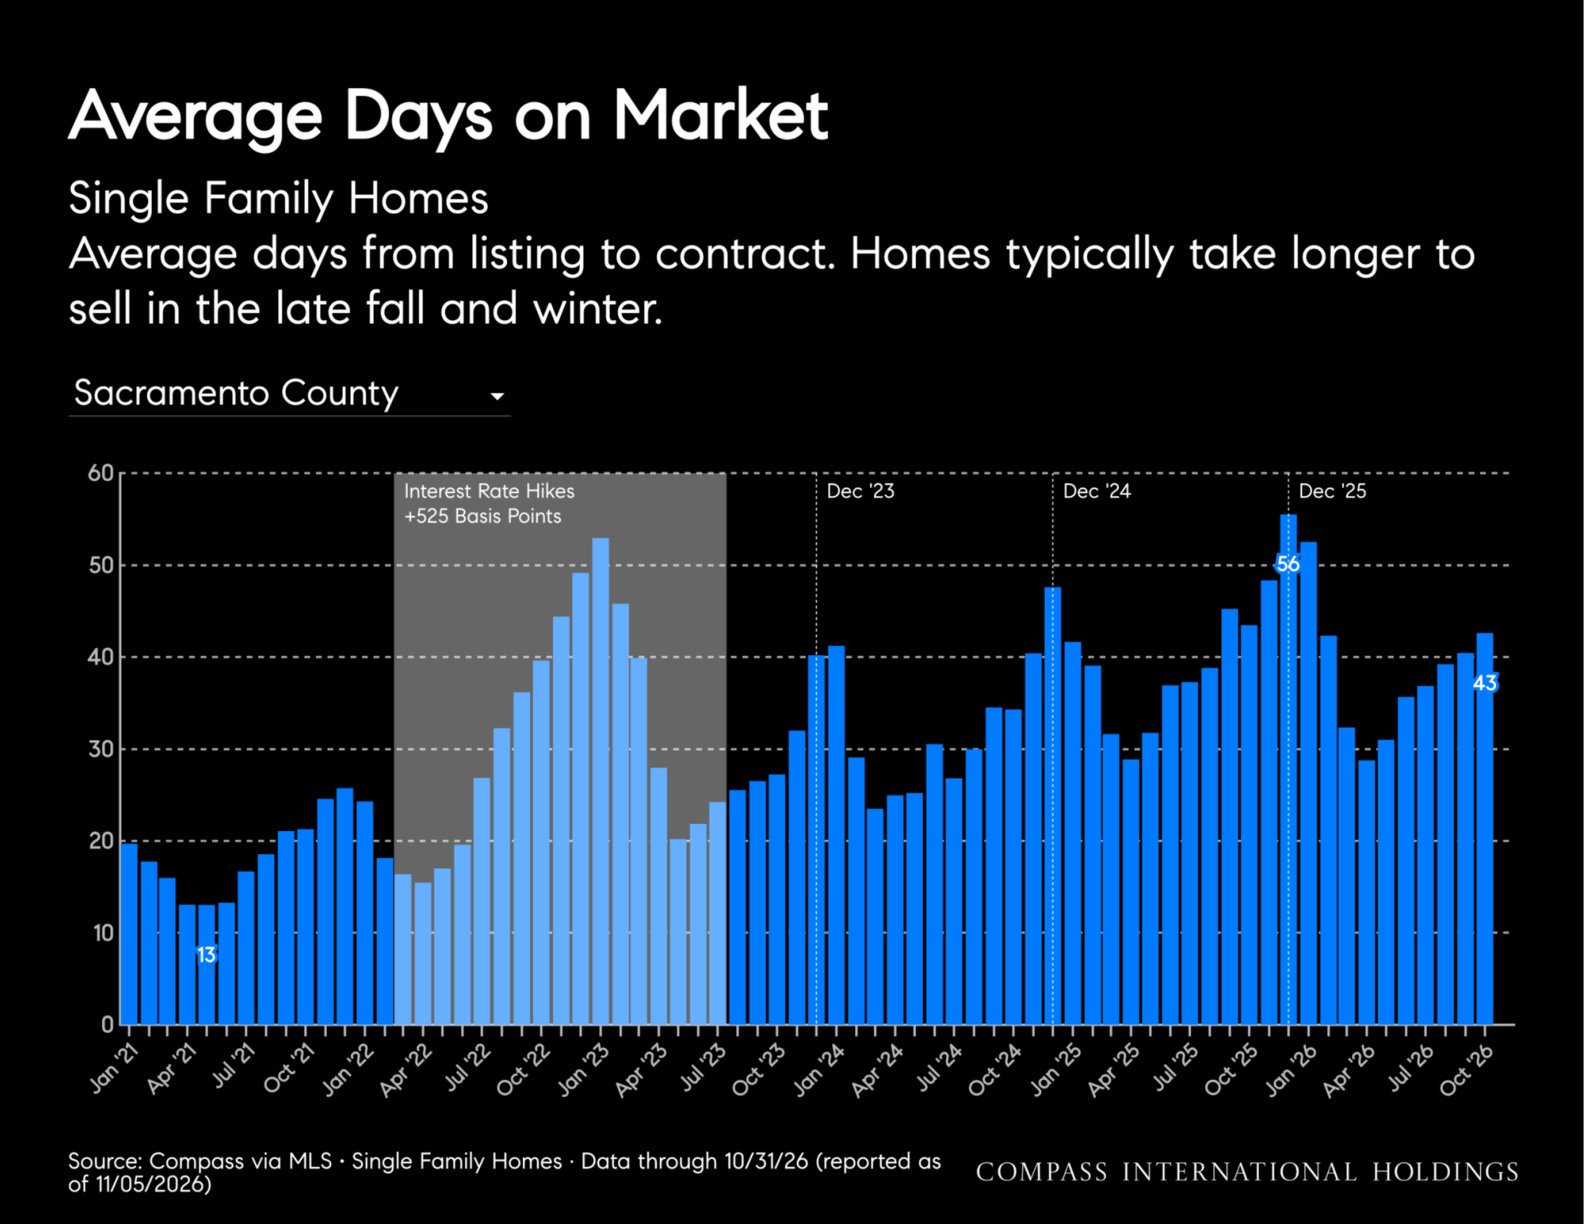
Single family: Days on market held at 43 days, essentially unchanged from a year ago, while months of supply was 3.2. Price reductions rose 39% YoY, with the reduction rate at 42%.
Condos: Condo supply rose to 6.9 months from 3.8, the highest of any month since at least 2020. Condo days on market rose 16% to 71 and 45% of condo listings took a price cut, up 3%.
MoM: Single-family closings fell 17% from September and the median fell 4%, while months of supply rose to 3.2 from 2.6. Price reductions rose 13% and the reduction rate rose 5%.
Bottom line: A softening single-family market moving toward buyers; condos are oversupplied.
How to Read This Report: County and Submarket Guidance
This November 2026 report covers 21 markets in Northern California: 15 counties and 6 submarkets. Each market summary compares October 2026 with October 2025 (YoY) and September 2026 (MoM).
This report is organized by property type, with single-family and condo metrics presented separately. Single-family median sale price and closed sales time-series charts have been formatted for easier reading.
Source: Compass via MLS; data exported 11/5/2026 and 11/6/2026, with data through 10/31/2026.
Please note, data for October is preliminary: Late MLS reporting may add closings for approximately two weeks after month-end.
Small samples: Results for markets with fewer than 30 closings per year should be interpreted with caution.
Report contents
Market Summary & Map
Single-Family Market Metrics
Single-Family Competition
Condo Market Metrics Inventory & Supply
Price Reductions
Market Metrics by Price Segment Market Tables
Forward-Looking Macro Trends
Bay Area Macro Overview
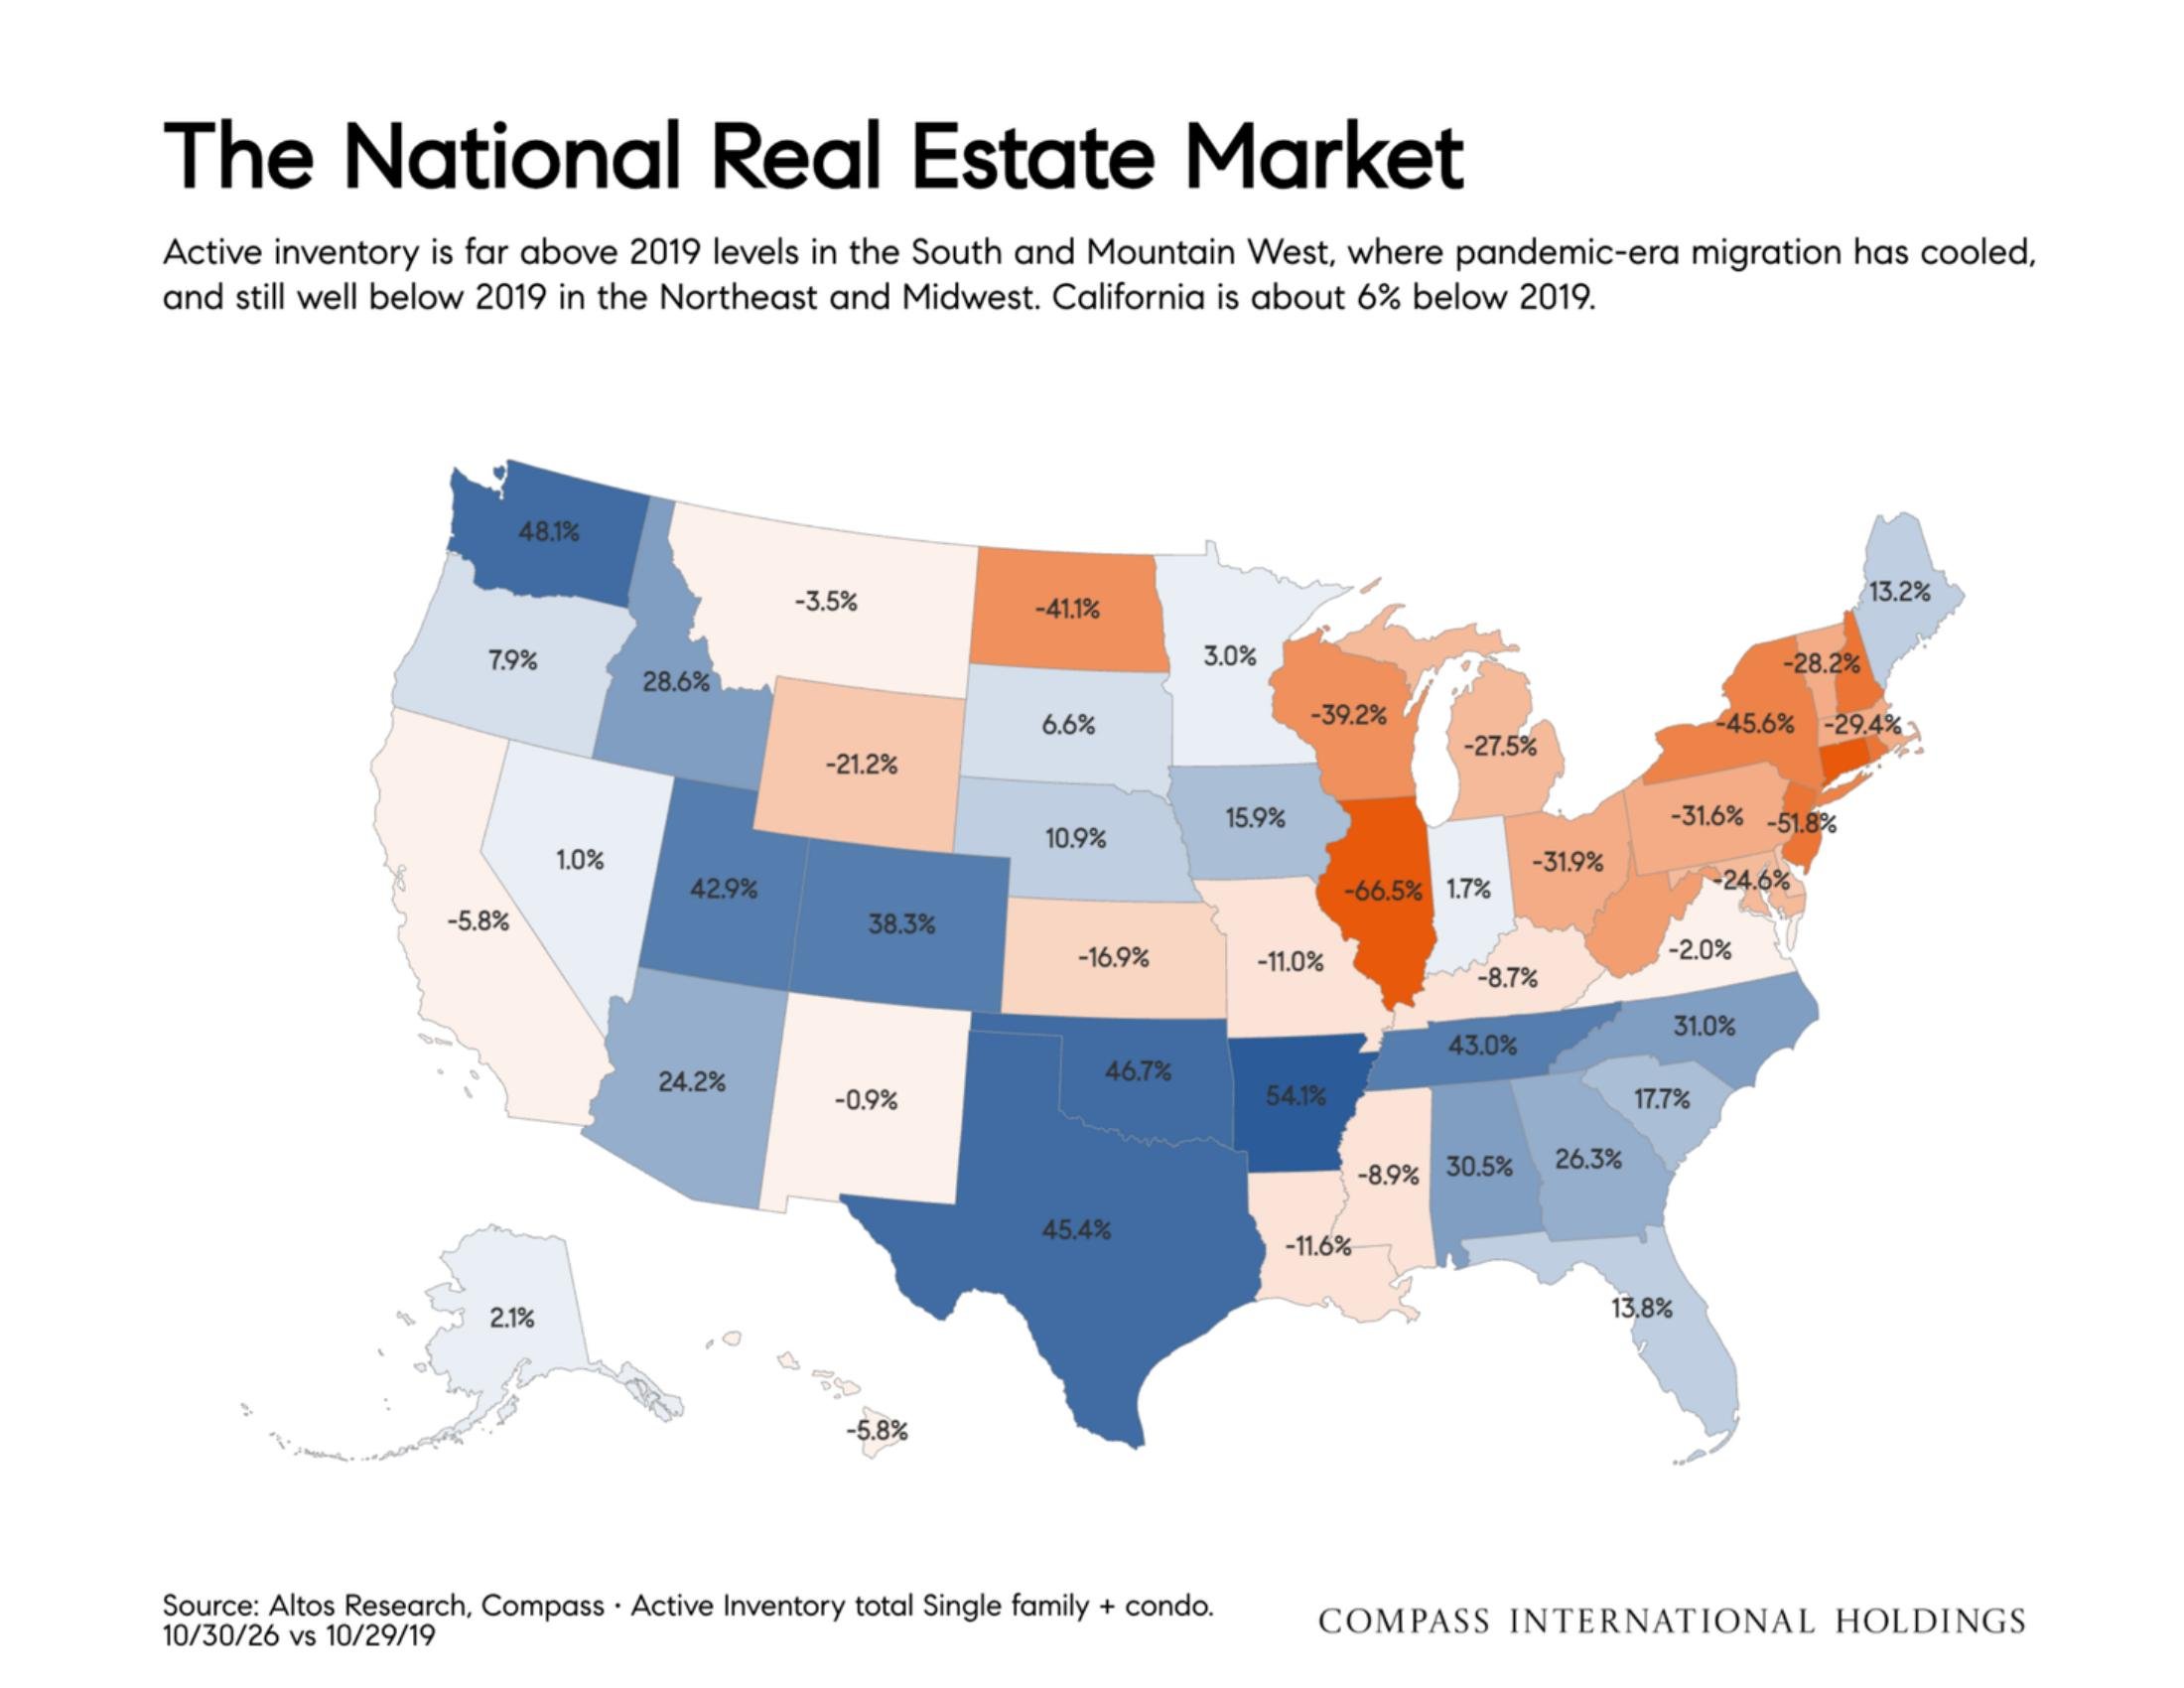
National Market Trends
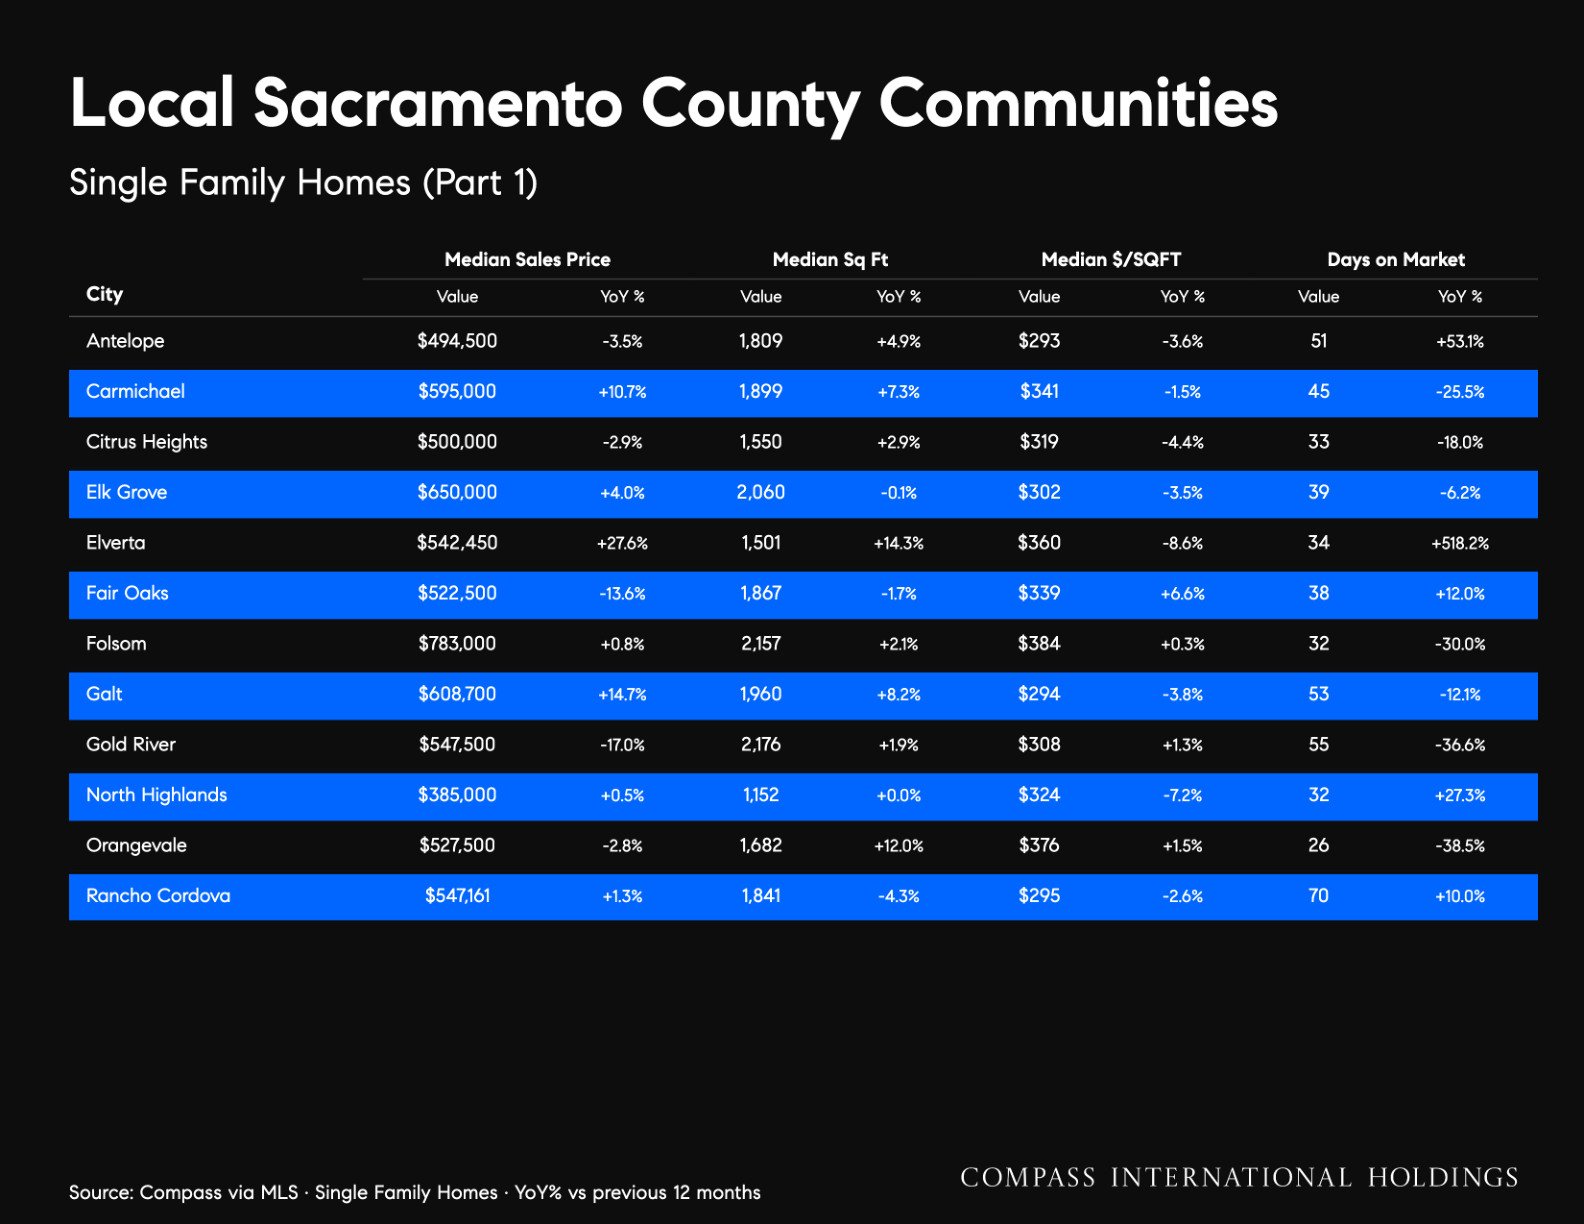
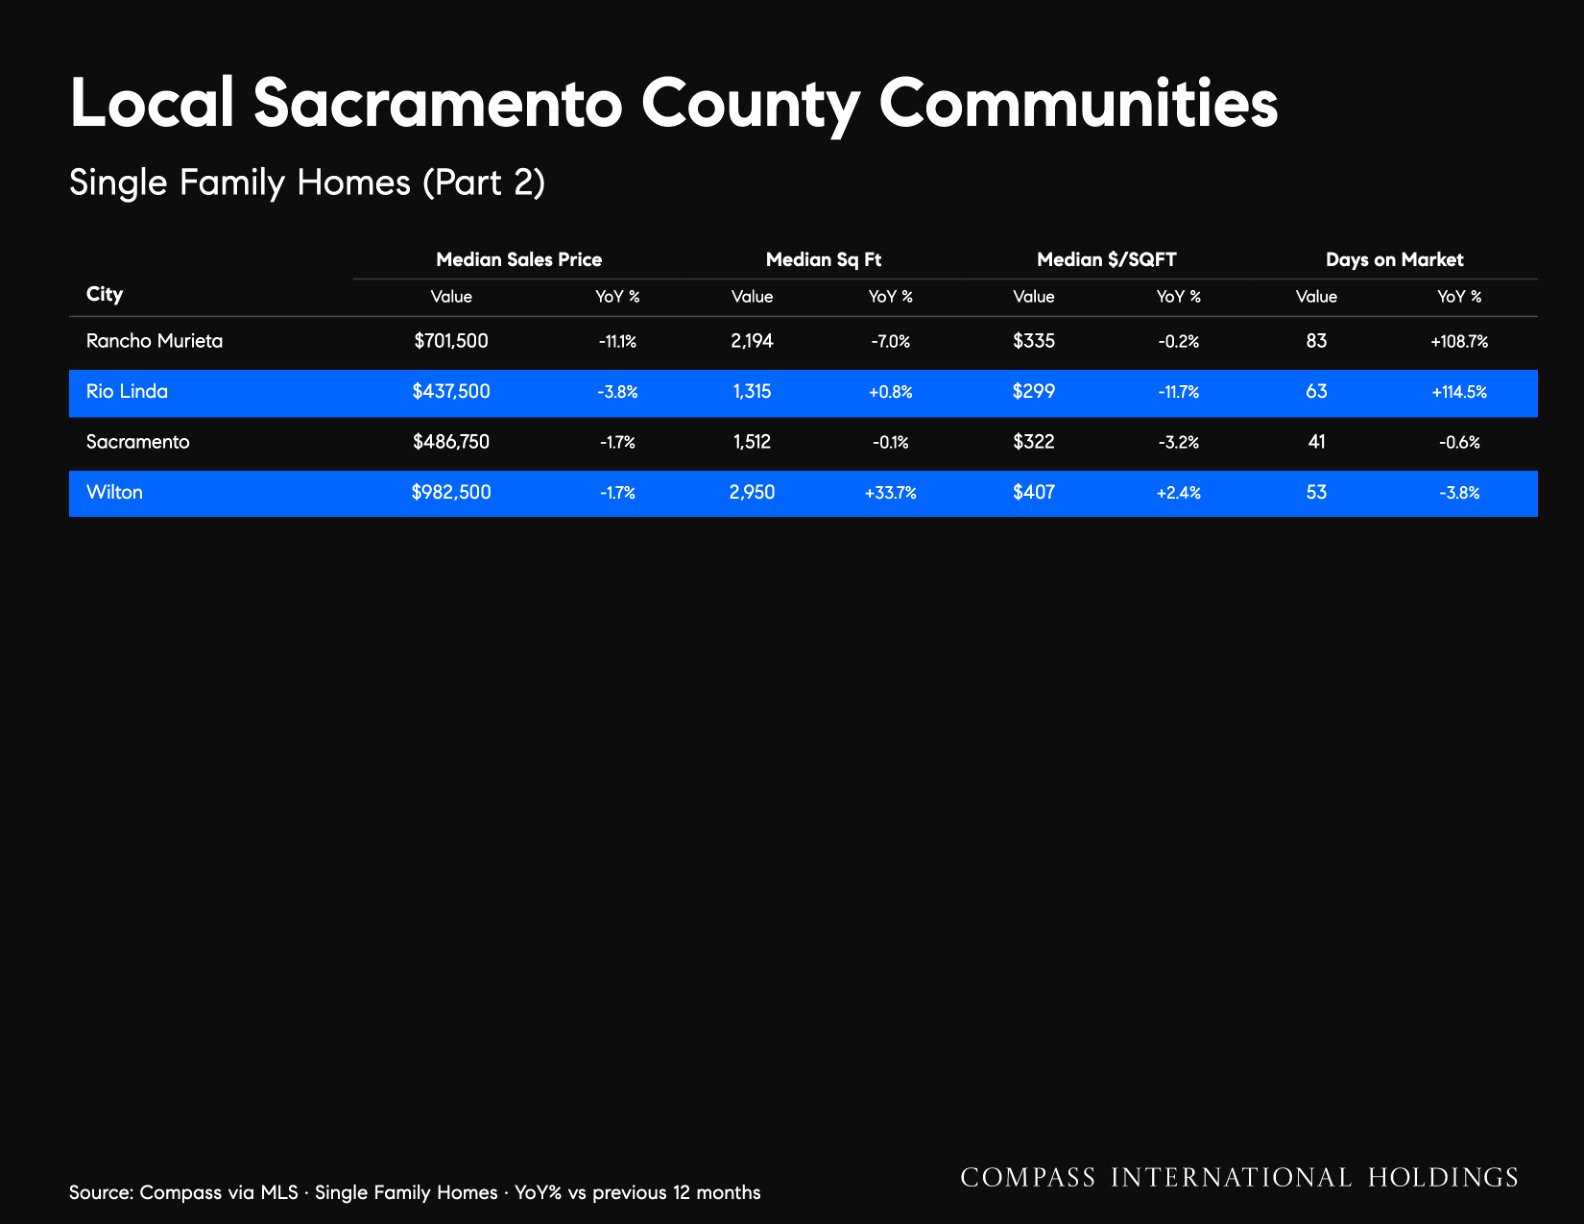
Singe Family Homes
Condos
All Properties
November 2026 Northern California Housing Market Report
In October, county real estate markets across Northern California split evenly along inventory lines: active single-family listings fell year over year in seven counties and rose in the other seven. Markets with shrinking inventory saw stronger competition and pricing, while those with growing inventory saw more buyer leverage and more frequent price reductions.
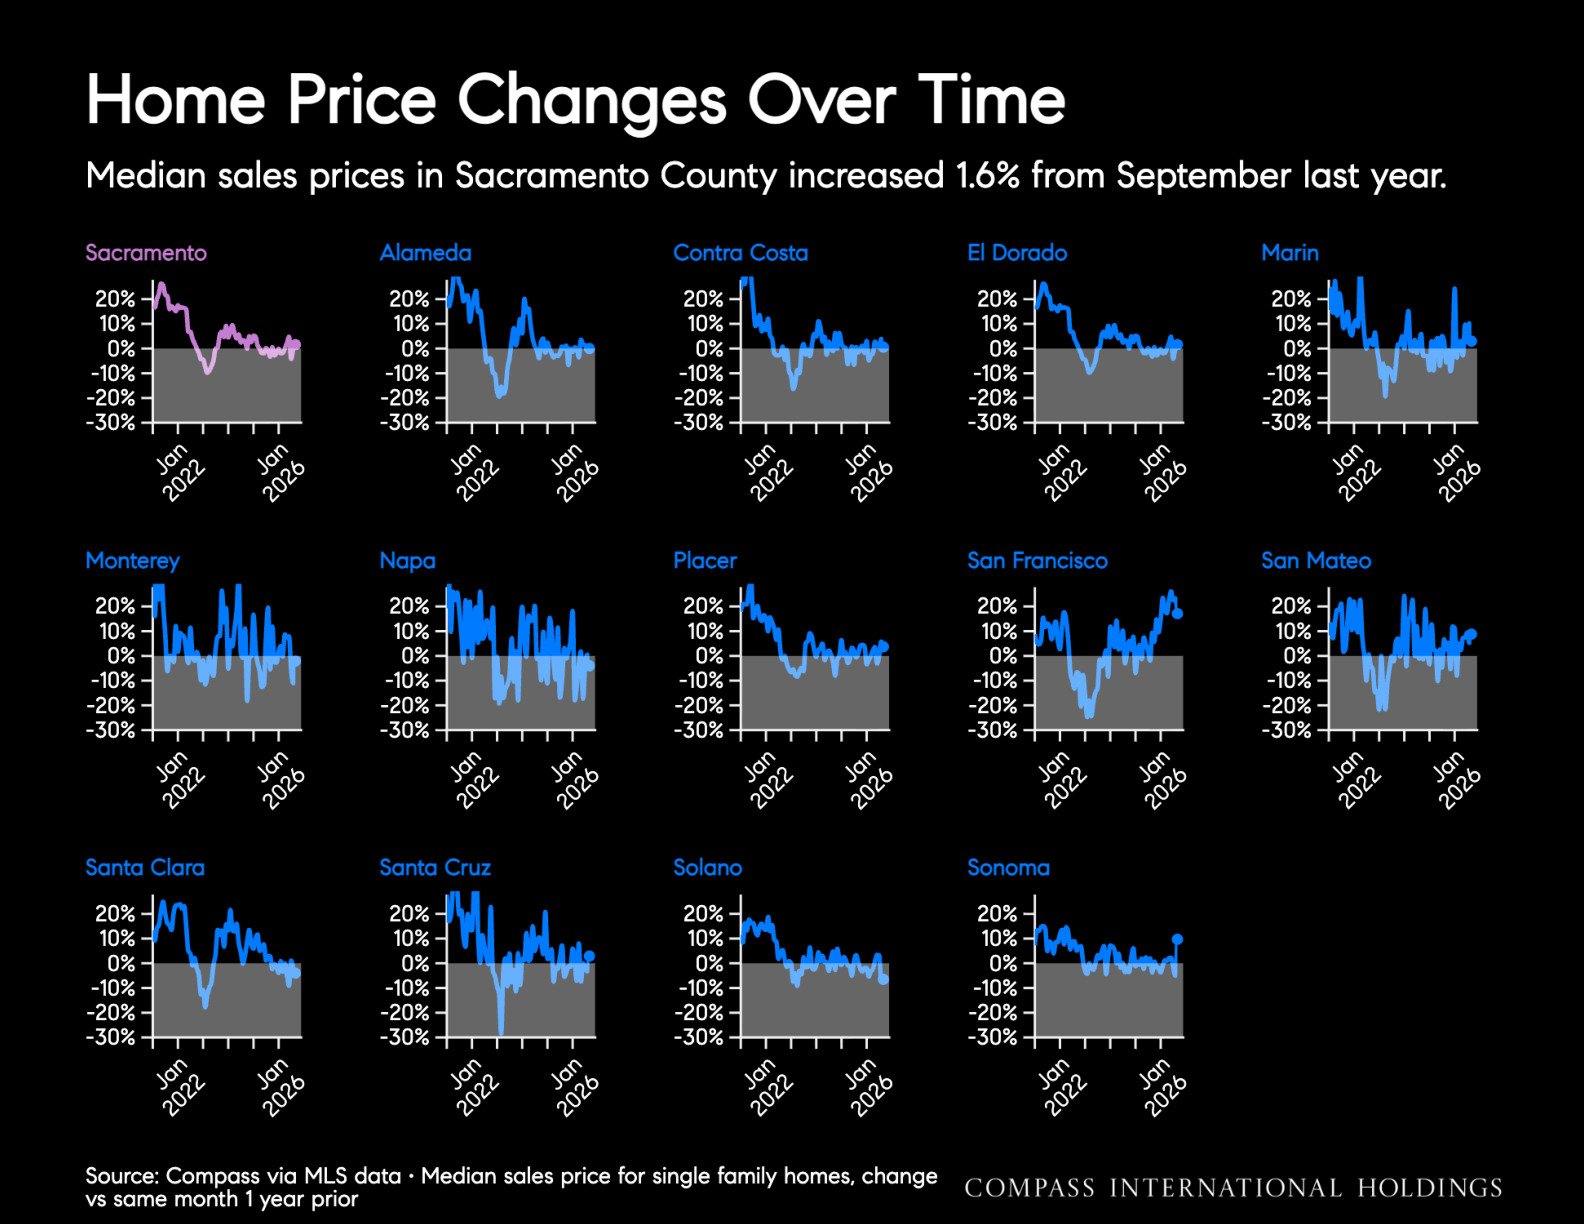
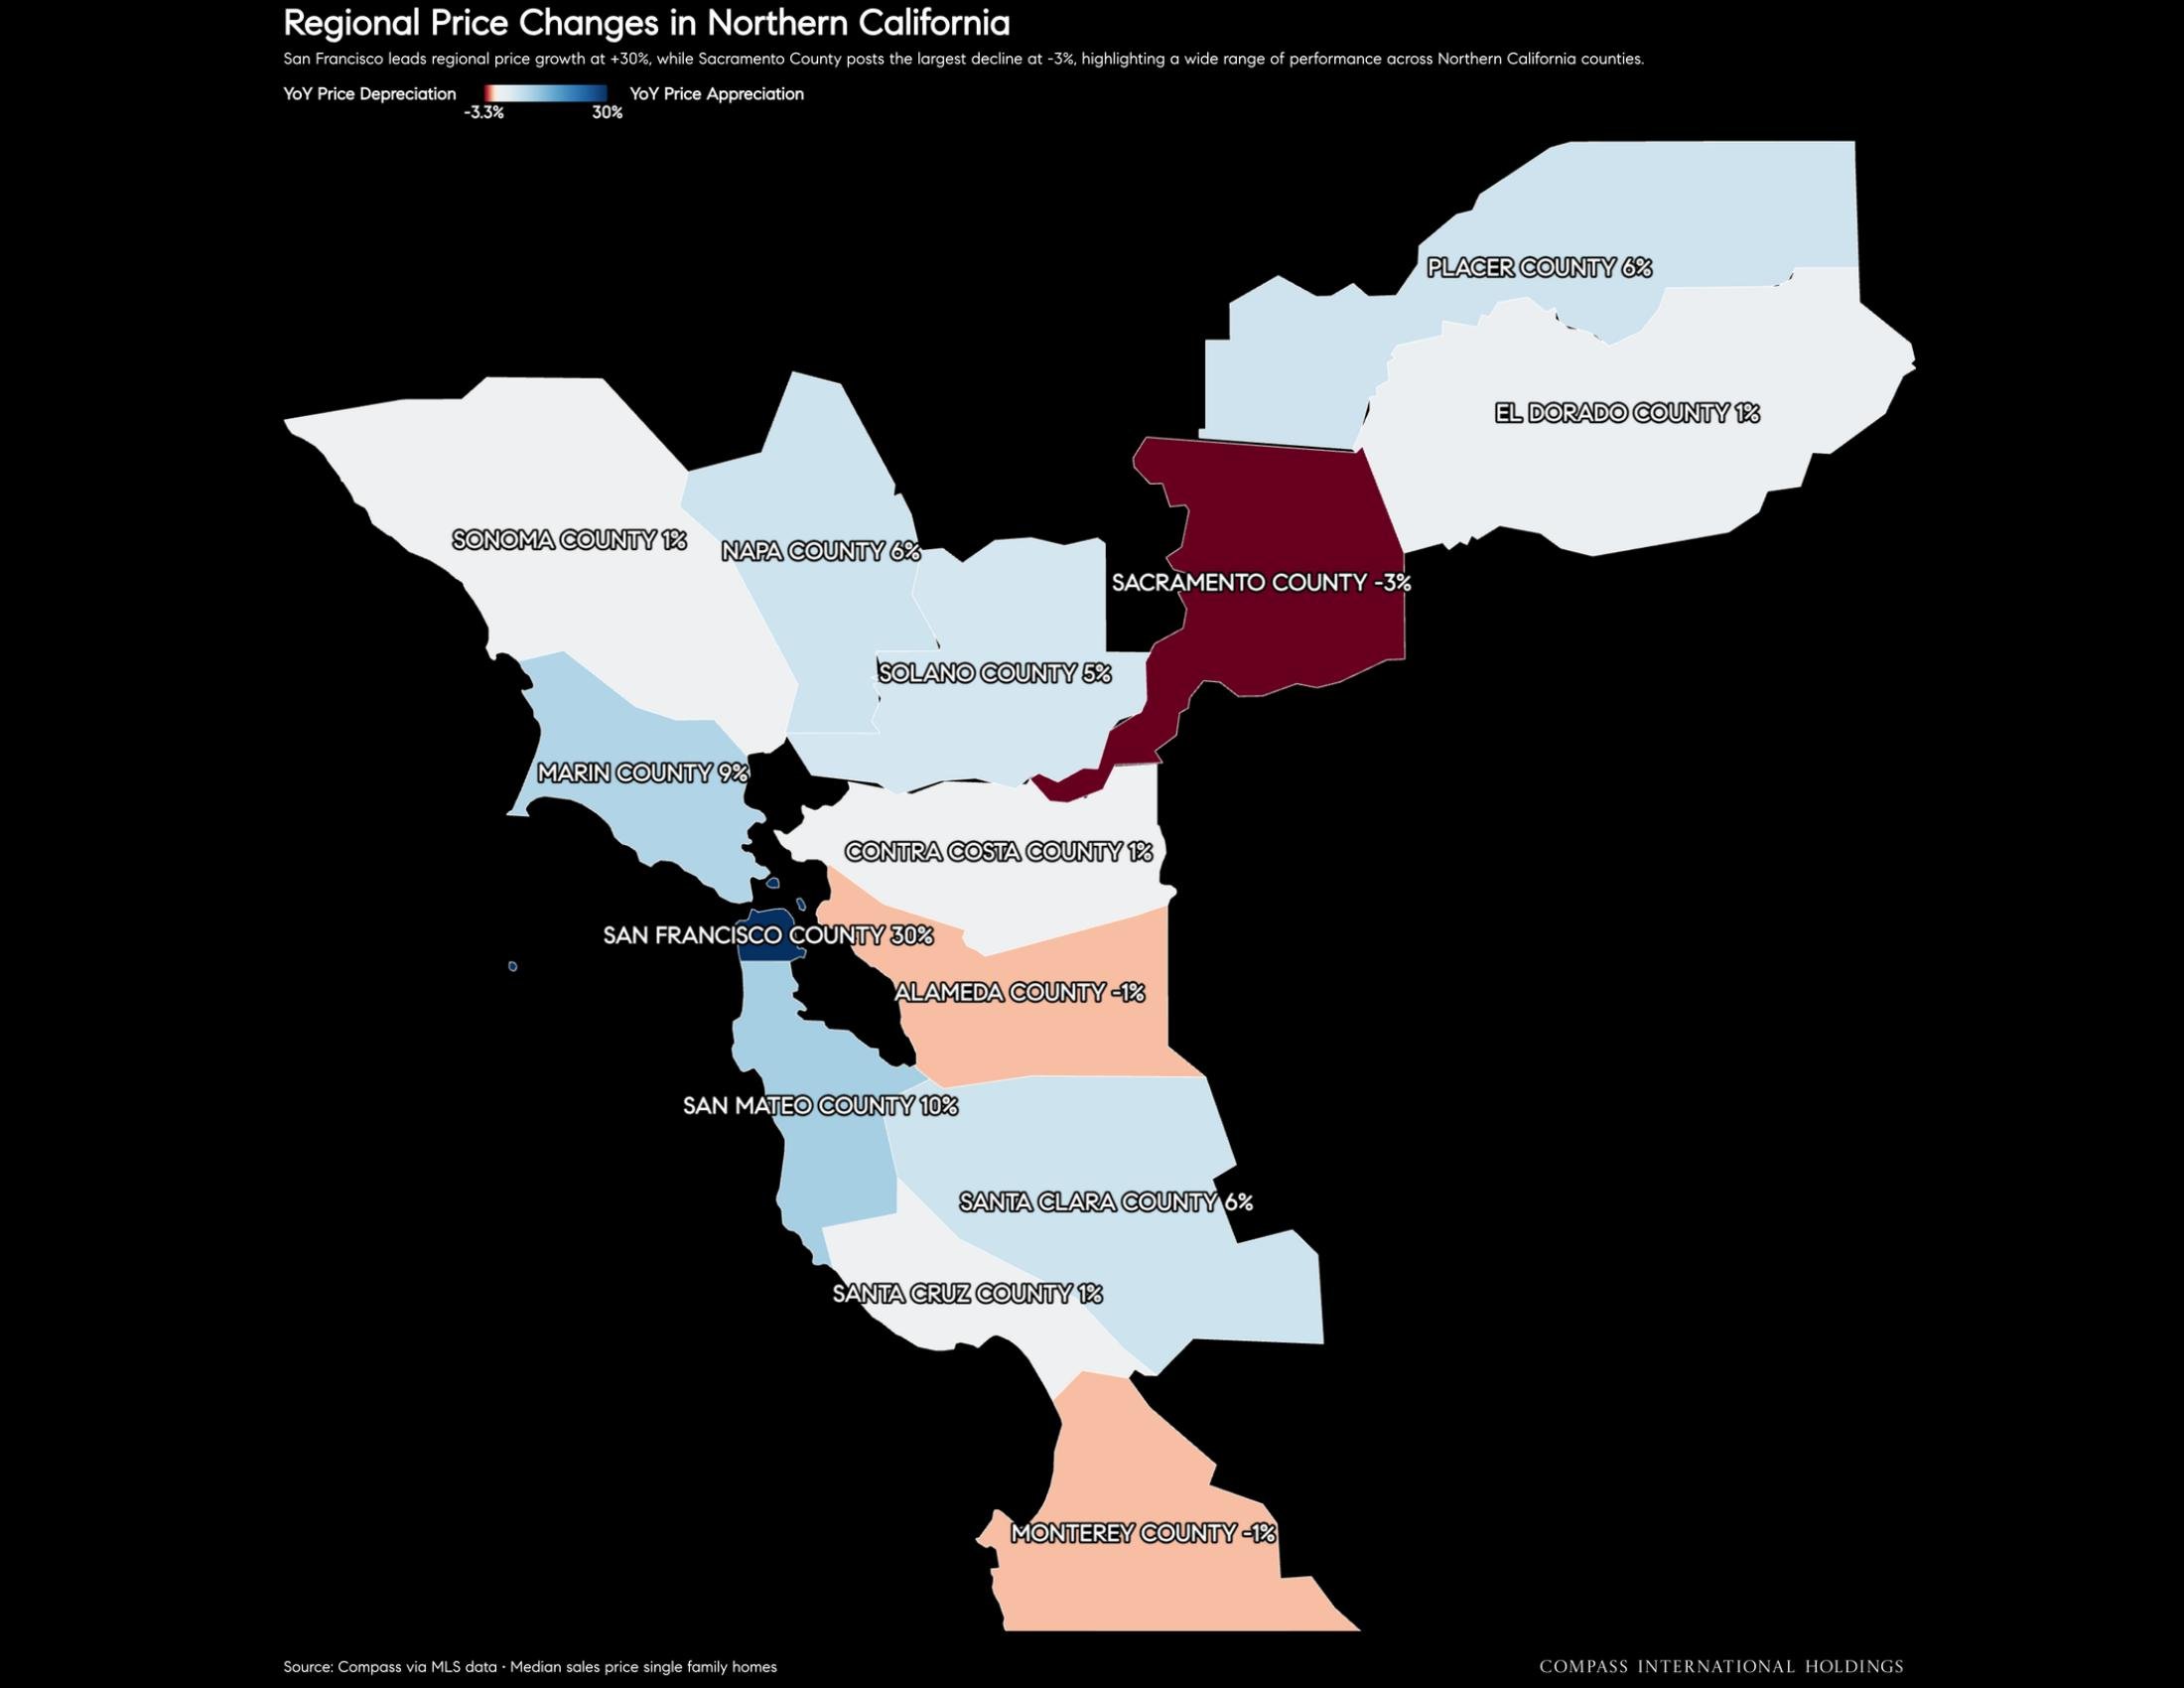
Markets that tightened included San Francisco, Marin, San Mateo, and Alameda. San Francisco led the region in competitiveness, with 86% of single-family homes selling above list price and the single-family median up 29% year over year to $2,390,000. Marin's active listings fell 28% and its median rose 9%. In San Mateo County, the median increased 10% to $2,200,000, the highest October median since at least 2020, supported by 66% of sales closing above list.
Contra Costa, Sonoma, Santa Cruz, and Napa presented mixed conditions. Contra Costa and Sonoma both had fewer active listings than a year ago, yet price reductions became more common. In Santa Cruz, closings and the median held steady, though 51% of single-family listings underwent price reductions, the highest share in the region.
Softer market performance was observed in Santa Clara, Sacramento, Placer, El Dorado, Solano, and Monterey. Santa Clara's median rose 6%, but active listings expanded 27%, price cuts rose 50%, and it was the only county where the share of homes selling above list fell. In the greater Sacramento region, falling closings and expanding inventory drove price reduction increases of 39% in Sacramento, 34% in Placer, and 38% in El Dorado (where supply expanded to 4.3 months).
Condominium market performance generally lagged single-family properties, with condo closings down year over year in 10 of 14 counties. San Francisco stood out again, where the share of condos selling above list rose 25% to 68% and the condo median rose 12%; condo market conditions also improved in Alameda and San Mateo.
November Outlook: The fall listing wave is fading. New single-family listings fell from September in all 14 counties, by 38% in Marin and 43% in Napa, while the share of listings with a price cut rose in all 14. In tight markets, thinner inventory should keep competition strong into the holidays. In softer markets, the pace of price cuts will indicate whether sellers are adjusting to buyer leverage before the winter slowdown.
Note: October figures are preliminary; late MLS reporting typically adjusts closing tallies for approximately two weeks following month-end. Source: Compass via MLS (data through 10/31/2026, exported 11/6/2026). Comprehensive county-level summaries are available in the NorCal Market Summaries — October 2026 report.
November 2026 Economic Outlook
This section looks at the economic forces shaping the national and Northern California housing markets through October and into November.
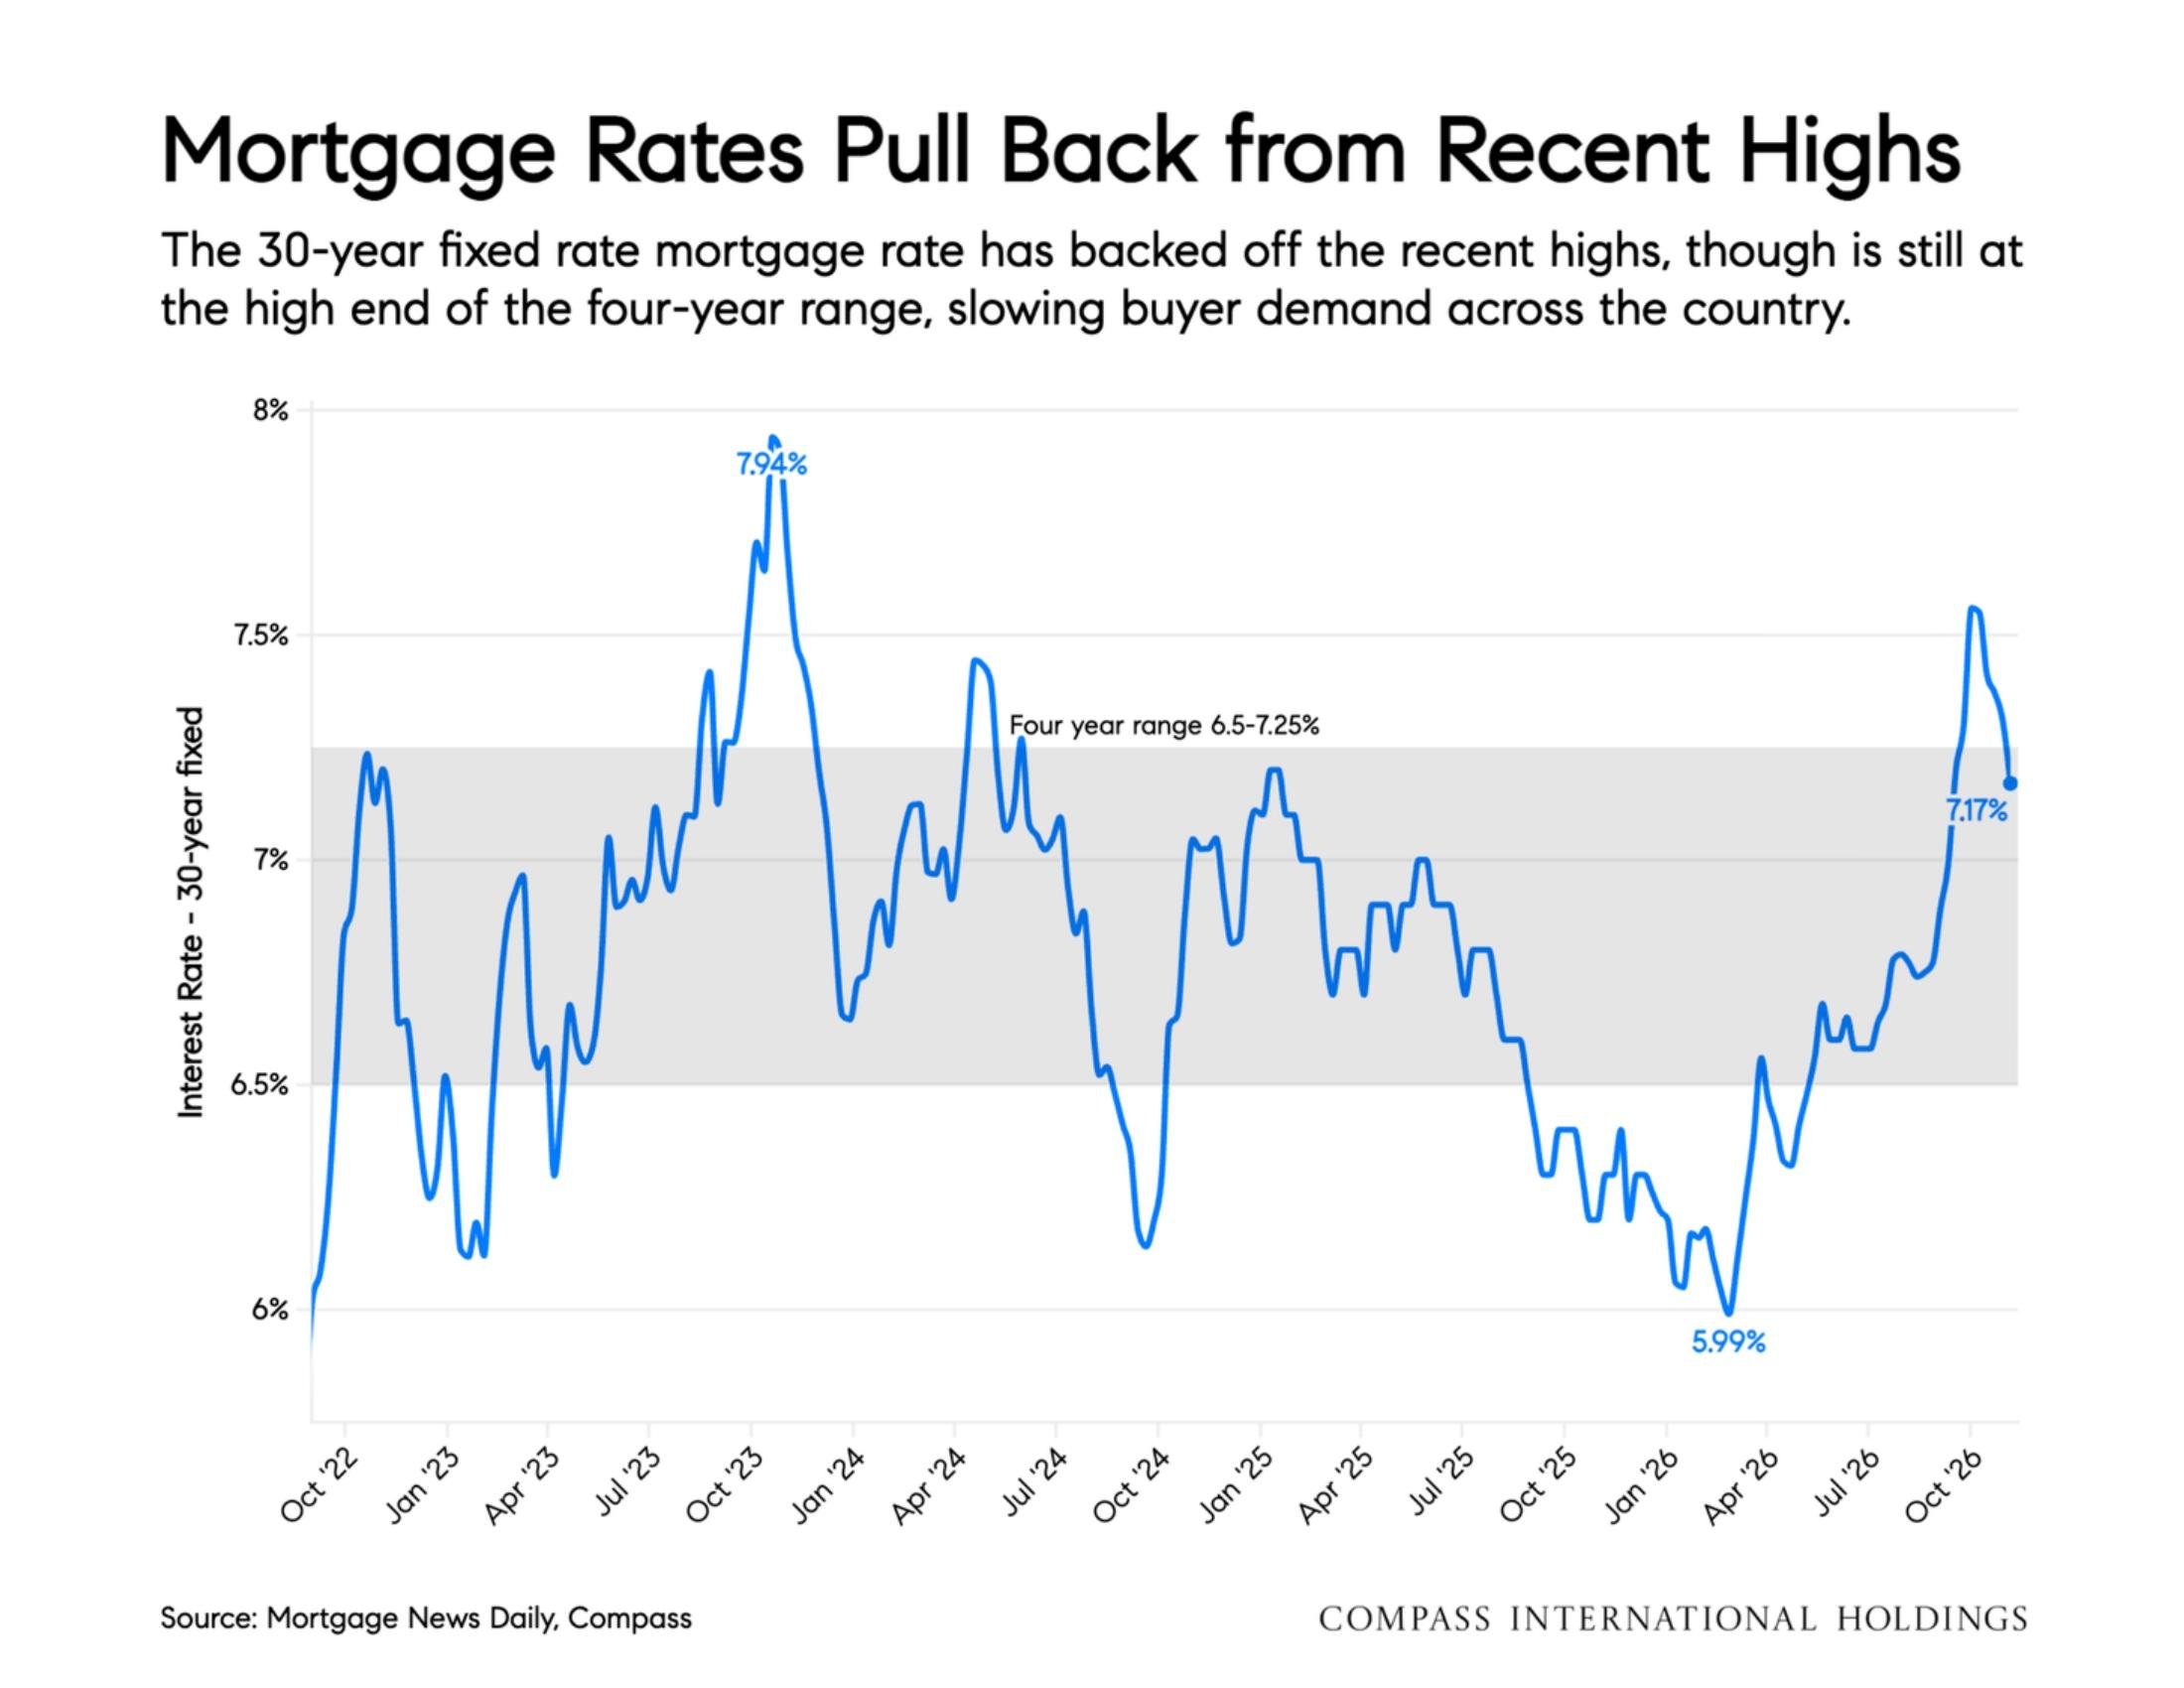
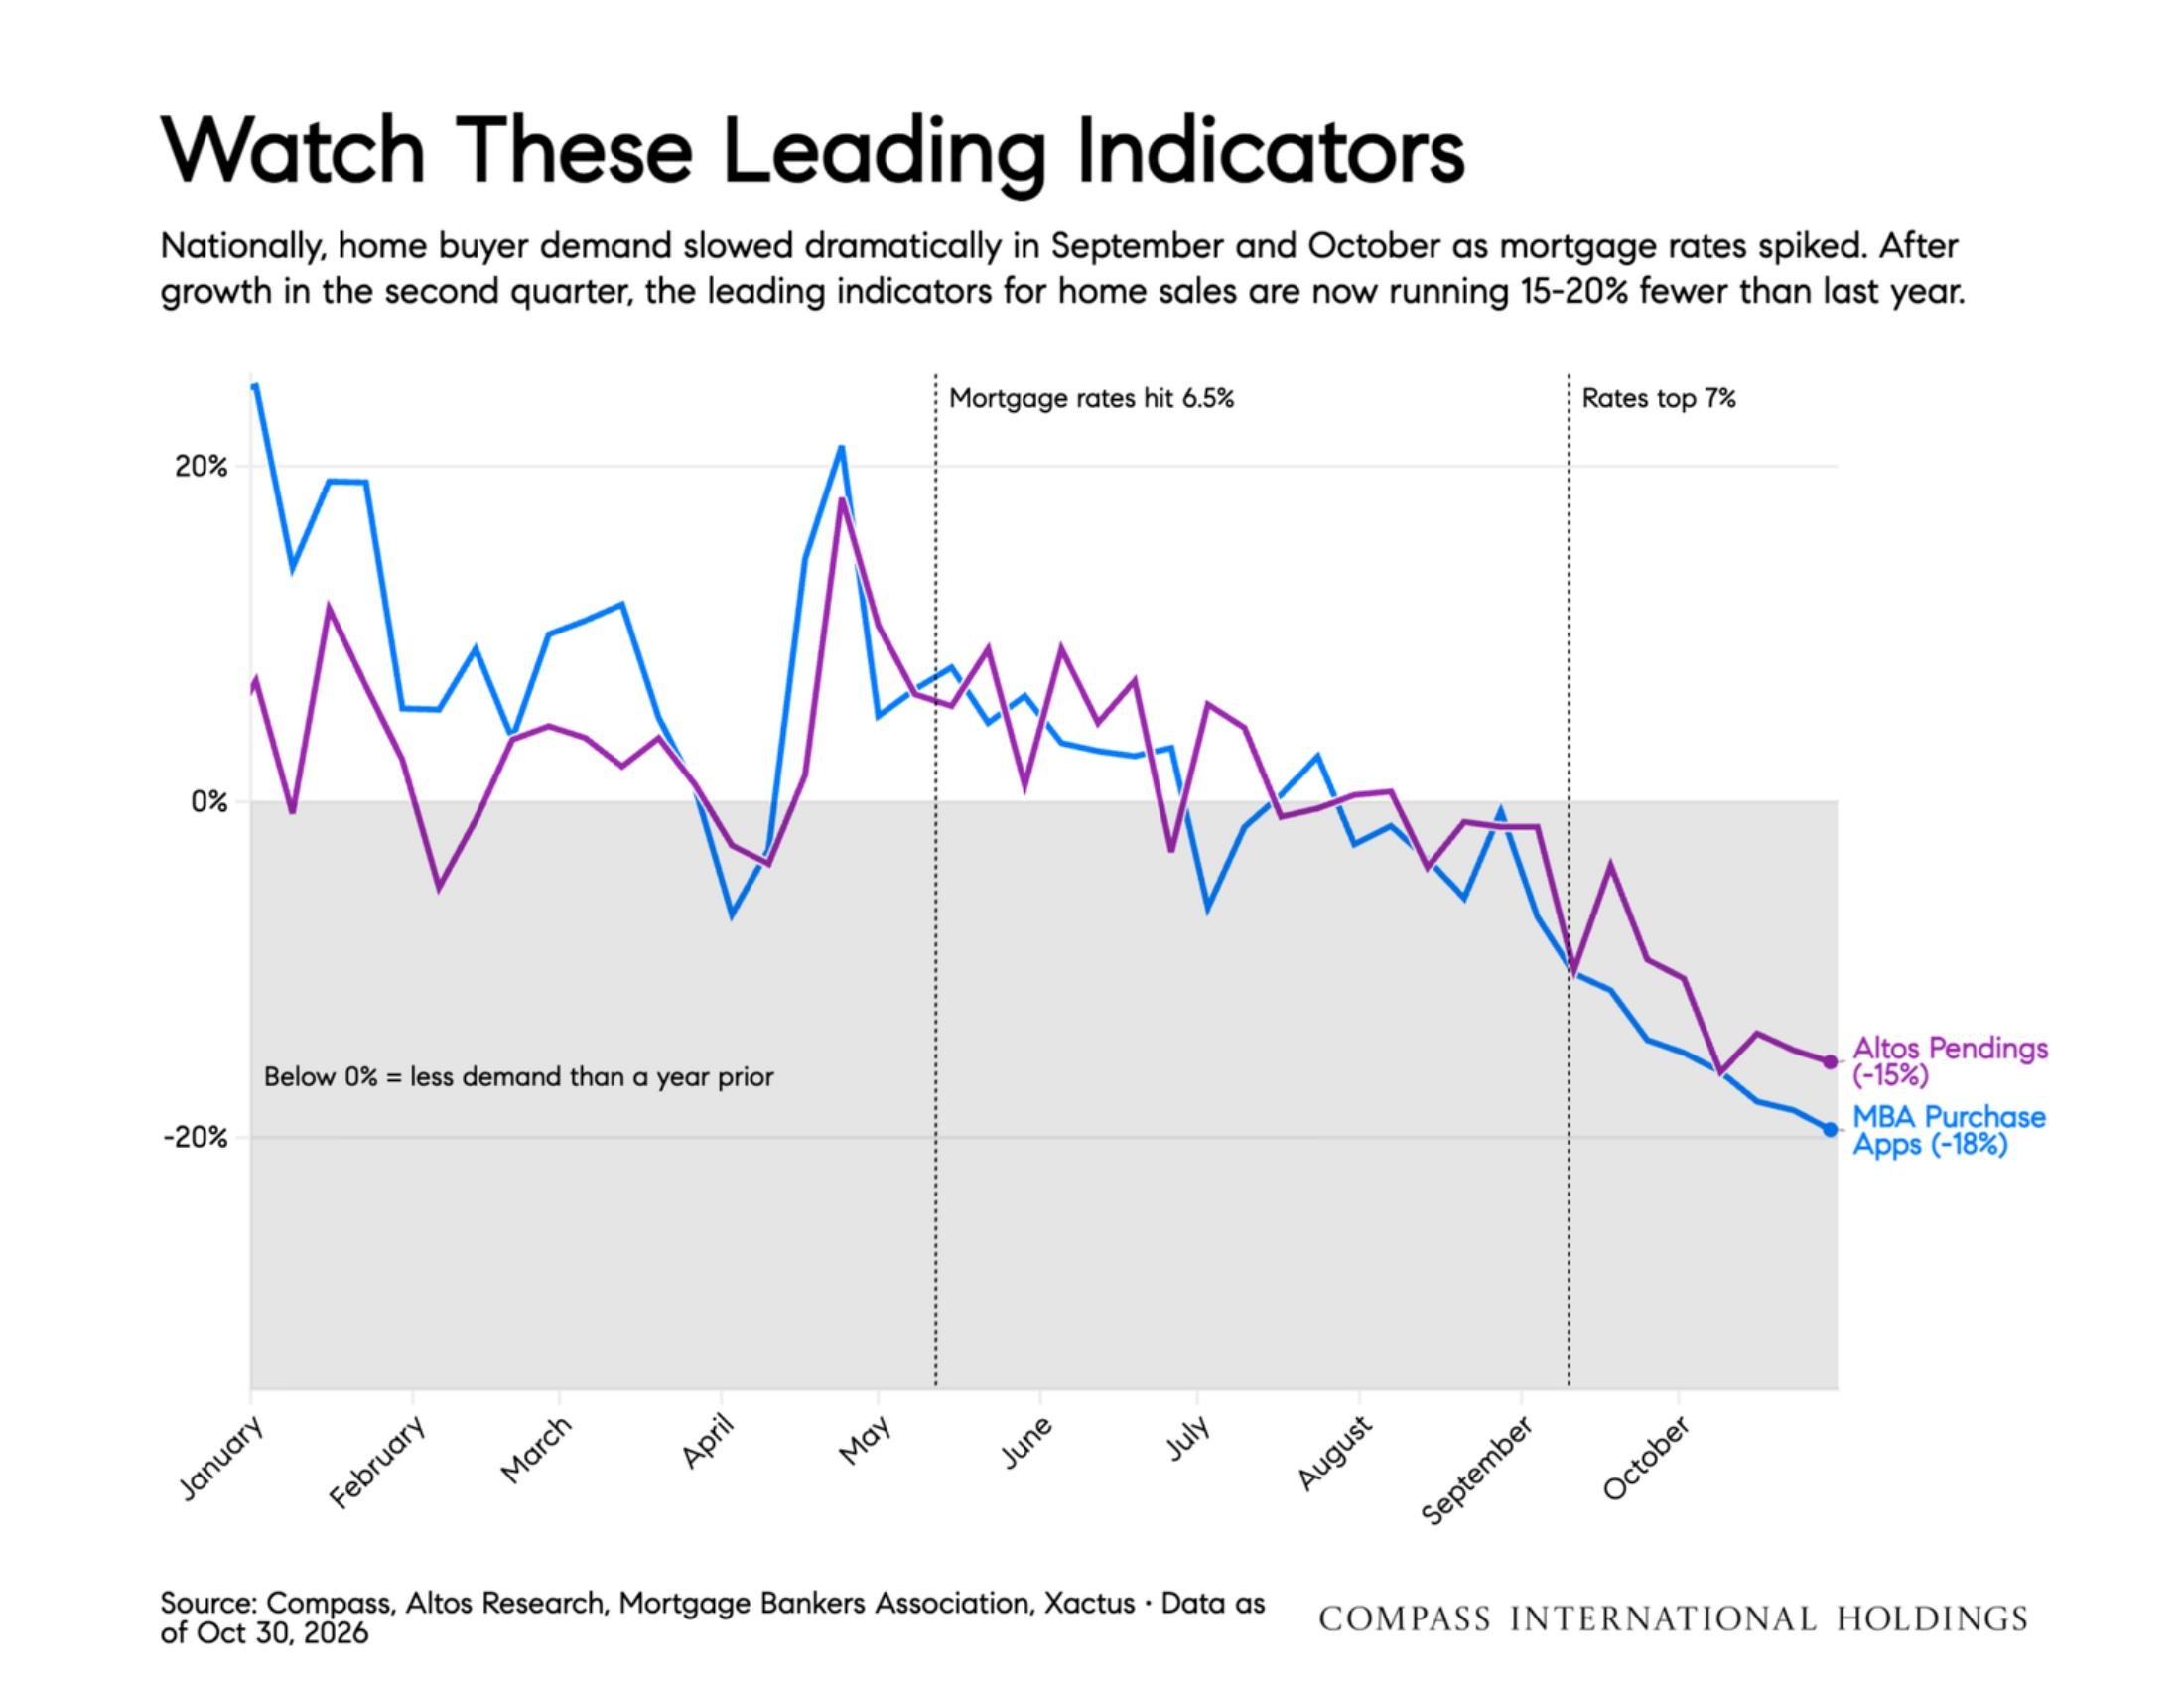
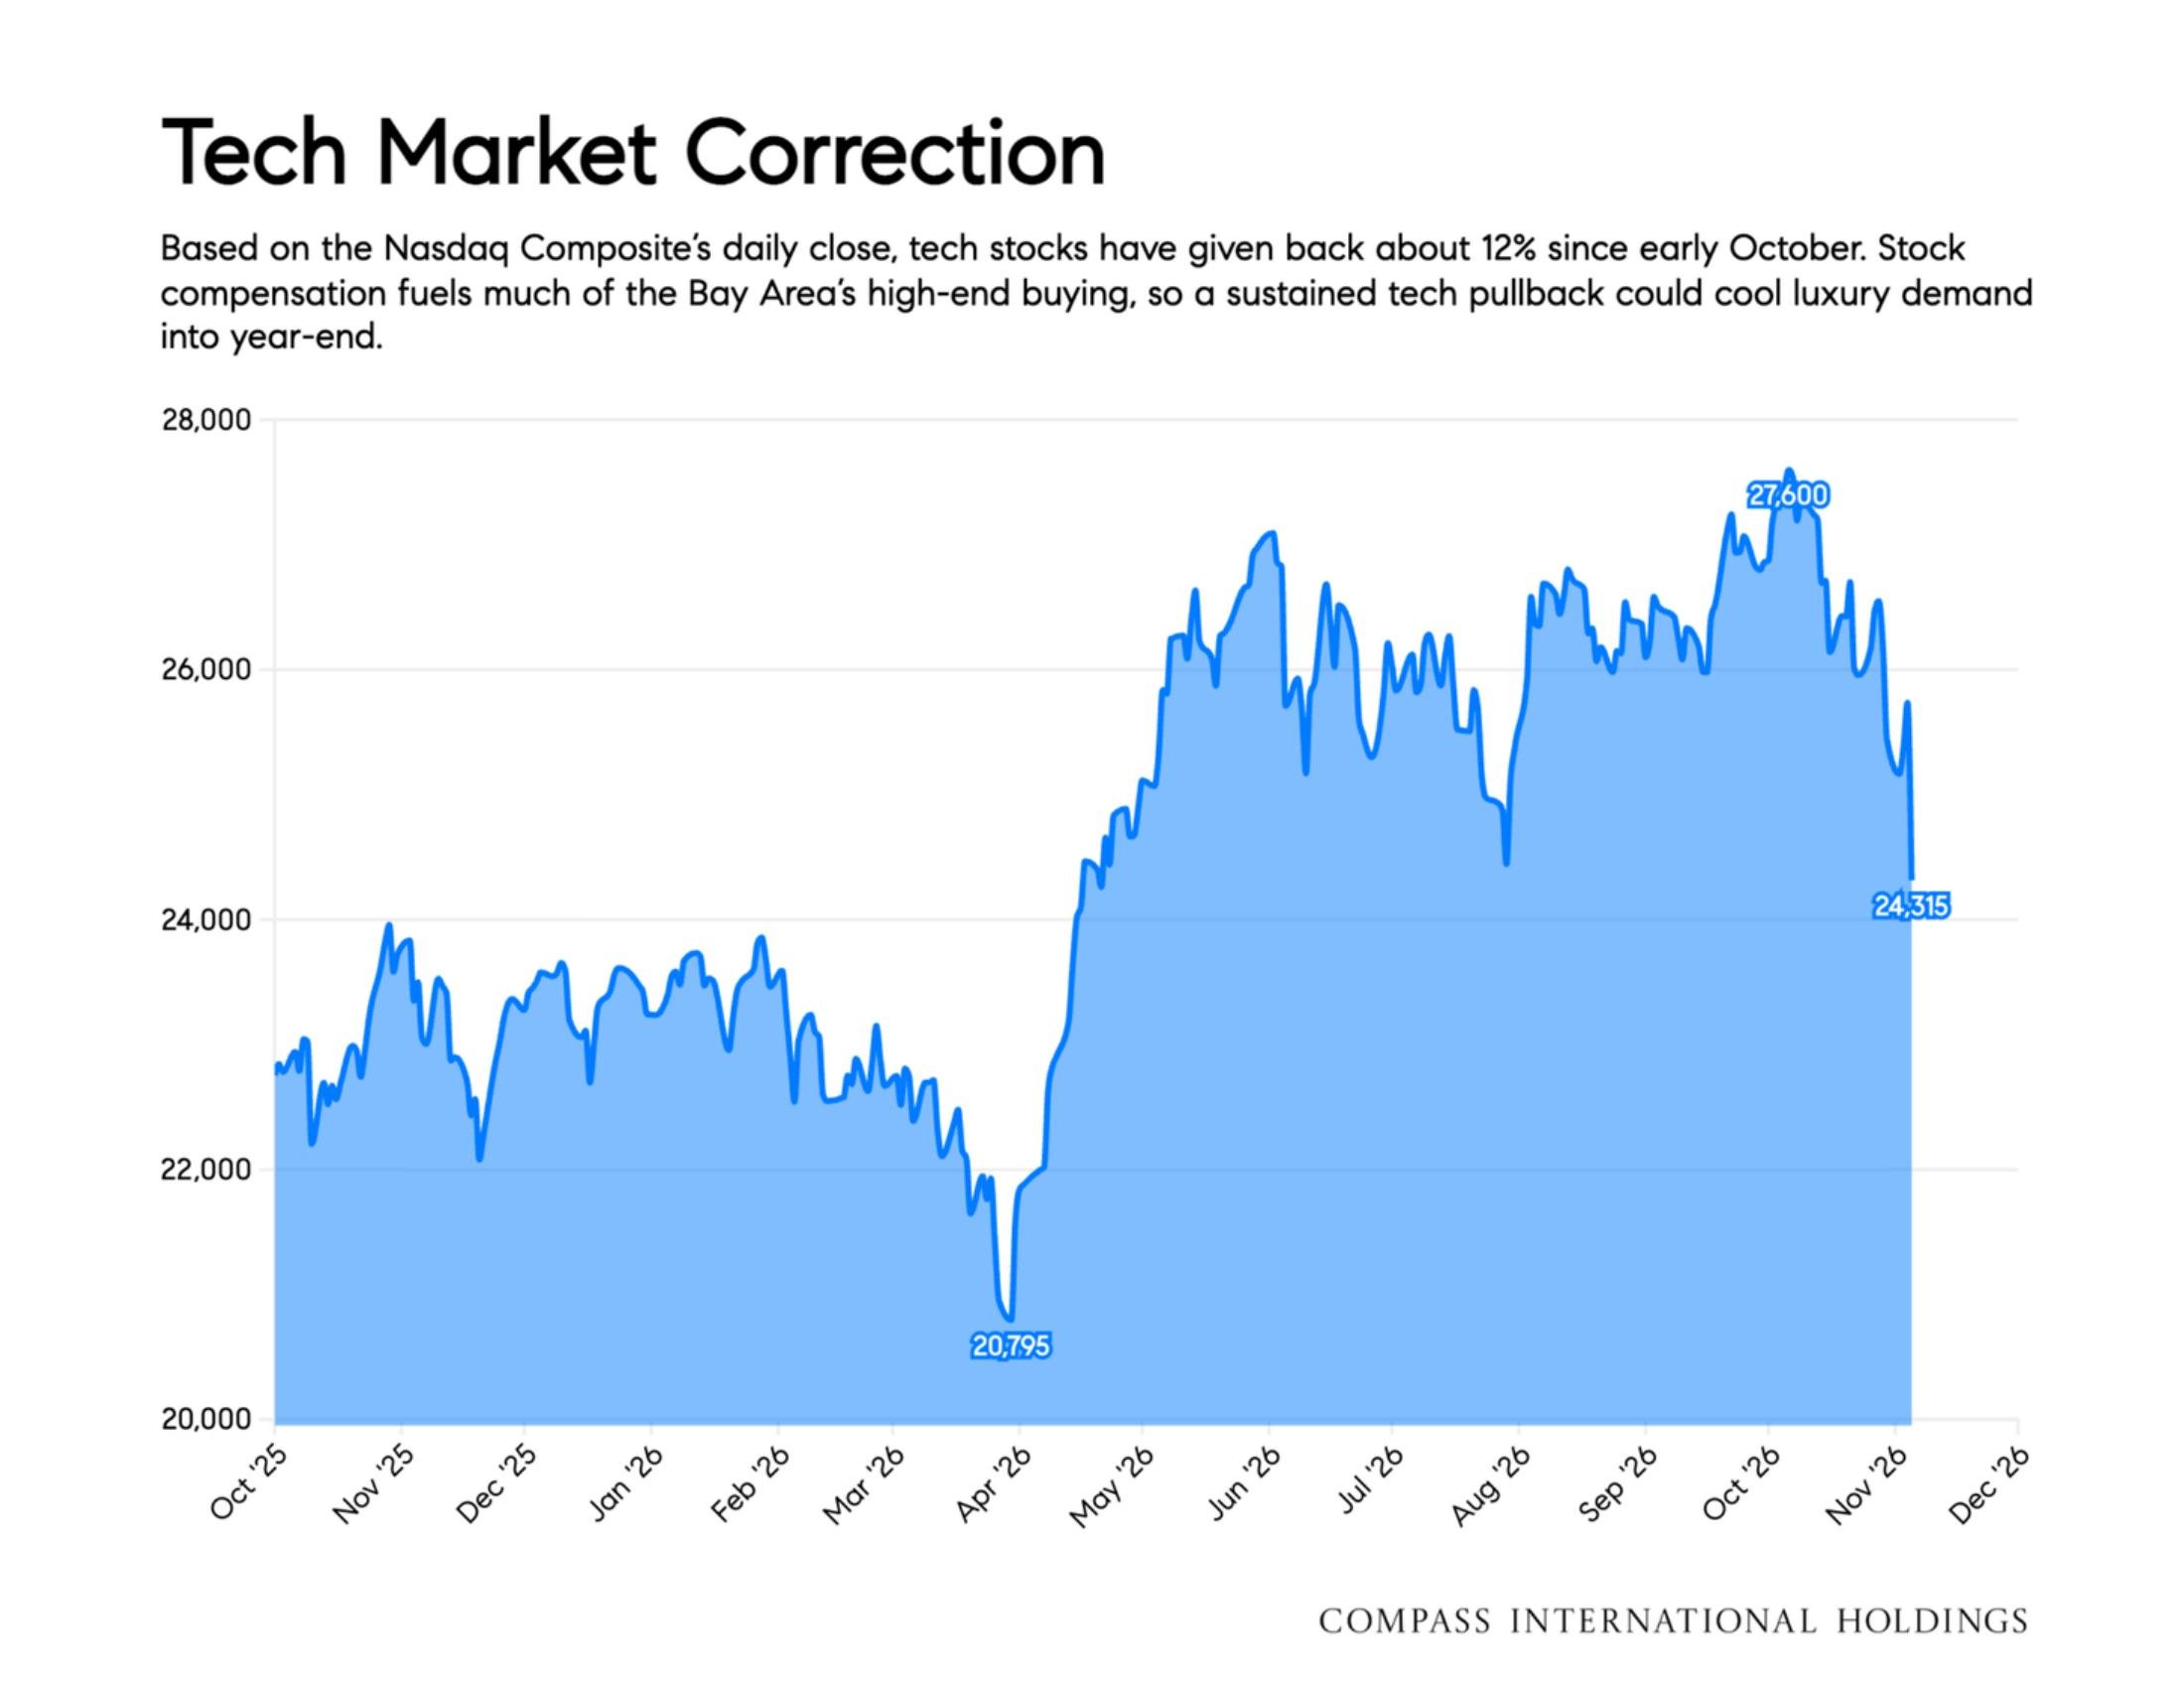
In April, a powerful jump in tech company valuations, both public and private, fueled buyer demand, especially for higher-end homes in San Francisco through the summer. Now, with mortgage rates near 7.5% in early fall, buyer demand has slowed dramatically. Pending home sales in October were about 15% below last year, and Northern California is tracking close to the rest of the country.
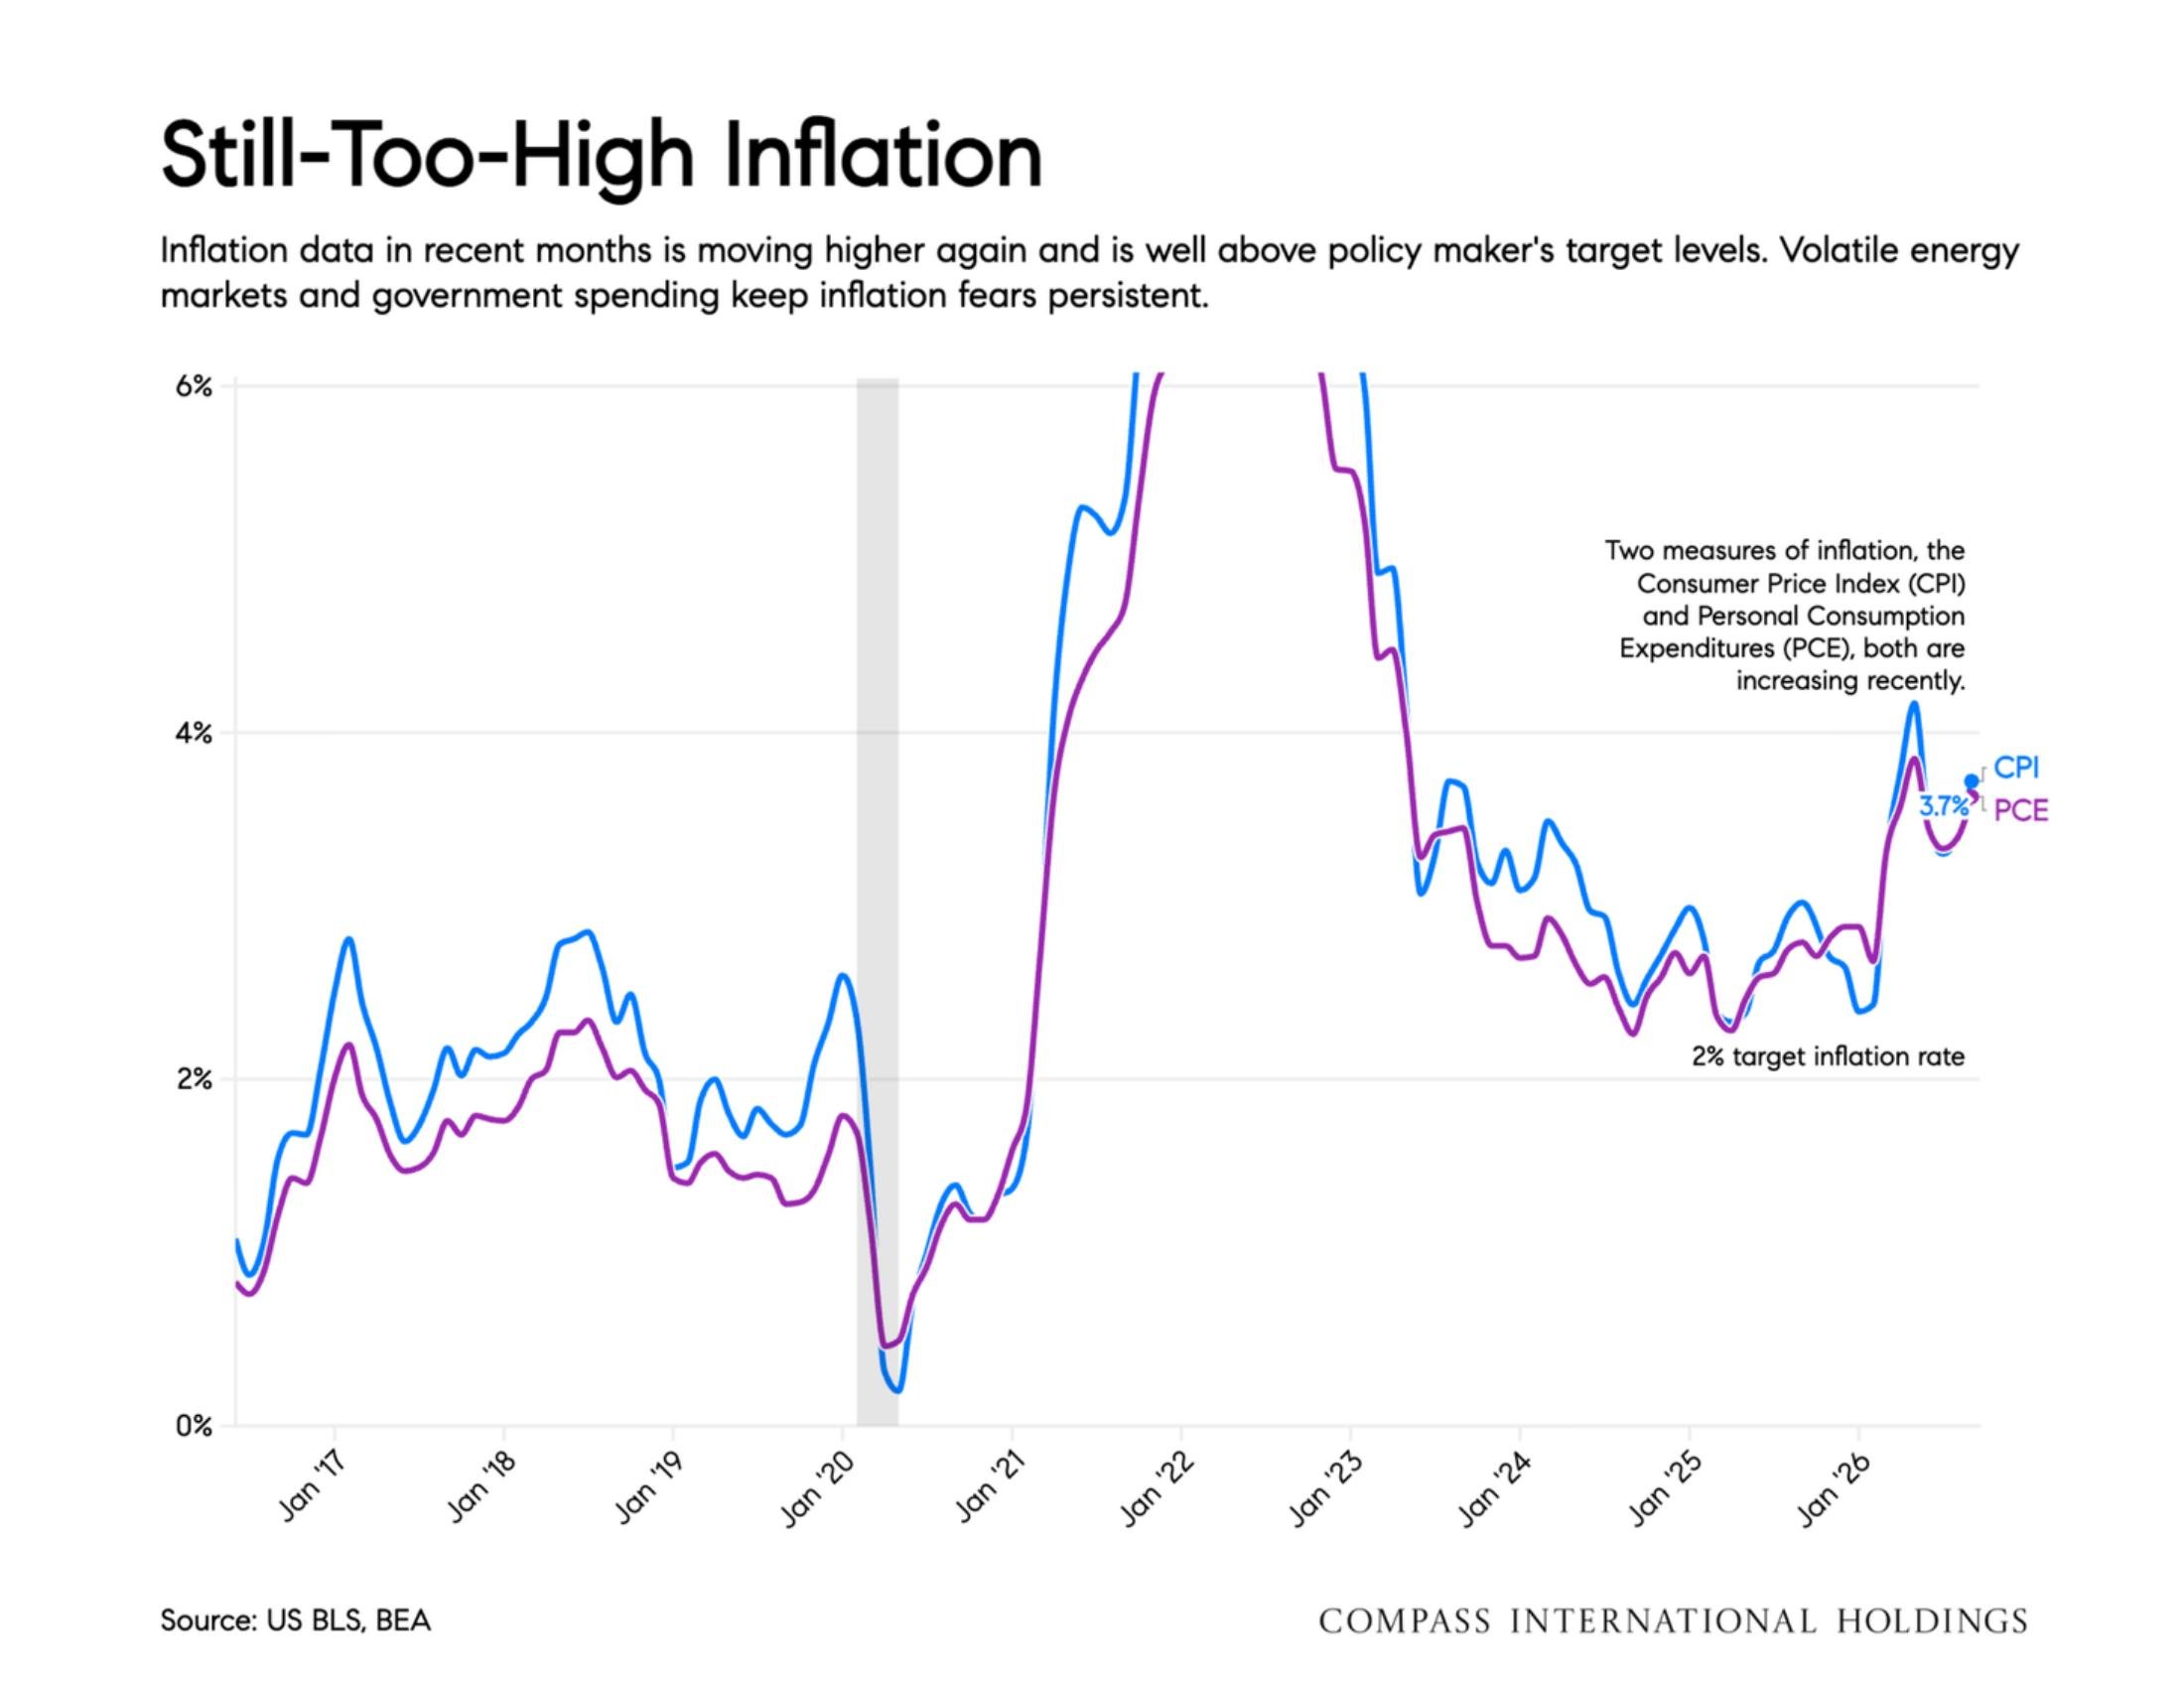
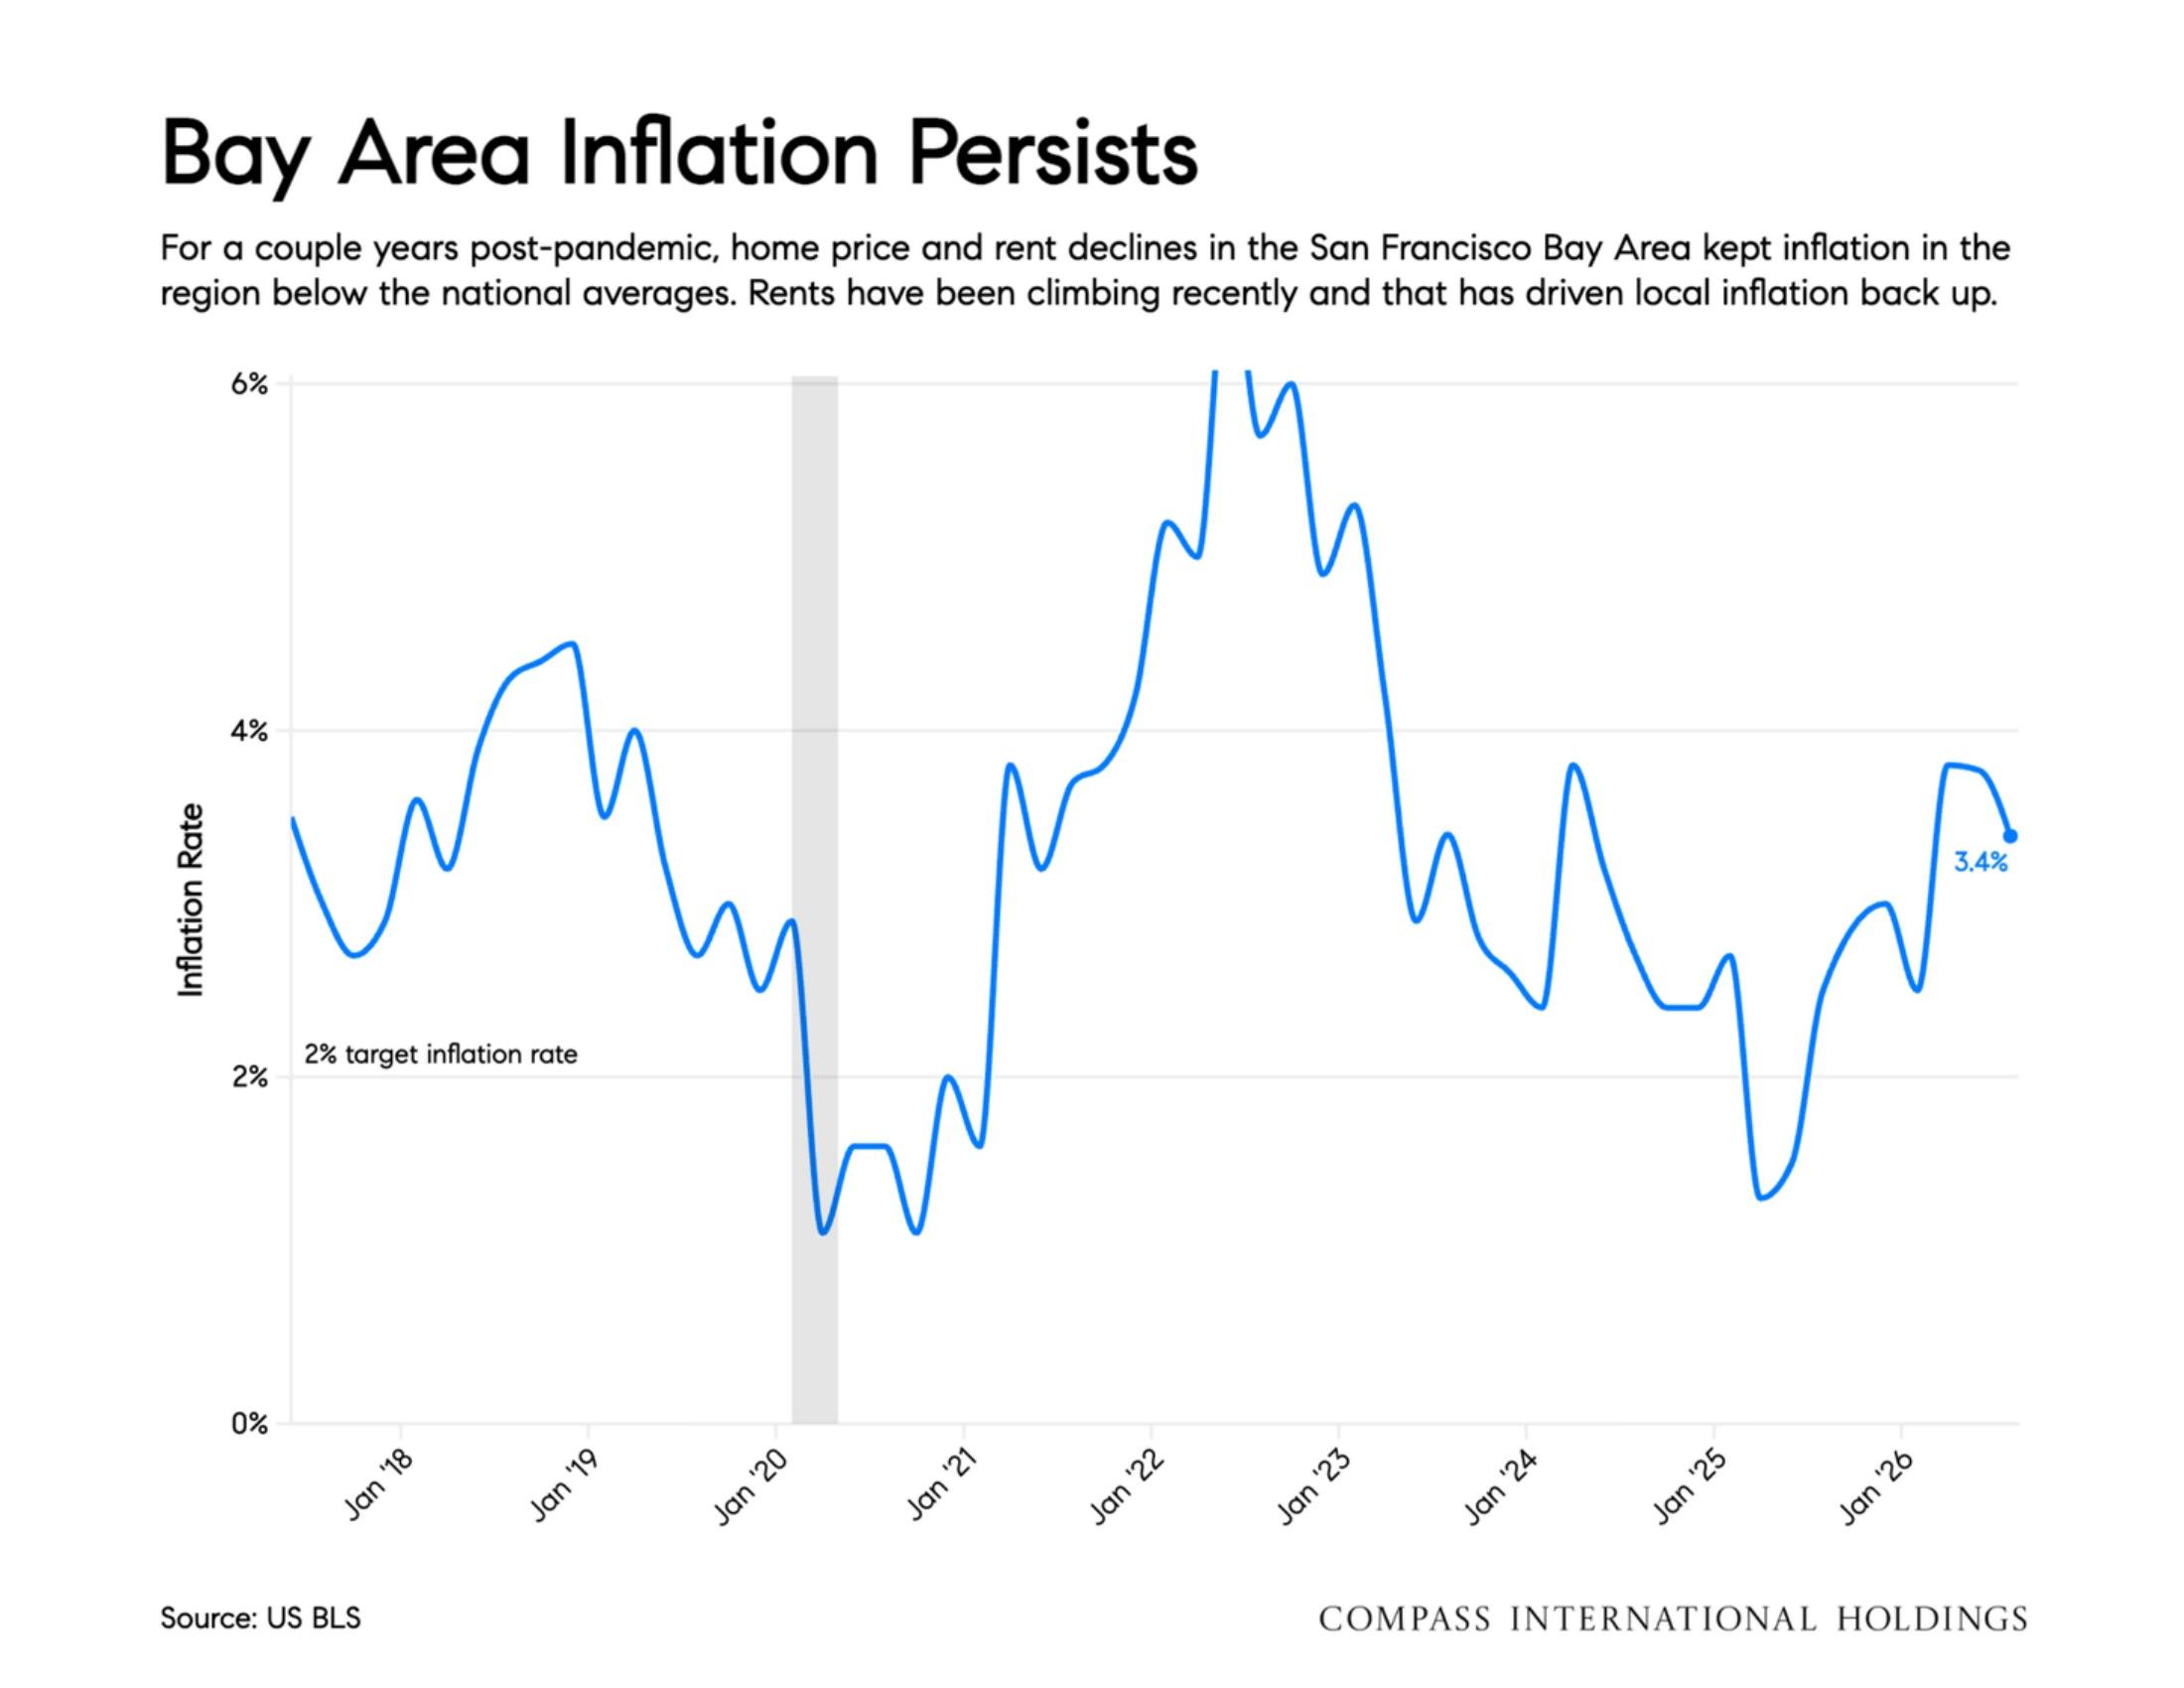
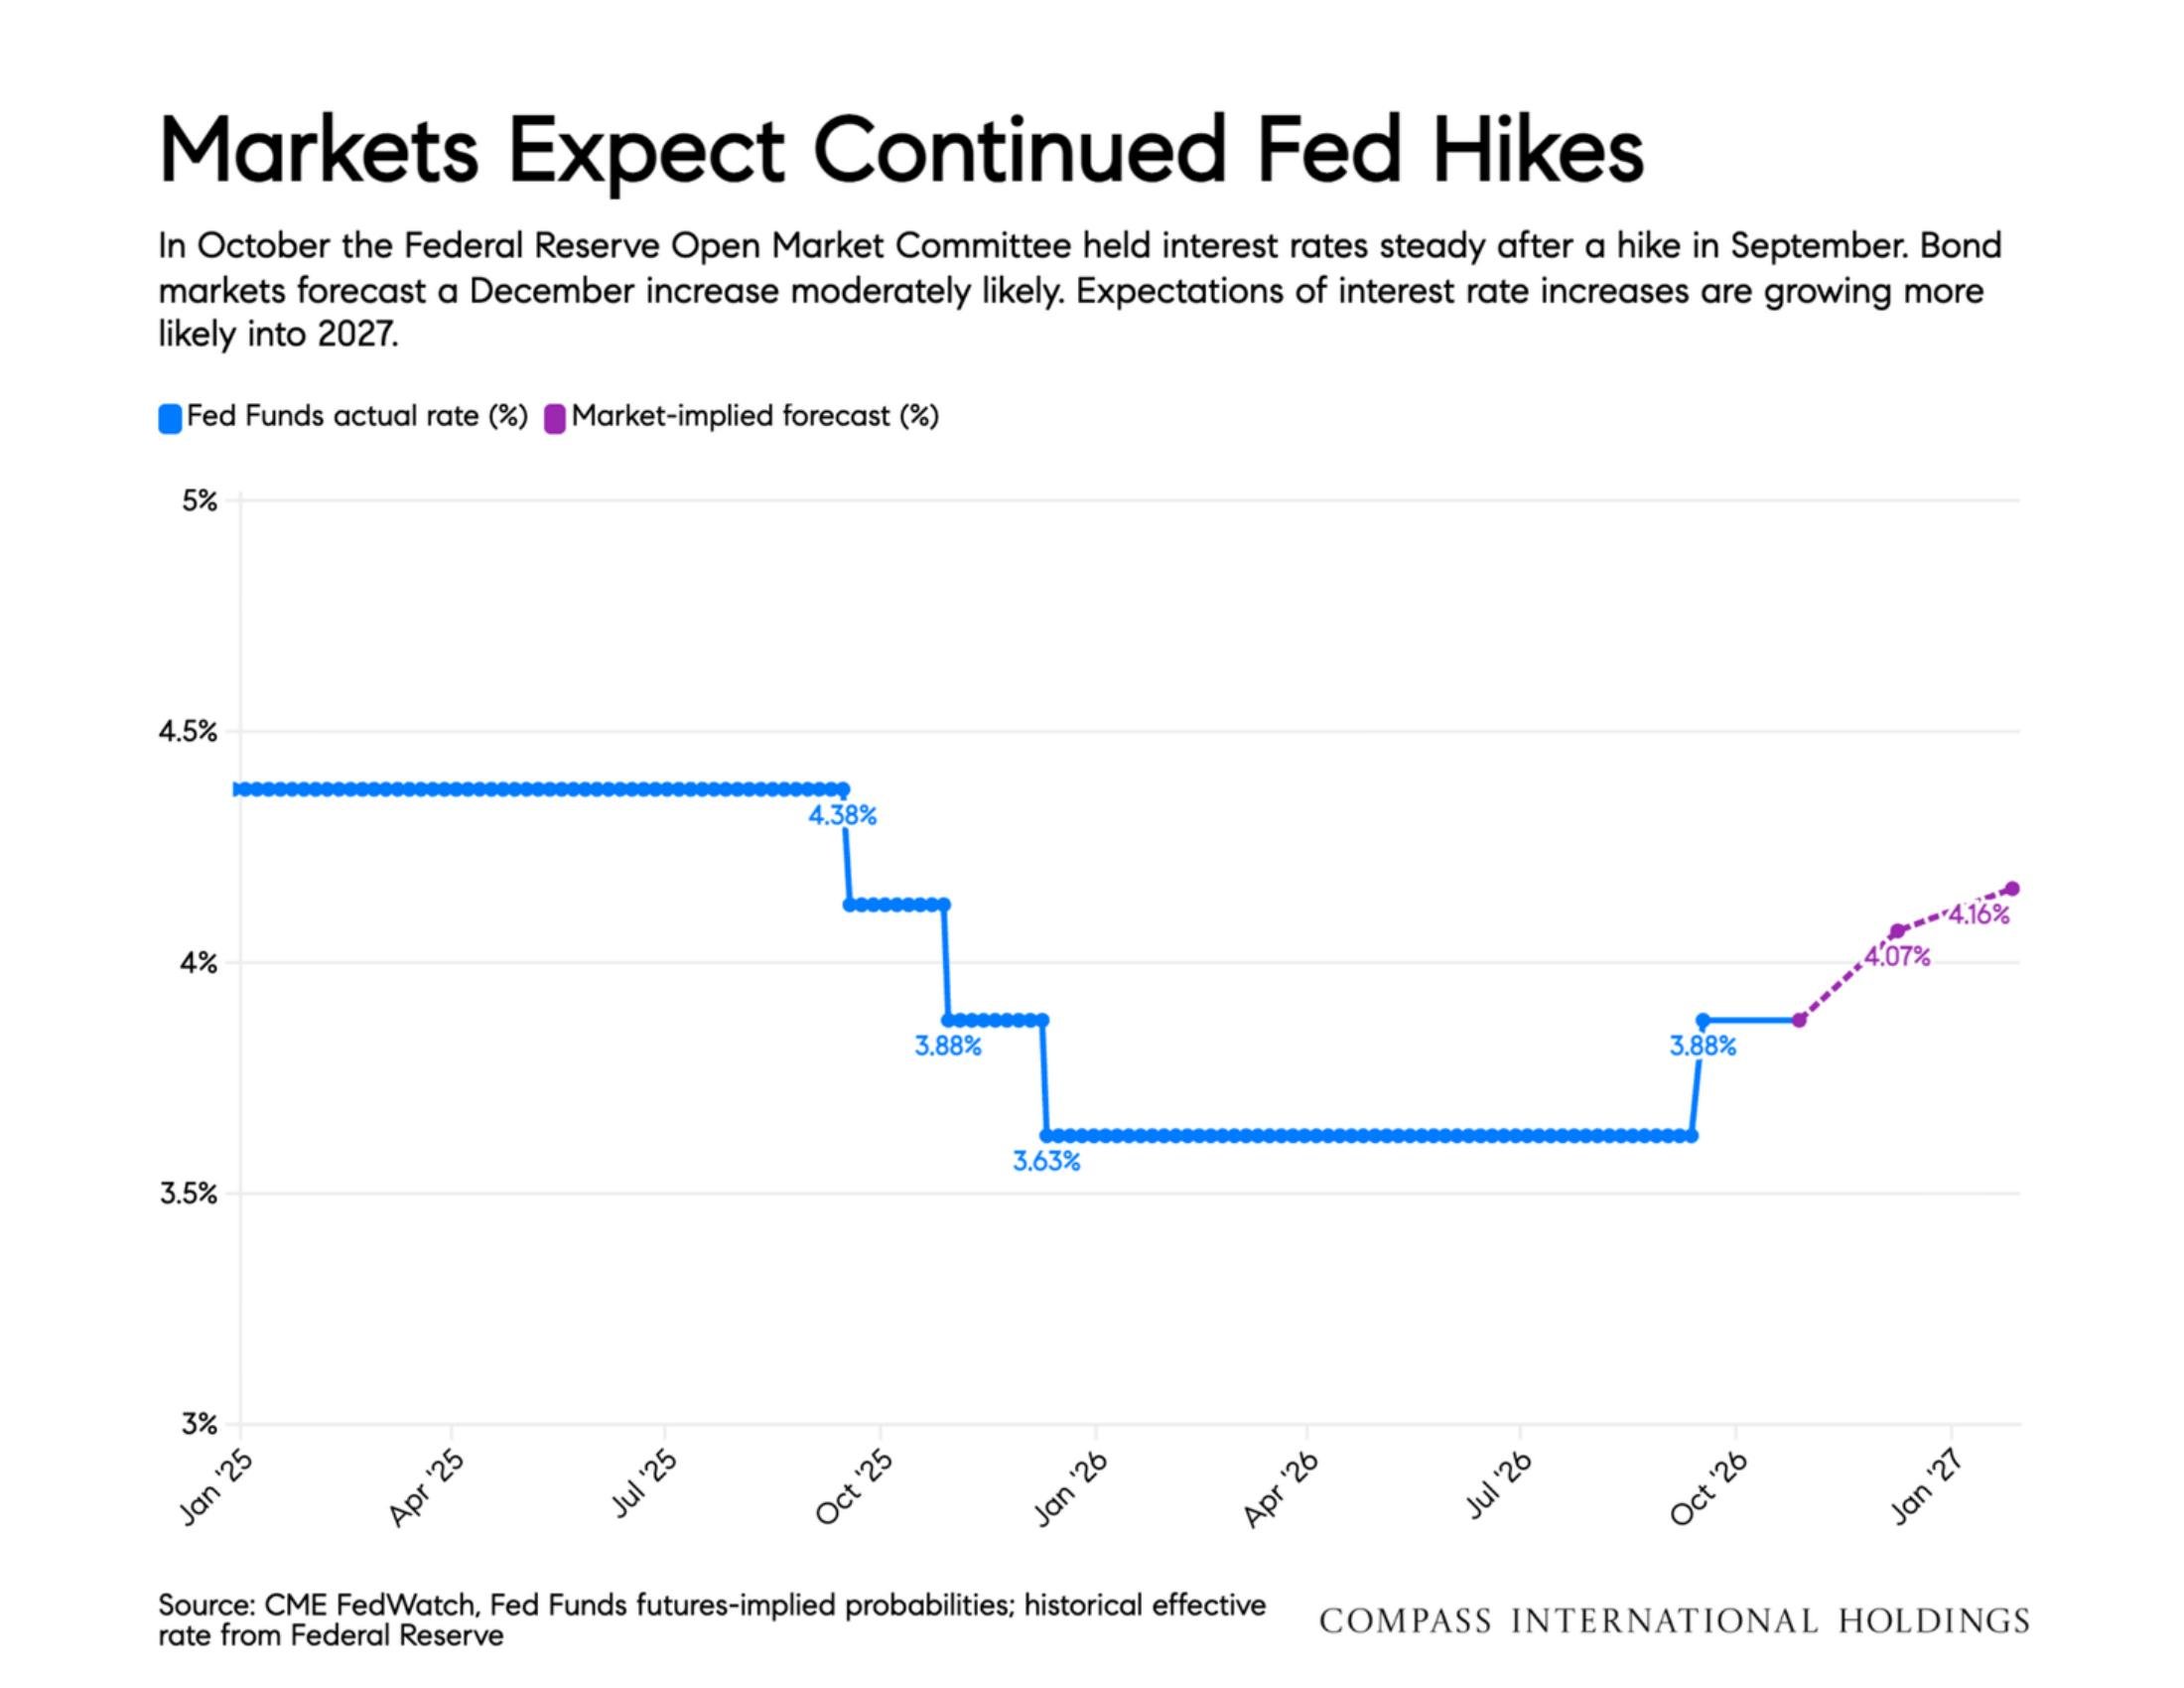
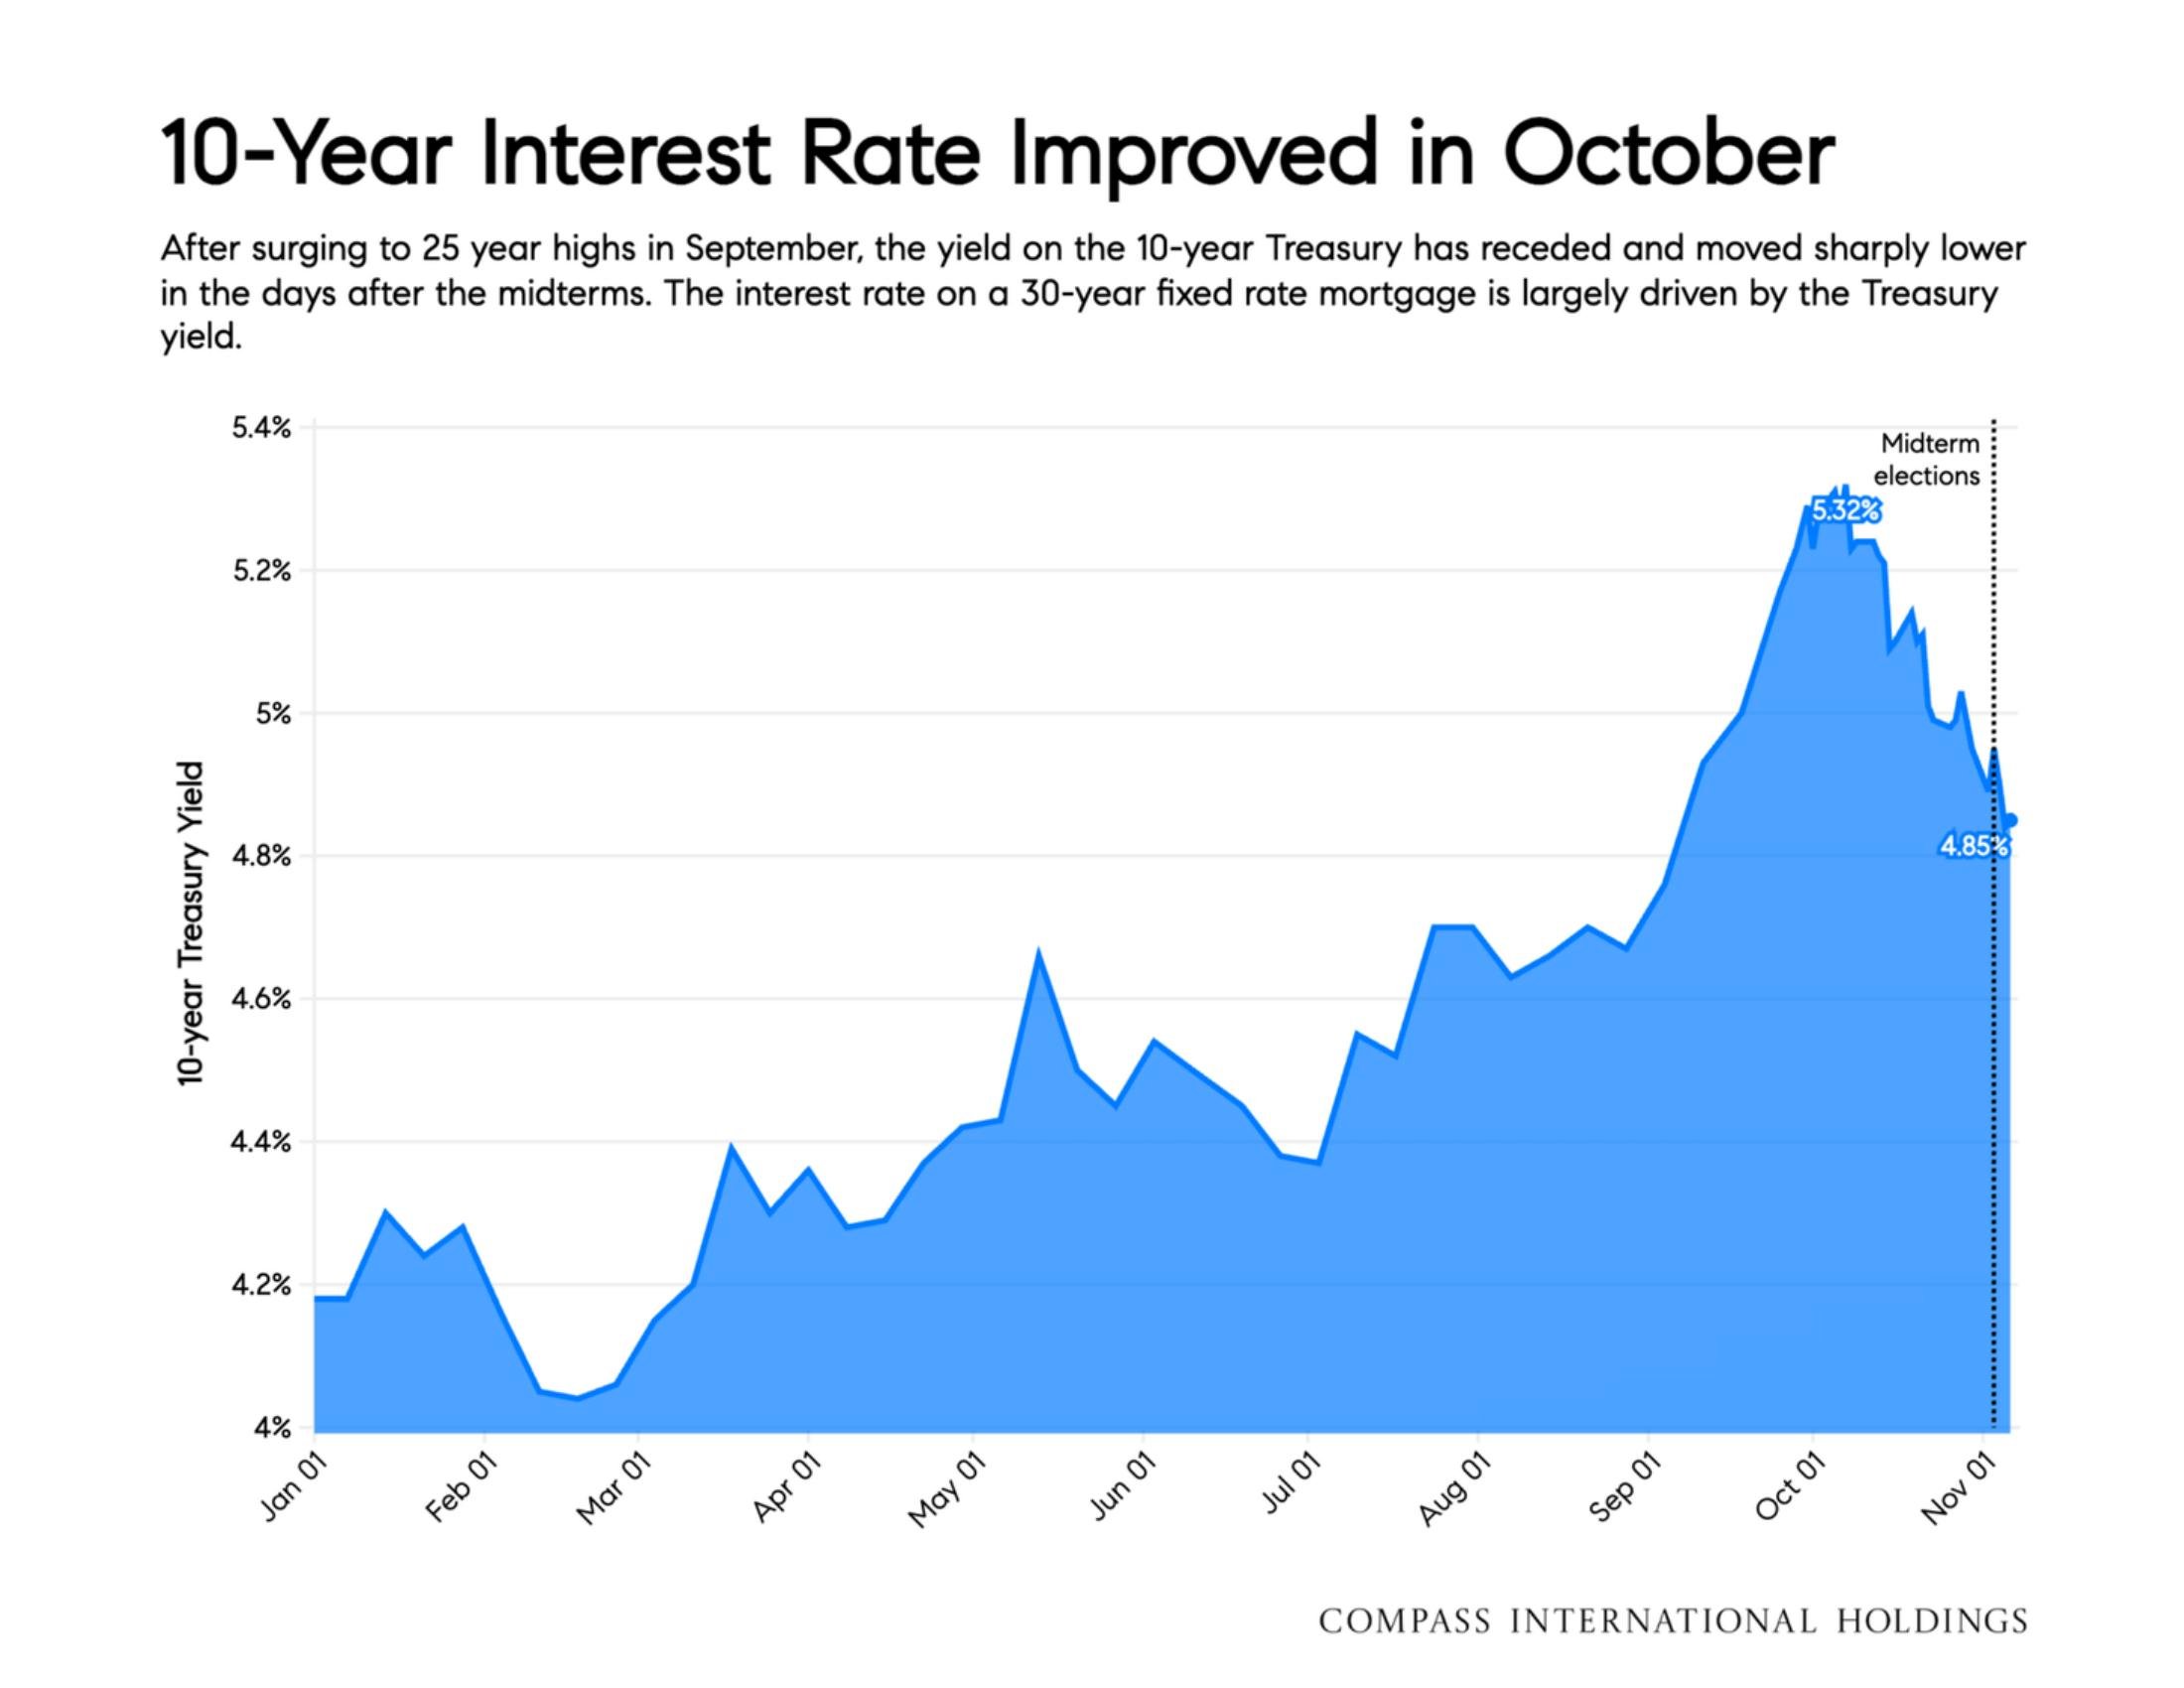
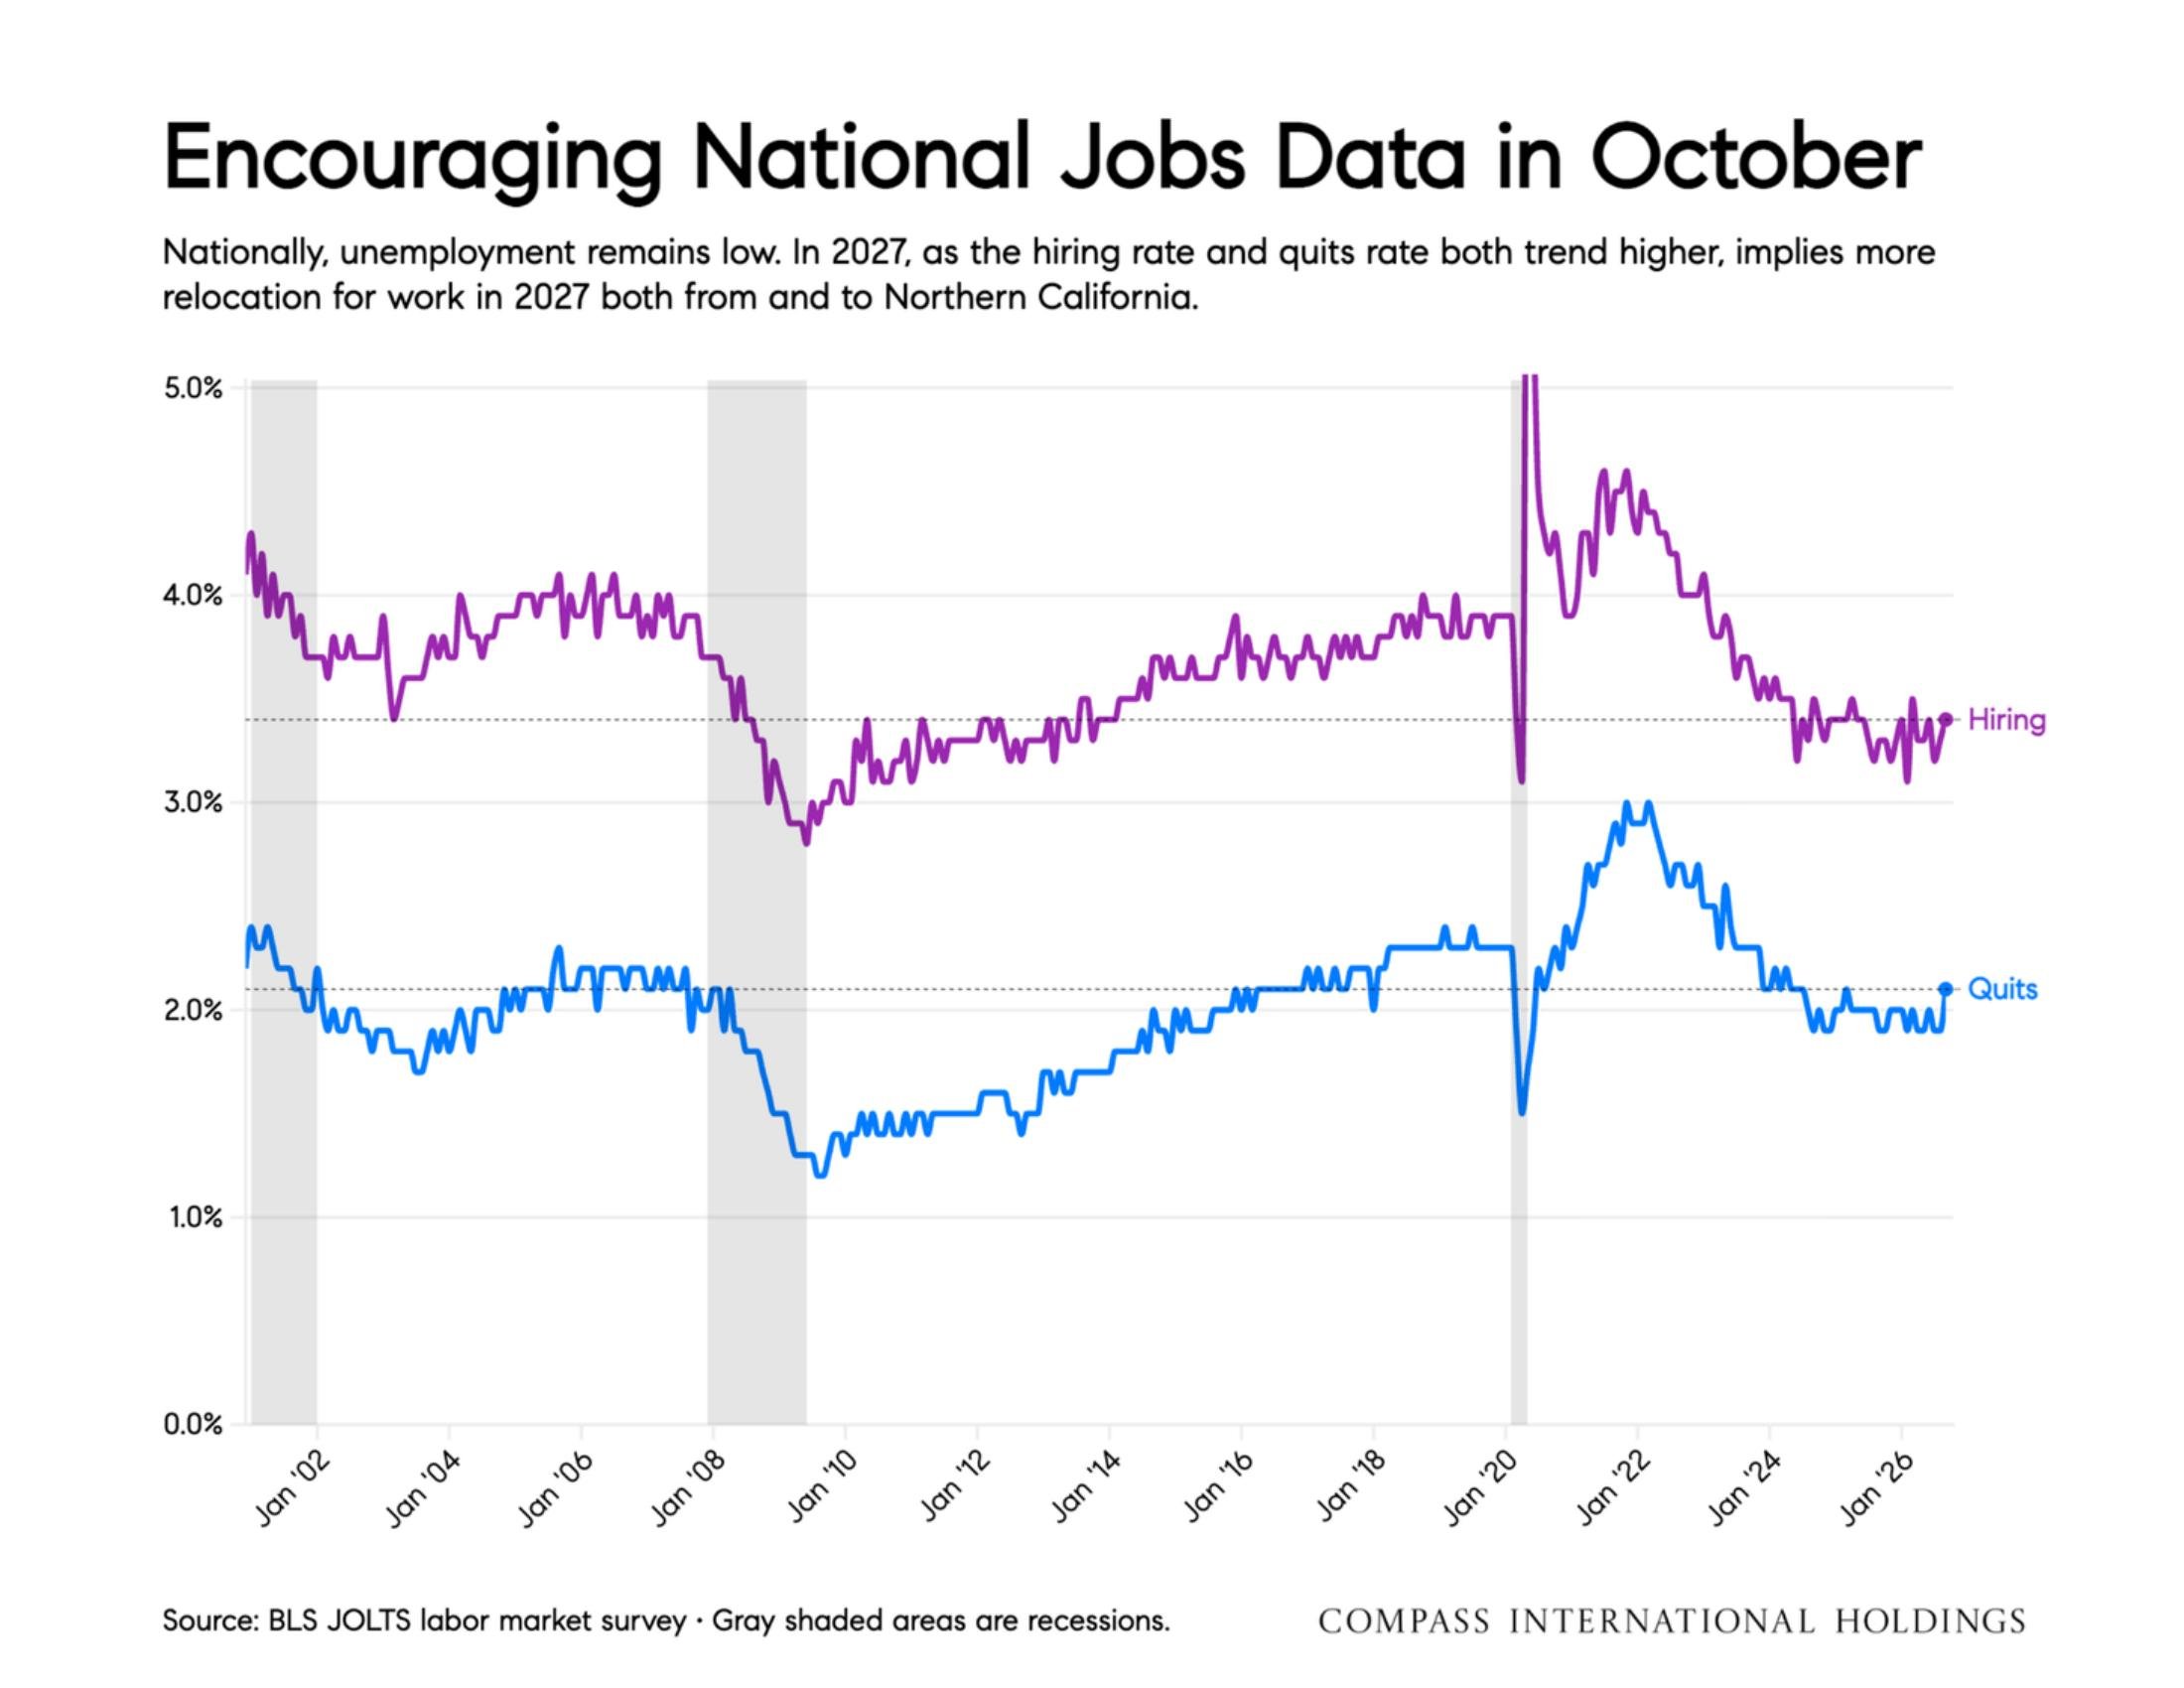
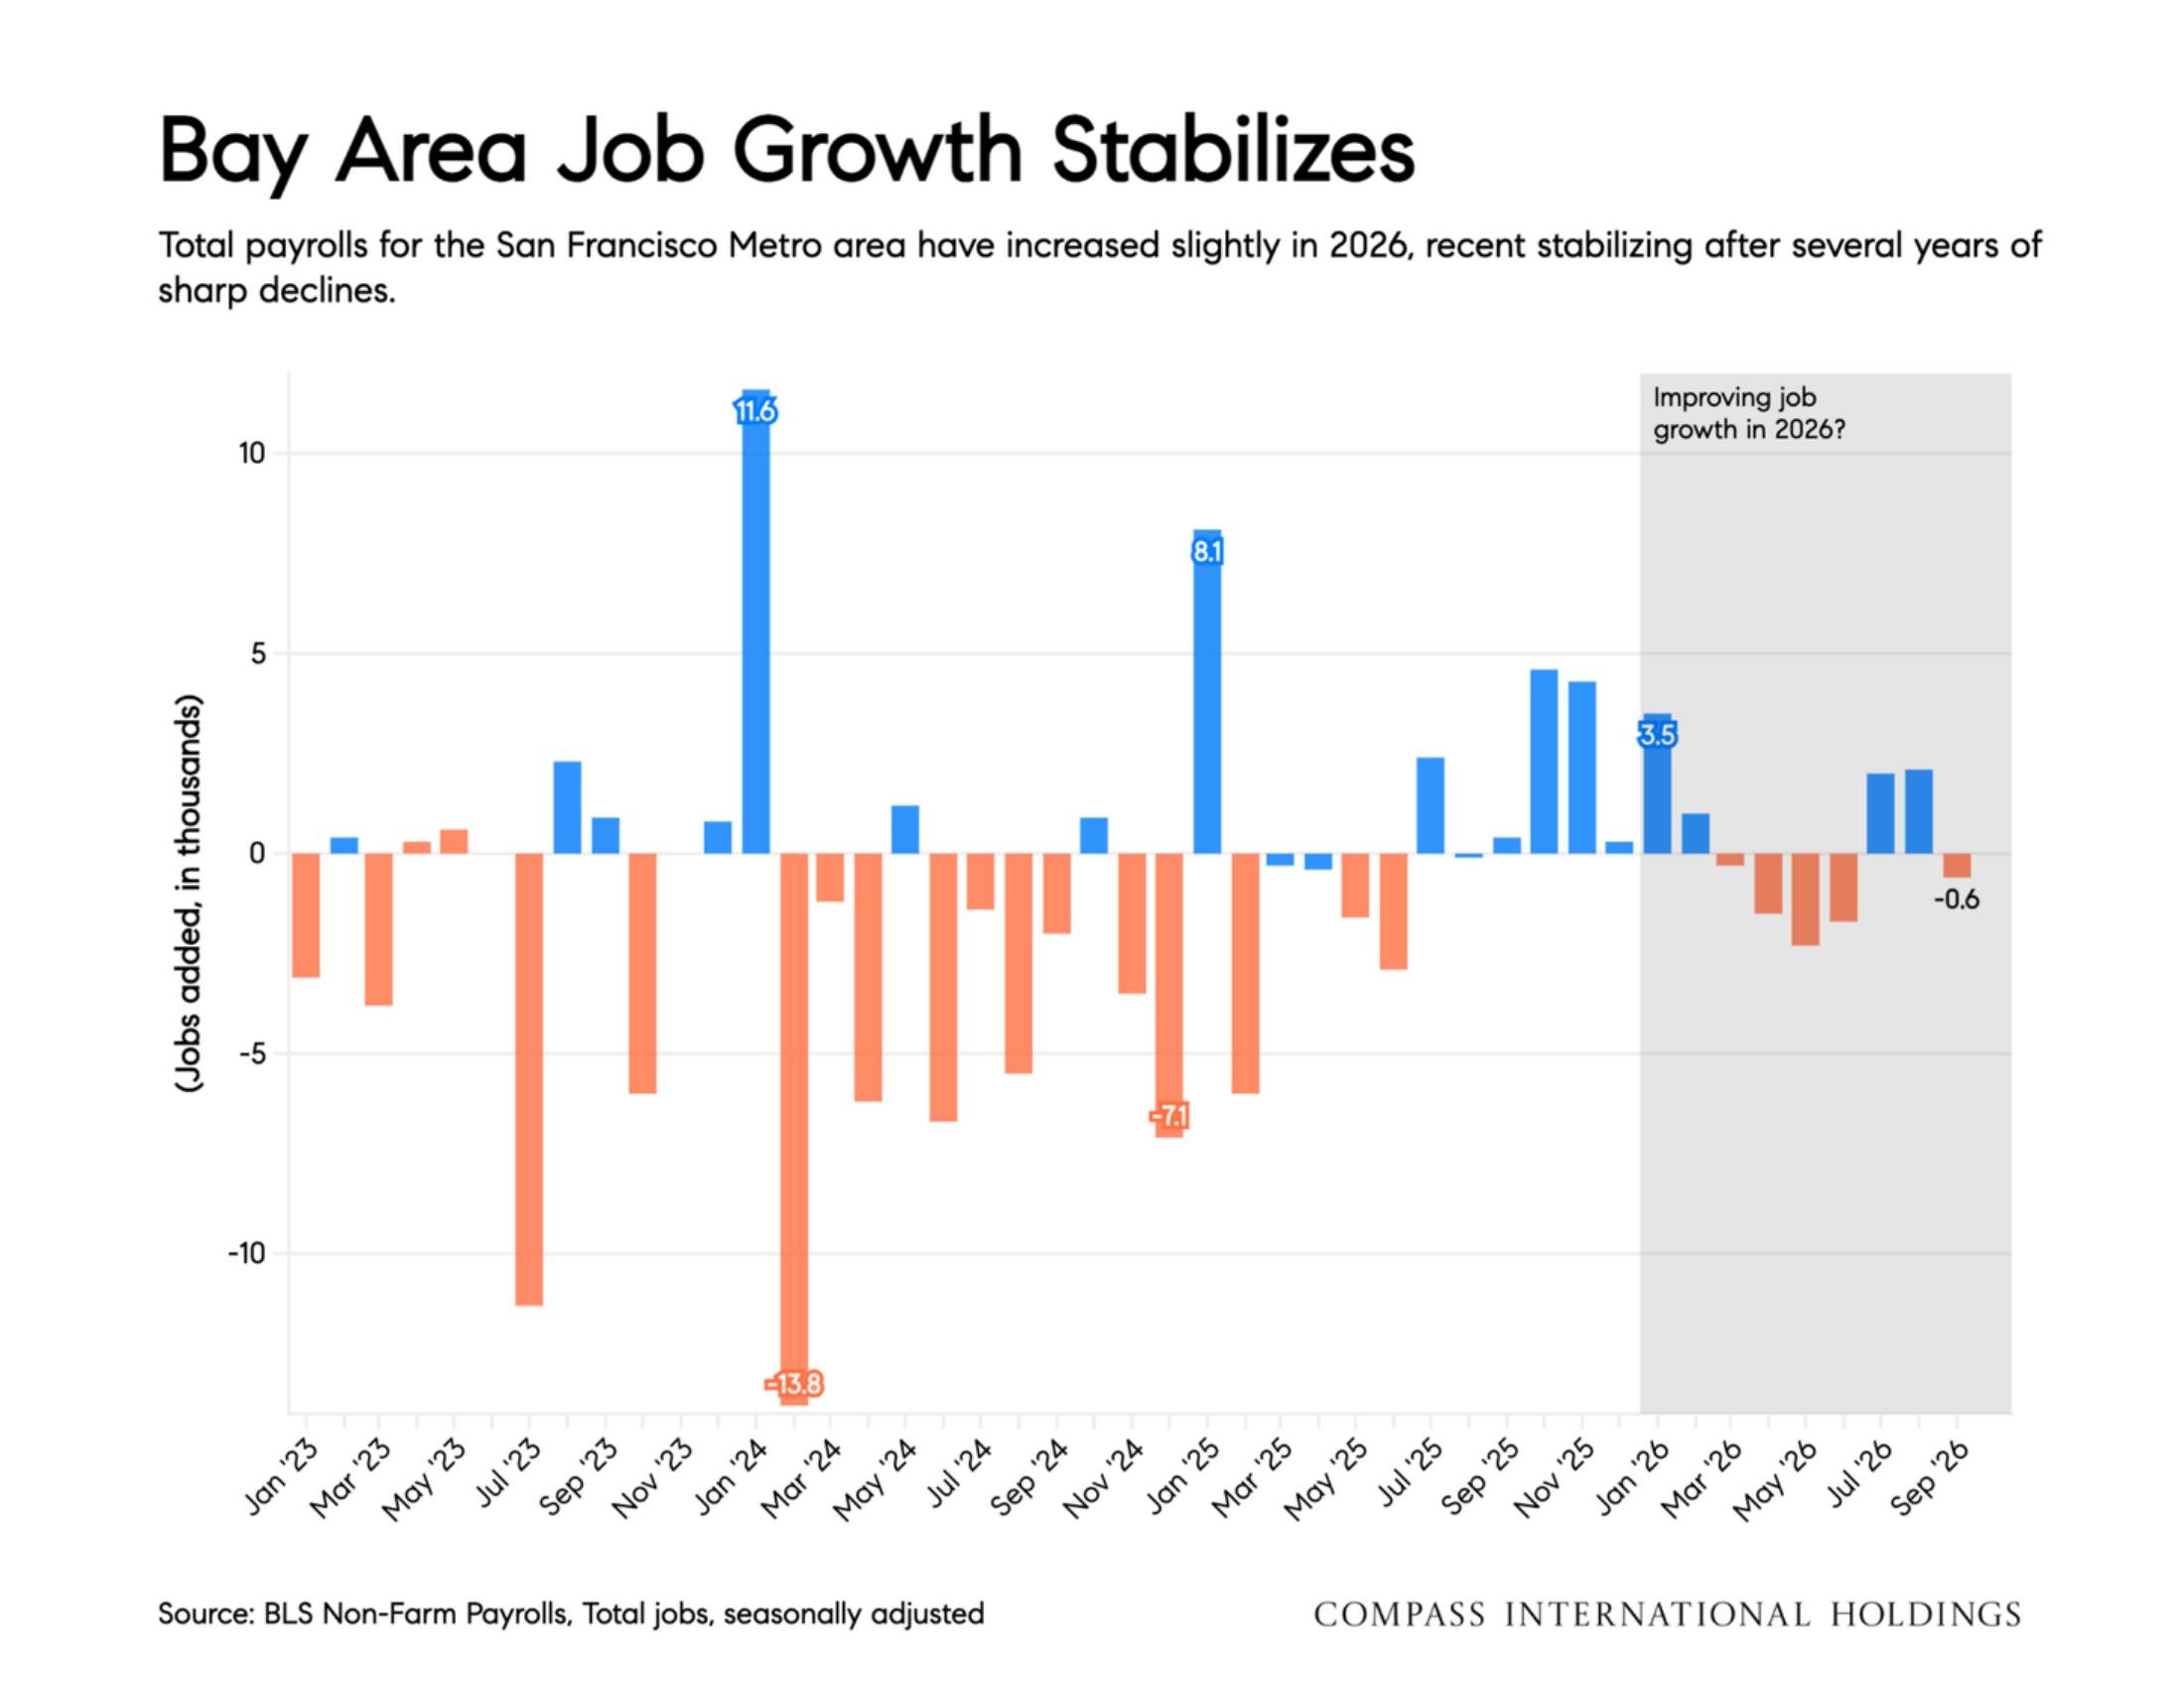
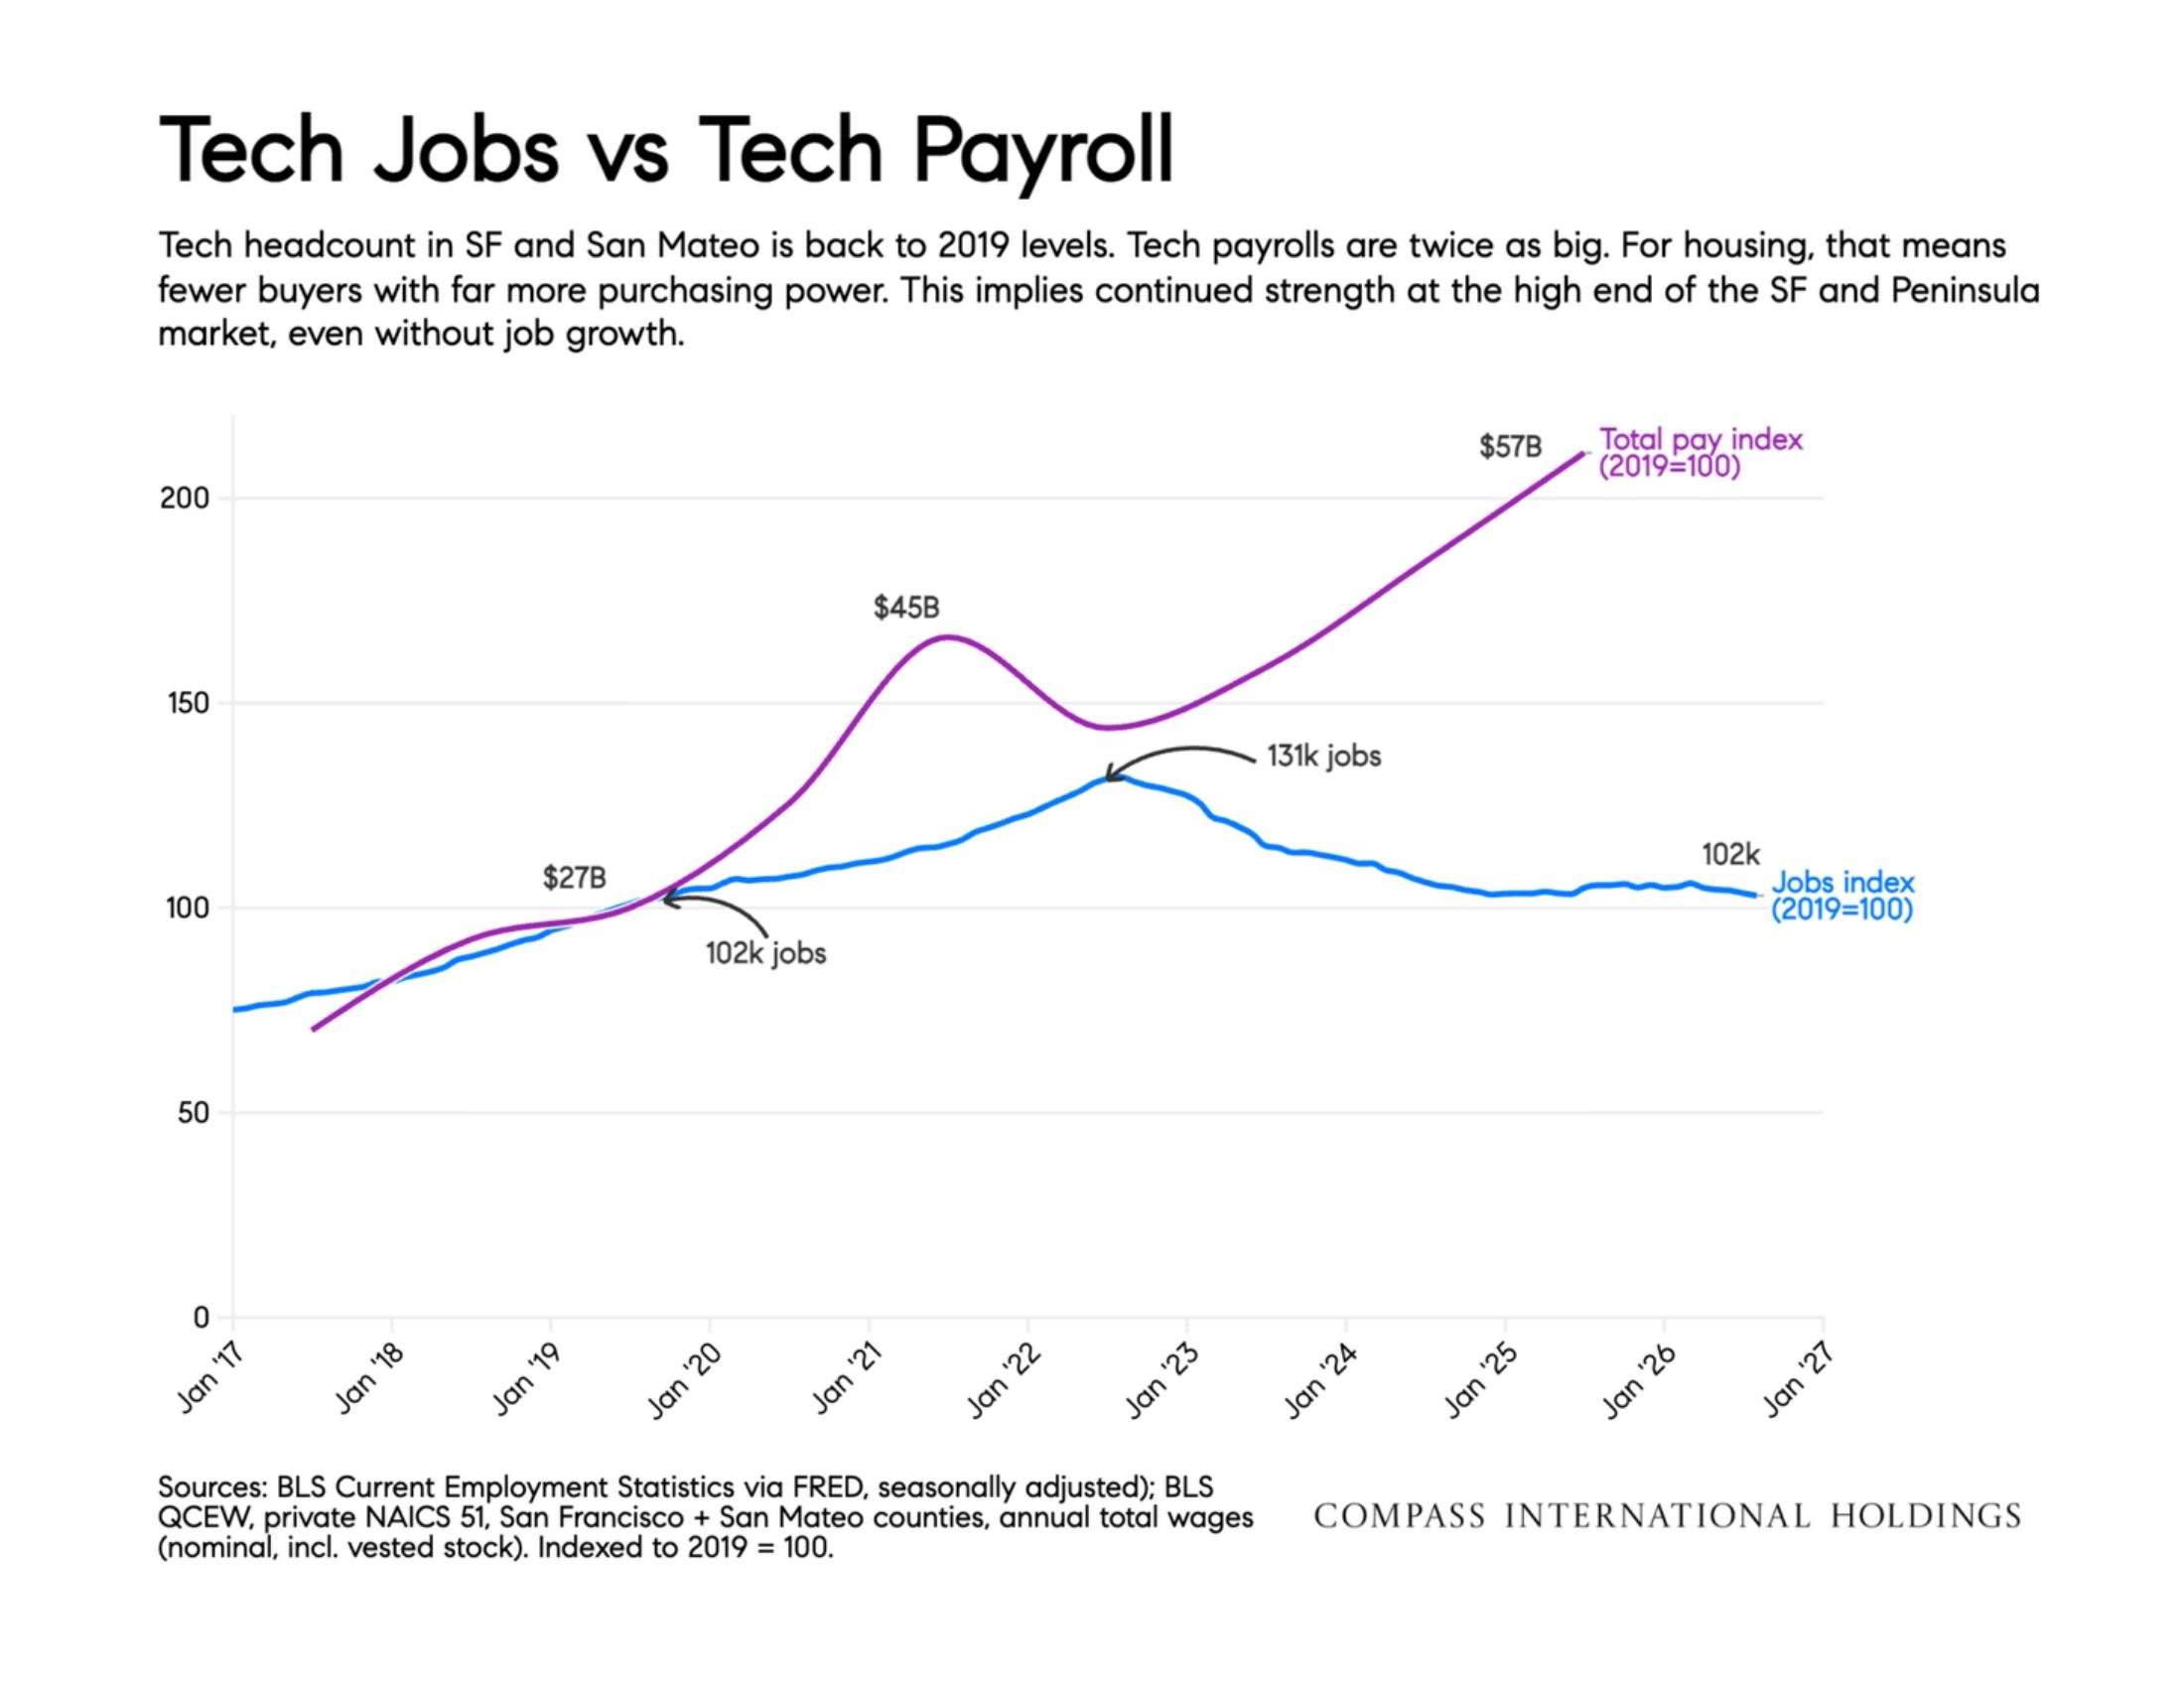
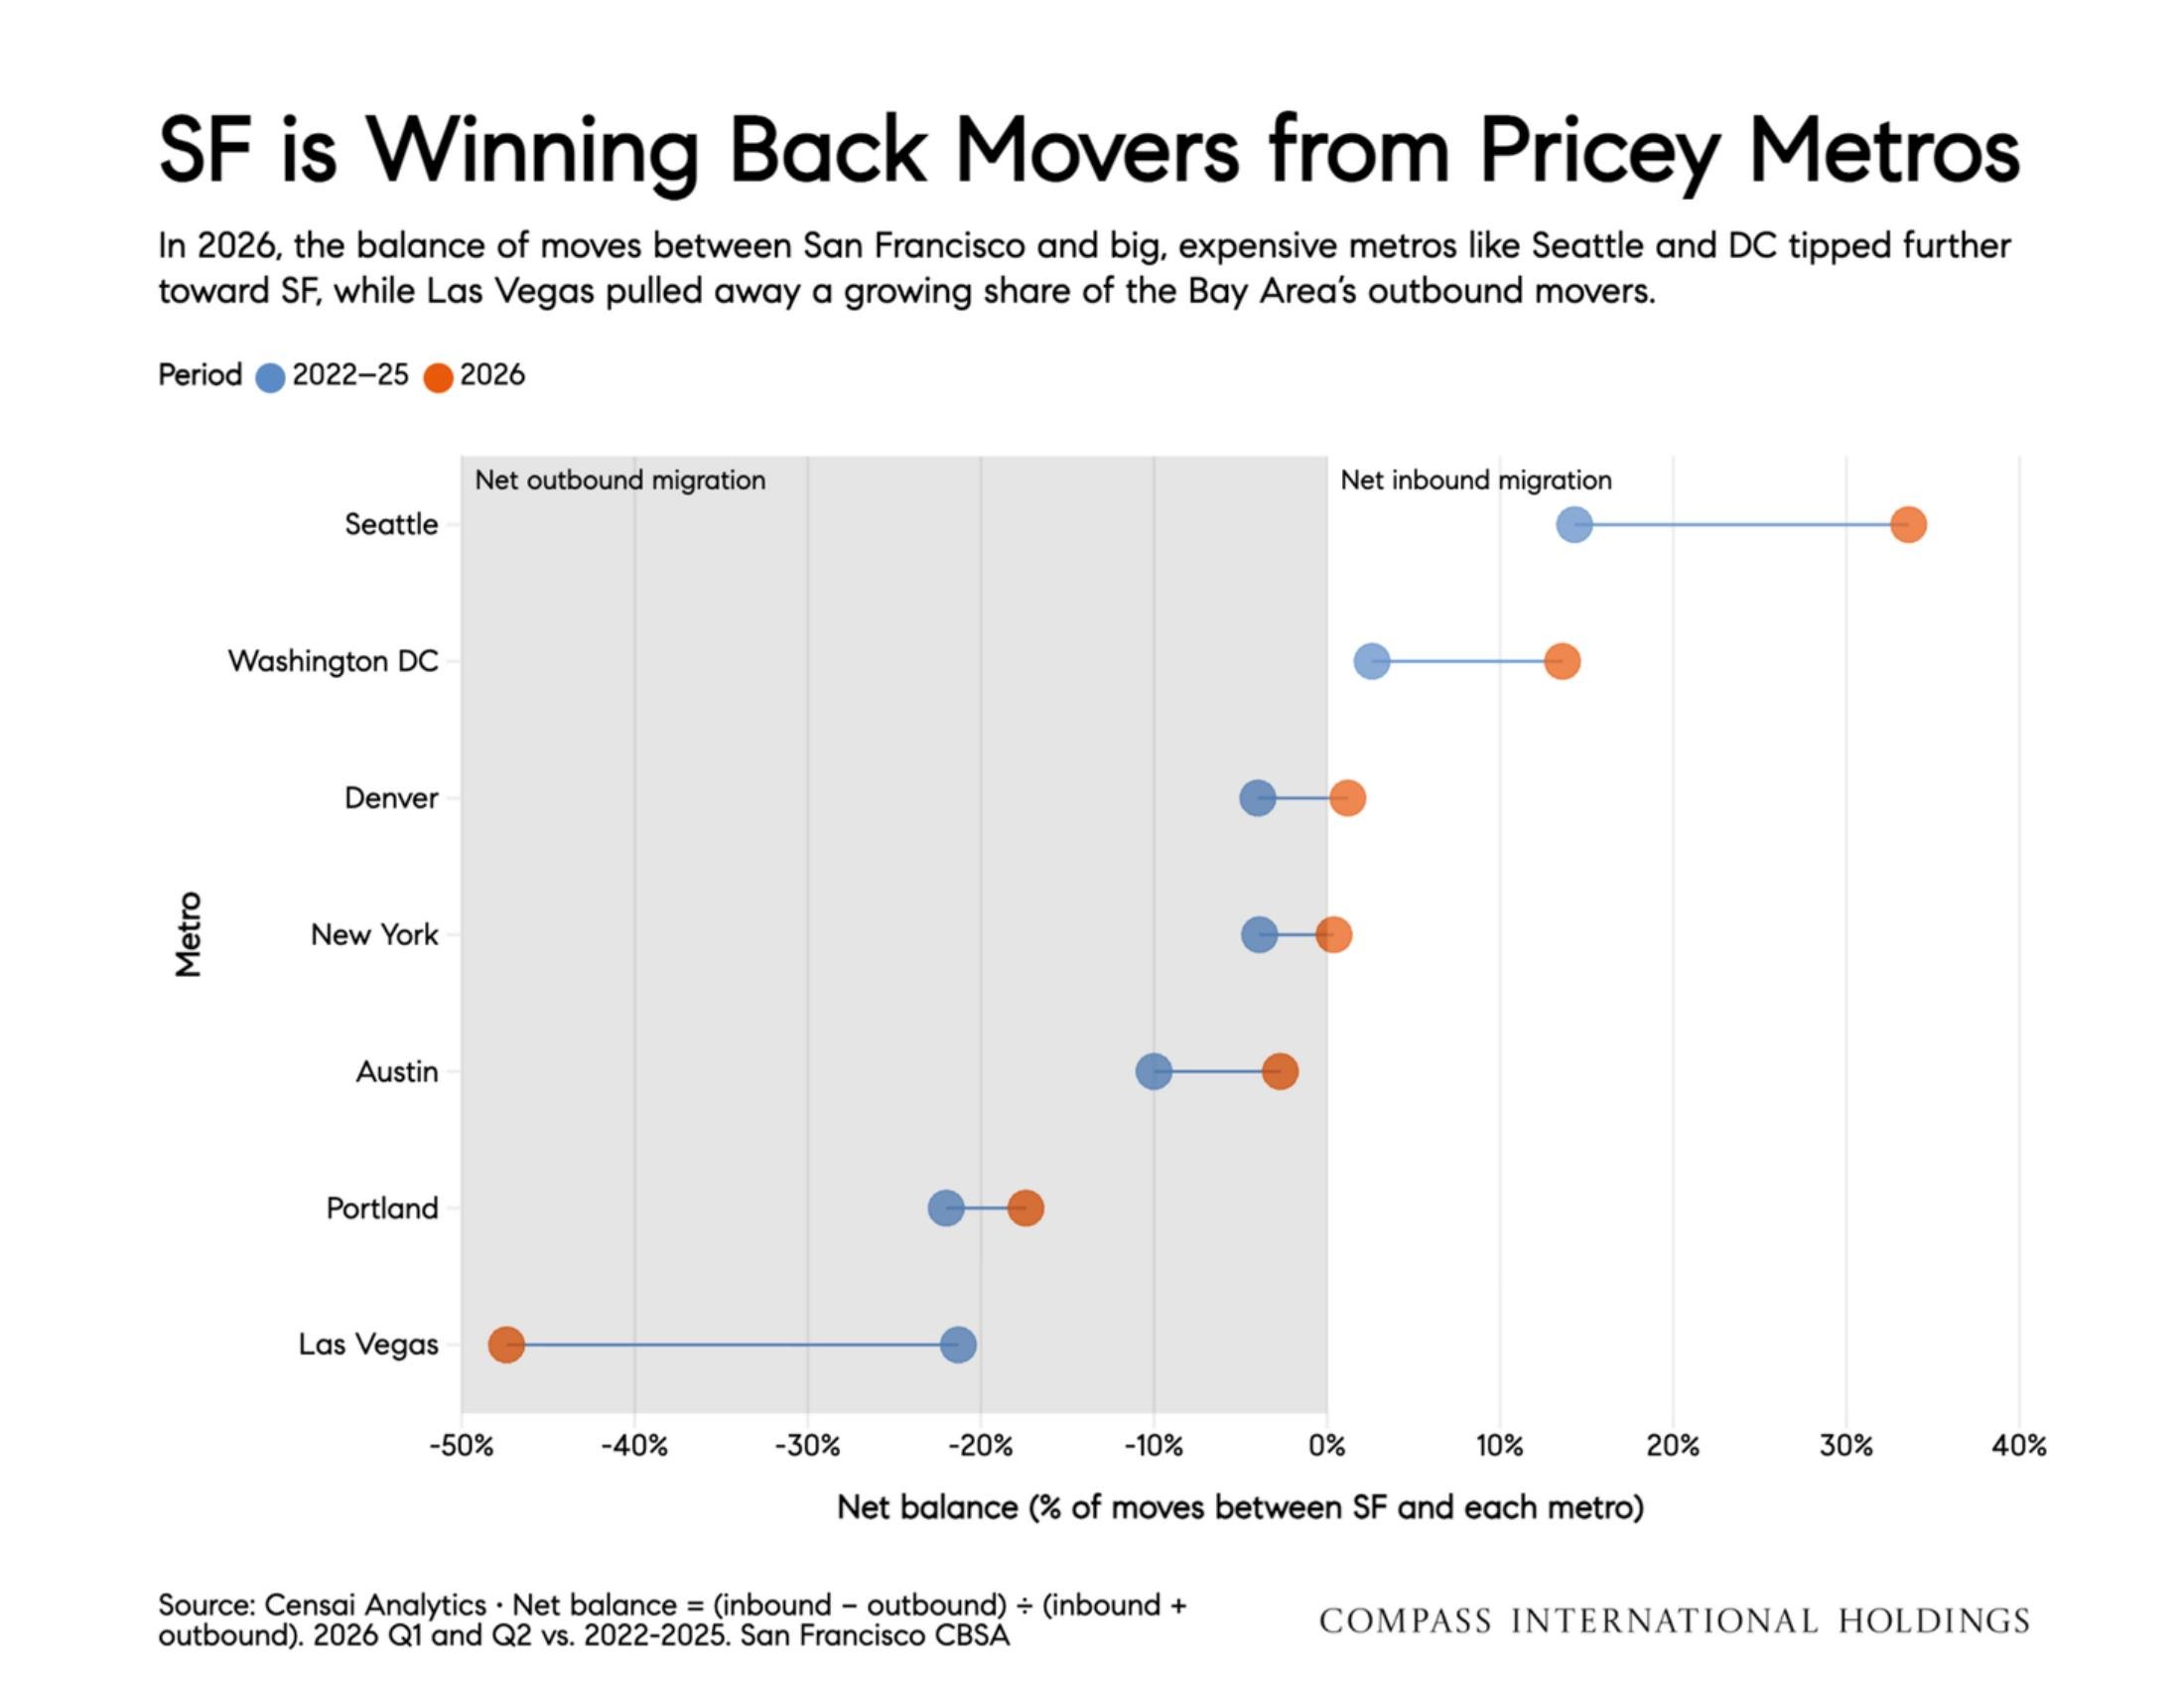
The AI boom is a double-edged sword for the Bay Area. It’s helping draw movers from pricey metros like Seattle and Washington, DC. But as some of the frothiest parts of the AI buildout pulled back, the Nasdaq fell about 12% from its early-October peak. That matters locally because tech headcount is only back to 2019 levels, while tech pay, much of it in stock, has roughly doubled. The pullback did come with a silver lining: mortgage rates fell nearly 40 basis points, a small green shoot after a rough stretch for homebuyers. With inflation still well above the Fed’s 2% target and markets expecting a December hike, though, lower rates aren’t guaranteed to last.
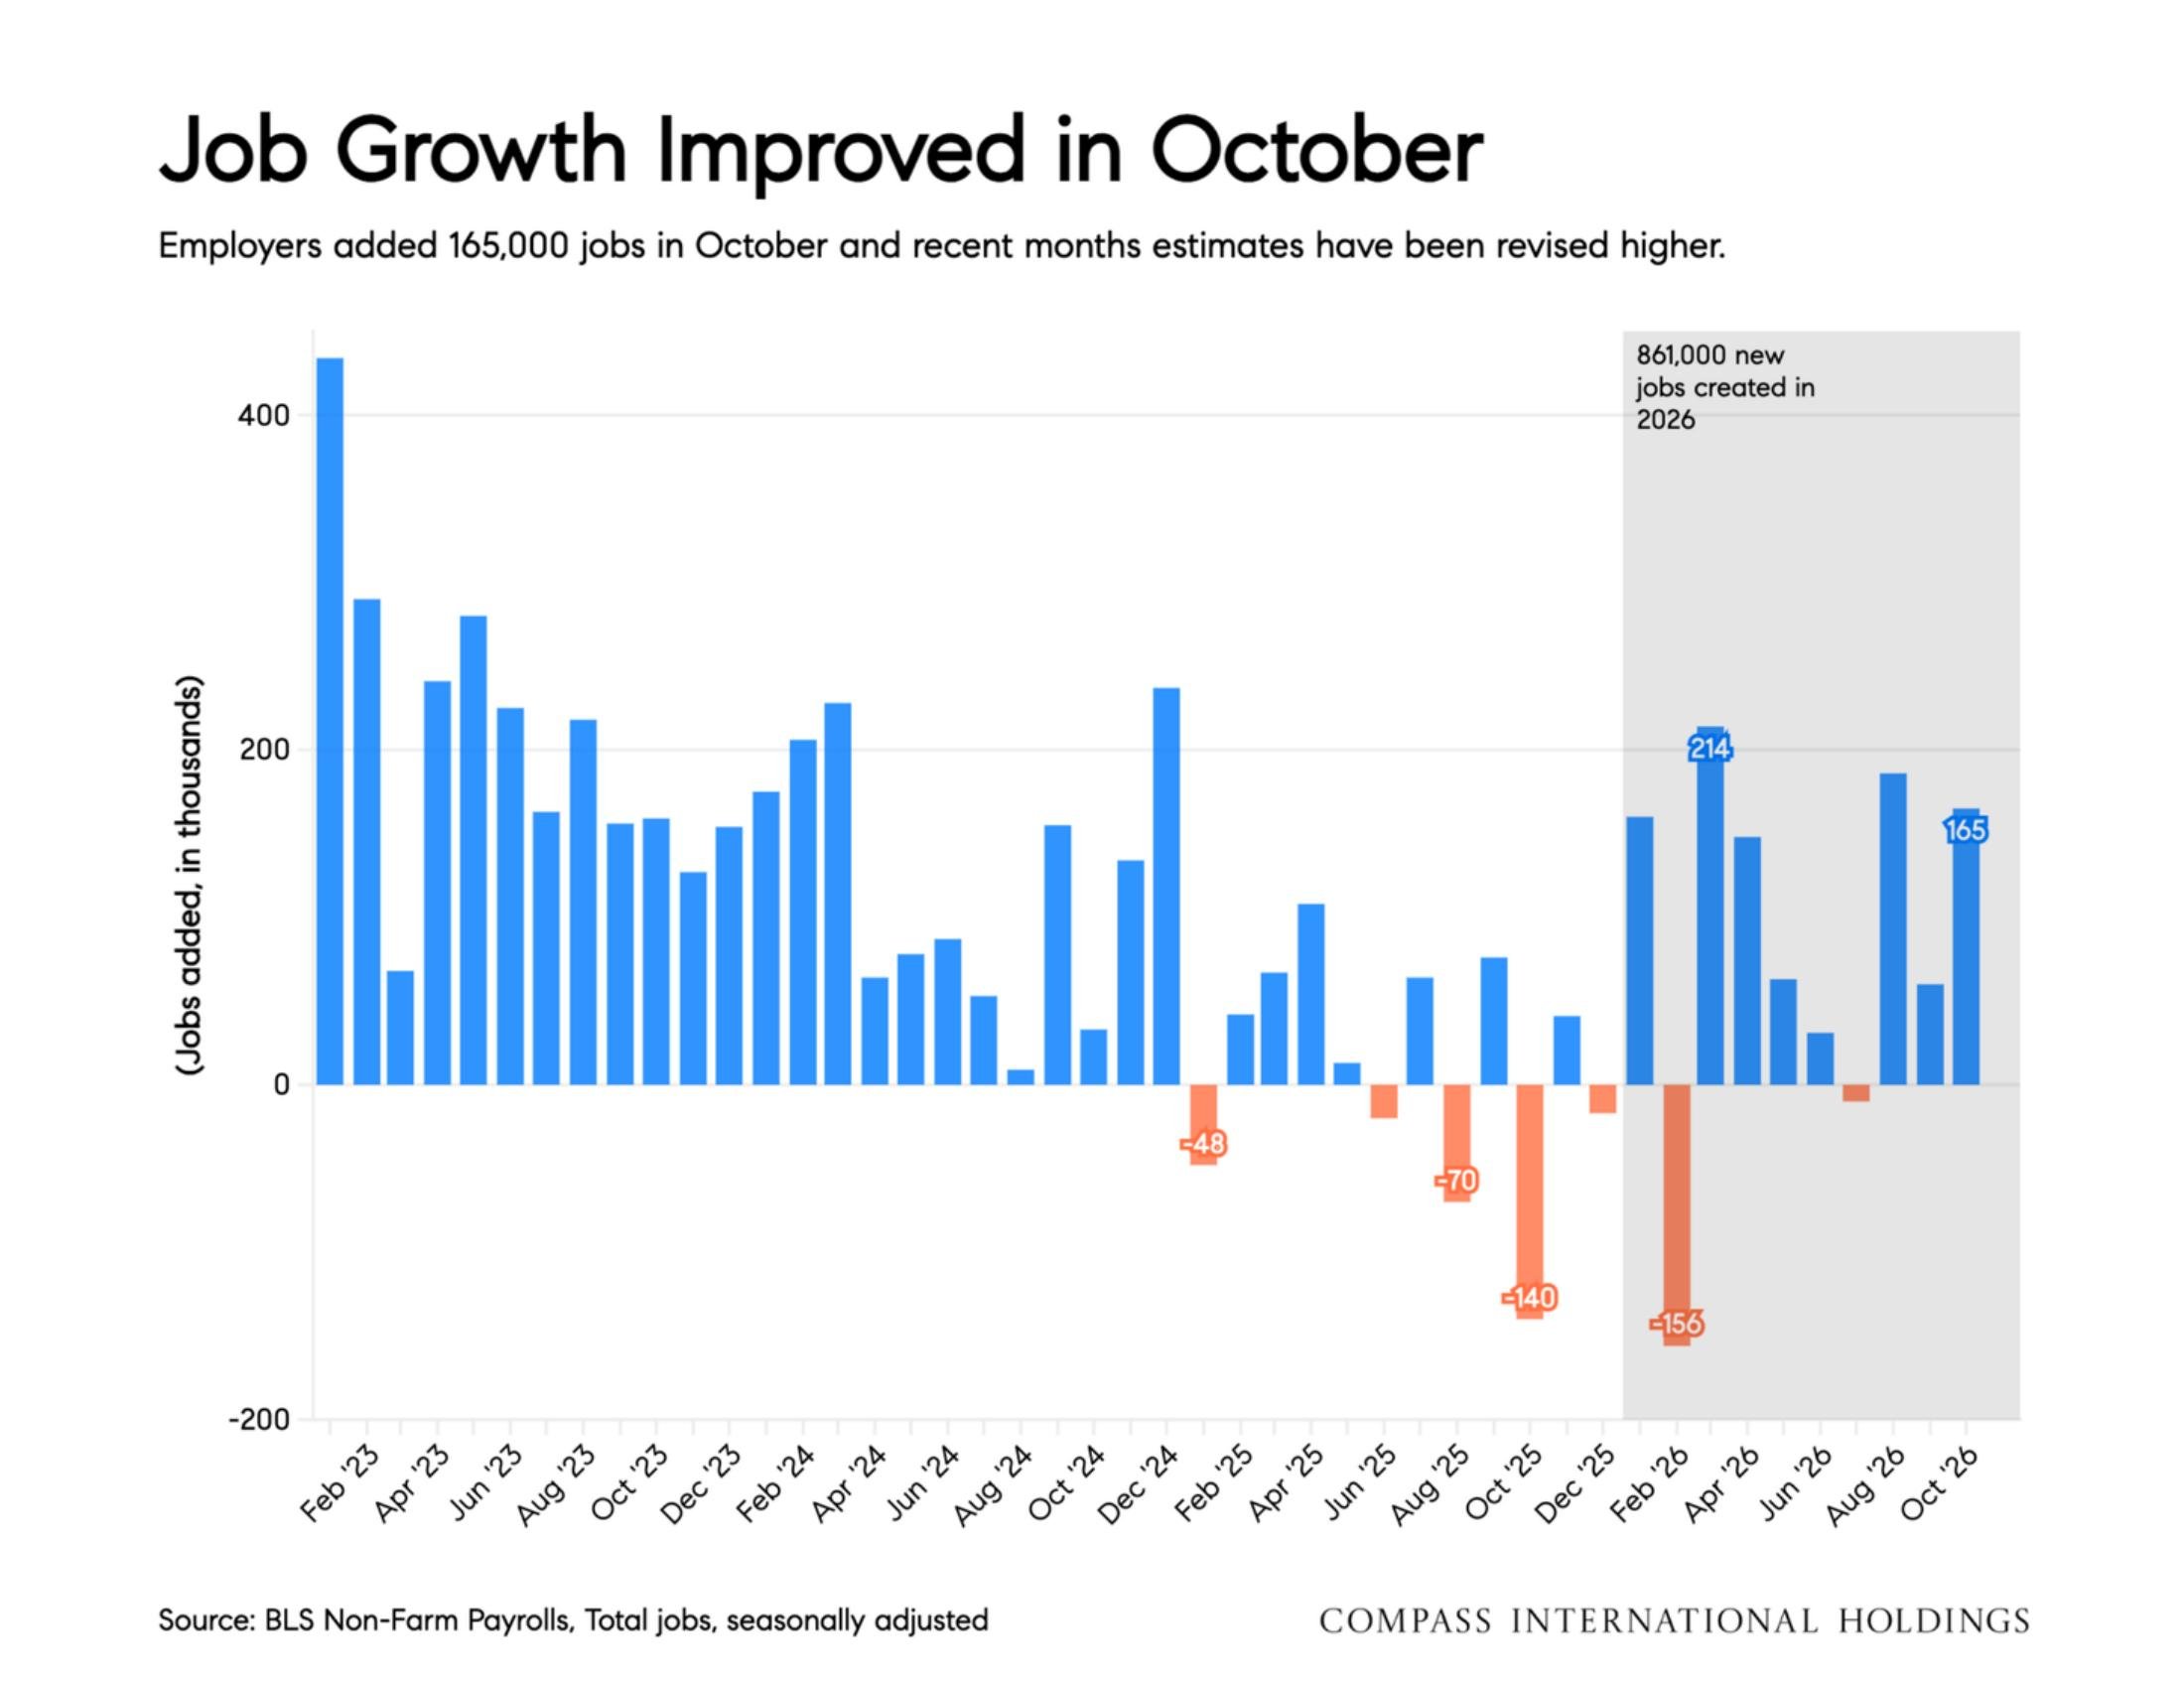
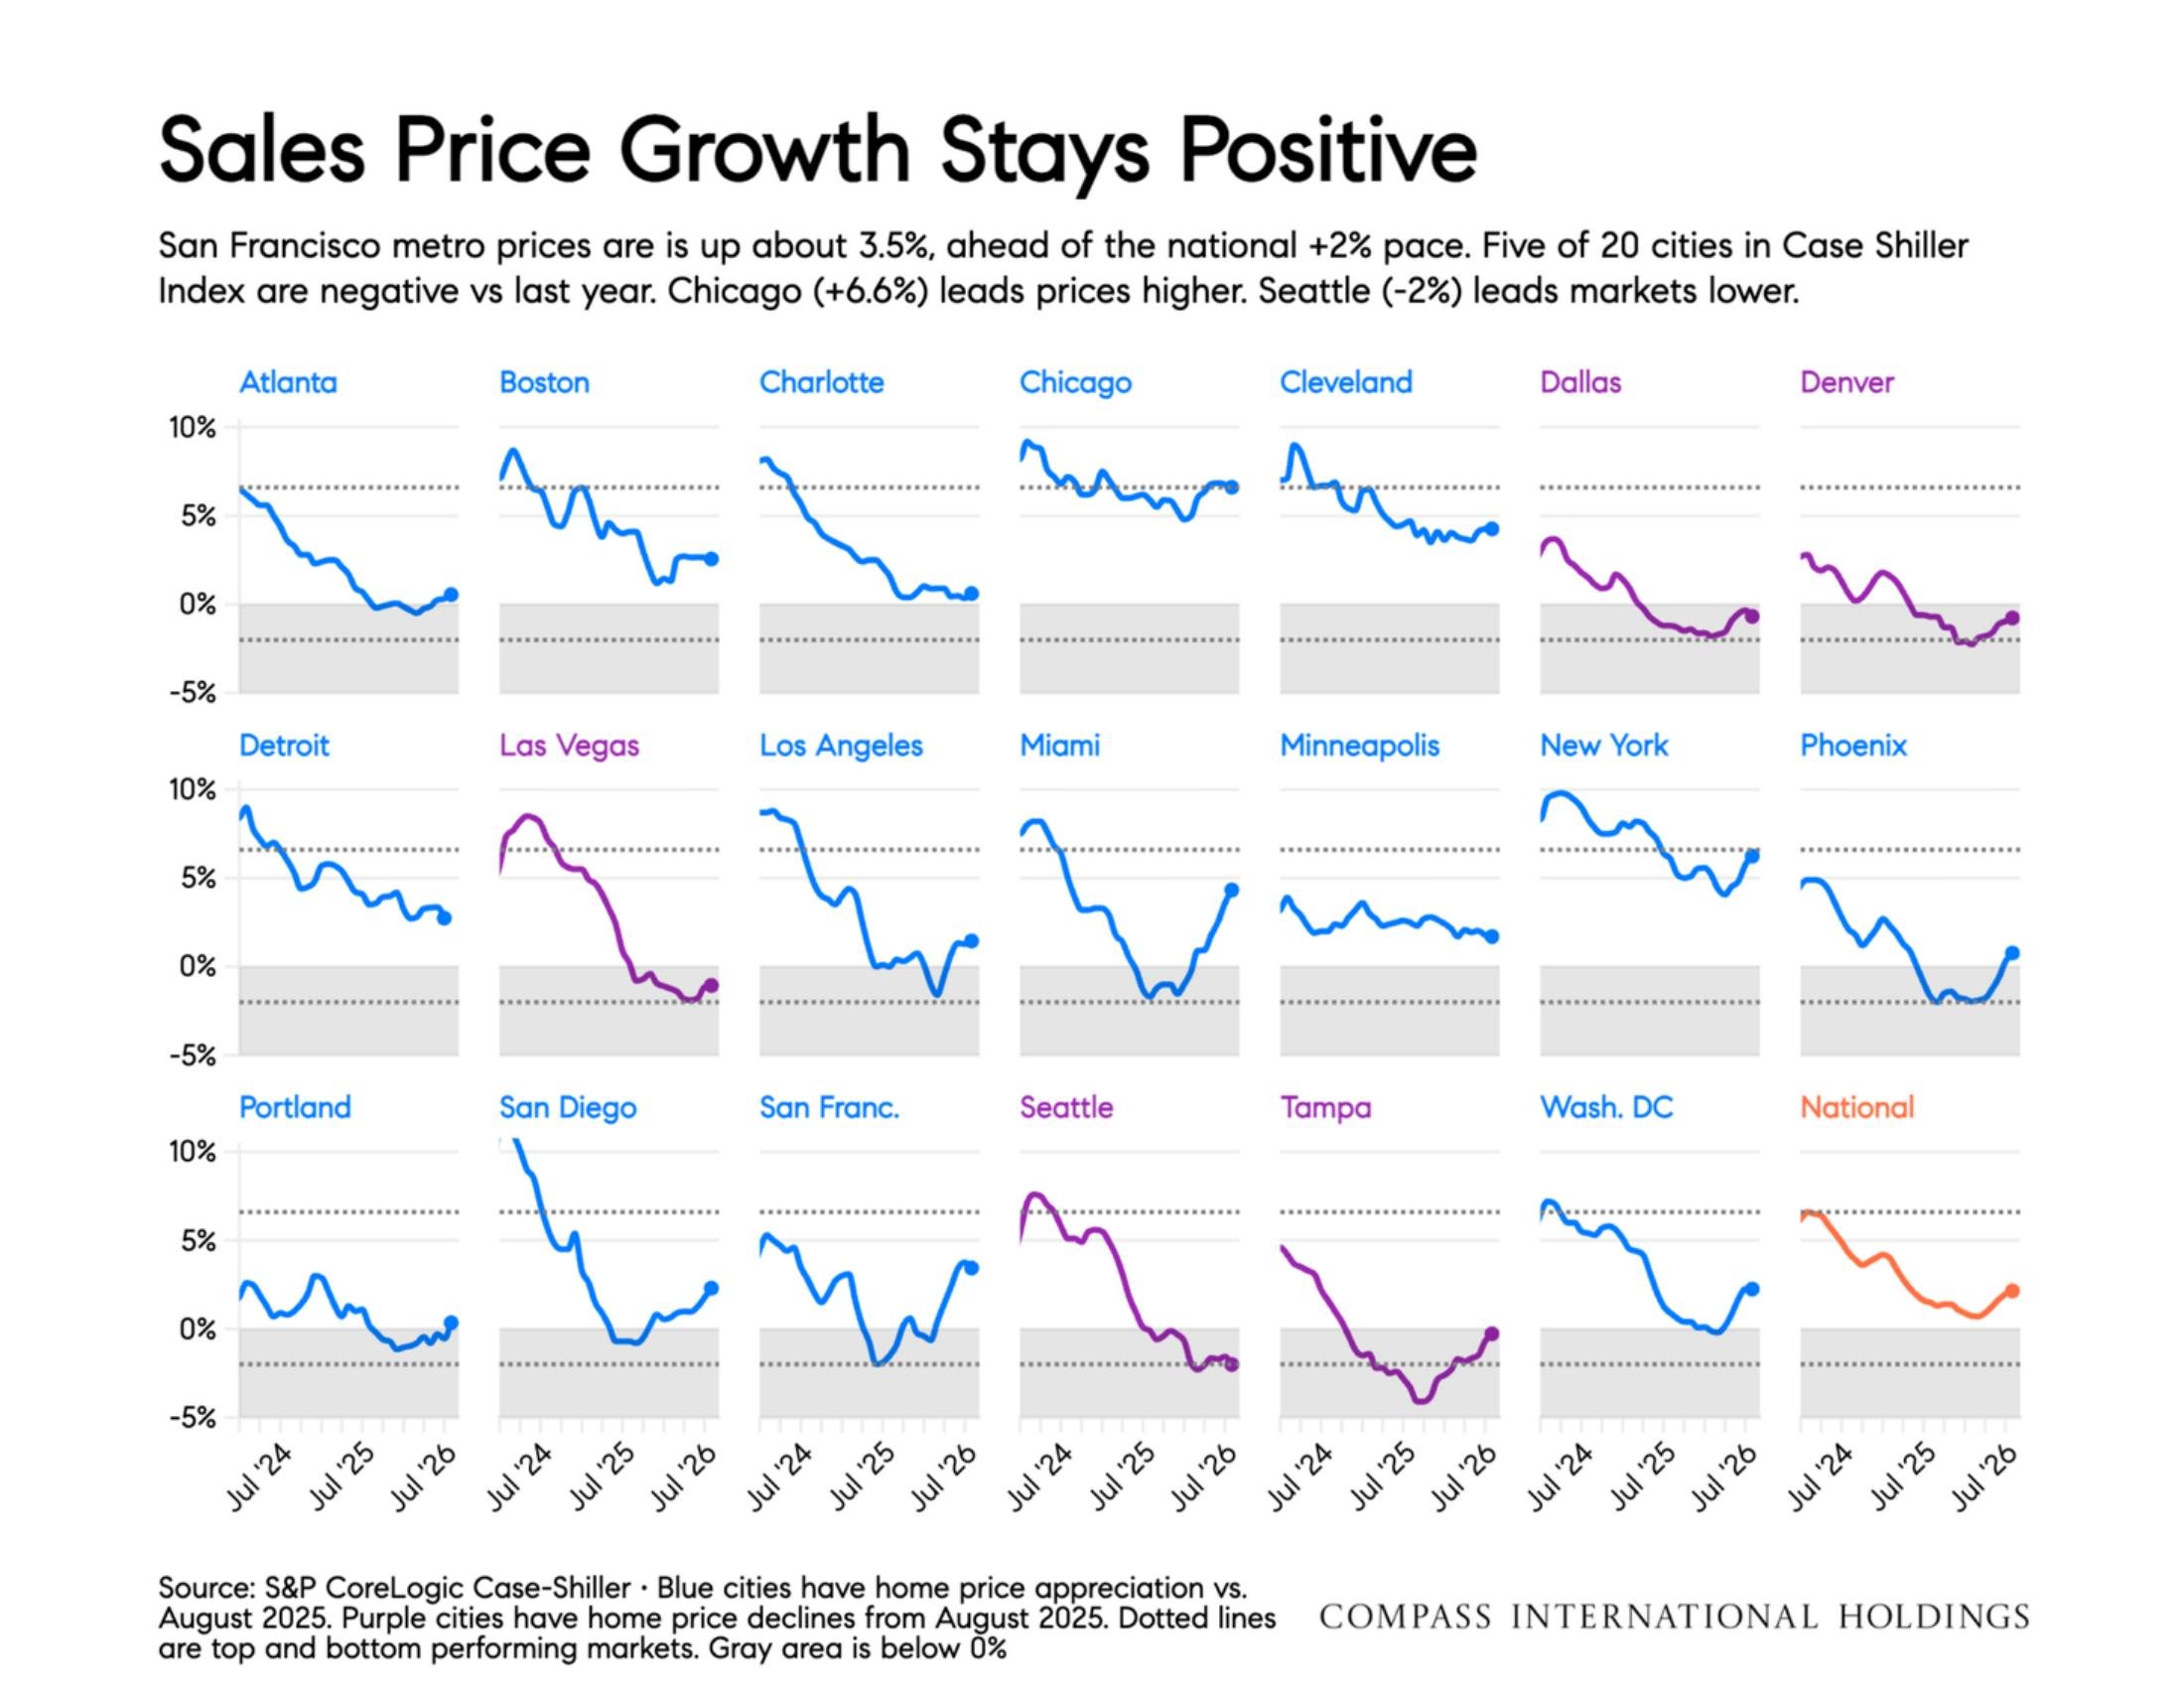
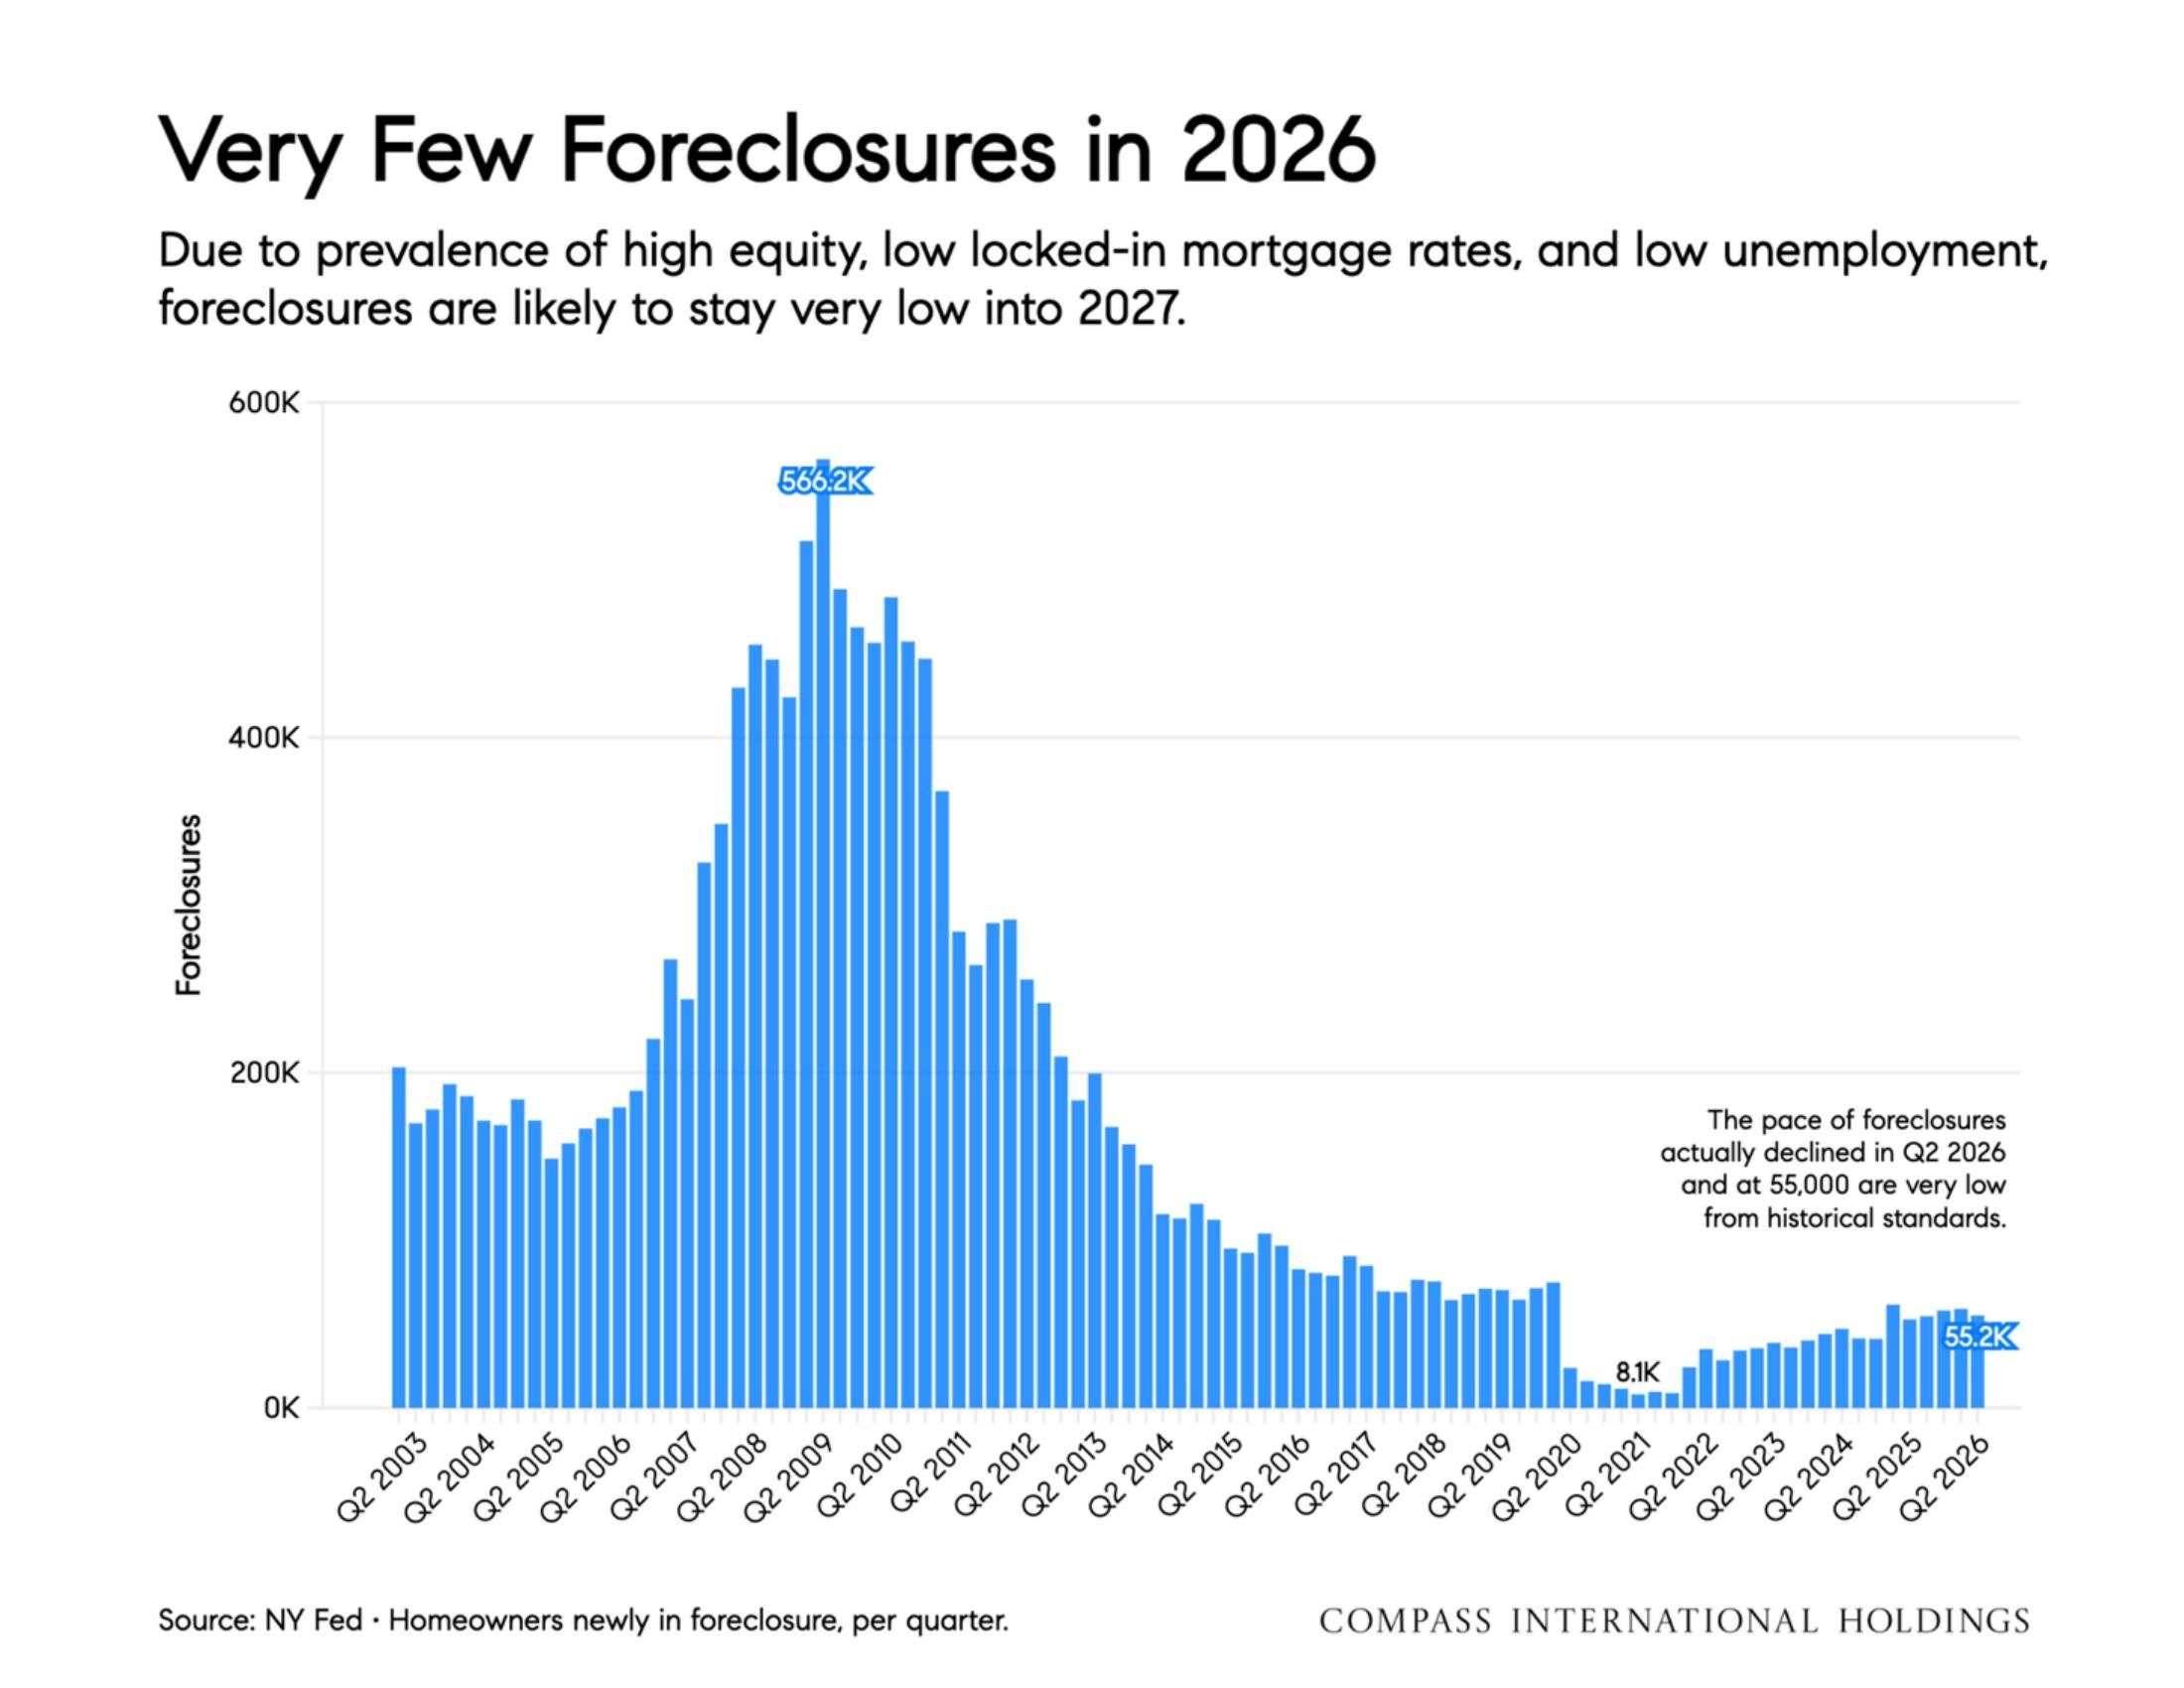
Despite light demand, U.S. housing fundamentals remain solid. Foreclosures are near historic lows, and national home prices are up about 2% from last year.