October 2023 Market Report

Photo by Alexis AMZ DA CRUZ on Unsplash
Economic indicators have been challenging since the fall selling season began: Interest rates continued to rise through early October and stock markets generally continued to fall from mid-summer, YTD highs. Markets remain volatile and hard to predict, often reacting negatively to positive economic news (such as employment numbers) as they wait for new inflation numbers and try to parse the possible reaction of the Fed. Any definitive impacts on real estate of these recent developments, should they continue, won’t substantially show up until Q4 data begins to become available, and, of course, volatility also means that indicators can turn around quickly.
In the meantime, the Q3 median house sales price was down about 6.5% from Q3 2022, and the median condo price down about 4%, but we expect the year-over-year price declines to disappear in coming months. The number of new listings jumped dramatically in September and the total supply of listings for sale just hit a YTD high: This may lead to a substantial increase in sales in October. Supply and demand dynamics remains stronger for houses than for condos, and the downtown condo market is softer than condo markets in other districts of the city. Year over year, the number of home sales in Q3 was down about 22%.
The CA Association of Realtors® (CAR) recently issued their initial 2024 market forecast:
“California housing market will rebound in 2024”
CAR forecast: Existing, single-family home sales will increase in 2024 by approximately 23 percent, and the CA median home price is expected to climb by 6.2%. The average 30-year, fixed mortgage interest rate is projected to decline to 6%. Housing supply will remain below normal despite a 10%to 20% increase in active listings, as market conditions and the lending environment continue to improve. [However] the percentage of CA households able to purchase a median-priced single family dwelling will remain very low by long-term standards. CAR Chief Economist, 9/20/23
New Listings Coming on Market

Per Realtor.com Research: https://www.realtor.com/research/data/, listings posted on site. Data from sources deemed reliable, but may contain errors and subject to revision. May not include “coming-soon” listings. All numbers should be considered approximate.
September 2023 saw the highest monthly number of new listings in the past 12 months. September is often the single month of the year with the most new listings.
The number of new listings coming on market ebbs and flows by seasonal trends, though it can be affected by specific market dynamics.
Monthly Home Sales Volume

Sales of houses, condos, townhouses reported to NorCal MLS Alliance, per Infosparks. Data from sources deemed reliable but may contain errors and subject to revision. Last month estimated based on available information and may change with late reported sales. All numbers approximate.
Year over year, the number of sales in Q3 2023 was down about 22% from Q3 2022.
Sales in one month mostly reflect accepted-offer activity in the previous month. Fall usually sees a spike up in sales before the big, mid-winter slowdown (though that did not happen in 2022).
San Francisco House Price Trends
Median House Sales Prices, 2012 – Present, by Quarter

As reported to NORCAL MLS® ALLIANCE, per Broker Metrics/Infosparks. All numbers are approximate and subject to revision. Last quarter may change with late reported sales.
Year over year, the Q3 2023 median house sales price was down about 6.5% from Q3 2022.
Median sales price is that price where half the homes sold for more and half for less. It is a very general statistic that disguises a wide range of prices in the underlying sales.
Seasonal fluctuations are common, and it’s not unusual for median sales prices to peak for the year in Q2. Longer-term trends are more meaningful than short-term changes.
San Francisco Median Home Price vs. Median Household Income
Approximate Percentage Changes since 1995*
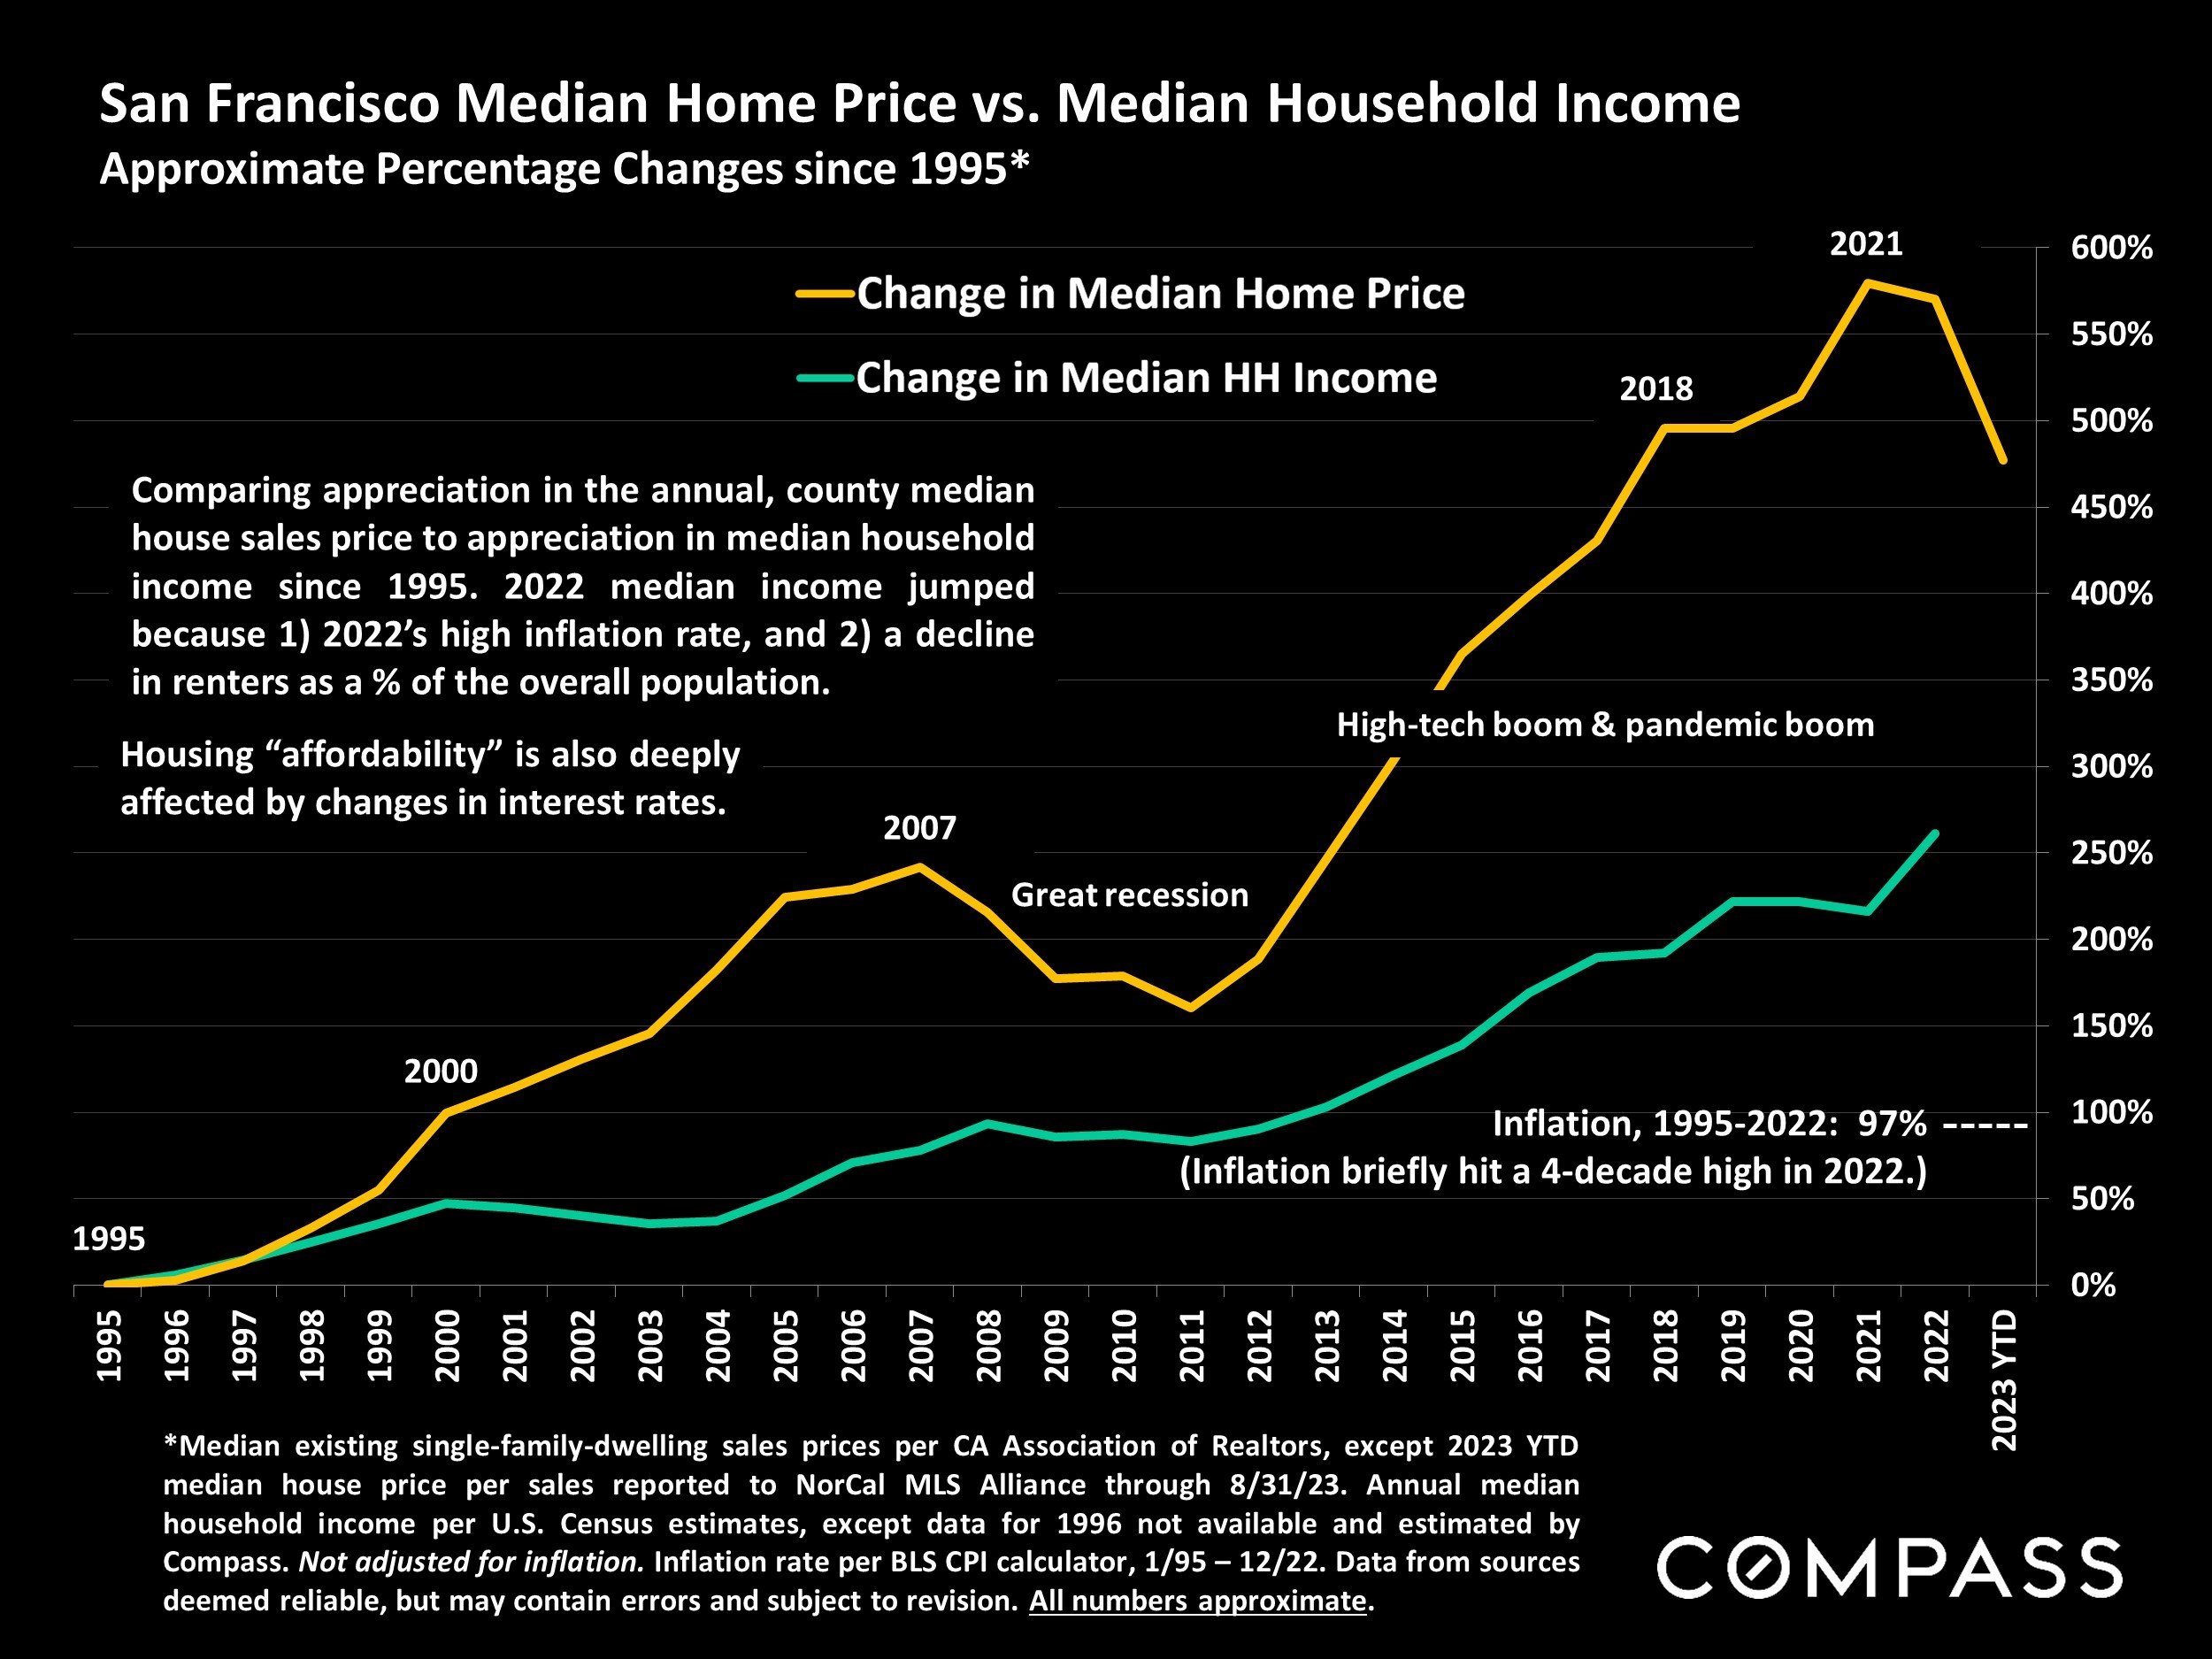
*Median existing single-family-dwelling sales prices per CA Association of Realtors, except 2023 YTD median house price per sales reported to NorCal MLS Alliance through 8/31/23. Annual median household income per U.S. Census estimates, except data for 1996 not available and estimated by Compass. Not adjusted for inflation. Inflation rate per BLS CPI calculator, 1/95 - 12/22. Data from sources deemed reliable, but may contain errors and subject to revision. All numbers approximate.
Comparing appreciation in the annual, county median house sales price to appreciation in median household income since 1995. 2022 median income jumped because 1) 2022's high inflation rate, and 2) a decline in renters as a % of the overall population.
Housing "affordability" is also deeply affected by changes in interest rates.
San Francisco Condo Price Appreciation
Median Condo Sales Prices, 2012 – Present, by Quarter

As reported to NORCAL MLS® ALLIANCE, per Broker Metrics/Infosparks. All numbers are approximate and subject to revision. Last quarter may change with late reported activity. Does not include new-project condo sales unreported to MLS.
Year over year, the Q3 2023 median condo sales price was down about 4%from Q3 2022.
Seasonal fluctuations are common. It is not unusual for median sales prices to peak for the calendar year in Q2. Different city districts have been see varying median price trends.
San Francisco Residential Market
Market Dynamics by Price Segment/Property Type
Sales numbers estimated based on data available on 10/3/23.
| Price/ Prop. Type | # Listings for Sale | # Listings in Contract | 3 Months Sales | Supply of Inventory | Avg. Days on Market | Sales Over List Price* | Sales Price to LP %* |
|---|---|---|---|---|---|---|---|
| < $1M | 502 | 150 | 280 | 5.4 months | 55 | 33% | 98% |
| $1M - $1.999M | 597 | 185 | 525 | 3.4 months | 38 | 54% | 103.5% |
| $2M - $2.999M | 146 | 37 | 139 | 3.2 months | 31 | 62% | 104% |
| $3M - $4.999M | 108 | 17 | 51 | 6.4 months | 45 | 32% | 98% |
| $5M - $7.499M | 51 | 2 | 11 | 14 months | 65 | 18% | 94% |
| $7.5M - $9.999M | 31 | 1 | 4 | Too few sales | ---- | 25% | ---- |
| $10M+ | 29 | 2 | 4 | ---- | ---- | 0% | ---- |
| Houses | 473 | 193 | 472 | 3 months | 31 | 66% | 106.6% |
| Condos | 823 | 165 | 470 | 5.2 months | 55 | 32% | 97.4% |
| TICs | 117 | 29 | 44 | 8 months | 48 | 26% | 97.5% |
| Co-ops | 31 | 6 | 13 | 7.2 months | 81 | 9% | 91% |
As reported to NorCal MLS Alliance: Active/Coming-Soon Listings and Listings in Contract as of 10/2/23; 3 months sales through 9/30/23. “Average Days on Market” until acceptance of offer for sold listings. “Avg. Sales Price to LP%”: 100% = an average sales price at original list price. Months Supply of Inventory measures approximate time required to sell the listings for sale at the current rate of sale. Data from NorCal MLS Alliance deemed reliable, but may contain errors and subject to revision. Not all activity is posted to MLS. All numbers approximate and may change with late-reported activity. Sales statistics can be affected by outlier data and can change quickly.
San Francisco Residential Home Sales
12 Months Sales, by Realtor District, by Property Type*

* 12 months sales reported to NorCal MLS Alliance by late Sept. 2023. Data from sources deemed reliable but may contain errors and subject to revision. All numbers approximate.
San Francisco HOUSE Price Trends – Selected District Markets
Median House Sales Prices, by Quarter, Q3 2020 – Q3 2023

Sales reported to NorCal MLS Alliance, per Infosparks. Data from sources deemed reliable, but may contain errors and subject to revision. All numbers are approximate, and may change with late reported sales. Quarterly and seasonal price fluctuations are common. Long-term trends are more meaningful than short-term changes.
Median sales price is a very general statistic often affected by factors other than changes in fair market value. Districts often contain neighborhoods of significantly varying values.
How these prices and trends apply to any particular home is unknown without a specific comparative market analysis. Quarterly and seasonal fluctuations are common.
Realtor districts often include other nearby neighborhoods besides those listed.
Comparative Greater Bay Area HOUSE Prices
Q3 2023 Median 3-Bedroom House Sales Prices, by County*

* House sales reported to NorCal MLS Alliance. Data from sources deemed reliable, but may contain errors and subject to revision. All numbers are approximate, and may change with late-reported sales.
More 3-bedroom houses sell in the Bay Area than any other property type configuration.
Median sales price is that price at which half the sales occurred for more and half for less. It is a very general statistic that disguises an enormous range of sales prices in the individual underlying sales. Prices vary widely between communities within counties.
San Francisco Luxury HOUSE Market
House Sales of $4,000,000+, by District, 12 Months Sales*

* 12 months sales and pending sales reported to NorCal MLS Alliance by 9/22/23. Not all luxury home sales are reported to MLS. Neighborhood groupings correspond to SF Realtor districts, which often include adjacent neighborhoods not listed. Data from sources deemed reliable but may contain errors and subject to revision. All numbers approximate.
There were 12 house sales of $10 million+ reported during the 12-month period and 1 listing currently pending sale. 3 sales were reported of $20 million+.*
Buying a Large, Expensive Home in the Bay Area
2023 YTD House Sales: 4+ Bedrooms, 4+ Baths, 4000+ Square Feet, $3 Million+*
Counties contain markets of widely varying values. Many diverse factors affect values and market dynamics.
| County | # of Sales | Median Sales Price |
Median Size | Median $/Sq.Ft. | Median Lot Size | Avg. Days on Market |
% Sold over LP | Median SP to LP % |
|---|---|---|---|---|---|---|---|---|
| San Mateo | 141 | $7.388M | 5099 sq.ft. | $1484/sq.ft. | .7 acre | 57 days | 9% | 94.5% |
| San Francisco | 47 | $6.800M | 4930 sq.ft. | $1305/sq.ft. | .09 acre | 58 days | 17% | 94% |
| Napa | 13 | $6.250M | 5397 sq.ft. | $1158/sq.ft. | 9 acres | 67 days | 0% | 87.3% |
| Santa Clara | 136 | $5.615M | 4953 sq.ft. | $1149/sq.ft. | .8 acre | 50 days | 15.5% | 94.5% |
| Monterey | 23 | $5.400M | 4900 sq.ft. | $981/sq.ft. | 1.8 acres | 76 days | 9.5% | 88.5% |
| Marin | 47 | $5.100M | 4707 sq.ft. | $1090/sq.ft. | .7 acre | 62 days | 23% | 93.3% |
| Sonoma | 19 | $4.800M | 5132 sq.ft. | $993/sq.ft. | 9.5 acres | 75 days | 10.5% | 96% |
| Santa Cruz | 6 | $4.625M | 5418 sq.ft. | $814/sq.ft. | .9 acres | N/A | 20% | 97.2% |
| Alameda | 72 | $3.775M | 4863 sq.ft. | $767/sq.ft. | .5 acre | 32 days | 29% | 97% |
| Contra Costa | 116 | $3.688M | 5152 sq.ft. | $758/sq.ft. | .6 acre | 40 days | 18% | 97.7% |
*As reported to NorCal MLS Alliance in 2023 by 9/29/23. Not all sales are reported. Data from sources deemed reliable, but may contain errors and subject to revision. All numbers approximate. Square footage and $/sq.ft. does not include garages, rooms built without permit, storage, decks, patios or lot size. Lot size in particular complicates the $/sq.ft. value calculation. Outlier sales adjusted when identified.
San Francisco CONDO Price Trends – Selected Districts
Median 2 & 3 BR Condo Sales Prices, by Quarter, Q3 2020 – Q3 2023
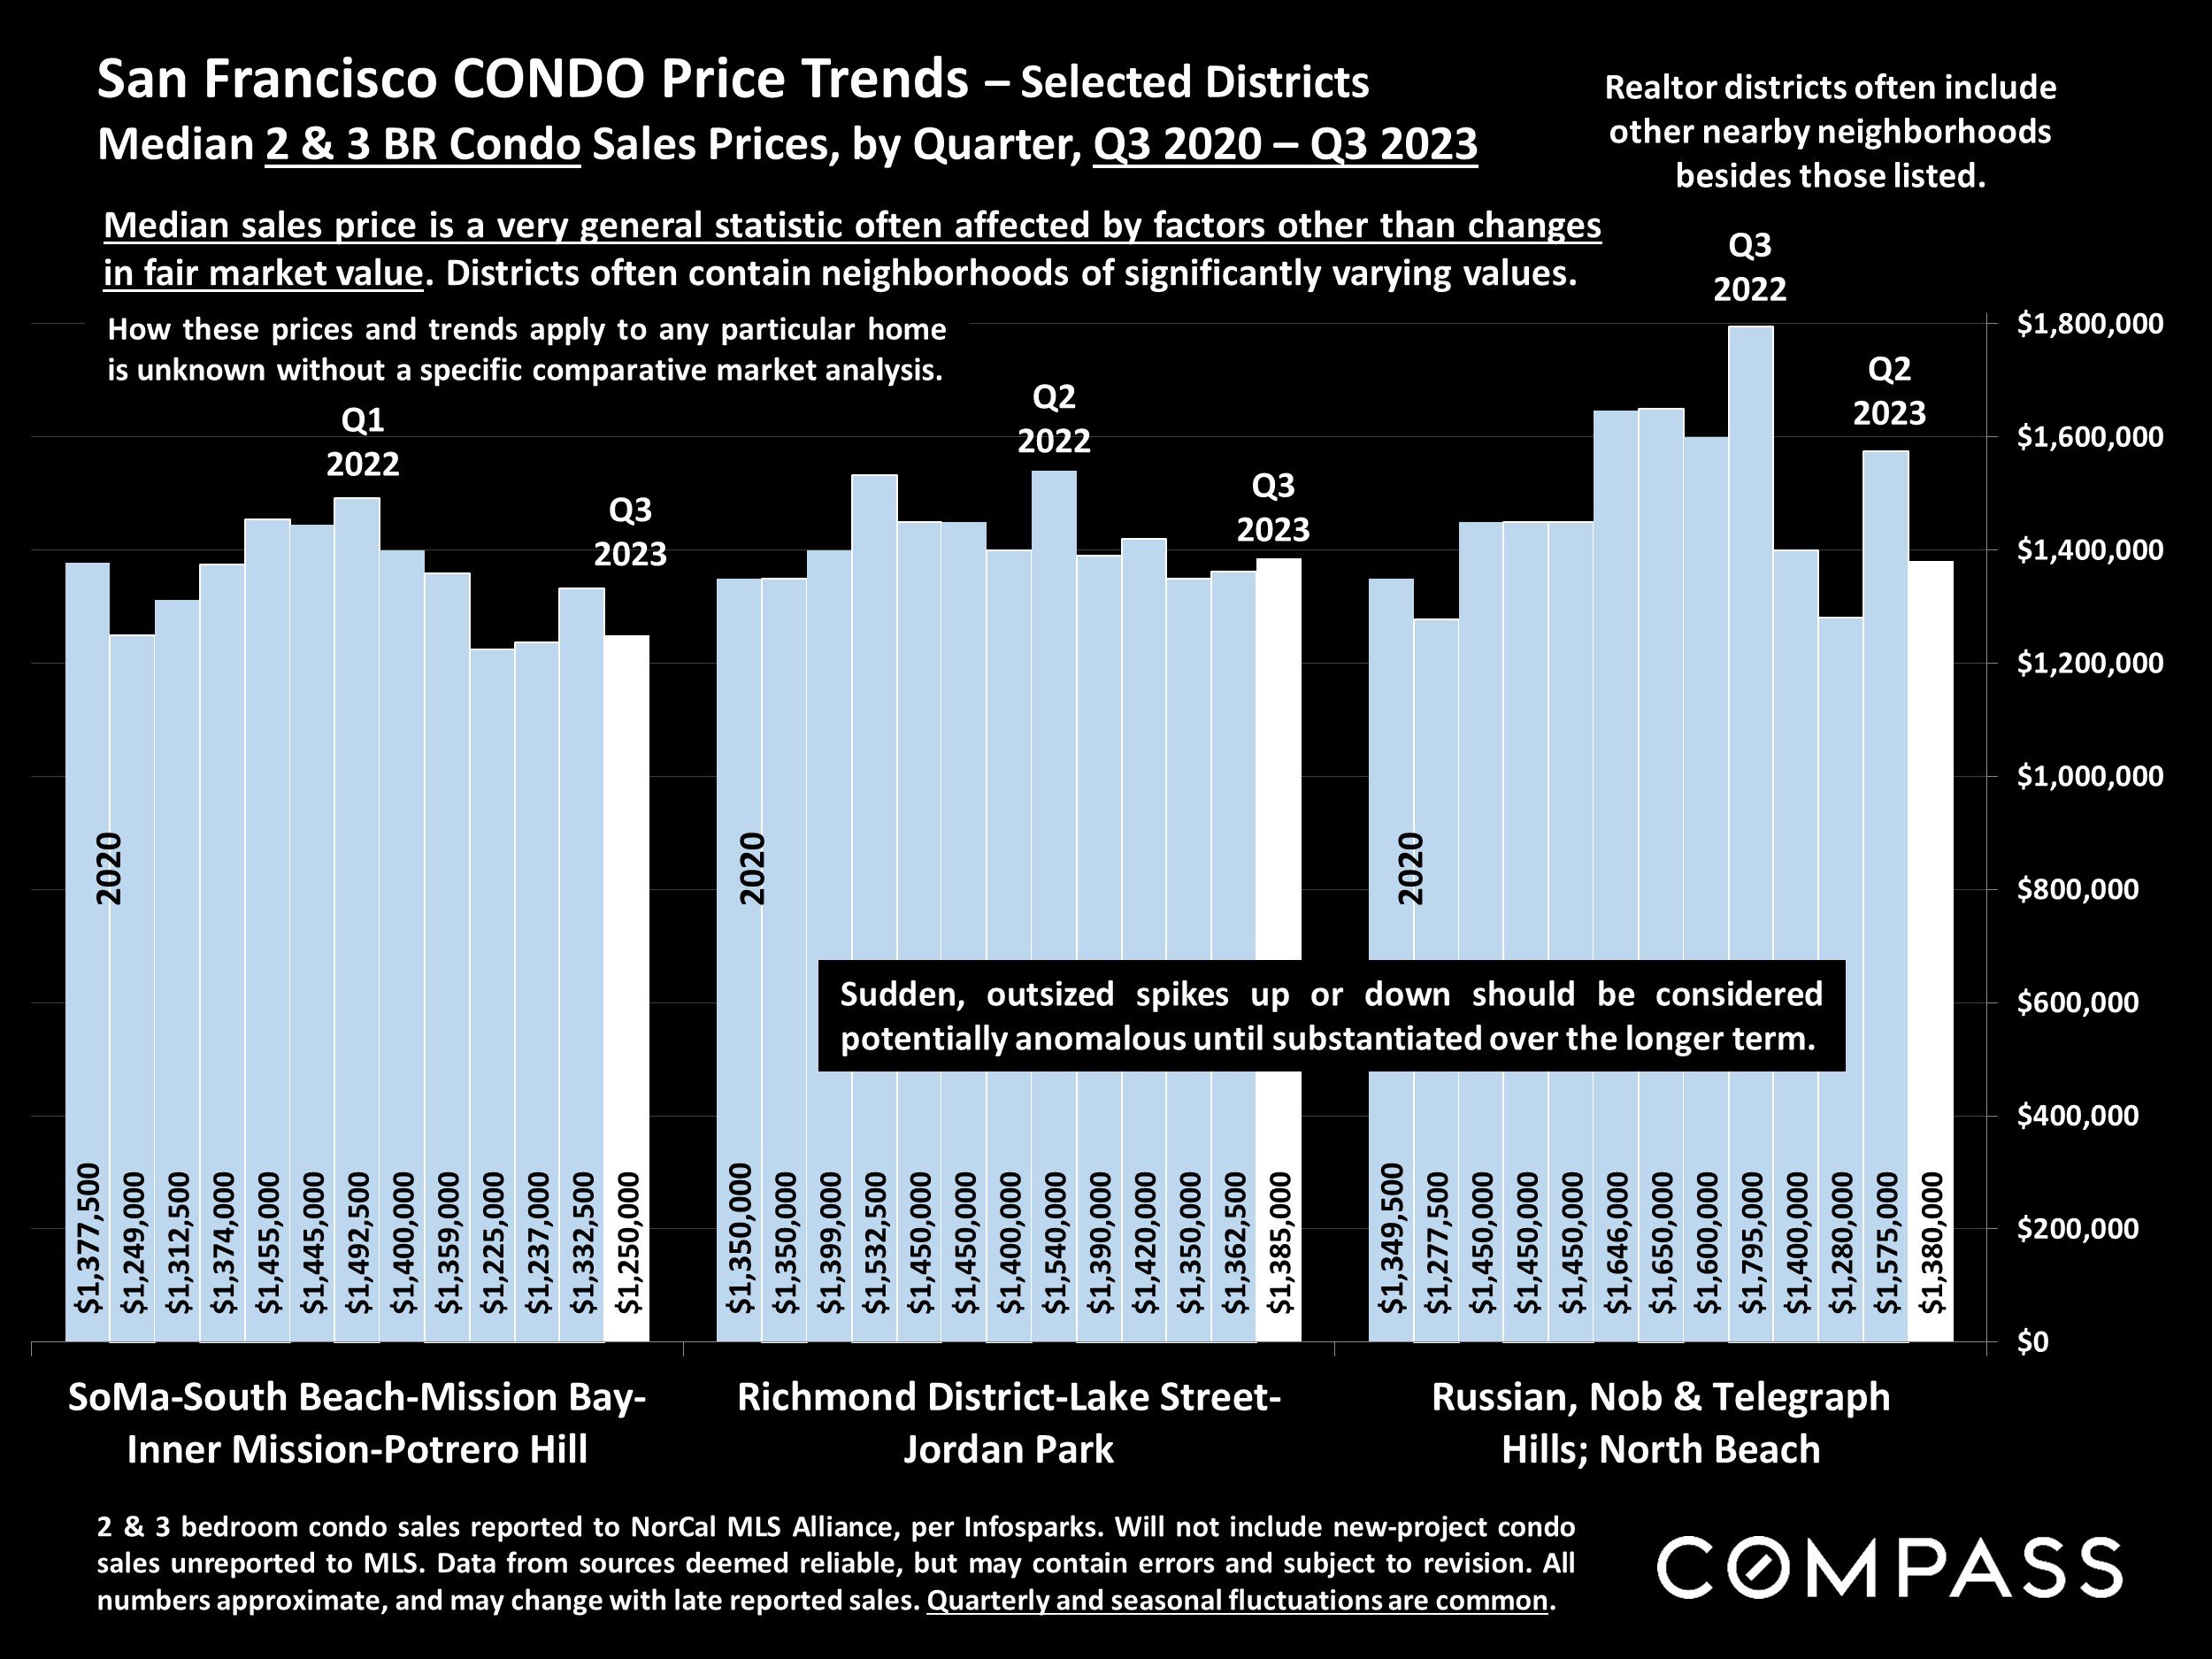
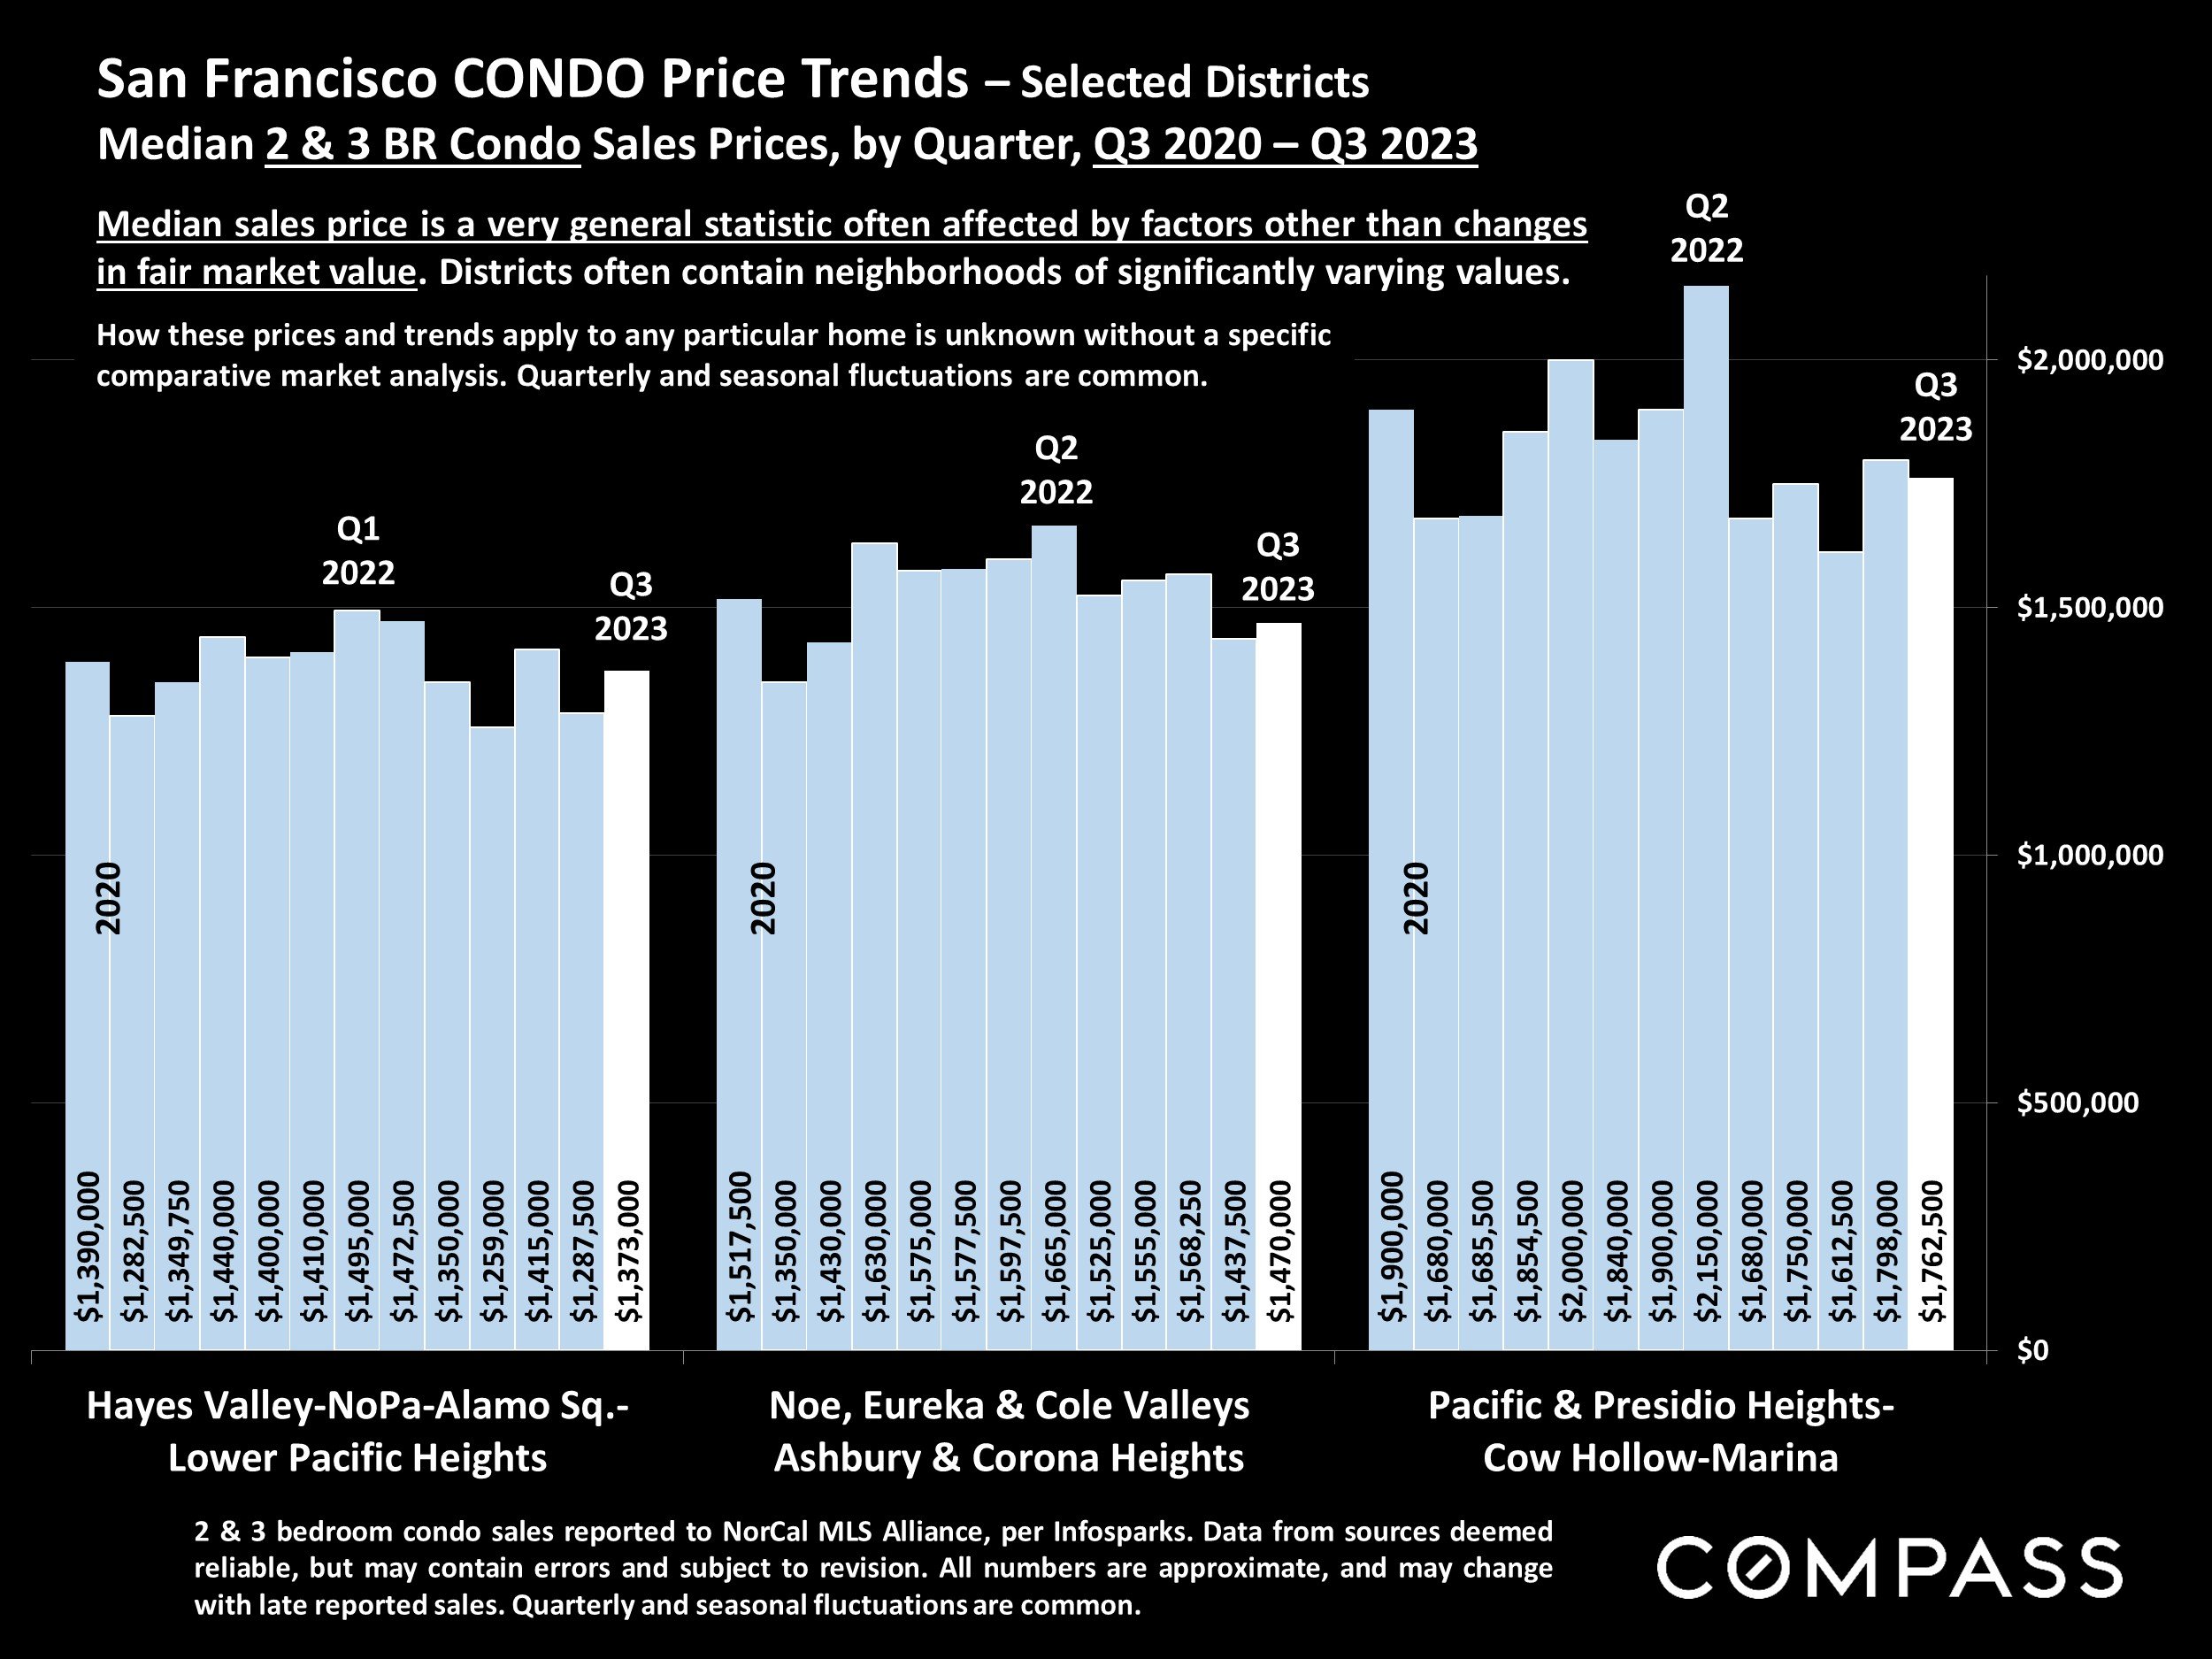
Median sales price is a very general statistic often affected by factors other than changes in fair market value. Districts often contain neighborhoods of significantly varying values.
How these prices and trends apply to any particular home is unknown without a specific comparative market analysis.
Realtor districts often include other nearby neighborhoods besides those listed.
San Francisco Luxury Condo, Co-op, Townhouse & TIC Market
Sales Prices of $2.5 Million+, by District, 12 Months Sales*

* 12 months sales reported to NorCal MLS Alliance by 9/22/23 + pending sales as of 9/22/23. Not all sales are reported to MLS. Neighborhood groupings correspond to SF Realtor districts, which often include adjacent neighborhoods not listed. Data from sources deemed reliable but may contain errors and subject to revision. All numbers approximate.
Some new-project luxury condo sales are not reported to MLS. These projects are mostly concentrated in the greater South Beach/Yerba Buena/SoMa area.
105 of these sales were condos, 12 were co-ops, 10 TICs and 2 townhouses.
There were 3 sales of $10 million+ reported during the 12-month period.
Active & Coming-Soon Listings on 1st of Month*

* Houses, condos, co-ops, TICs, townhouses: Active/Coming-Soon listings posted to NorCal MLS Alliance. Does not include new-project condos not listed on MLS. Data from sources deemed reliable, but may contain errors and subject to revision. All numbers approximate. The # of active listings changes constantly.
Though still down year over year, the number of active listings hit its highest point in 2023 YTD. Of the listings for sale on October 1, 33% were houses, and 67% were condos, co-ops, TICs & townhouses.
The # of active listings on a given day is affected by 1) the # of new listings coming on market, 2) how quickly buyers put them into contract, 3) the sustained heat of the market over time, and 4) sellers pulling their homes off the market without selling.
Active Listings on Market – Longer-Term Trends

Per Realtor.com Research: https://www.realtor.com/research/data/, house and condo listings posted on site. May not include coming-soon listings. Data from sources deemed reliable, but may contain errors and subject to revision. All numbers approximate.
This is a snapshot measure of how many active listings can be expected on any given day of the specified month.
The number of active listings on a given day is affected by 1) how many new listings come on market, 2) how quickly buyers snap them up, 3) the sustained heat of the market over time, and 4) how many sellers pull their homes off the market without selling. The number typically ebbs and flows by season.
Listings Pending Sale (in Contract, Offer Accepted)
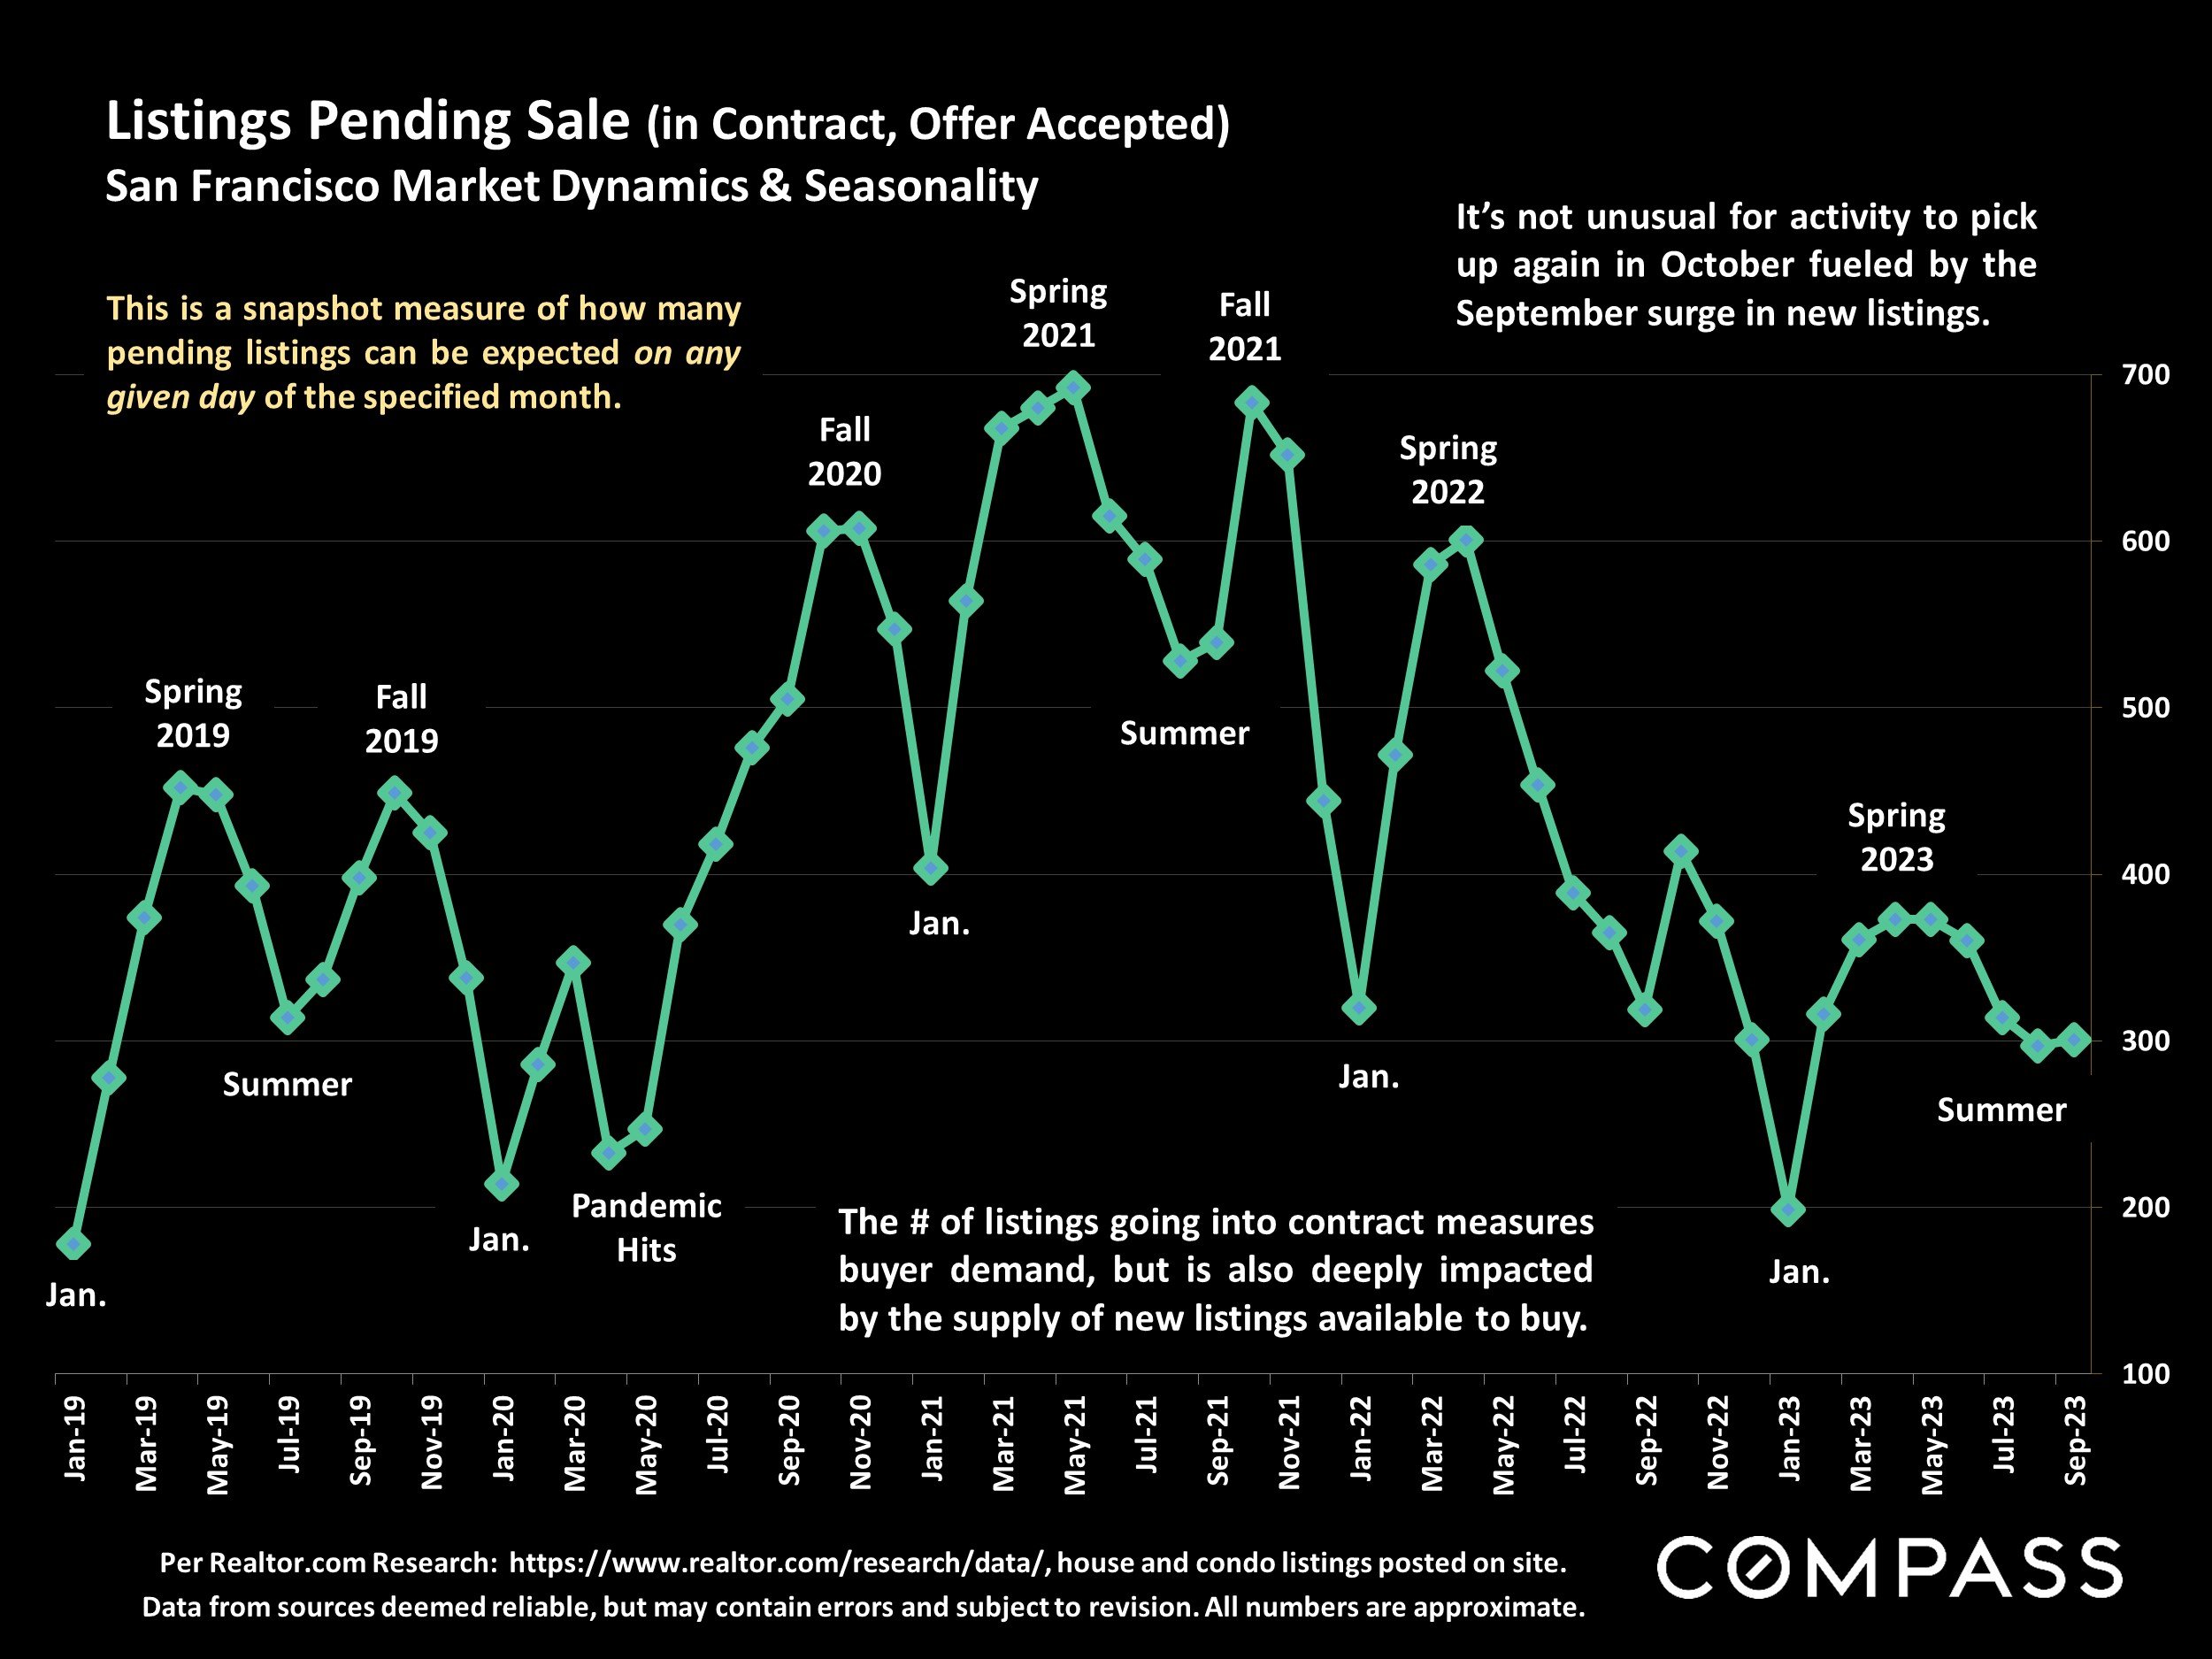
Per Realtor.com Research: https://www.realtor.com/research/data/, house and condo listings posted on site. Data from sources deemed reliable, but may contain errors and subject to revision. All numbers are approximate.
This is a snapshot measure of how many pending listings can be expected on any given day of the specified month.
It’s not unusual for activity to pick up again in October fueled by the September surge in new listings.
The # of listings going into contract measures buyer demand, but is also deeply impacted by the supply of new listings available to buy.
Price Reductions on Active Listings
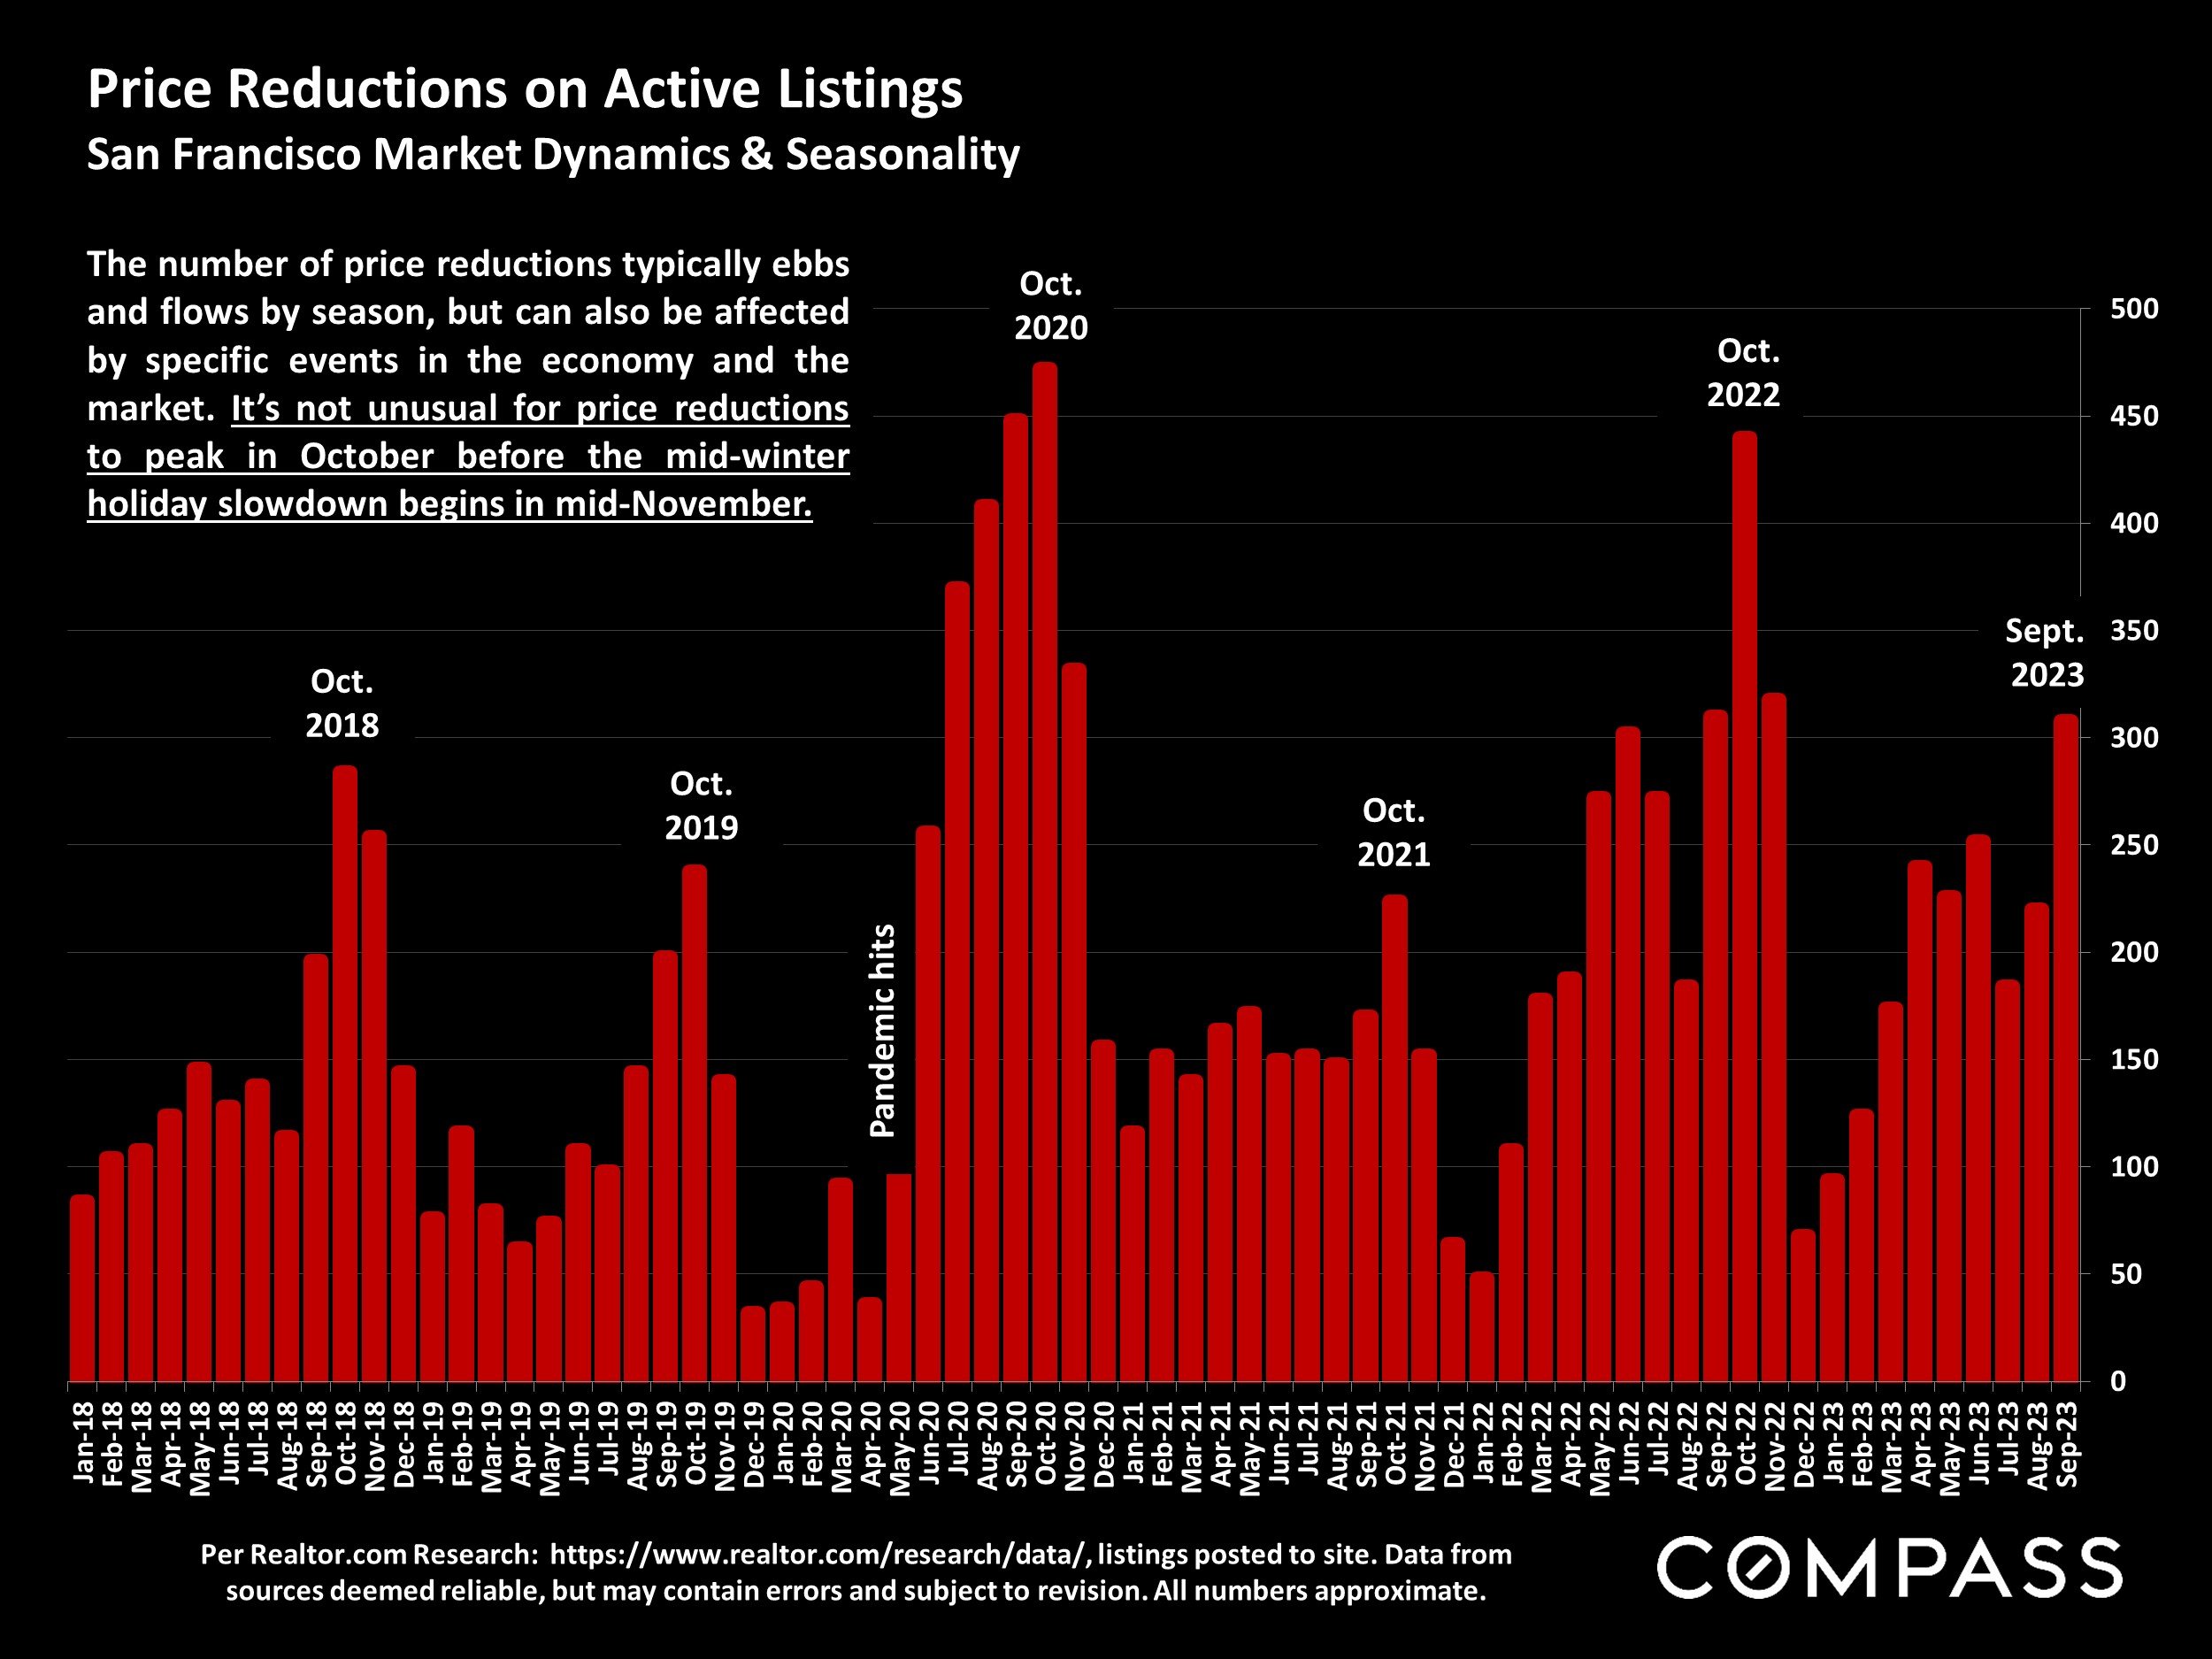
Per Realtor.com Research: https://www.realtor.com/research/data/, listings posted to site. Data from sources deemed reliable, but may contain errors and subject to revision. All numbers approximate.
The number of price reductions typically ebbs and flows by season, but can also be affected by specific events in the economy and the market. It’s not unusual for price reductions to peak in October before the mid-winter holiday slowdown begins in mid-November.
San Francisco Higher-Price Home Sales*
Homes Selling for $3 Million+
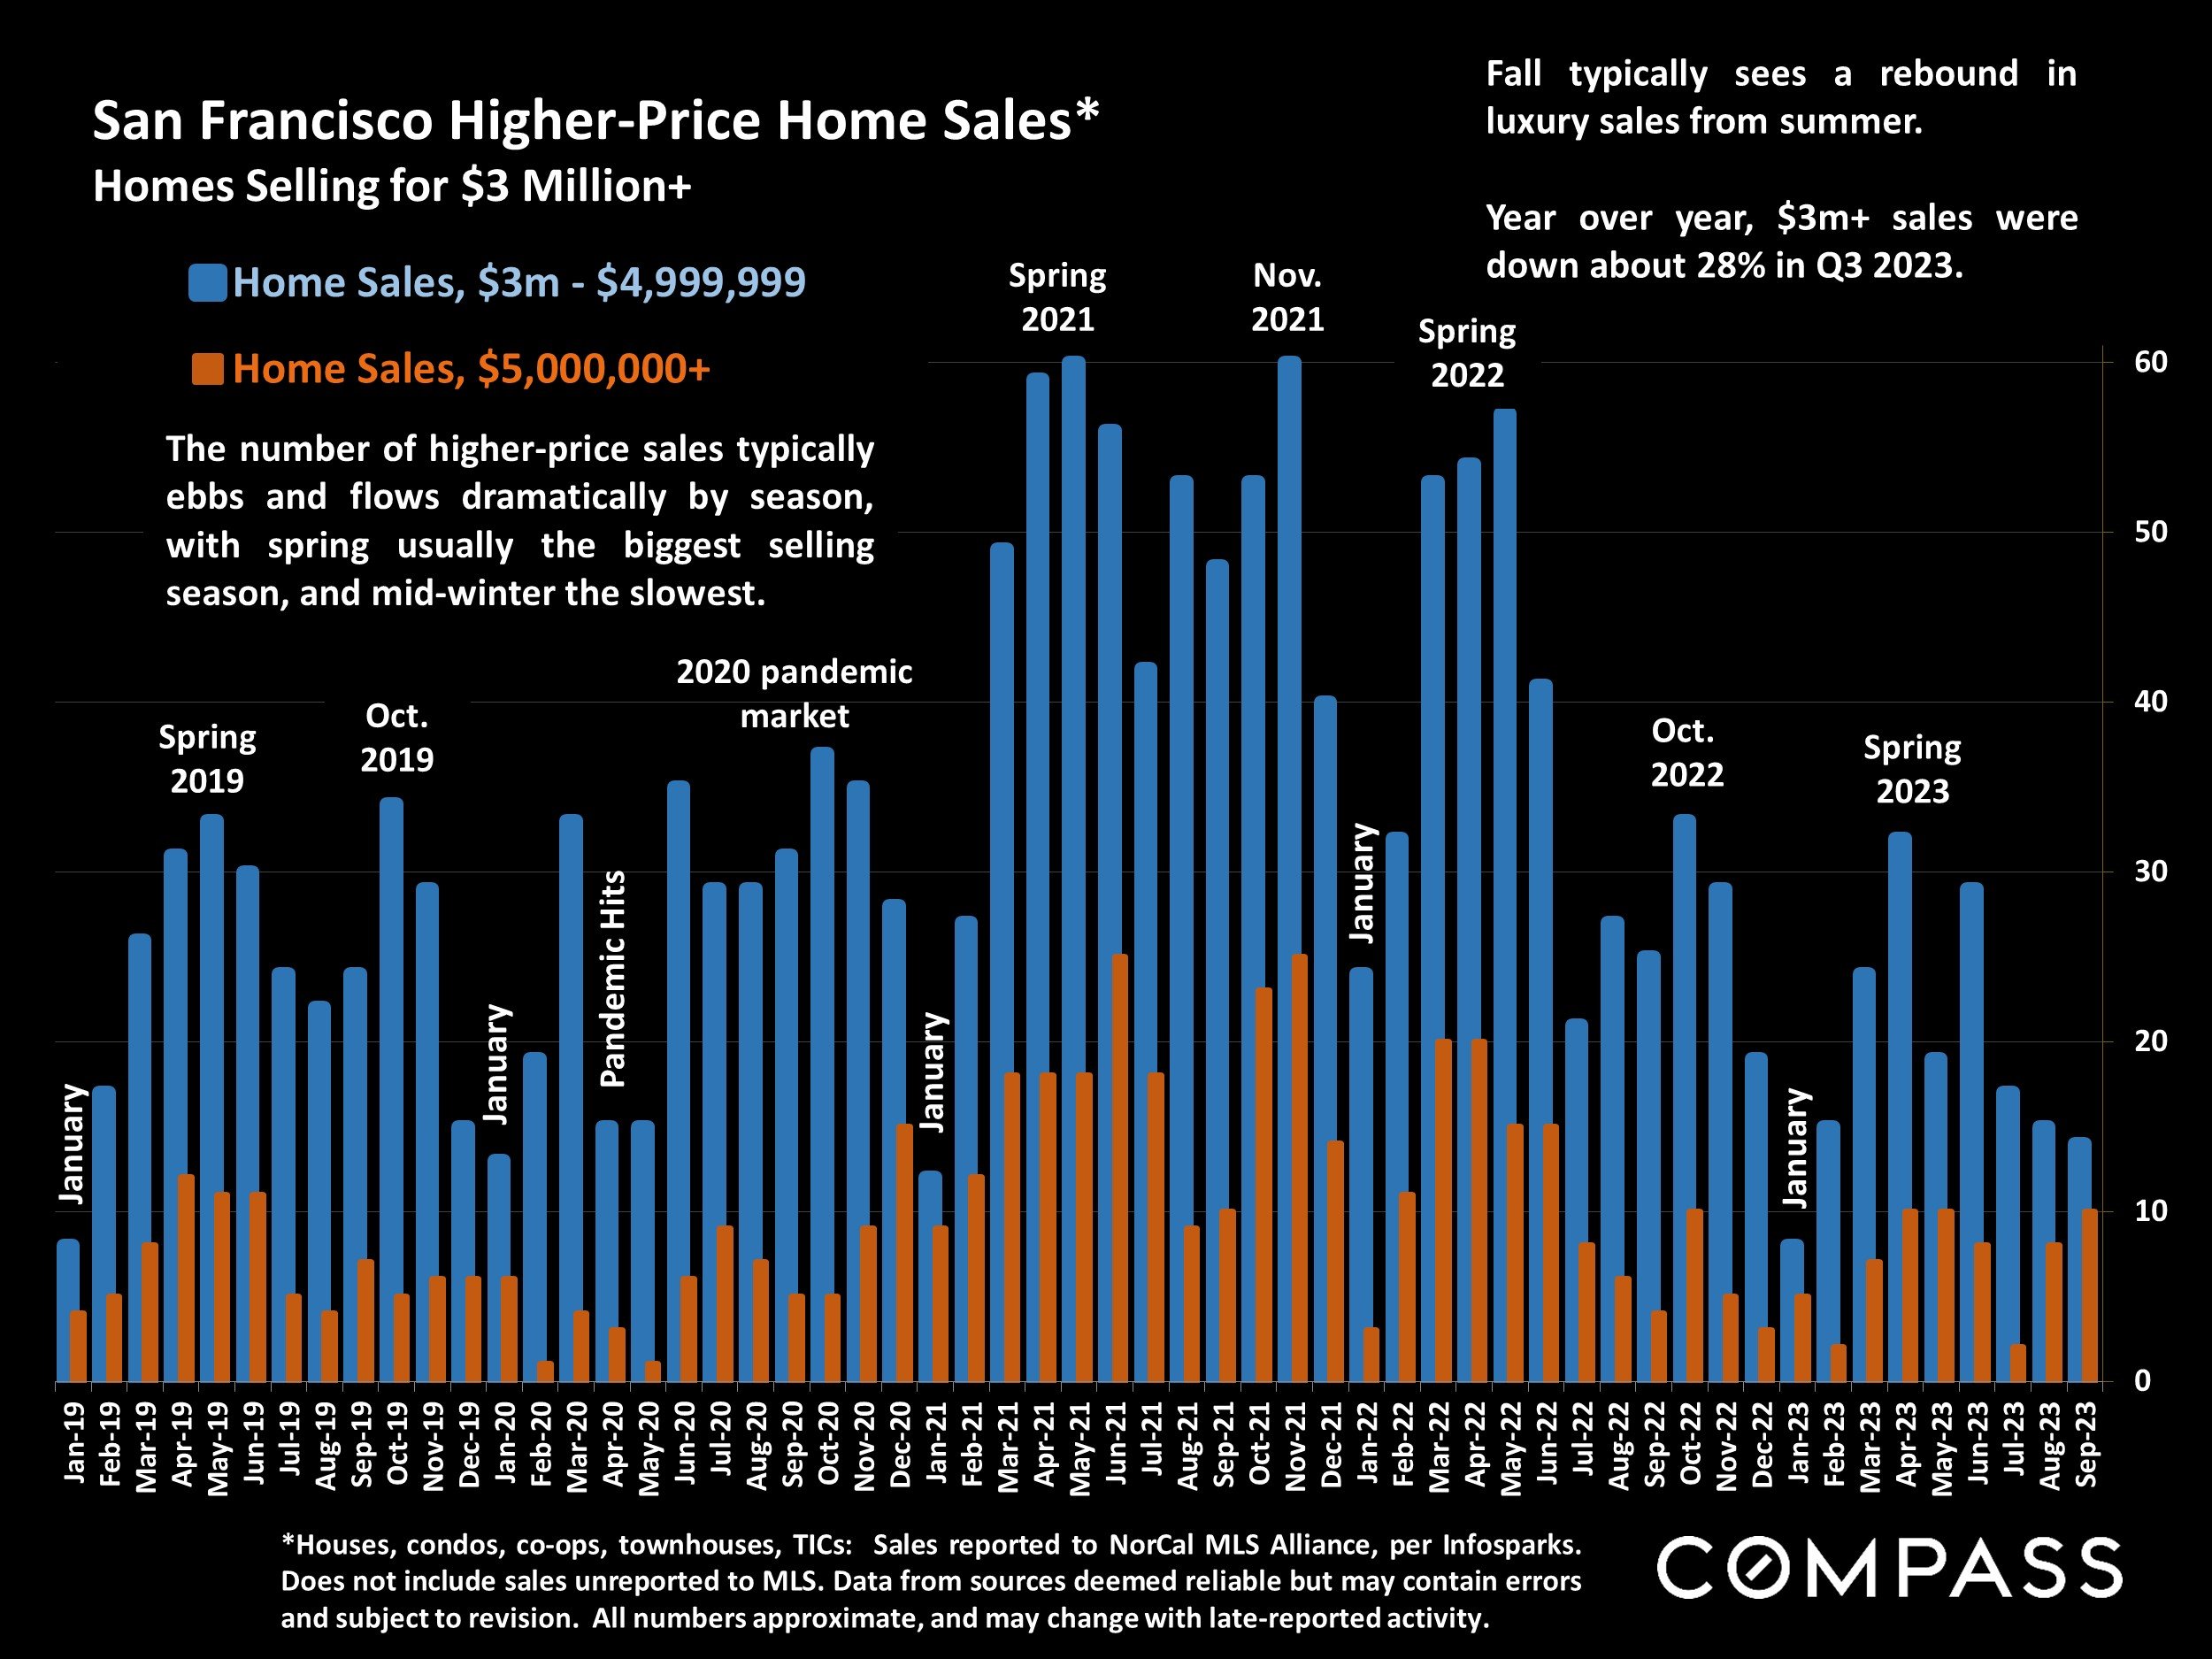
*Houses, condos, co-ops, townhouses, TICs: Sales reported to NorCal MLS Alliance, per Infosparks. Does not include sales unreported to MLS. Data from sources deemed reliable but may contain errors and subject to revision. All numbers approximate, and may change with late-reported activity.
Fall typically sees a rebound in luxury sales from summer.
Year over year, $3m+ sales were down about 28% in Q3 2023.
The number of higher-price sales typically ebbs and flows dramatically by season, with spring usually the biggest selling season, and mid-winter the slowest.
Most Expensive Home Sales, 2023 YTD,
Selected Bay Area Markets*
| Location (County) | Highest Home Sale* |
|---|---|
| Woodside (San Mateo) | $44,500,000 |
| Presidio Heights (SF) | $34,500,000 |
| Presidio Heights (SF) | $34,500,000 |
| Carmel (Monterey) | $29,000,000 |
| Atherton (San Mateo) | $25,000,000 |
| Big Sur (Monterey) | $24,500,000 |
| Pacific Heights (SF) | $23,500,000 |
| Sea Cliff (SF) | $20,000,000 |
| St. Helena (Napa) | $17,950,000 |
| Hillsborough (San Mateo) | $17,000,000 |
| Cow Hollow (SF) | $16,375,000 |
| Los Altos Hills (Santa Clara) | $14,950,000 |
| Belvedere (Marin) | $14,250,000 |
| City of Napa | $14,250,000 |
| Ross (Marin) | $14,000,000 |
| Palo Alto (Santa Clara) | $14,000,000 |
| Lafayette (Contra Costa) | $13,690,000 |
| Los Altos (Santa Clara) | $13,000,000 |
| Stinson Beach (Marin) | $13,250,000 |
| Pebble Beach (Monterey) | $13,200,000 |
| Saratoga (Santa Clara) | $12,468,000 |
| City of Sonoma | $12,250,000 |
| Mill Valley (Marin) | $12,100,000 |
| Kenwood (Sonoma) | $11,750,000 |
| Portola Valley (San Mateo) | $11,200,000 |
| Calistoga (Napa) | $11,125,000 |
| Menlo Park (San Mateo) | $11,100,000 |
| Tiburon (Marin) | $9,880,000 |
| Kentfield (Marin) | $9,495,000 |
| Blackhawk (Contra Costa) | $9,250,000 |
| Los Gatos (Santa Clara) | $8,575,000 |
| Healdsburg (Sonoma) | $8,500,000 |
| Yountville (Napa) | $8,400,000 |
| Piedmont (Alameda) | $7,500,000 |
| Danville (Contra Costa) | $7,500,000 |
| Alamo (Contra Costa) | $7,400,000 |
| Diablo (Contra Costa) | $7,350,000 |
| Glen Ellen (Sonoma) | $7,200,000 |
| La Selva Beach (Santa Cruz) | $6,943,000 |
| Santa Rosa (Sonoma) | $6,900,000 |
| San Jose (Santa Clara) | $6,064,500 |
| City of Santa Cruz | $6,000,000 |
| Oakland (Alameda) | $5,000,000 |
*2023 sales reported to NorCal MLS Alliance as of 9/29/23. Data from sources deemed reliable, but may contain errors and subject to revision. New sales are posted constantly. Not all luxury sales are reported.
Bay Area Luxury Home Market: Active Listings, $5 Million+
by Bay Area County, Luxury Homes for Sale*

*Residential active and coming-soon listings posted to NorCal MLS Alliance on 10/1/23. Not all luxury home listings are posted to MLS. In San Francisco, many new-project luxury condos are not listed in MLS. Numbers change constantly. Data from sources deemed reliable, but may contain errors and subject to revision. All numbers approximate.
As of October 1, 2023, San Francisco and San Mateo Counties had the highest number of active listings priced $5 million+.
Bay Area Luxury Market: Sales of $5 Million+
by Bay Area County, 2023 YTD Home Sales*
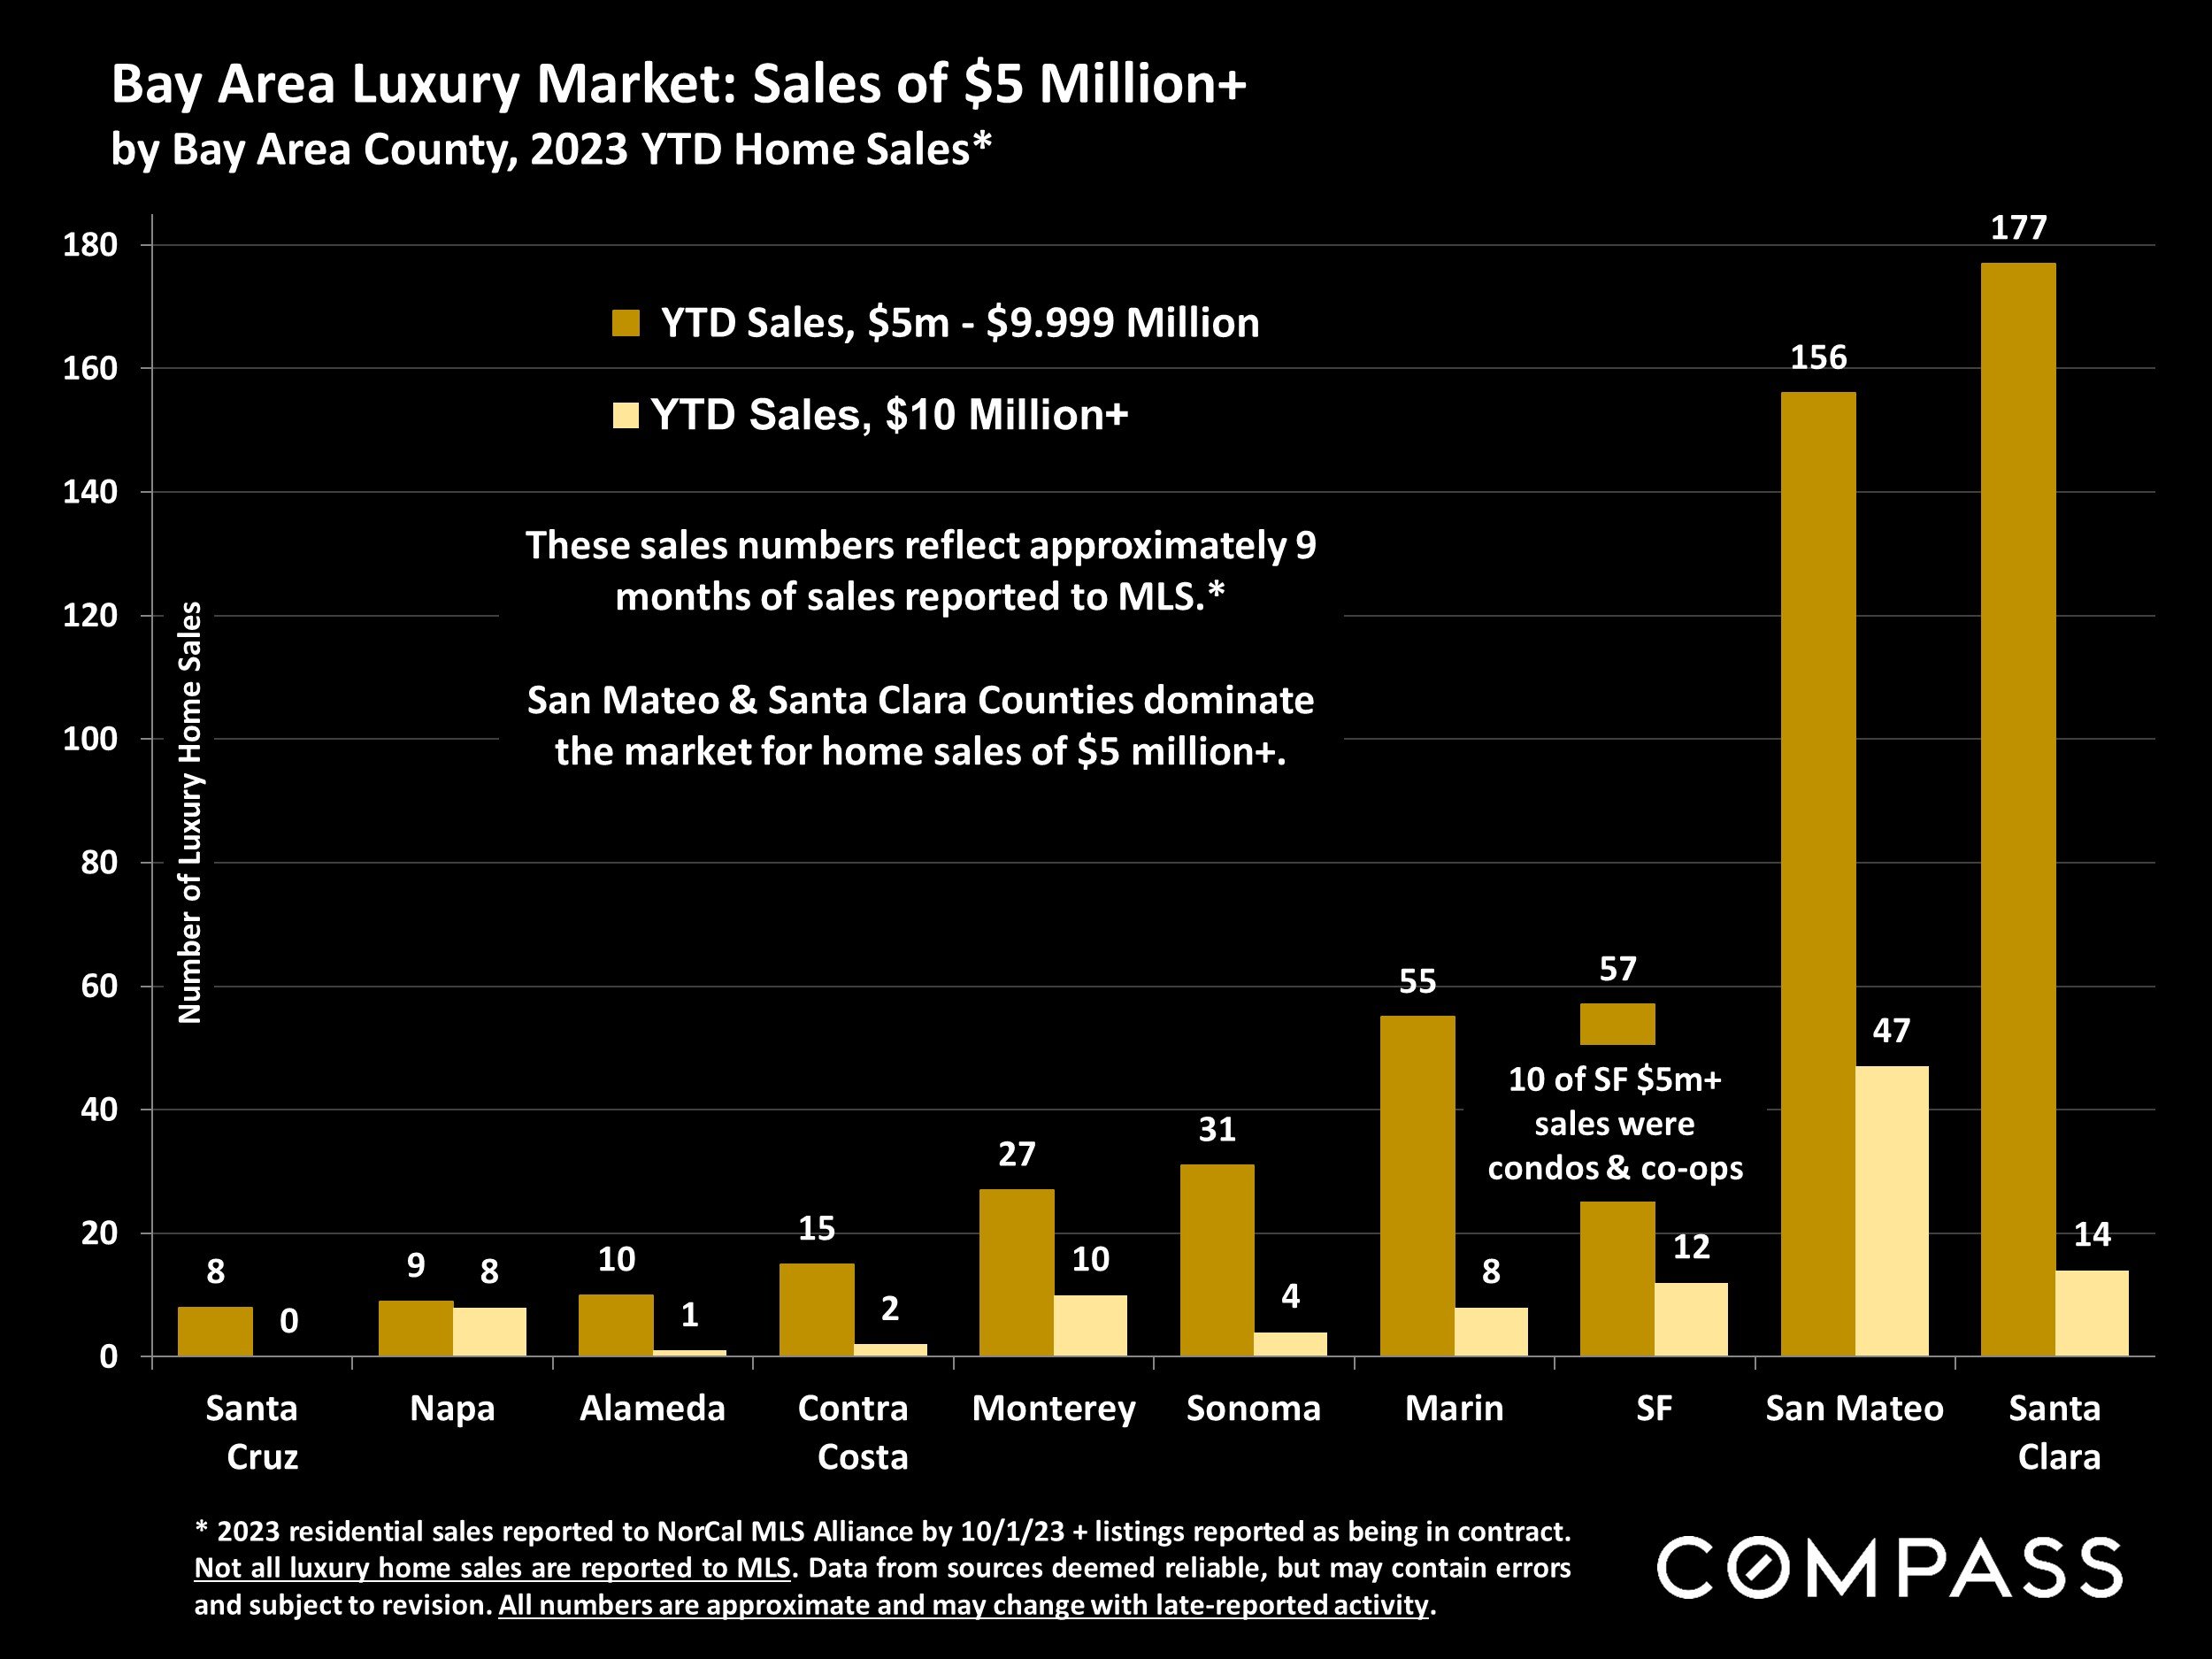
* 2023 residential sales reported to NorCal MLS Alliance by 10/1/23 + listings reported as being in contract. Not all luxury home sales are reported to MLS. Data from sources deemed reliable, but may contain errors and subject to revision. All numbers are approximate and may change with late-reported activity.
These sales numbers reflect approximately 9 months of sales reported to MLS.*
San Mateo & Santa Clara Counties dominate the market for home sales of $5 million+.
San Francisco Bay Area Home Sales
Q3 2023, Percentage of Sales by Price Segment*

*Q3 2023 residential sales reported to NorCal MLS Alliance by 9/30/23. Not all sales are reported to MLS. Data from sources deemed reliable, but may contain errors and subject to revision. Percentages rounded, all numbers approximate, and may change with late-reported sales.
3 tenths of 1% of Bay Area home sales were for $10 million+.
Sales by Property Type
House :75%
Condo/Co-op : 17%
Townhouse: 8%
Selected Comparative Statistics
Greater Bay Area Counties & U.S. (In Alphabetical Order)

*From "2023 County Health Rankings and Roadmaps," ranking 58 CA counties: https://www.countyhealthrankings.org/reports/2023-county-health-rankings-national-findings-report
**Census 2022 1-Year ACS estimates, published September 2023. Percentages refer to % of population; homeowner % of occupied housing units; bachelor/grad/professional degrees, population 25+years of age.
Counties with large agricultural sectors will be affected by socio-economic factors pertaining to agricultural workers.
Based on Census 2022 1-Year ACS estimates or "2023 County Health Rankings & Roadmaps" All numbers approximate & subject to revision.
San Francisco Census Snapshot

U.S. Census 2022, ACS 1-year estimates, published September 2023. *Occupied Housing Units,
**Employment, 16+ years of age. ***25+ years of age. All numbers approximate, subject to revision.
Mortgage Interest Rates, Long-Term Trends since 1976
30-Year Conforming Fixed-Rate Loans, Weekly Average Readings

Per Freddie Mac (FHLMC), on October 5, 2023, the weekly average, 30-year interest rate increased to 7.49%, its highest reading since 2000. (For 15-year loans, the rate was 6.78%.)
Statistics are generalities, essentially summaries of widely disparate data generated by dozens, hundreds or thousands of unique, individual sales occurring within different time periods. They are best seen not as precise measurements, but as broad, comparative indicators, with reasonable margins of error. Anomalous fluctuations in statistics are not uncommon, especially in smaller, expensive market segments. Last period data should be considered estimates that may change with late-reported data. Different analytics programs sometimes define statistics – such as “active listings,” “days on market,” and “months supply of inventory” – differently: what is most meaningful are not specific calculations but the trends they illustrate. Most listing and sales data derives from the local or regional multi-listing service (MLS) of the area specified in the analysis, but not all listings or sales are reported to MLS and these won’t be reflected in the data. “Homes” signifies real-property, single-household housing units: houses, condos, co-ops, townhouses, duets and TICs (but not mobile homes), as applicable to each market. City/town names refer specifically to the named cities and towns, unless otherwise delineated. Multi-county metro areas will be specified as such. Data from sources deemed reliable, but may contain errors and subject to revision. All numbers to be considered approximate.
Many aspects of value cannot be adequately reflected in median and average statistics: curb appeal, age, condition, amenities, views, lot size, quality of outdoor space, “bonus” rooms, additional parking, quality of location within the neighborhood, and so on. How any of these statistics apply to any particular home is unknown without a specific comparative market analysis.
Median Sales Price is that price at which half the properties sold for more and half for less. It may be affected by seasonality, “unusual” events, or changes in inventory and buying trends, as well as by changes in fair market value. The median sales price for an area will often conceal an enormous variety of sales prices in the underlying individual sales.
Dollar per Square Foot is based upon the home’s interior living space and does not include garages, unfinished attics and basements, rooms built without permit, patios, decks or yards (though all those can add value to a home). These figures are usually derived from appraisals or tax records, but are sometimes unreliable (especially for older homes) or unreported altogether. The calculation can only be made on those home sales that reported square footage.
Photo use under the Creative Commons License: https://creativecommons.org/licenses/by-sa/2.0/
Compass is a real estate broker licensed by the State of California, DRE 01527235. Equal Housing Opportunity. This report has been prepared solely for information purposes. The information herein is based on or derived from information generally available to the public and/or from sources believed to be reliable. No representation or warranty can be given with respect to the accuracy or completeness of the information. Compass disclaims any and all liability relating to this report, including without limitation any express or implied representations or warranties for statements contained in, and omissions from, the report. Nothing contained herein is intended to be or should be read as any regulatory, legal, tax, accounting or other advice and Compass does not provide such advice. All opinions are subject to change without notice. Compass makes no representation regarding the accuracy of any statements regarding any references to the laws, statutes or regulations of any state are those of the author(s). Past performance is no guarantee of future results.