September 2023 Market Report

Photo by Cedric Letsch on Unsplash
“The surprisingly quick recovery [of the housing market] suggests that the residential real-estate downturn is turning out to be shorter and shallower than many housing economists expected after mortgage rates soared last year...There still aren’t enough homes for sale to meet demand.”
The Wall Street Journal, “The Fall in Home Prices May Already Be Over,” 9/8/23
Generally speaking, the market rebounded much more strongly in 2023 than seemed possible at the end of 2022, when, after hitting historic peaks during the pandemic boom, economic and demand indicators hit their lowest points since the great recession. The decline in the number of sellers putting their homes on the market continues to be a factor in the balance between supply and demand, in the recovery in home prices, and the decline of overall sales volumes. In San Francisco, the situation is a little more complicated, with distinct differences between the house and condo markets, and between condo markets in different parts of the city (differences which are illustrated in this report). In August, the average, weekly, 30-year mortgage rate, as published by FHLMC, ticked back up over 7%, a situation which continues to impact housing affordability. Perhaps in response, the percentage of buyers paying all cash has generally been running at its highest national level in 8 years.
After the usual summer slowdown from spring, the autumn selling season began after Labor Day and runs until early-mid November, when the market typically begins its big, mid-winter holiday slowdown. By Thanksgiving, the number of new listings coming on market has plummeted, and December commonly sees by far the lowest level of monthly sales activity.
But, in the meantime, we expect to see substantial activity this fall. Historically speaking, September is often the single month of the year with the highest number of new listings. Luxury home listings in San Francisco commonly see a particularly large spike in autumn sales.
San Francisco HOUSE Price Trends since 1990
Monthly Median House Sales Prices, 3-Month Rolling

3-month rolling average of monthly median sales prices for “existing” houses, per CA Association of Realtors or 3-month rolling median per NorCal MLS Alliance. 2-period moving trend line. Analysis may contain errors and subject to revision. All numbers approximate, and may change with late-reported sales.
Median sales price is that price at which half the sales occurred for more and half for less. It is a very general statistic, disguising an enormous range of sales prices in the underlying sales. It is often affected by other factors besides changes in fair market value. Monthly and seasonal fluctuations are common, which explain many of the regular ups and downs in this chart.
San Francisco HOUSE Price Trends since 2005
Median House Sales Prices, 3-Month Rolling

3-month rolling median sales prices reported to NorCal MLS Alliance, per Infosparks. Analysis may contain errors and subject to revision. All numbers approximate, and may change with late-reported sales.
Median sales price is that price at which half the sales occurred for more and half for less. It is a very general statistic, disguising an enormous range of sales prices in the underlying sales. It is often affected by other factors besides changes in fair market value. Monthly and seasonal fluctuations are common.
San Francisco HOUSE Price Appreciation Since 1995
Percentage Change, 3-Month-Rolling, Median House Sales Price*

*3-month rolling sales reported to NorCal MLS Alliance. Data from sources deemed reliable, but may contain errors and subject to revision. Percentages rounded to nearest full point. All numbers approximate, and may change with late-reported sales.
Comparing the summer – June-August – median house sales price with the same periods of various years since 1995 to calculate approximate short-term and longer-term appreciation rates.
Median sales prices can be affected by a variety of factors other than changes in fair market value, as can year-over-year appreciation rates. Appreciation rate calculations can change substantially according to the exact periods being measured. How these rates apply to any particular property is unknown without a specific comparative market analysis.
We expect to see the year-over-year price decline continue to drop in coming months.
San Francisco: Year-over-Year HOUSE Price Change
Percentage Change in Year-over-Year, 3-Month-Rolling Median House Sales Price*

*3-month rolling sales reported to NorCal MLS Alliance, per Infosparks. Data from sources deemed reliable, but may contain errors and subject to revision. Percentages rounded. All numbers approximate.
Comparing the 3-month-rolling median house sales price with the same month of the previous year to calculate the y-o-y percentage change: August 2022 – August 2023.
The market correction in mid-2022 ended the high appreciation rates of the pandemic boom. Home prices then began to see increasing year-over-year price declines, which peaked in spring. Those y-o-y declines are now rapidly dropping.
Median sales prices can be affected by a variety of factors other than changes in fair market value, as can year-over-year appreciation rates. Regional markets within the county often saw varying % changes during the period.
San Francisco House Market
6 Months House Sales by Price Segment*

*6 months house sales reported to NorCal MLS Alliance by mid-August 2023. Not all sales are reported to MLS. Data from sources deemed reliable, but may contain errors and subject to revision. All numbers approximate, and may change with late-reported sales.
House sales by price segment
| Price segment | # of sales |
|---|---|
| $500k=$999K | 100 |
| $1M-$1.49M | 344 |
| $1.5M-$1.99M | 233 |
| $2M-$2.49M | 103 |
| $2.5M-$2.99M | 72 |
| $3M-$3.99M | 73 |
| $4M-$4.99M | 36 |
| $5M-$5.99M | 36 |
6 house sales of more than $10 million were reported to MLS during the 6-month period.
House Sales by Bedroom Count
| # of Bedrooms | # of sales |
|---|---|
| 2 BR | 245 |
| 3 BR | 417 |
| 4 BR | 223 |
| 5+ BR | 96 |
San Francisco CONDO Price Trends since 2005
Median Condo Sales Price, 3-Month Rolling
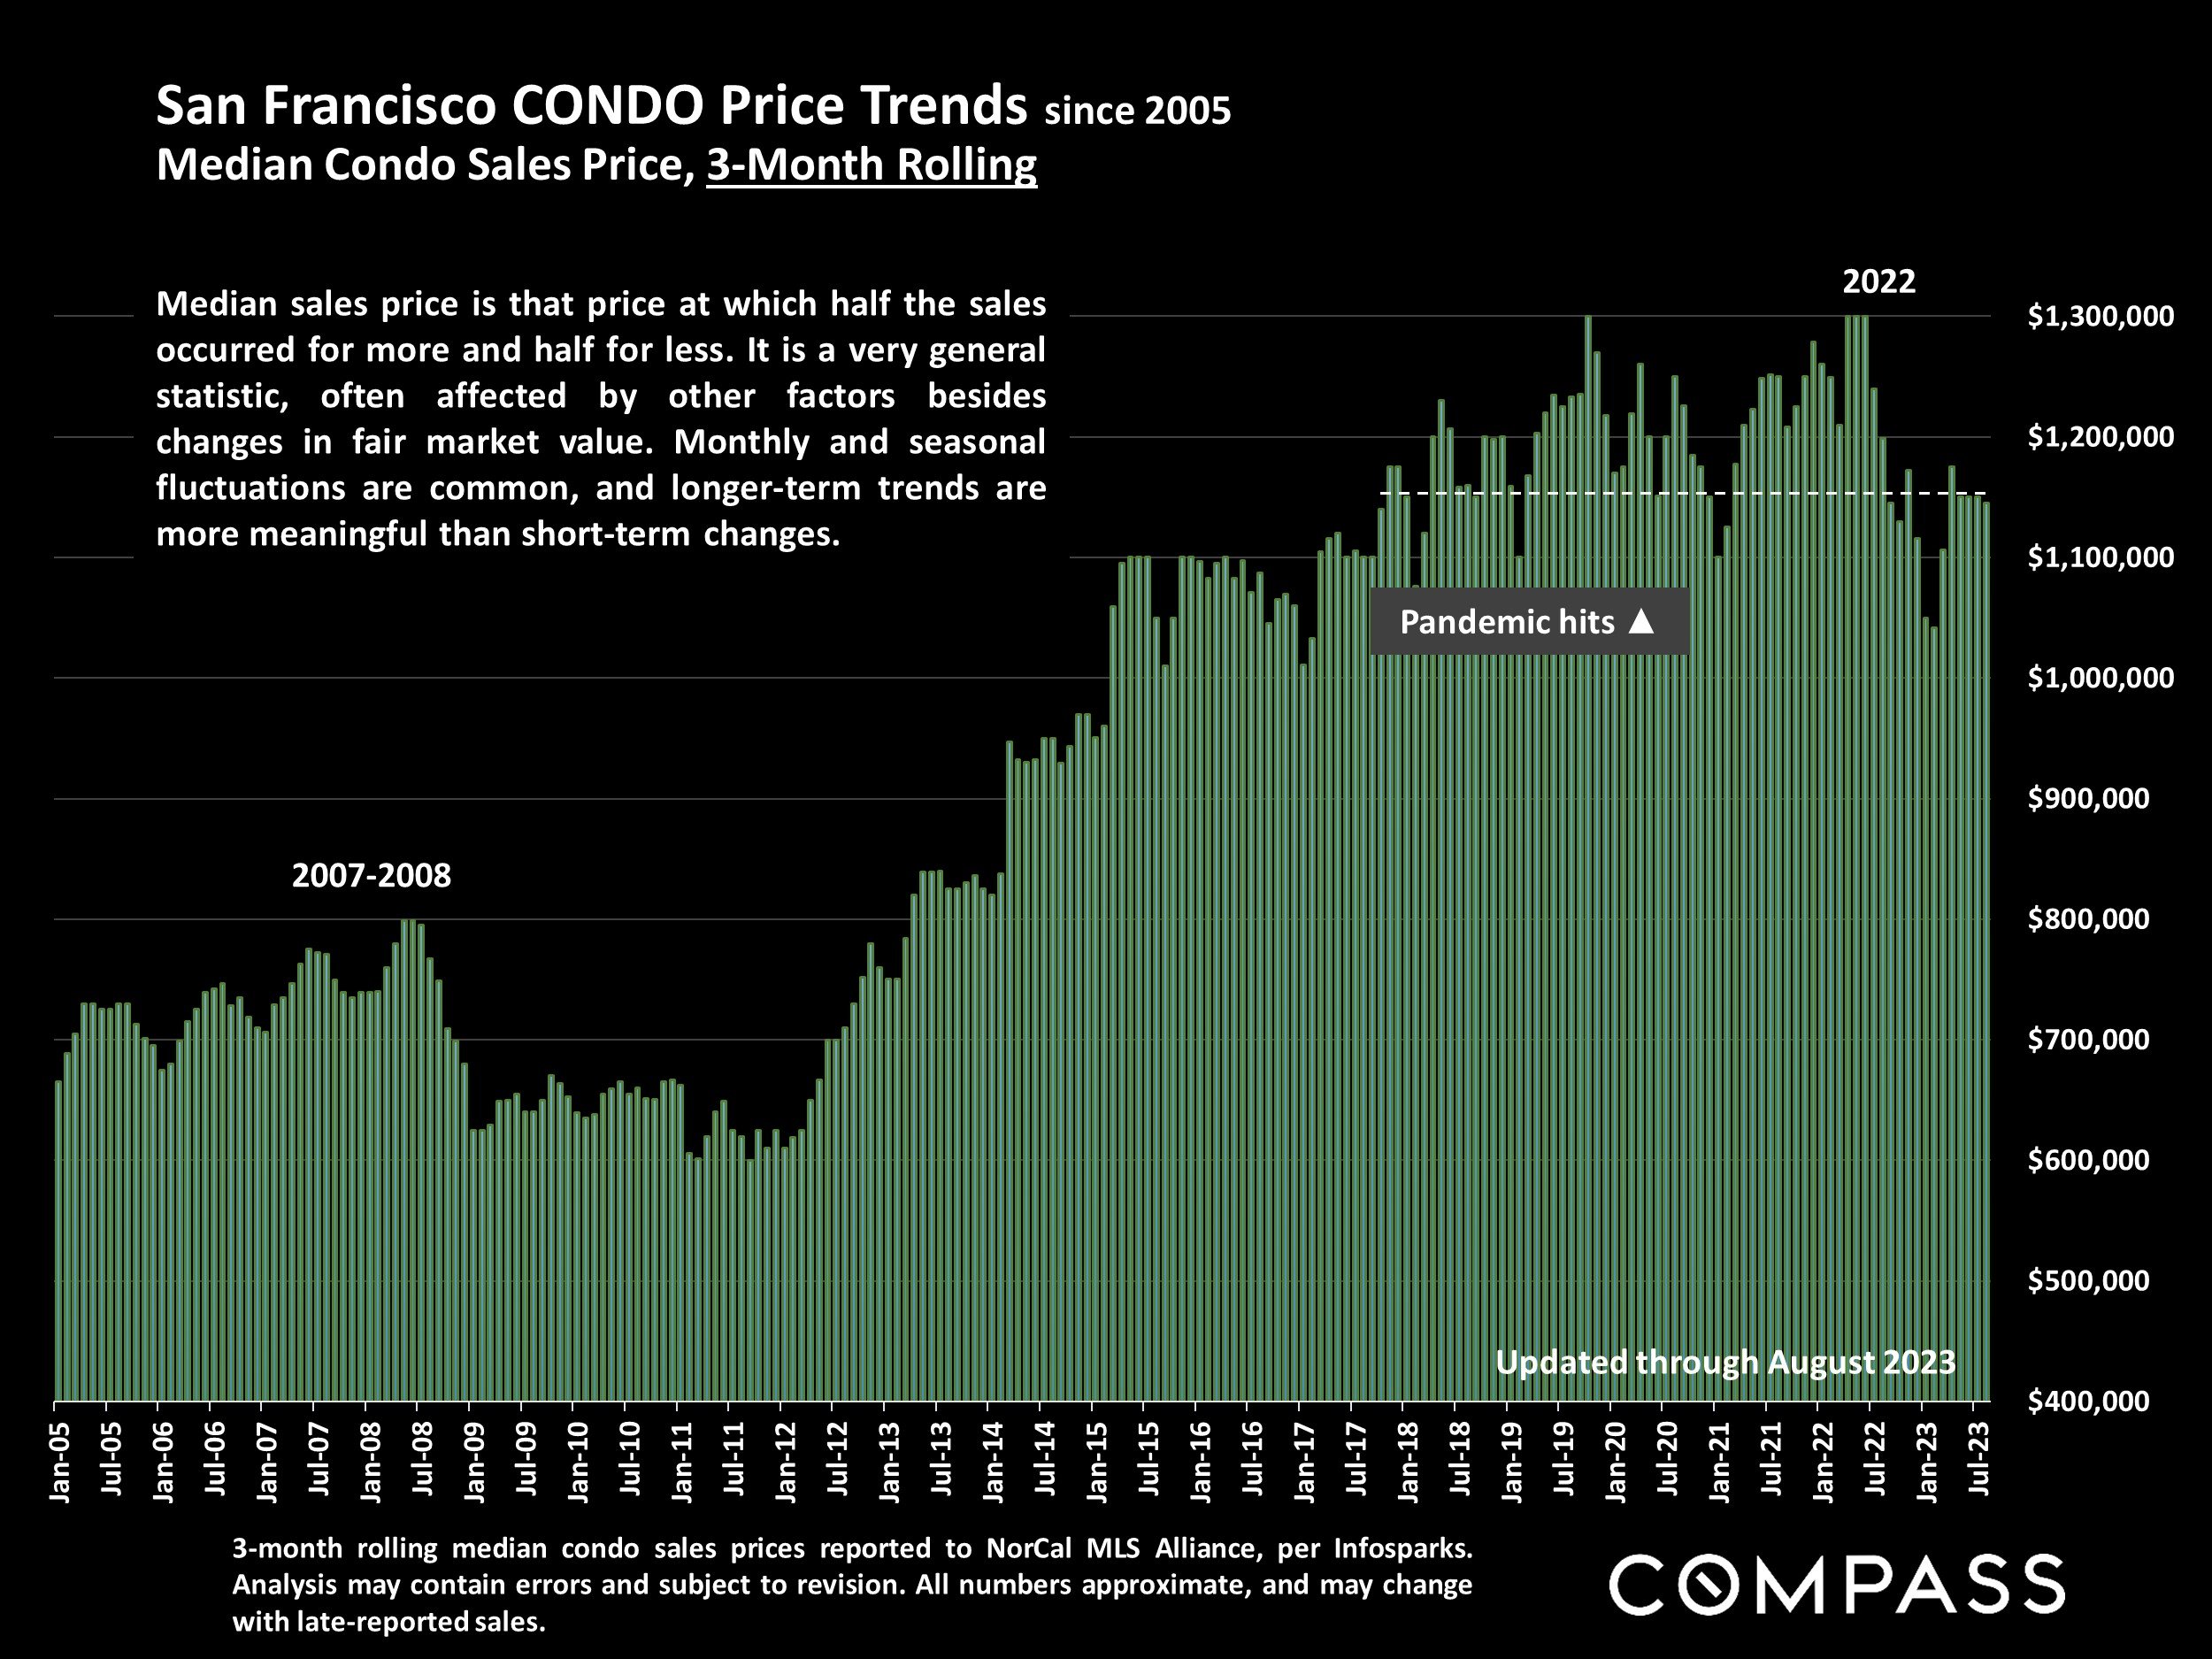
3-month rolling median condo sales prices reported to NorCal MLS Alliance, per Infosparks. Analysis may contain errors and subject to revision. All numbers approximate, and may change with late-reported sales.
Median sales price is that price at which half the sales occurred for more and half for less. It is a very general statistic, often affected by other factors besides changes in fair market value. Monthly and seasonal fluctuations are common, and longer-term trends are more meaningful than short-term changes.
San Francisco CONDO Price Appreciation Since 1995
Percentage Change, 3-Month-Rolling, Median Condo Sales Price*

*3-month rolling sales reported to NorCal MLS Alliance. Data from sources deemed reliable, but may contain errors and subject to revision. Percentages rounded to nearest full point. All numbers approximate, and may change with late-reported sales.
Comparing the summer – June-August – median condo sales price with the same periods of various years since 1995 to calculate approximate short-term and longer-term appreciation rates.
Median sales prices can be affected by a variety of factors other than changes in fair market value, as can year-over-year appreciation rates. Appreciation rate calculations can change substantially according to the exact periods being measured. How these rates apply to any particular property is unknown without a specific comparative market analysis.
San Francisco CONDO Price Trends since 2005
Median Condo Sales Prices, 3-Month Rolling

3-month rolling median sales prices reported to NorCal MLS Alliance, per Infosparks. Median sales price is that price at which half the sales occurred for more and half for less. Monthly and seasonal fluctuations are common. Analysis may contain errors and subject to revision. All numbers approximate, and may change with late-reported sales.
On the whole, condo prices have scaled back to about where they were in the middle of the last decade.
San Francisco CONDO Price Trends: Downtown vs. Non-Downtown
6-Month-Rolling Median Condo Sales Prices since 2005*

*6-month rolling median condo sales values reported to NorCal MLS Alliance, per Infosparks. Analysis may contain errors and subject to revision. Does not include new-project sales unreported to MLS. All numbers approximate, and may change with late-reported sales.
Comparing the median condo sales price in the greater Downtown/South of Market/Civic Center area (the center of large-project, new-condo construction, office buildings and high-tech employment) – delineated by the blue line – with the median condo sales price in the rest of San Francisco (mostly smaller, older buildings, in less urban environments) – delineated by the white columns.
The greater downtown/SoMa/Civic Center condo market has been more negatively affected by a number of economic, demographic, and social factors impacting supply and demand than condo markets in other city districts.
San Francisco Condo, Co-op, Townhouse & TIC Market
6 Months MLS Sales by Price Segment*

*6 months sales reported to NorCal MLS Alliance by mid-August 2023. Many new-project condo sales are not reported to MLS. Data from sources deemed reliable, but may contain errors and subject to revision. All numbers approximate, and may change with late-reported sales.
| Price segment | # of sales |
|---|---|
| Under $500k | 65 |
| $500K-$749K | 206 |
| $750K-$999K | 256 |
| $1M-$1.249M | 190 |
| $1.25M-$1.499M | 171 |
| $1.5M-$1.999M | 215 |
| $2M-$2.999M | 90 |
| $3M-$3.999M | 20 |
| $4M-$4.999M | 13 |
Sales by Unit Size
| # of Bedrooms | # of sales |
|---|---|
| Studio | 44 |
| 1 BR | 320 |
| 2 BR | 538 |
| 3 BR | 286 |
| 4+ BR | 38 |
84% of sales were condos, 13% TICs, 2% co-ops, 2%townhouses. 31 were “below market rate” units, almost all below $500,000.
Many factors affect values, but particularly in larger projects, the floor a unit is on – and the views it offers – is a major one.
San Francisco: Homes for Sale
Active/Coming-Soon Listings*

* Active/Coming Soon listings (no offer accepted) posted to NorCal MLS Alliance. Data from sources deemed reliable, but may contain errors and subject to revision. Not all listings are posted to MLS, including many new-project condos. All numbers approximate. Numbers of listings and median list prices change constantly.
Active & Coming-Soon Listings Posted to MLS on September 7, 2023, by Price Segment*
Under $1,000,000: 57 houses; 375 condos/co-ops/TICs
$1,000,000 - $1.499m: 105 houses; 196 condos/co-ops/TICs
$1,500,000 - $1.999m: 83 houses; 106 condos/co-ops/TICs
$2,000,000 - $2.999m: 47 houses; 77 condos/co-ops/TICs
$3,000,000 - $4.999m: 45 houses; 31 condos/co-ops/TICs
$5,000,000 - $9.999m: 38 houses; 21 condos/co-ops/TICs
$10,000,000 & above: 15 houses; 6 condos/co-ops
Includes 5 listings priced at $19,900,000+
Active/Coming-Soon Listings with Median List (Asking) Prices*
Houses – 390 listings - $1,700,000
Condos – 712 listings - $1,096,500
TICs – 83 listings - $1,050,000
Co-ops – 17 listings - $2,595,000
Townhouses – 9 listings - $1,139,000
Residential Income Properties:
2-Unit Buildings – 86 listings - $1,750,000
3-Unit Buildings – 44 listings - $2,142,500
4-Unit Buildings – 26 listings - $2,050,000
Median list prices may not be representative of typical median sales values. Home sizes and values vary widely within and between neighborhoods.
Numbers do not include new-project condo listings not posted to MLS. Data above as of 9/7/23.
Average Days on Market – Speed of Sale
San Francisco Market Dynamics & Seasonality
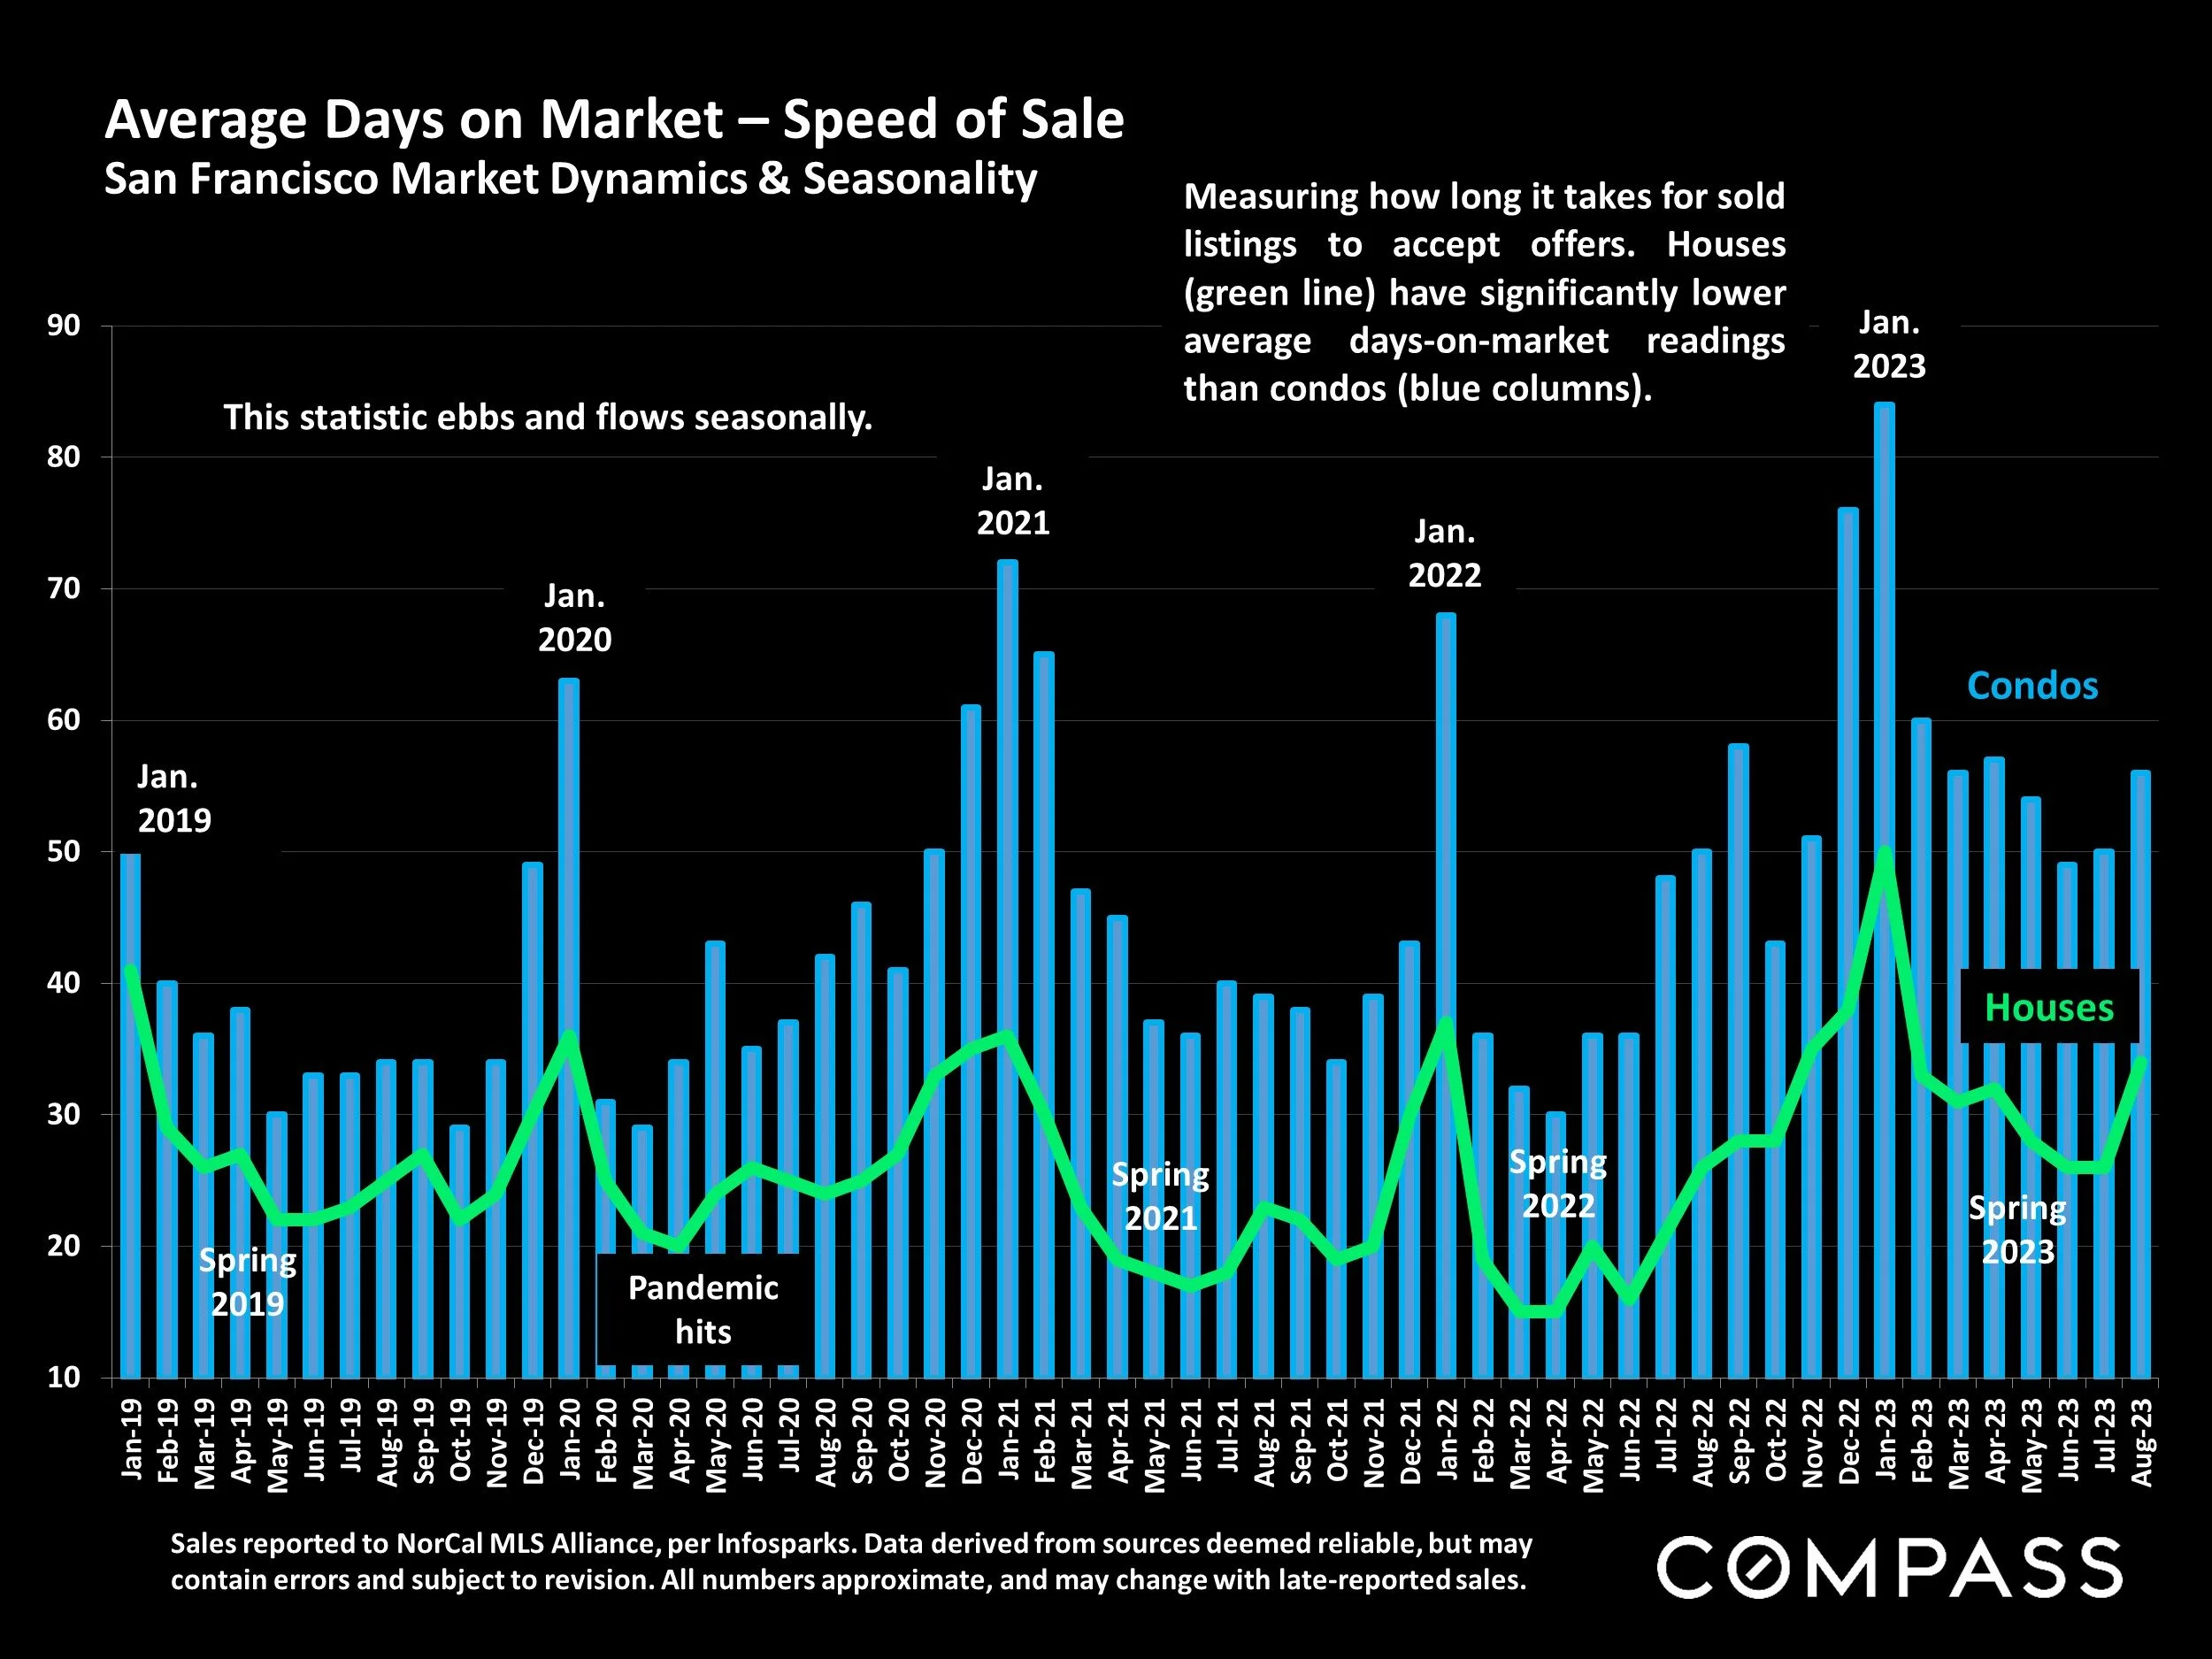
Sales reported to NorCal MLS Alliance, per Infosparks. Data derived from sources deemed reliable, but may contain errors and subject to revision. All numbers approximate, and may change with late-reported sales.
Measuring how long it takes for sold listings to accept offers. Houses (green line) have significantly lower average days-on-market readings than condos (blue columns).
Overbidding List Prices in San Francisco
Percentage of Home Sales Closing over List Price, since 2018
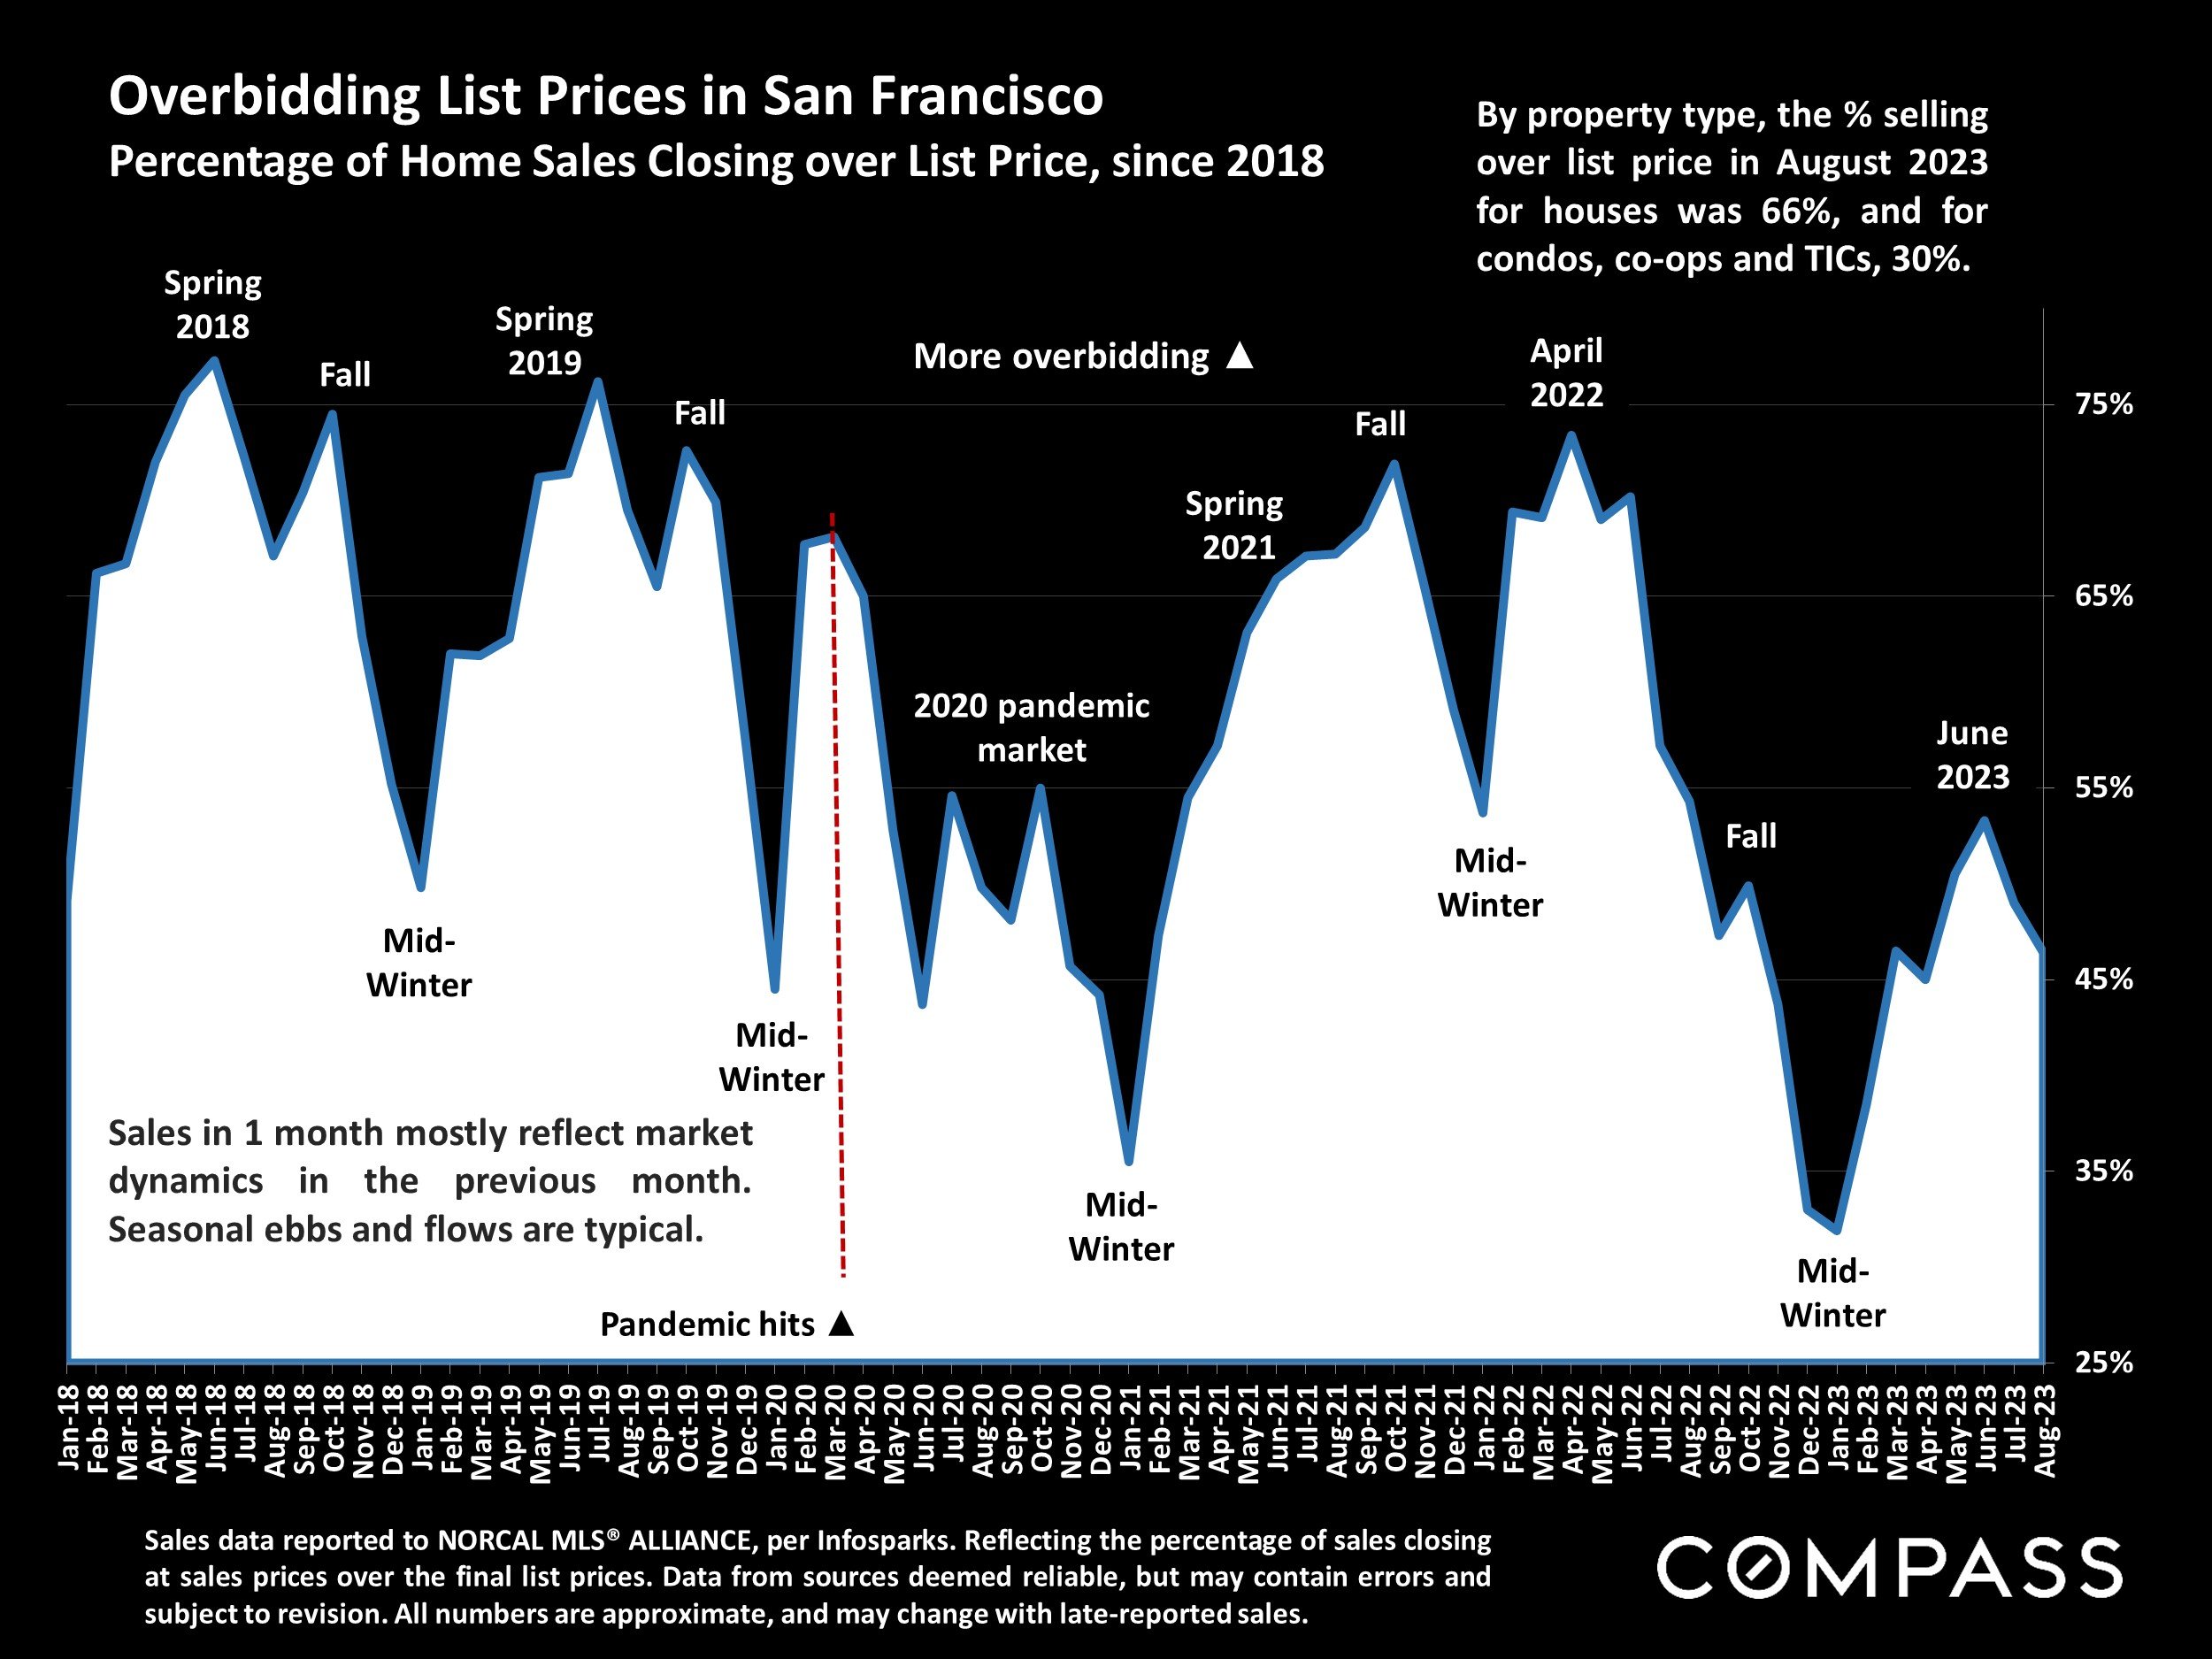
Sales data reported to NORCAL MLS® ALLIANCE, per Infosparks. Reflecting the percentage of sales closing at sales prices over the final list prices. Data from sources deemed reliable, but may contain errors and subject to revision. All numbers are approximate, and may change with late-reported sales.
By property type, the % selling over list price in August 2023 for houses was 66%, and for condos, co-ops and TICs, 30%.
Sales in 1 month mostly reflect market dynamics in the previous month. Seasonal ebbs and flows are typical.
Average Sales Price to Original List Price Percentage
San Francisco Over/Under Bidding: Market Dynamics & Seasonality
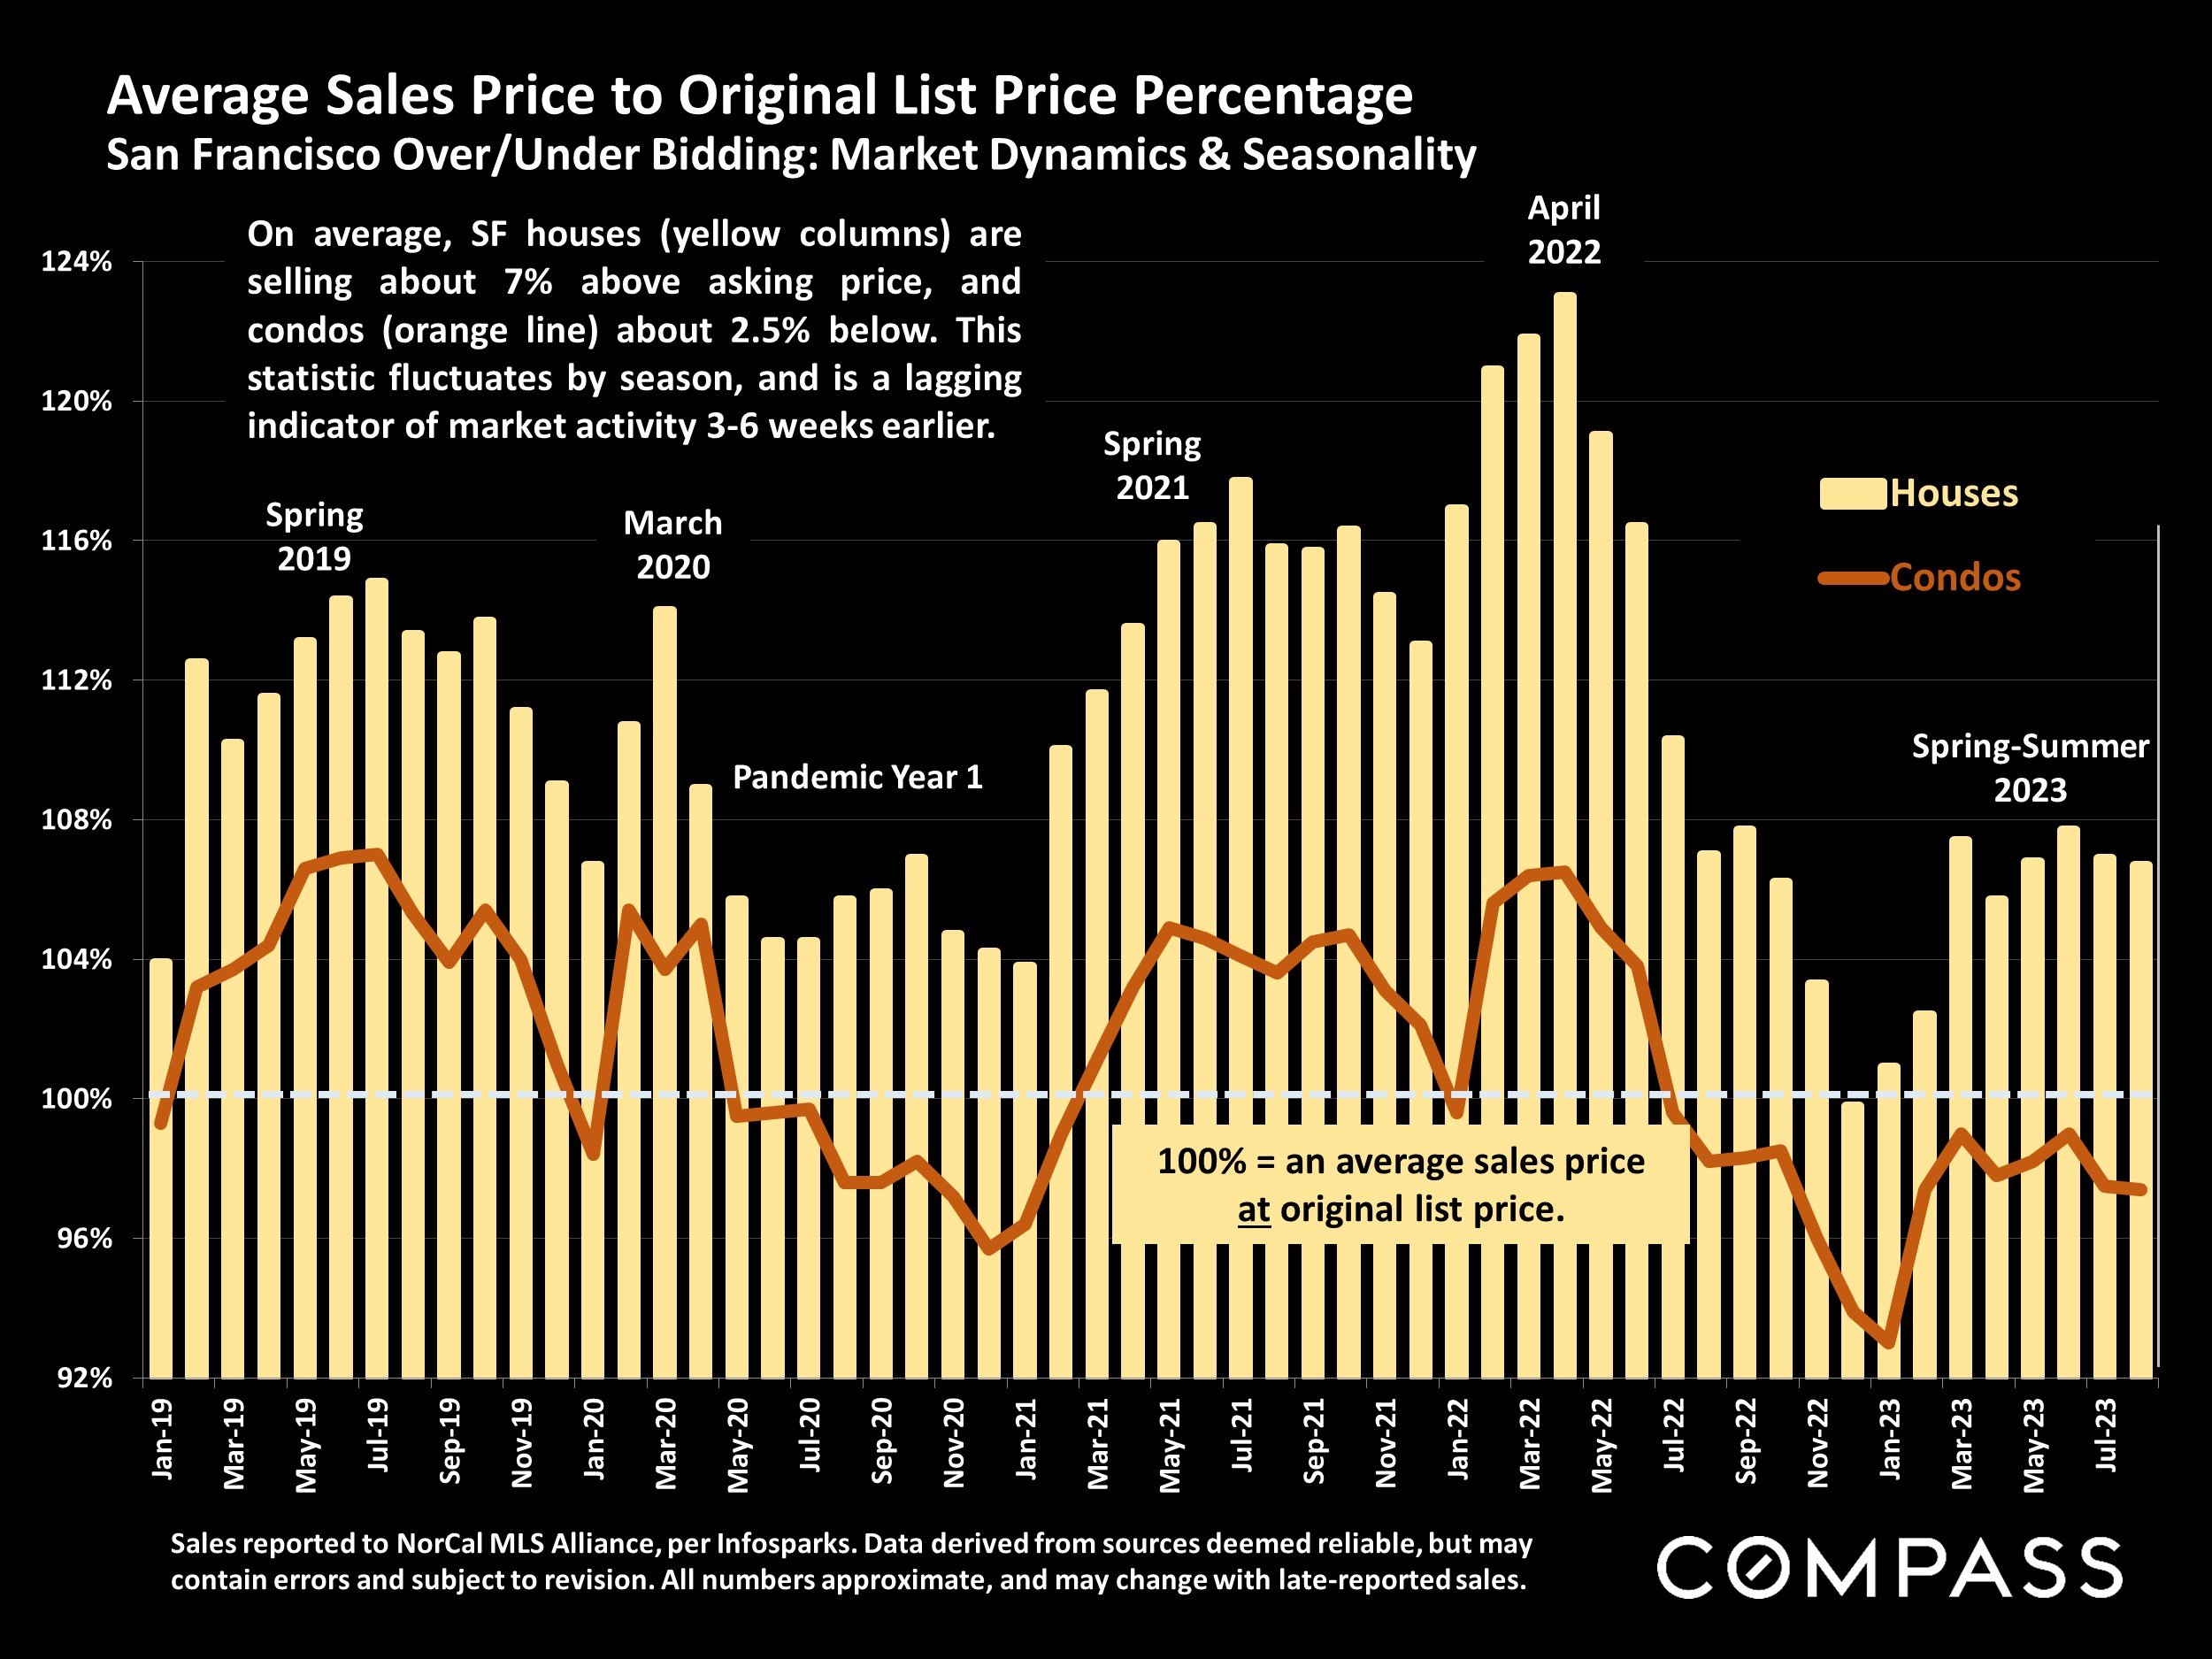
Sales reported to NorCal MLS Alliance, per Infosparks. Data derived from sources deemed reliable, but may contain errors and subject to revision. All numbers approximate, and may change with late-reported sales.
On average, SF houses (yellow columns) are selling about 7% above asking price, and condos (orange line) about 2.5% below. This statistic fluctuates by season, and is a lagging indicator of market activity 3-6 weeks earlier.
New Listings Coming on Market
San Francisco Market Dynamics & Seasonality

Residential activity reported to MLS, per Broker Metrics. Data from sources deemed reliable, but may contain errors and subject to revision. All numbers approximate, and may change with late-reported activity.
Historically speaking, the month of September typically sees one of the year’s highest numbers of new listings coming on market, which then fuels the autumn selling season. This spike in new listings was not as dramatic in 2022 as in most years due to specific economic factors at play.
The number of new listings coming on market ebbs and flows by seasonal trends, though it can be affected by specific market dynamics.
San Francisco Homes Market
Active & Coming-Soon Listings on 1st of Month*

* Houses, condos, co-ops, TICs, townhouses: Active/Coming-Soon listings posted to NorCal MLS Alliance. Does not include new-project condos not listed on MLS. Data from sources deemed reliable, but may contain errors and subject to revision. All numbers approximate. The # of active listings changes constantly.
Of the listings for sale on September 1, 33.5% were houses, and 66.5% were condos, co-ops, TICs & townhouses.*
The # of active listings on a given day is affected by 1) the # of new listings coming on market, 2) how quickly buyers put them into contract, 3) the sustained heat of the market over time, and 4) sellers pulling their homes off the market without selling.
Active Listings on Market – Longer-Term Trends
San Francisco Market Dynamics & Seasonality

Per Realtor.com Research: https://www.realtor.com/research/data/, house and condo listings posted on site. May not include coming-soon listings. Data from sources deemed reliable, but may contain errors and subject to revision. All numbers approximate.
This is a snapshot measure of how many active listings can be expected on any given day of the specified month.
The number of active listings on a given day is affected by 1) how many new listings come on market, 2) how quickly buyers snap them up, 3) the sustained heat of the market over time, and 4) how many sellers pull their homes off the market without selling. The number typically ebbs and flows by season.
Listings Accepting Offers (Going into Contract)
San Francisco Market Dynamics & Seasonality

Residential activity reported to MLS, per Broker Metrics. Data from sources deemed reliable, but may contain errors and subject to revision. All numbers approximate, and may change with late-reported activity.
After slowing in summer from the high demand of the spring market, activity usually rebounds in September and October (though that did not happen in 2022 due to other market factors). Once November hits, activity typically plunges to its mid-winter holiday low point.
The # of listings going into contract measures buyer demand, but is also deeply impacted by the supply of new listings available to buy.
Monthly Home Sales Volume
San Francisco Market Dynamics & Seasonality

Sales of houses, condos, townhouses reported to NorCal MLS Alliance, per Infosparks. Data from sources deemed reliable but may contain errors and subject to revision. Last month estimated based on available information and may change with late reported sales. All numbers approximate.
Sales in one month mostly reflect accepted-offer activity in the previous month. Fall usually sees a spike up in sales before the big, mid-winter slowdown (though that did not happen in 2022).
San Francisco Higher-Price Home Sales*
Homes Selling for $3 Million+ & $5 Million+

*Houses, condos, co-ops, townhouses, TICs: Sales reported to NorCal MLS Alliance, per Infosparks. Does not include sales unreported to MLS. Data from sources deemed reliable but may contain errors and subject to revision. All numbers approximate, and may change with late-reported activity.
Sales usually follow the time of offers being accepted by 3 to 5 weeks. Fall typically sees a rebound in luxury sales from summer.
The number of higher-price sales typically ebbs and flows dramatically by season, with spring usually the biggest selling season, and mid-winter the slowest.
U.S. Percentage of All-Cash Buyers
National Market Dynamics since 2015*

*Realtors® Confidence Index Survey. Data copyright, National Association of Realtors®. All rights reserved. Used with permission. 3-month rolling average of NAR data. All numbers are approximate good-faith estimates based on a survey of Realtors. Data from sources deemed reliable, but may contain errors and subject to revision.
Generally speaking, the percentage of home buyers paying all-cash in 2023 has been running at its highest levels in 8 years, though it typically ebbs and flows to seasonal market trends.
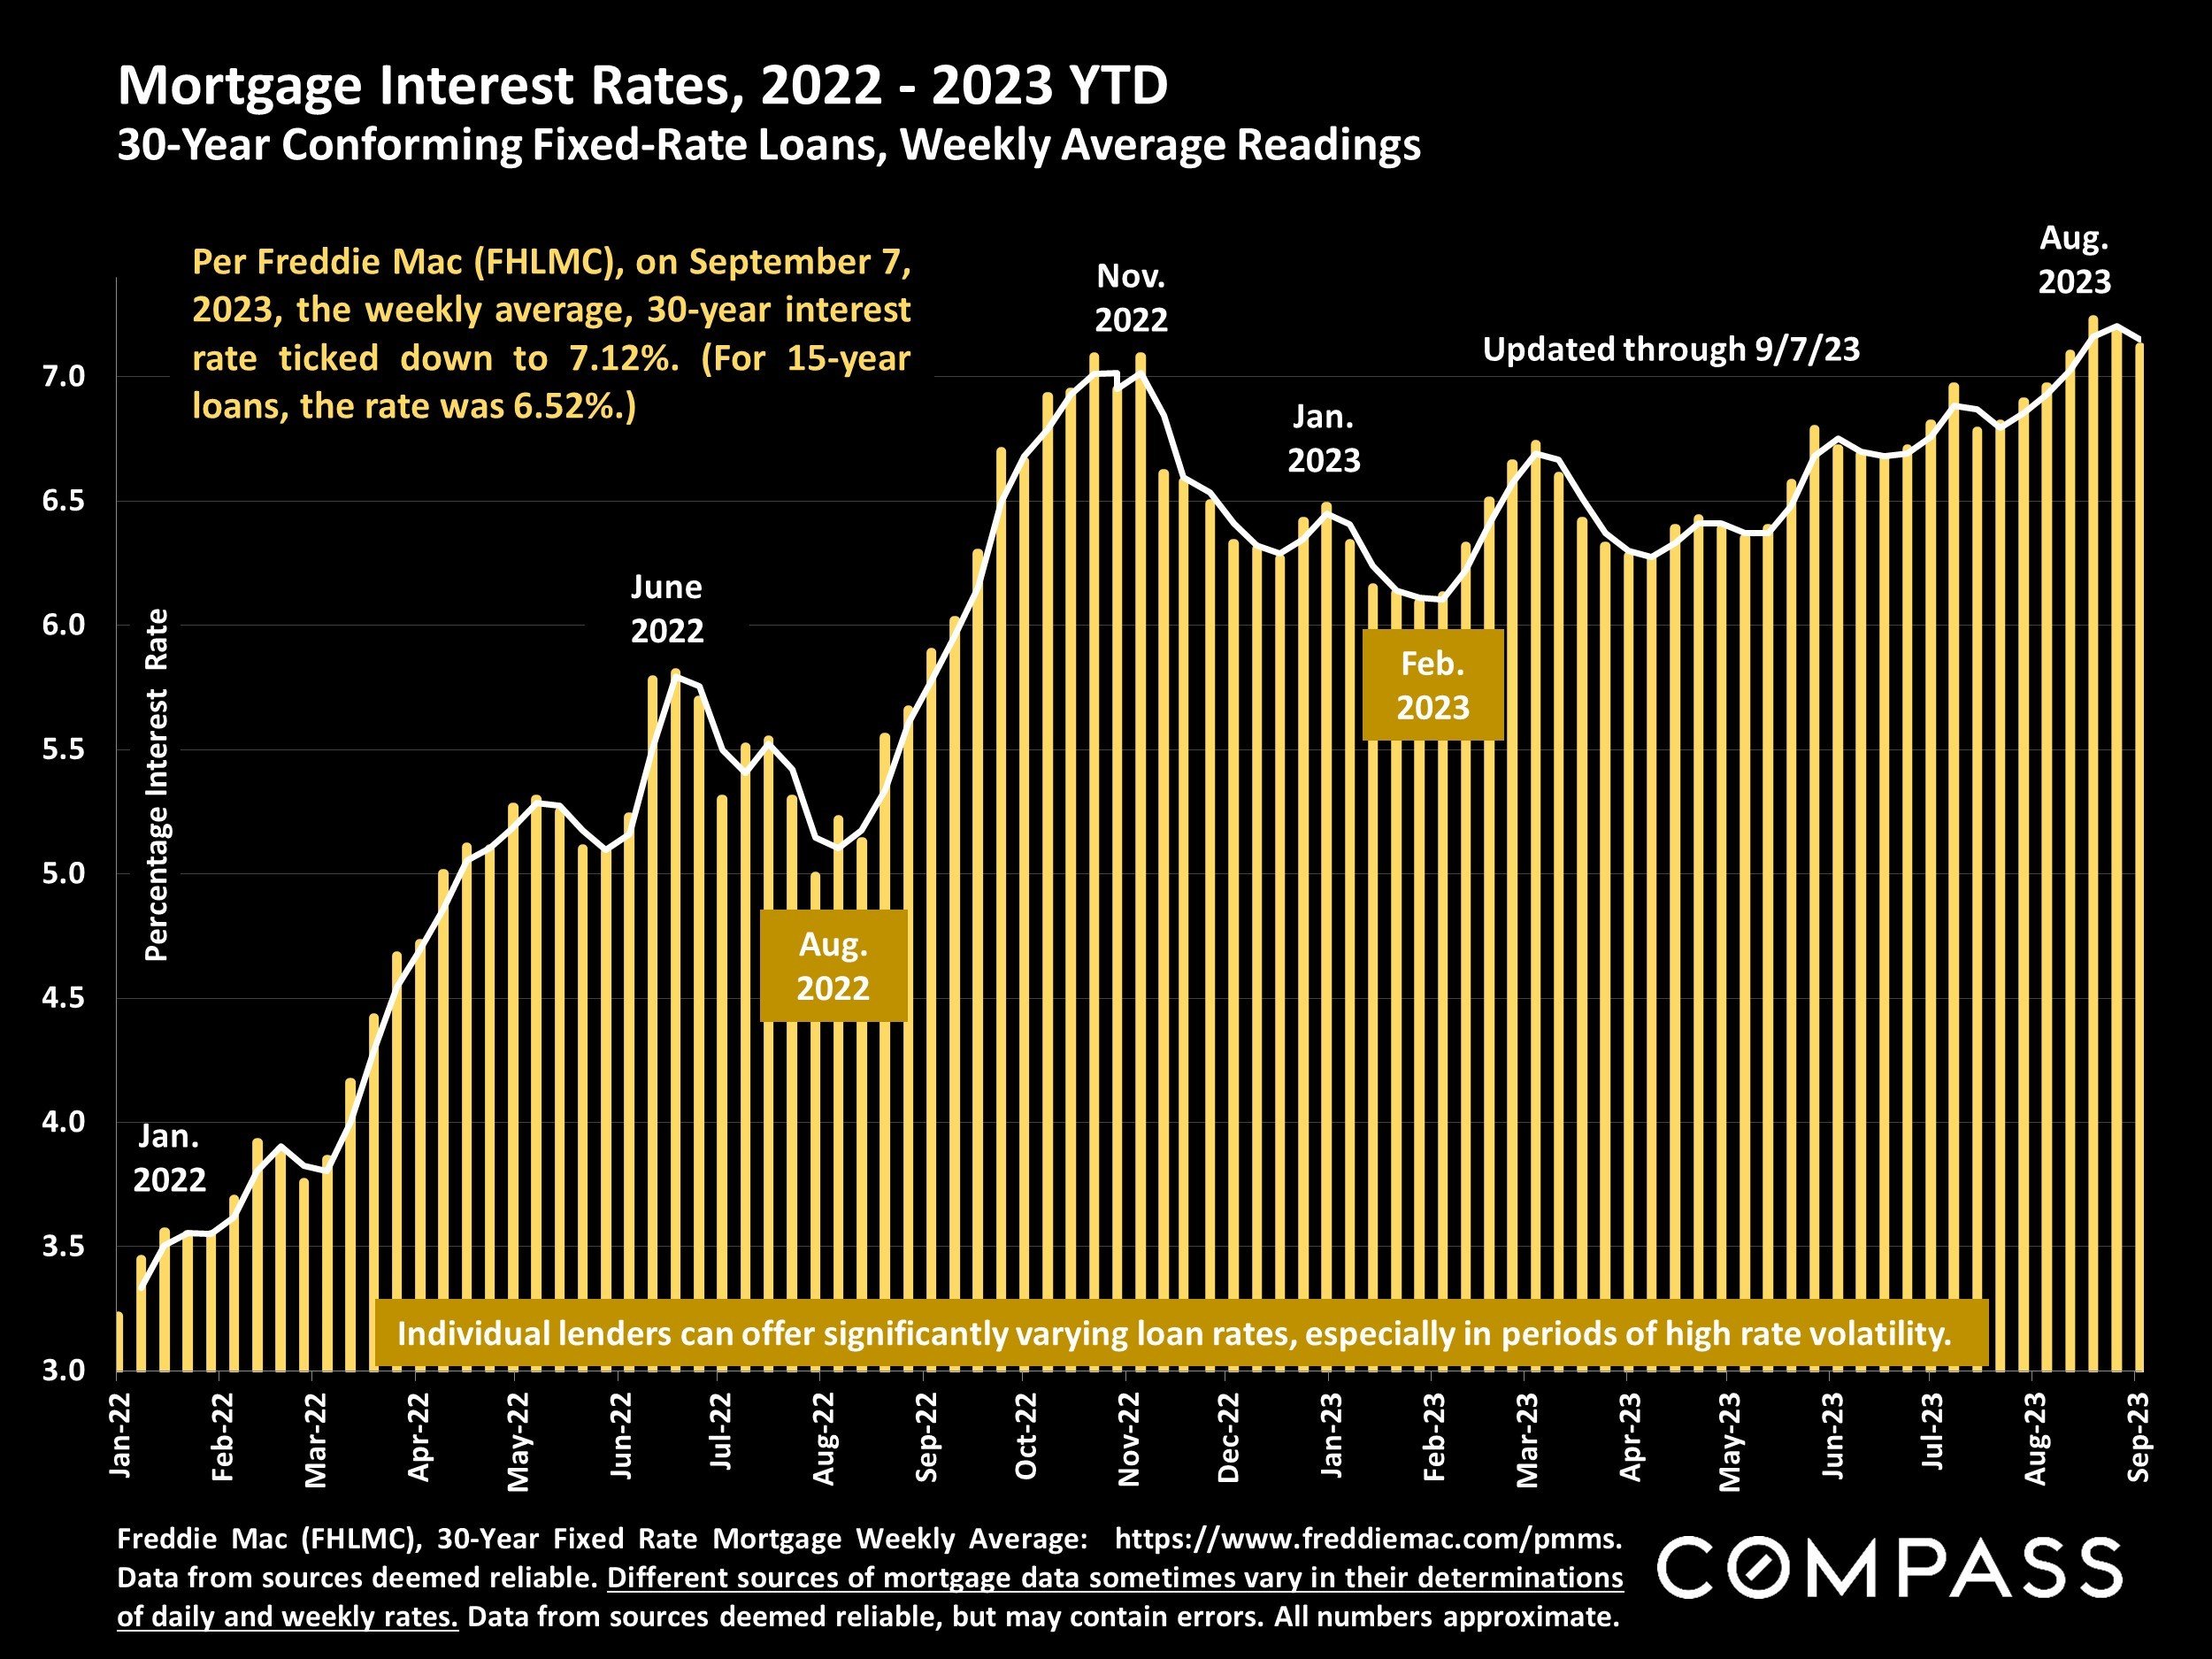
Mortgage Interest Rates, 2022 - 2023 YTD
30-Year Conforming Fixed-Rate Loans, Weekly Average Readings
Freddie Mac (FHLMC), 30-Year Fixed Rate Mortgage Weekly Average: https://www.freddiemac.com/pmms. Data from sources deemed rellable. Different sources of mortgage data sometimes vary in their determination of daily and weekly rates. Data from sources deemed reliable, but may contain errors. All numbers approximate.
Per Freddie Mac (FHLMC), on September 7, 2023, the weekly average, 30-year interest rate ticked down to 7.12%. (For 15-year loans, the rate was 6.52%.)
Statistics are generalities, essentially summaries of widely disparate data generated by dozens, hundreds or thousands of unique, individual sales occurring within different time periods. They are best seen not as precise measurements, but as broad, comparative indicators, with reasonable margins of error. Anomalous fluctuations in statistics are not uncommon, especially in smaller, expensive market segments. Last period data should be considered estimates that may change with late-reported data. Different analytics programs sometimes define statistics – such as “active listings,” “days on market,” and “months supply of inventory” – differently: what is most meaningful are not specific calculations but the trends they illustrate. Most listing and sales data derives from the local or regional multi-listing service (MLS) of the area specified in the analysis, but not all listings or sales are reported to MLS and these won’t be reflected in the data. “Homes” signifies real-property, single-household housing units: houses, condos, co-ops, townhouses, duets and TICs (but not mobile homes), as applicable to each market. City/town names refer specifically to the named cities and towns, unless otherwise delineated. Multi-county metro areas will be specified as such. Data from sources deemed reliable, but may contain errors and subject to revision. All numbers to be considered approximate.
Many aspects of value cannot be adequately reflected in median and average statistics: curb appeal, age, condition, amenities, views, lot size, quality of outdoor space, “bonus” rooms, additional parking, quality of location within the neighborhood, and so on. How any of these statistics apply to any particular home is unknown without a specific comparative market analysis.
Median Sales Price is that price at which half the properties sold for more and half for less. It may be affected by seasonality, “unusual” events, or changes in inventory and buying trends, as well as by changes in fair market value. The median sales price for an area will often conceal an enormous variety of sales prices in the underlying individual sales.
Dollar per Square Foot is based upon the home’s interior living space and does not include garages, unfinished attics and basements, rooms built without permit, patios, decks or yards (though all those can add value to a home). These figures are usually derived from appraisals or tax records, but are sometimes unreliable (especially for older homes) or unreported altogether. The calculation can only be made on those home sales that reported square footage.
Compass is a real estate broker licensed by the State of California, DRE 01527235. Equal Housing Opportunity. This report has been prepared solely for information purposes. The information herein is based on or derived from information generally available to the public and/or from sources believed to be reliable. No representation or warranty can be given with respect to the accuracy or completeness of the information. Compass disclaims any and all liability relating to this report, including without limitation any express or implied representations or warranties for statements contained in, and omissions from, the report. Nothing contained herein is intended to be or should be read as any regulatory, legal, tax, accounting or other advice and Compass does not provide such advice. All opinions are subject to change without notice. Compass makes no representation regarding the accuracy of any statements regarding any references to the laws, statutes or regulations of any state are those of the author(s). Past performance is no guarantee of future results.