September 2025 Market Report

Photo by Anthony Sebbo on Unsplash
Generally speaking, this summer’s market saw no large shifts in market dynamics beyond typical seasonal changes, and due to the AI boom, San Francisco remains one of the strongest markets in the Bay Area. The focus now is on the fall selling season, which runs from early September to early November before listing and sales activity begins to plunge for the mid-winter holidays. Early fall almost always begins with a huge surge in new listings, which then provides a substantial boost to sales activity, especially in higher-price segments. Probably the biggest wild card right now is what is going to happen to interest rates, but economic indicators present a surprisingly wide range of mixed messages.
As of the first week of September, mortgage rates, at slightly below 6.3%, are suddenly getting close to the 6% range many analysts believe is required to significantly boost buyer demand. But interest rates have been extremely volatile in recent years, with big, sudden changes in direction common – as occurred last year in late summer/early autumn. The AI boom continues to gain traction in San Francisco, and stock markets have hit new all-time highs in the past month, a big positive for affluent real estate markets like SF. The last inflation reading was unchanged at 2.7%, but the more recent Producer Price Index saw its largest monthly increase in over 3 years. Consumer confidence readings remain low; measures of economic uncertainty and political volatility – both national and international – remain high; and the latest jobs report was generally considered relatively dismal. Consensus opinion is predicting the Fed will drop its benchmark rate this month – for the first time in 2025 – but much depends on inflation reports due in coming weeks.
Besides the usual review of standard measurements of supply and demand, this report also contains detailed information regarding San Francisco’s neighborhood markets.
Report created in good faith using data from sources deemed reliable but may contain errors and subject to revision. Last period figures are preliminary estimates based on data available early in the following month. All numbers approximate, and may change with late-reported activity.
Mortgage Interest Rates in 2023-2025 YTD
30-Year Conforming Fixed-Rate Loans, Weekly Average Readings*

*Freddie Mac (FHLMC), 30-Year Fixed Rate Mortgage Weekly Average: https://www.freddiemac.com/pmms. Data from sources deemed reliable. Different sources of mortgage data sometimes vary in their determinations of daily and weekly rates. Data from sources deemed reliable but may contain errors. All numbers approximate.
Per Freddie Mac (FHLMC), on September 4, 2025, the weekly average, 30-year, conforming-loan interest rate continued to decline to 6.5%, its lowest reading since October 2024.
Per Mortgage News Daily, the daily average rate (not illustrated here) dropped to 6.28% on September 8th. Many analysts believe interest rates around 6% will significantly boost buyer demand.
Financial Markets, 2024 – 2025 YTD
Percentage Increases in S&P 500 & Nasdaq since 1/2/24

Data per MarketWatch.com. Data from source deemed reliable but may contain errors and subject to revision. Financial market values change constantly and all numbers to be considered approximate. Financial markets have been prone to significant volatility.
Large changes in stock markets can dramatically affect household wealth, consumer confidence and housing markets, especially more affluent markets.
Economic Policy Uncertainty Index*
By Month since January 2000
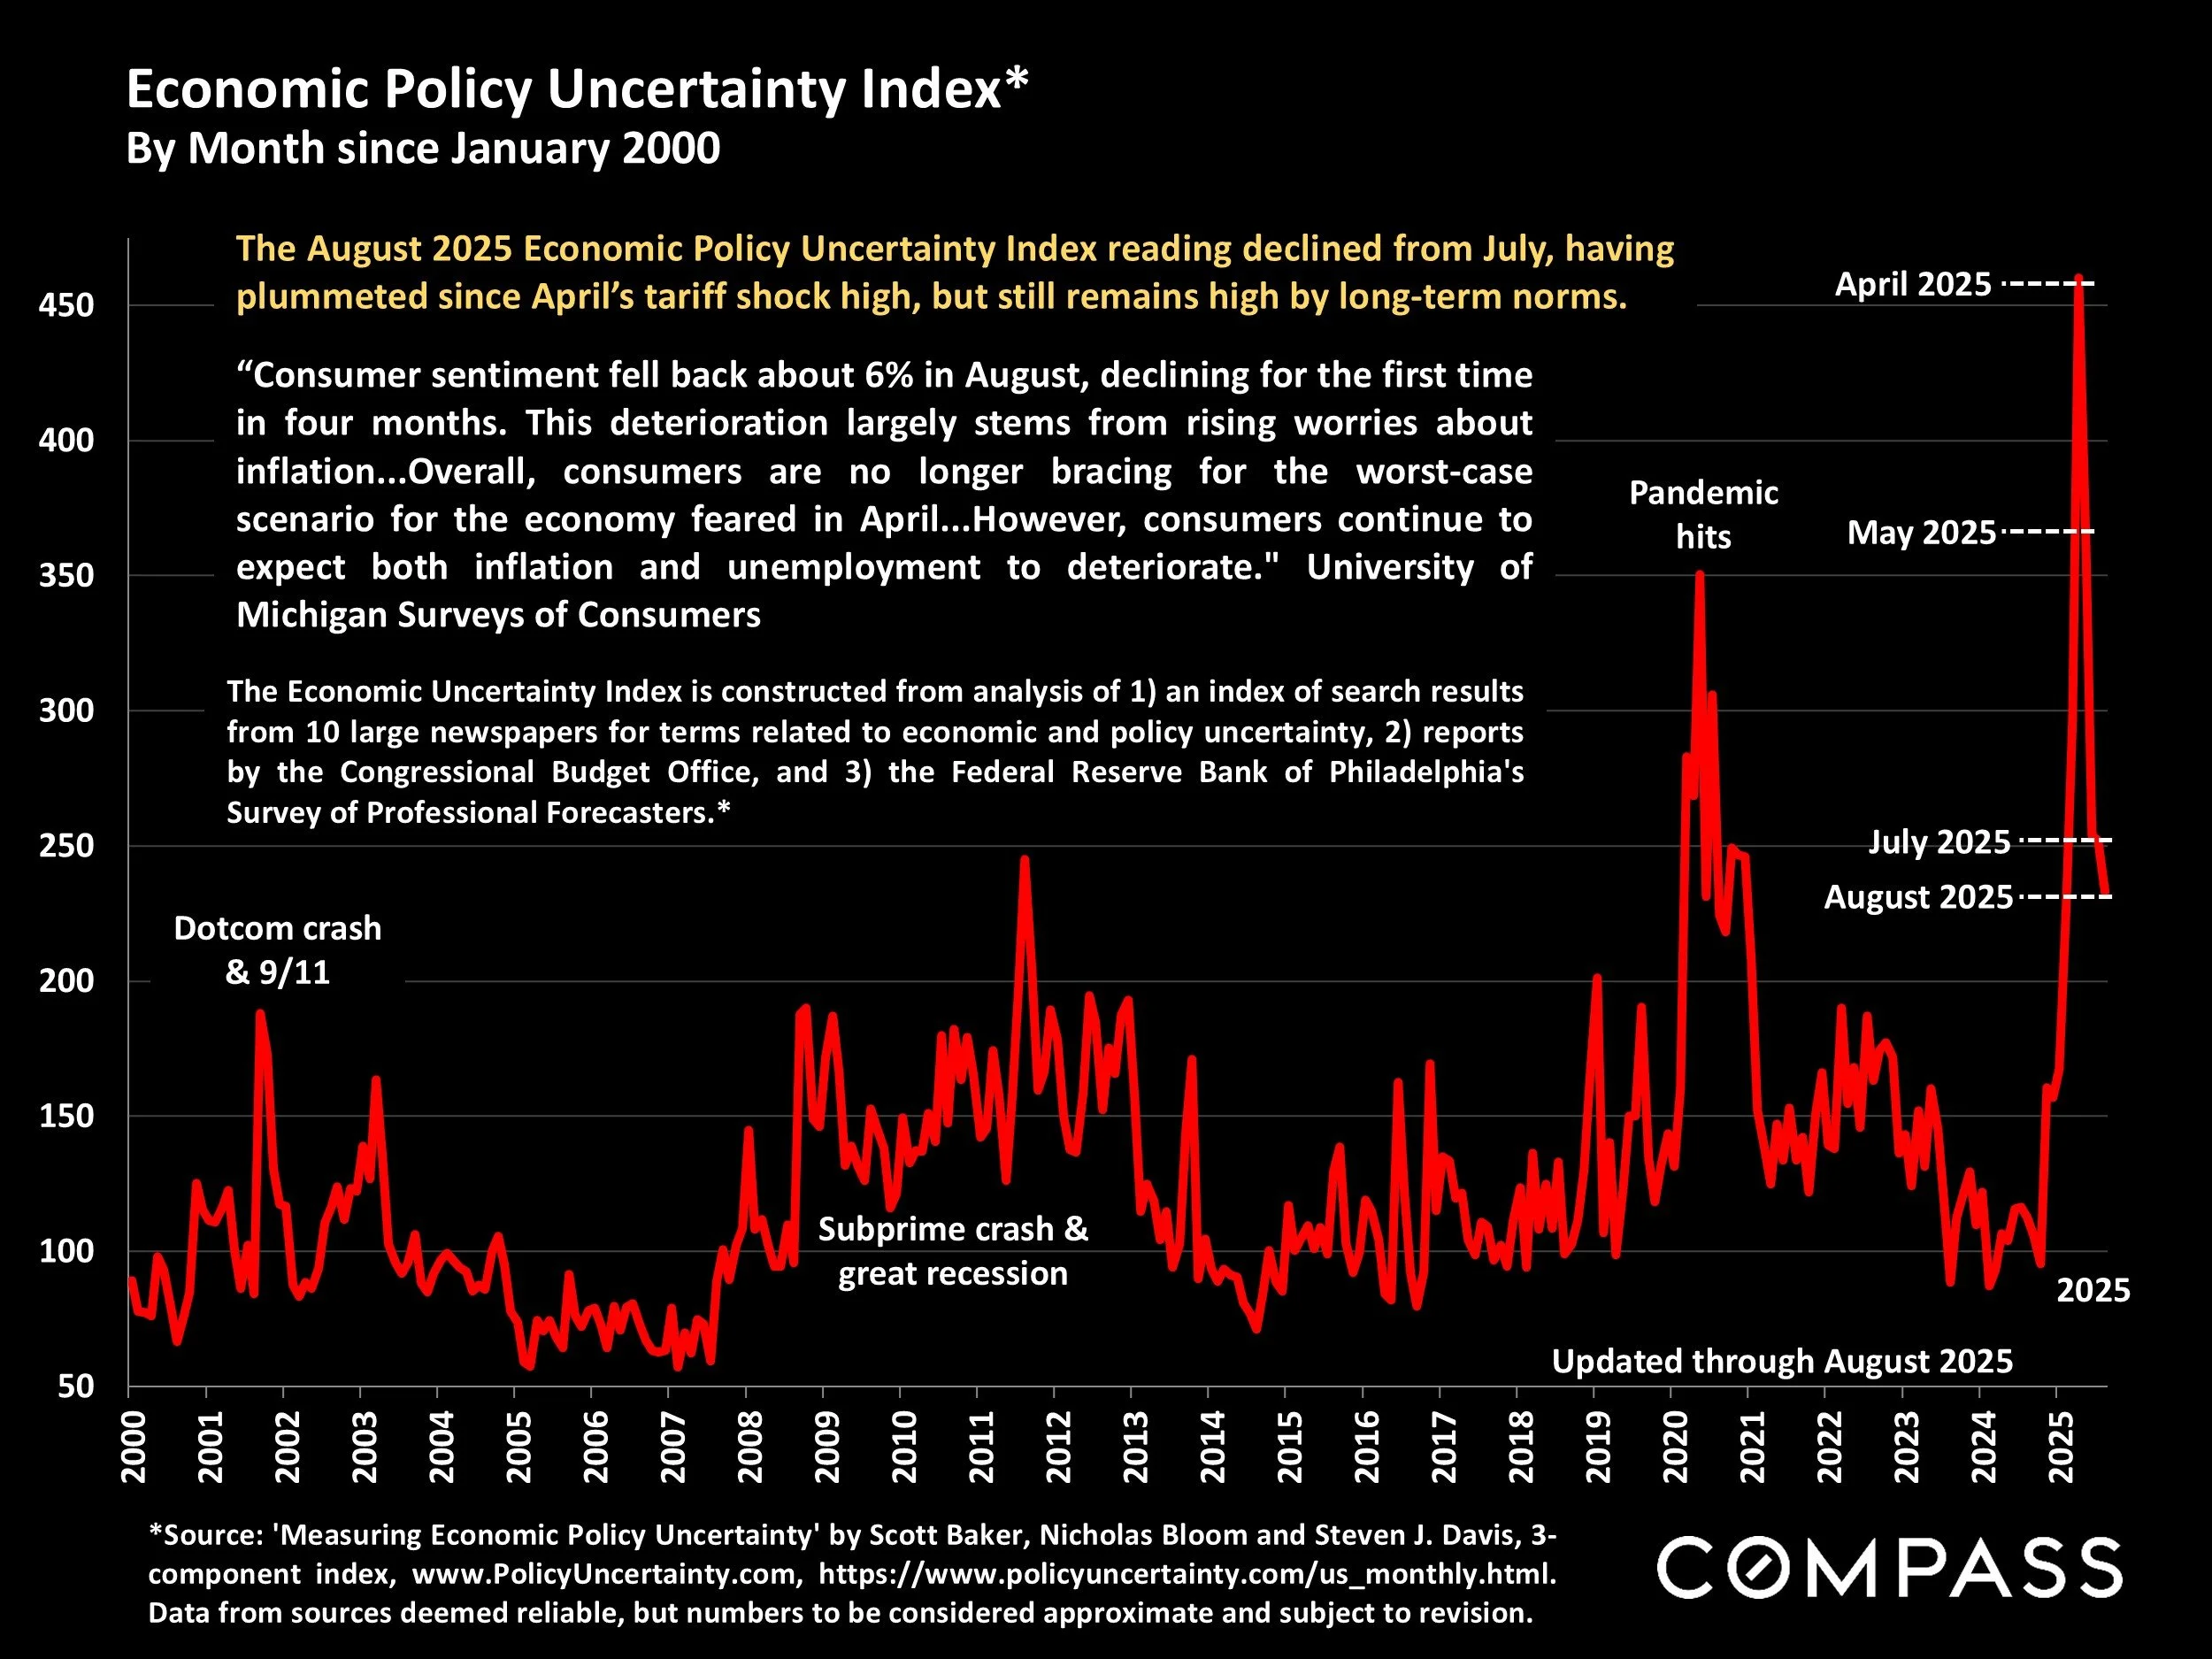
*Source: 'Measuring Economic Policy Uncertainty' by Scott Baker, Nicholas Bloom and Steven J. Davis, 3-component index, www.PolicyUncertainty.com, https://www.policyuncertainty.com/us_monthly.html. Data from sources deemed reliable, but numbers to be considered approximate and subject to revision.
The August 2025 Economic Policy Uncertainty Index reading declined from July, having plummeted since April’s tariff shock high, but still remains high by long-term norms.
“Consumer sentiment fell back about 6% in August, declining for the first time in four months. This deterioration largely stems from rising worries about inflation...Overall, consumers are no longer bracing for the worst-case scenario for the economy feared in April...However, consumers continue to expect both inflation and unemployment to deteriorate." — University of Michigan Surveys of Consumers
The Economic Uncertainty Index is constructed from analysis of 1) an index of search results from 10 large newspapers for terms related to economic and policy uncertainty, 2) reports by the Congressional Budget Office, and 3) the Federal Reserve Bank of Philadelphia's Survey of Professional Forecasters.*
After the pandemic hit but before the AI boom gained momentum in the city, one of the biggest factors in the weakening of the San Francisco market – and especially its downtown condo market – was the emptying out of its office buildings, the decline in high-tech employment, and the subsequent decline in population. That situation began to turn around in 2025. In residential real estate, the first and biggest change has been in the increase in apartment rents, up about 11% in the past year.
“Artificial-intelligence firms are leading a revival of the San Francisco office market…The amount of office space being leased has rebounded strongly this year and is back to pre-pandemic levels...[One global real estate analyst] said conditions resemble those in 2012 when the country was still recovering from the global financial crisis…[and that] the city is well-positioned to boom once again as AI expands to touch virtually every aspect of daily life.”
Wall Street Journal, “A 1125-Foot Sign of Life for San Francisco’s Office Comeback,” 9/2/25
San Francisco HOUSE Price Trends since 1990
Monthly Median House Sales Prices, 3-Month Rolling

3-month rolling average of monthly median sales prices for “existing” houses, per CA Association of Realtors or 3-month rolling median per NorCal MLS Alliance. Analysis may contain errors and subject to revision. All numbers approximate, and may change with late-reported sales.
The 3-month-rolling median house sales price in August 2025 has continued to decline from the typical spring peak, but was up about 3% year-over-year.
Median sales price is that price at which half the sales occurred for more and half for less. It is a very general statistic, disguising an enormous range of sales prices in the underlying sales. It is often affected by other factors besides changes in fair market value. Monthly and seasonal fluctuations are common, which explain many of the regular ups and downs in this chart. More often than not, median sales prices peak for the year in spring.
San Francisco CONDO Price Trends since 2005
Median Condo Sales Price, 3-Month Rolling
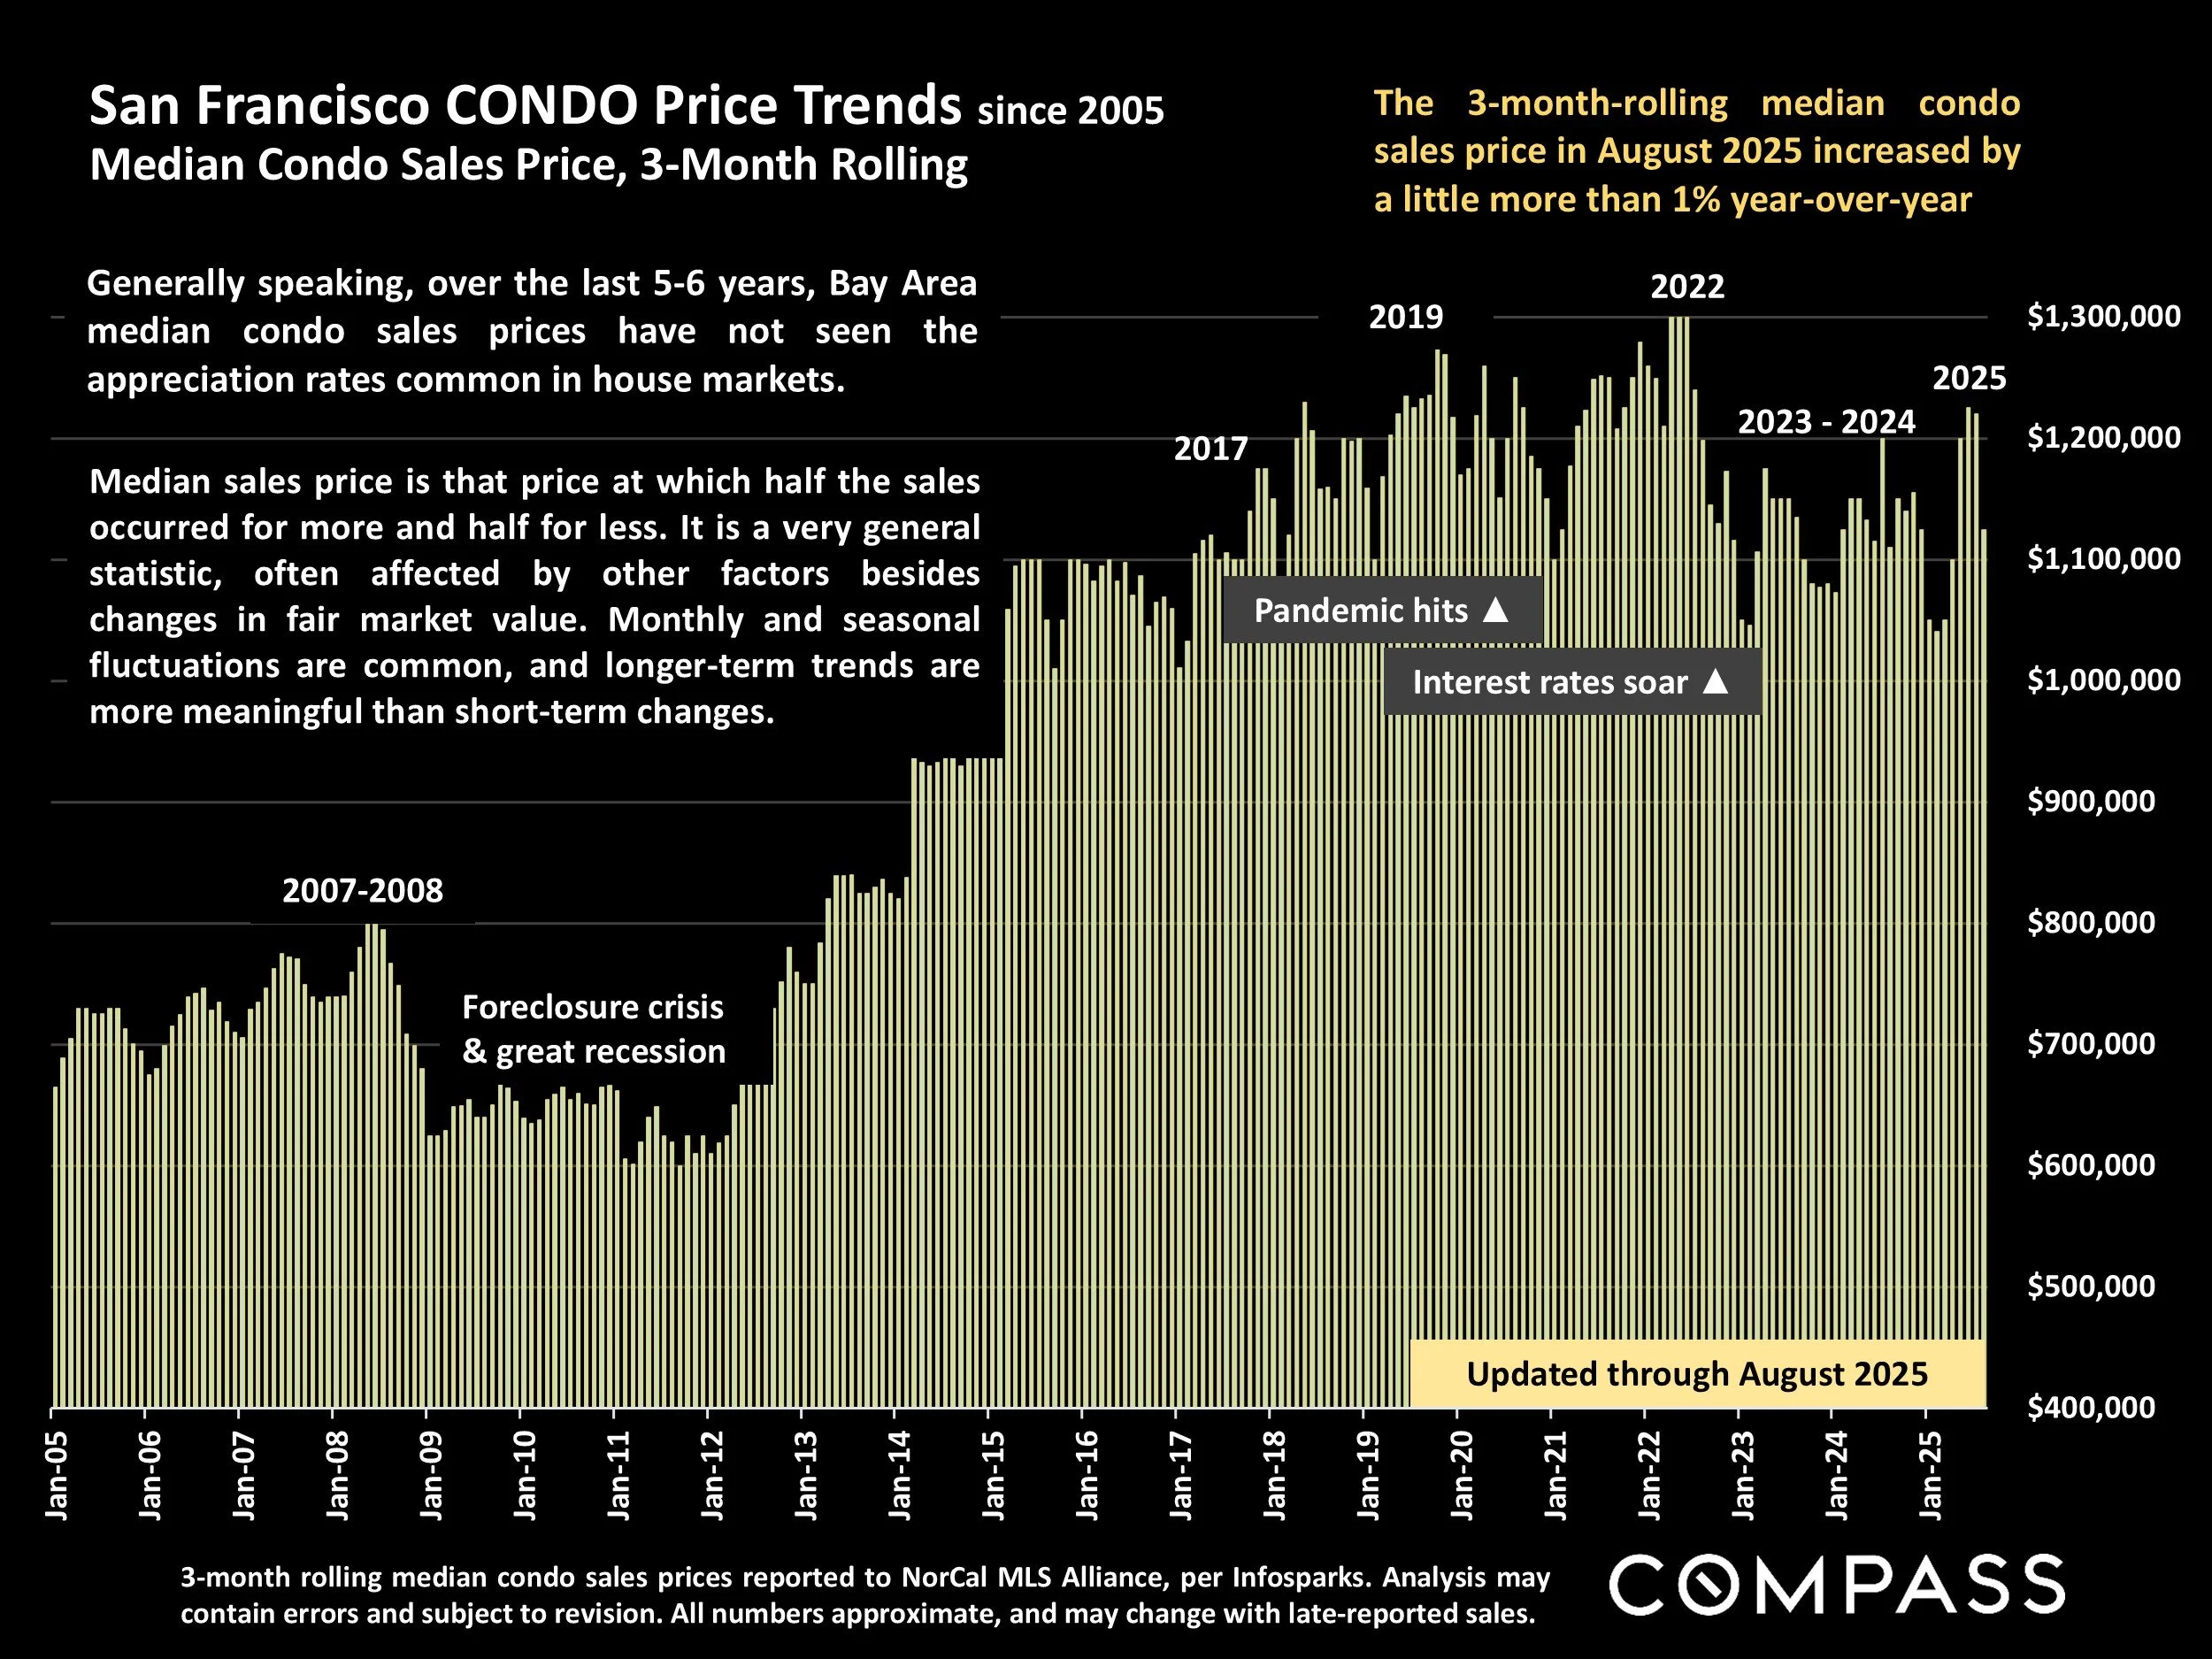
3-month rolling median condo sales prices reported to NorCal MLS Alliance, per Infosparks. Analysis may contain errors and subject to revision. All numbers approximate, and may change with late-reported sales.
The 3-month-rolling median condo sales price in August 2025 increased by a little more than 1% year-over-year
Generally speaking, over the last 5-6 years, Bay Area median condo sales prices have not seen the appreciation rates common in house markets.
Median sales price is that price at which half the sales occurred for more and half for less. It is a very general statistic, often affected by other factors besides changes in fair market value. Monthly and seasonal fluctuations are common, and longer-term trends are more meaningful than short-term changes.
San Francisco Value Trends since 2005
3-Month-Rolling, Median Dollar per Square Foot Values*
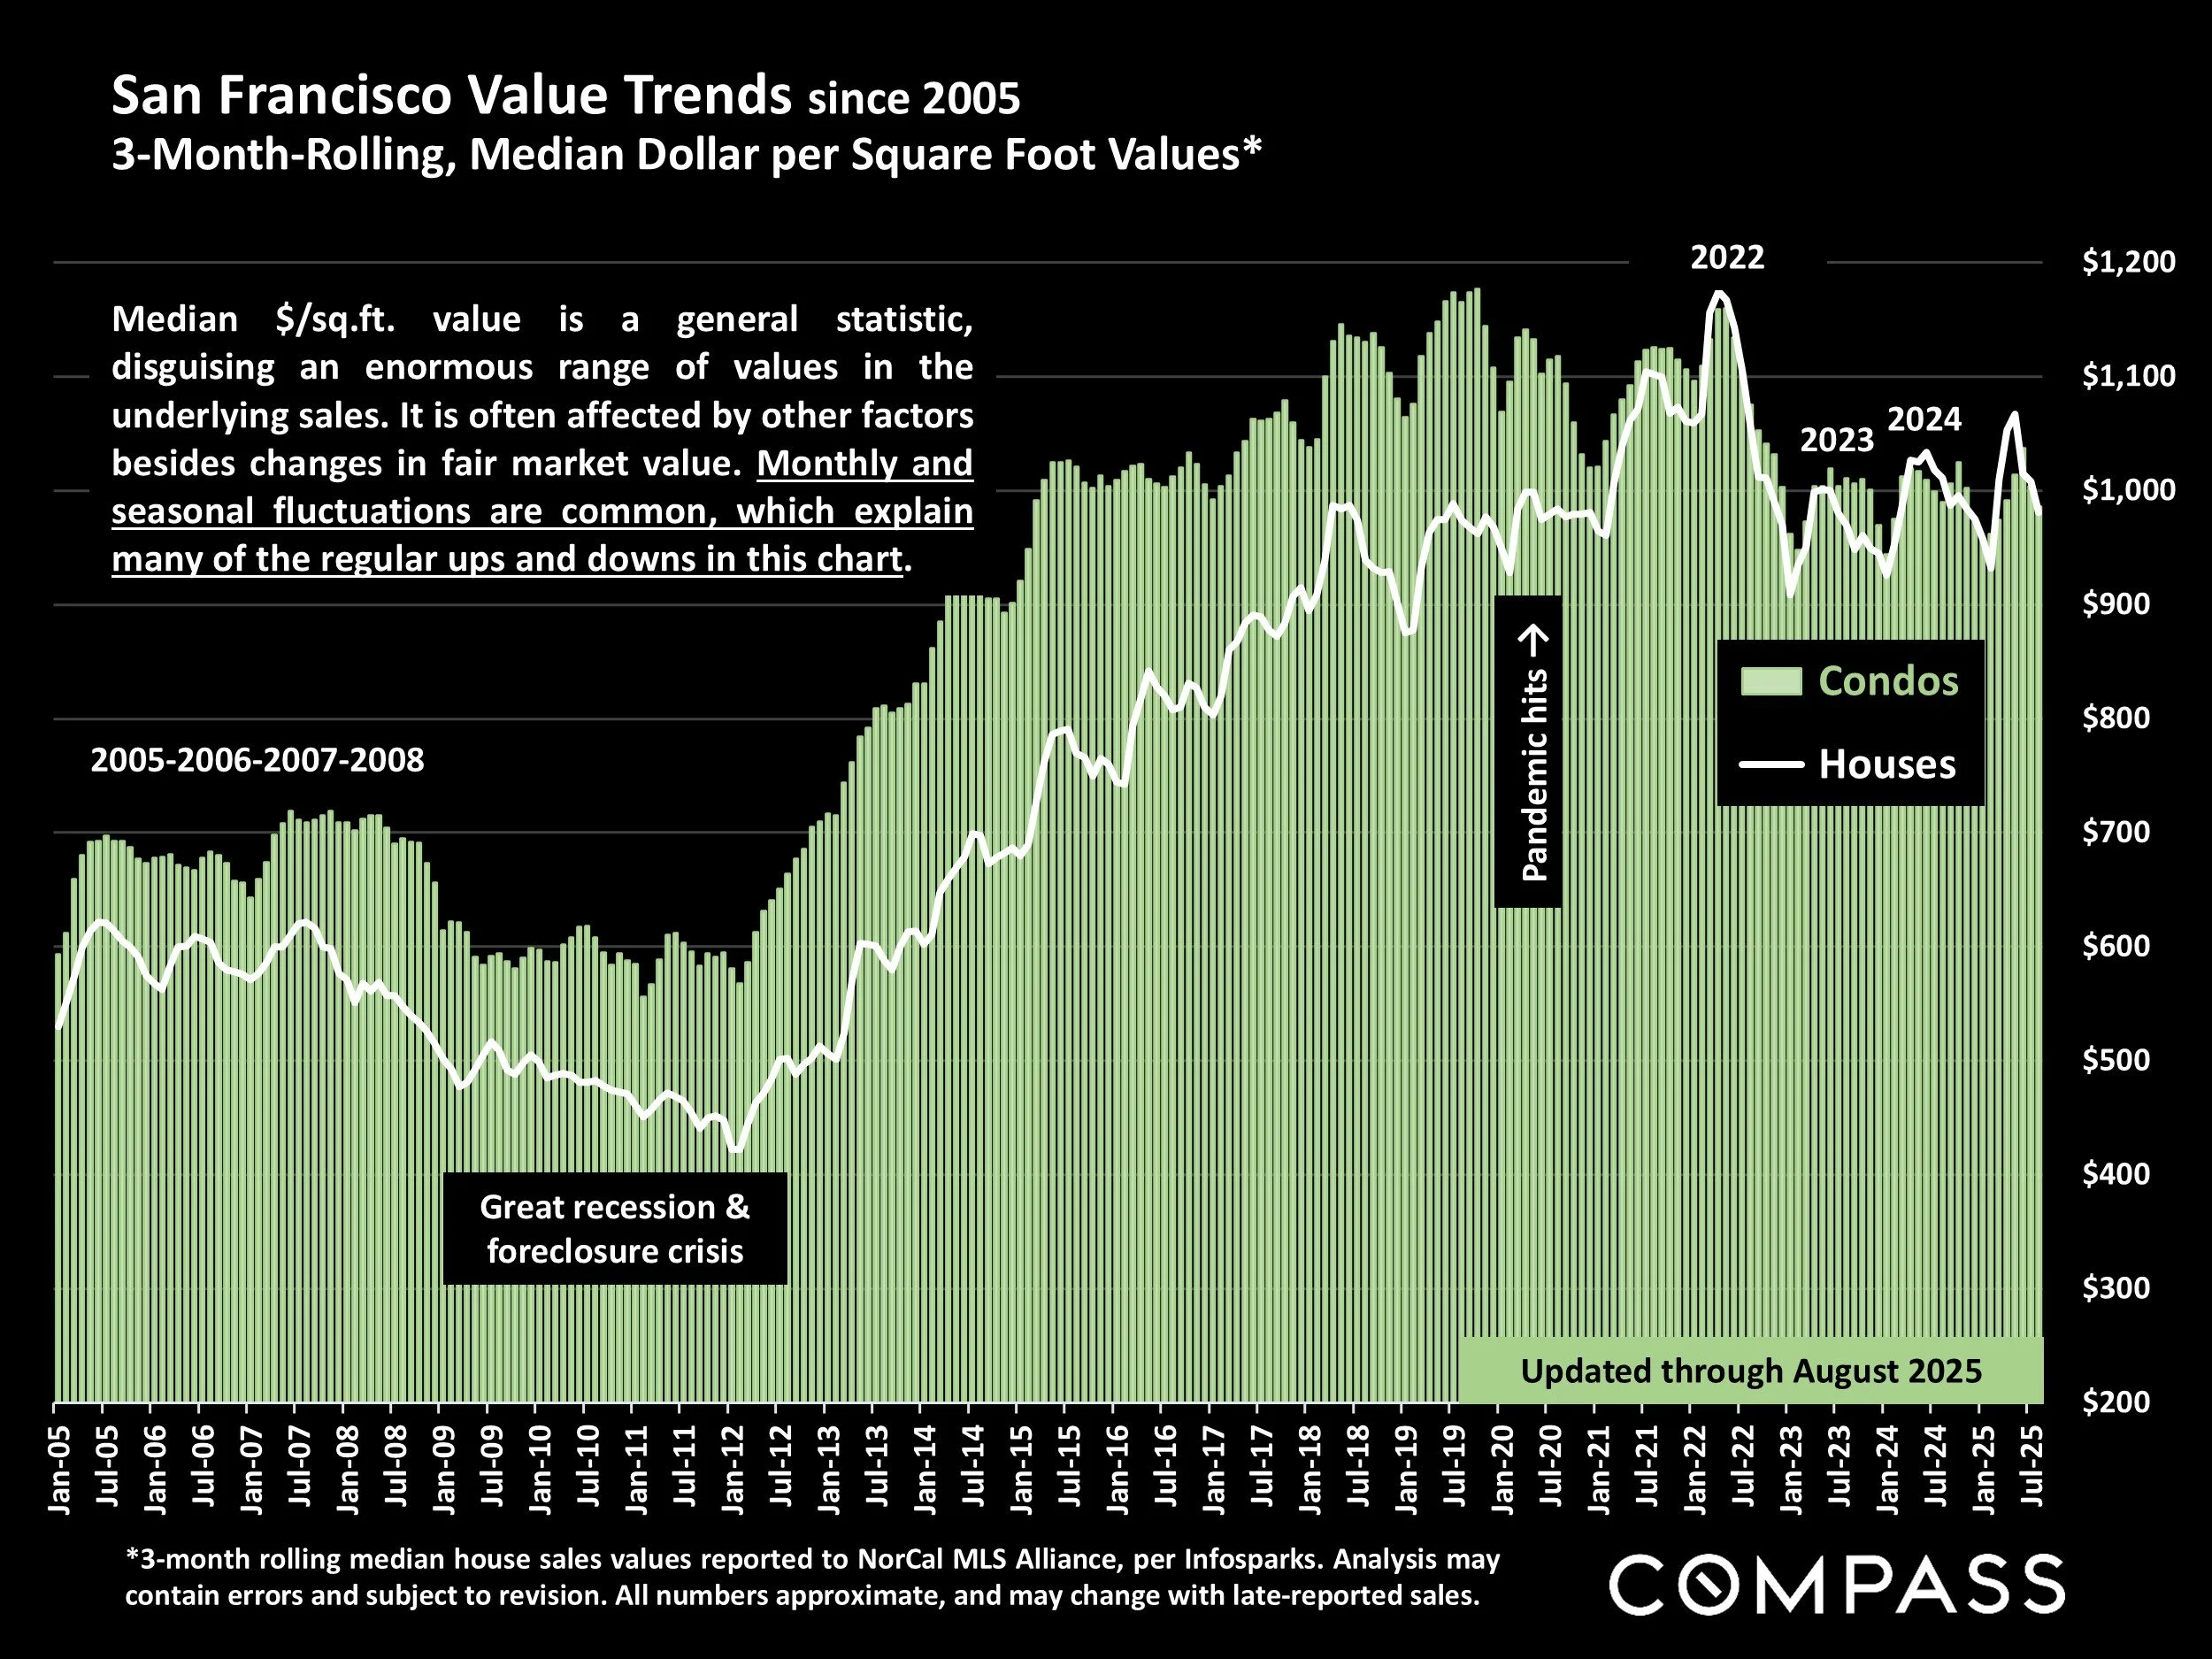
*3-month rolling median house sales values reported to NorCal MLS Alliance, per Infosparks. Analysis may contain errors and subject to revision. All numbers approximate, and may change with late-reported sales.
Median $/sq.ft. value is a general statistic, disguising an enormous range of values in the underlying sales. It is often affected by other factors besides changes in fair market value. Monthly and seasonal fluctuations are common, which explain many of the regular ups and downs in this chart.
San Francisco CONDO Prices: Downtown vs. Non-Downtown
12-Month-Rolling, Median 2-Bedroom Condo Sales Prices since 2005*
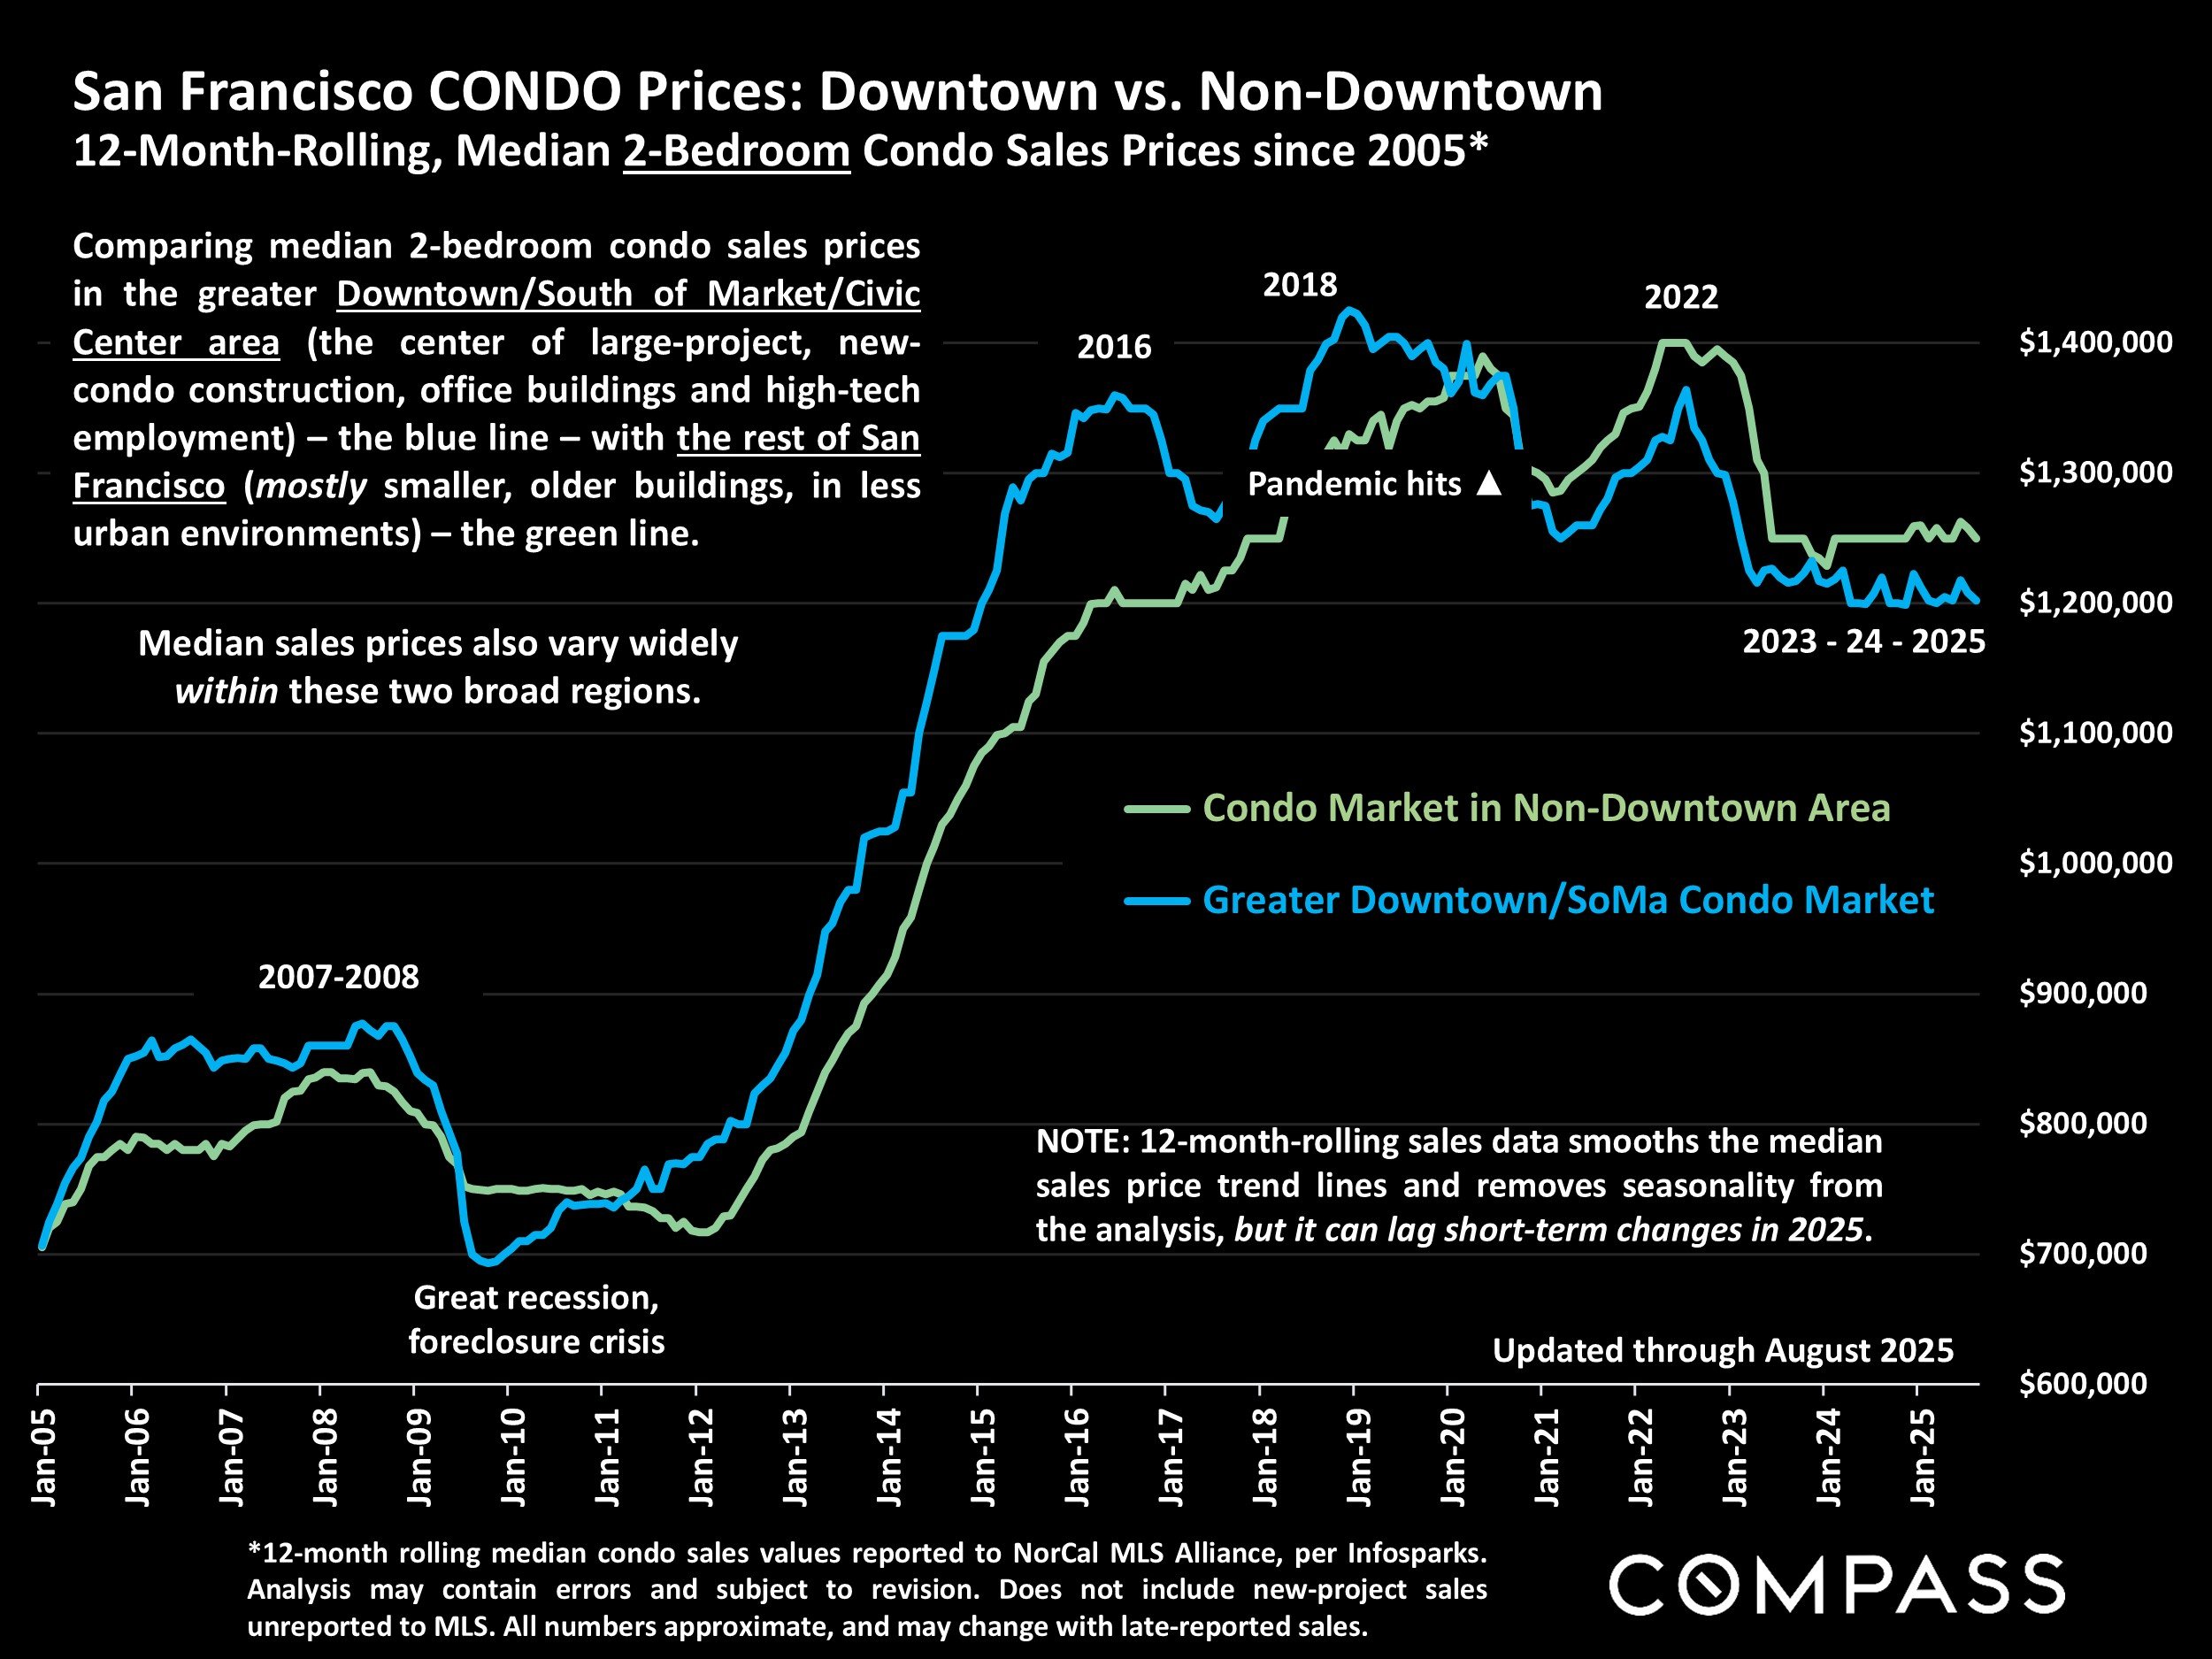
*12-month rolling median condo sales values reported to NorCal MLS Alliance, per Infosparks. Analysis may contain errors and subject to revision. Does not include new-project sales unreported to MLS. All numbers approximate, and may change with late-reported sales.
Comparing median 2-bedroom condo sales prices in the greater Downtown/South of Market/Civic Center area (the center of large-project, new-condo construction, office buildings and high-tech employment) – the blue line – with the rest of San Francisco (mostly smaller, older buildings, in less urban environments) – the green line.
NOTE: 12-month-rolling sales data smooths the median sales price trend lines and removes seasonality from the analysis, but it can lag short-term changes in 2025.
San Francisco House Prices
Median HOUSE Sales Prices – Selected Neighborhoods*

*12 months sales reported to NorCal MLS Alliance through mid-August 2025. Data from sources deemed reliable, but may contain errors and subject to revision. All numbers approximate and may change with late-reported sales.
This is a sampling of values across some of San Francisco’s 70+ neighborhoods, w/ high sales prices of $5 million+*
Median sales price is that price at which half the sales occurred for more and half for less. It is a very general measurement of value that disguises a wide range of prices in the underlying sales, and how it applies to any particular home is unknown without a specific comparative market analysis.
Many factors affect home values: architectural style, quality of construction, square footage, condition, amenities, light, views, privacy, outdoor space, “bonus” rooms, additional parking, quality of location within the neighborhood, and so on.
San Francisco Condo Prices
Median CONDO Sales Prices – Selected Neighborhoods*

*12 months condo sales reported to NorCal MLS Alliance through mid-August 2025. Data from sources deemed reliable, but may contain errors and subject to revision. All numbers approximate and may change with late-reported sales. A few other neighborhoods not listed also had sales of $3 million+.
This is a sampling of values across some of San Francisco’s 70+ neighborhoods. With high sales of $3 million+*
Median sales price is that price at which half the sales occurred for more and half for less. Many factors affect condo prices: square footage, architectural style, views, quality of construction, the floor the unit is on, condition, HOA amenities and cost, deeded outdoor space, parking, and so on.
New Listings Coming on Market
San Francisco Market Dynamics & Seasonality*
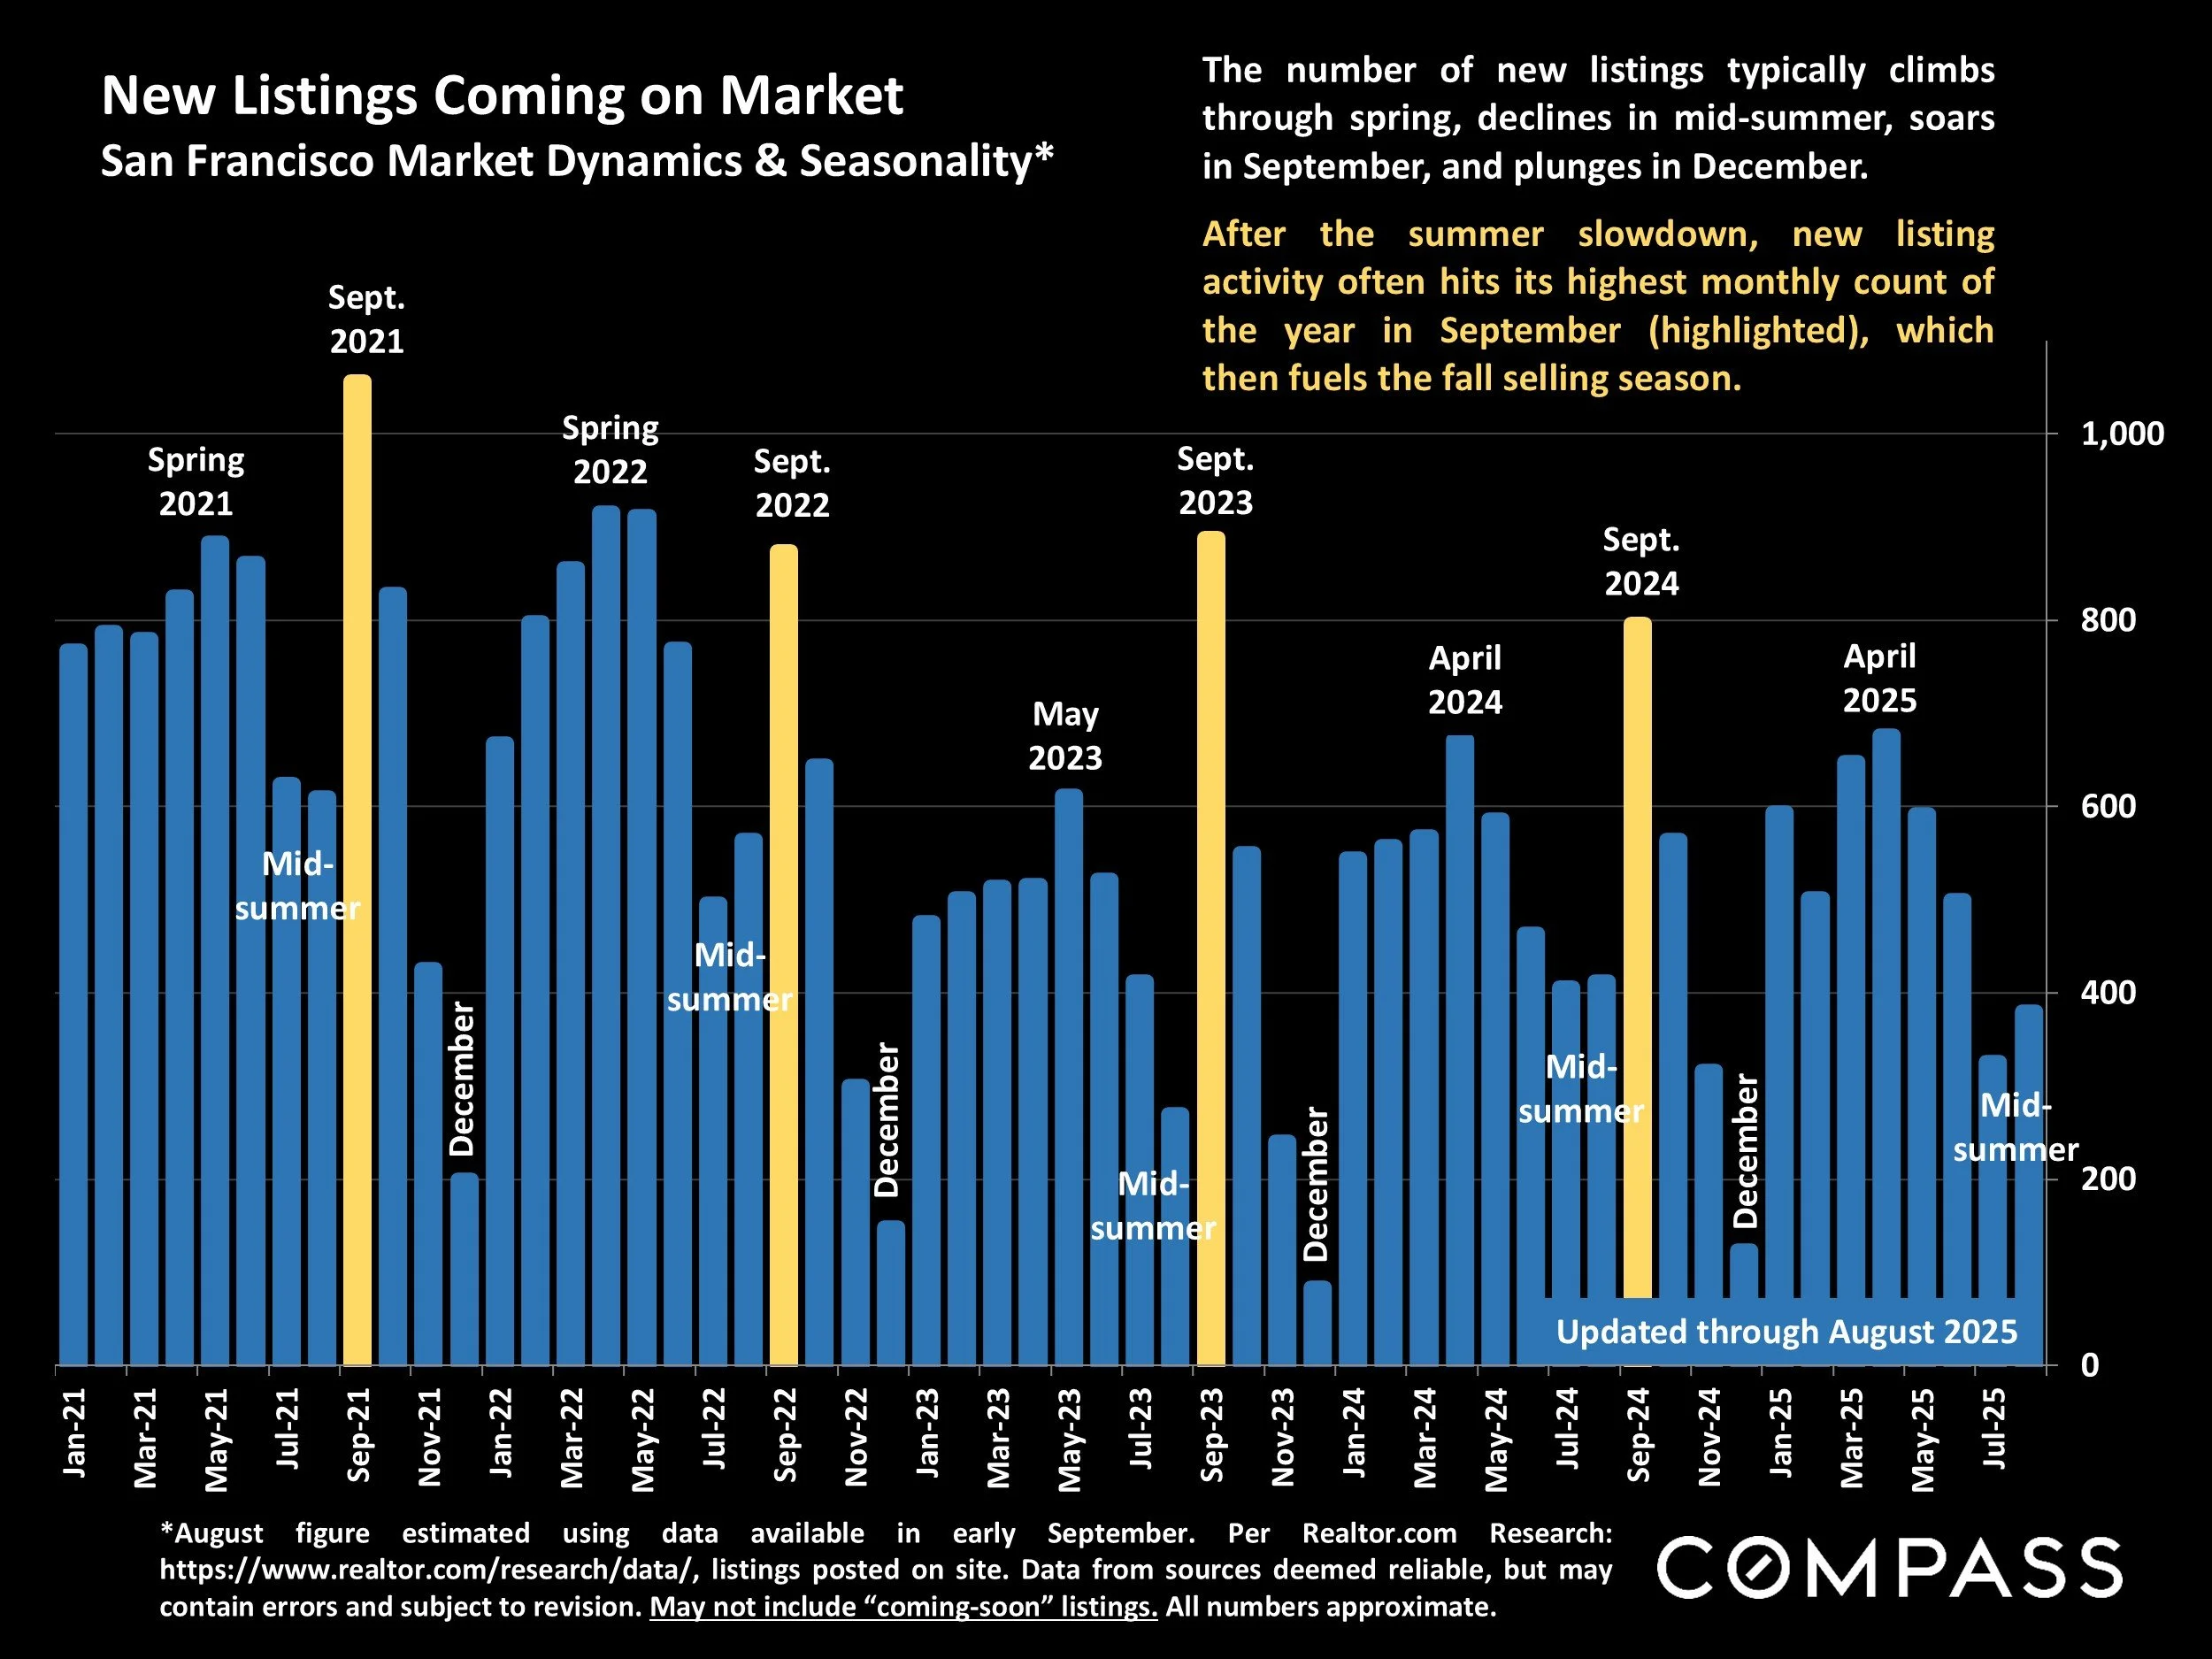
*August figure estimated using data available in early September. Per Realtor.com Research: https://www.realtor.com/research/data/, listings posted on site. Data from sources deemed reliable, but may contain errors and subject to revision. May not include “coming-soon” listings. All numbers approximate.
The number of new listings typically climbs through spring, declines in mid-summer, soars in September, and plunges in December. After the summer slowdown, new listing activity often hits its highest monthly count of the year in September (highlighted), which then fuels the fall selling season.
Pending Ratio
San Francisco Market Dynamics & Seasonality*

*August figure estimated using data available in early September. Per Realtor.com Research: https://www.realtor.com/research/data/, listings posted on site. Data from sources deemed reliable, but may contain errors and subject to revision. All numbers approximate.
The pending ratio for the SF house market runs much higher than for the condo market.
San Francisco Homes Market
Active & Coming-Soon Listings on 1st of Month*

* Houses, condos, co-ops, TICs, townhouses: Active/Coming-Soon listings posted to NorCal MLS Alliance. Does not include new-project condos not listed on MLS. Data from sources deemed reliable, but may contain errors and subject to revision. All numbers approximate. The # of active listings changes constantly.
The number of listings for sale on 9/1/25 continued to fall from the previous month, and also declined year over year. 29% of listings were houses, 61% condos, 6.5% TICs, and 3.5% co-ops. Listing inventory should rebound strongly in September.*
The # of active listings on a given day is affected by 1) the # of new listings coming on market,how quickly buyers put them into contract, 3) the sustained heat of the market over time, and 4) sellers pulling their homes off the market without selling.
Homes for Sale in San Francisco
# of Listings by Price Segment, Early September 2025*
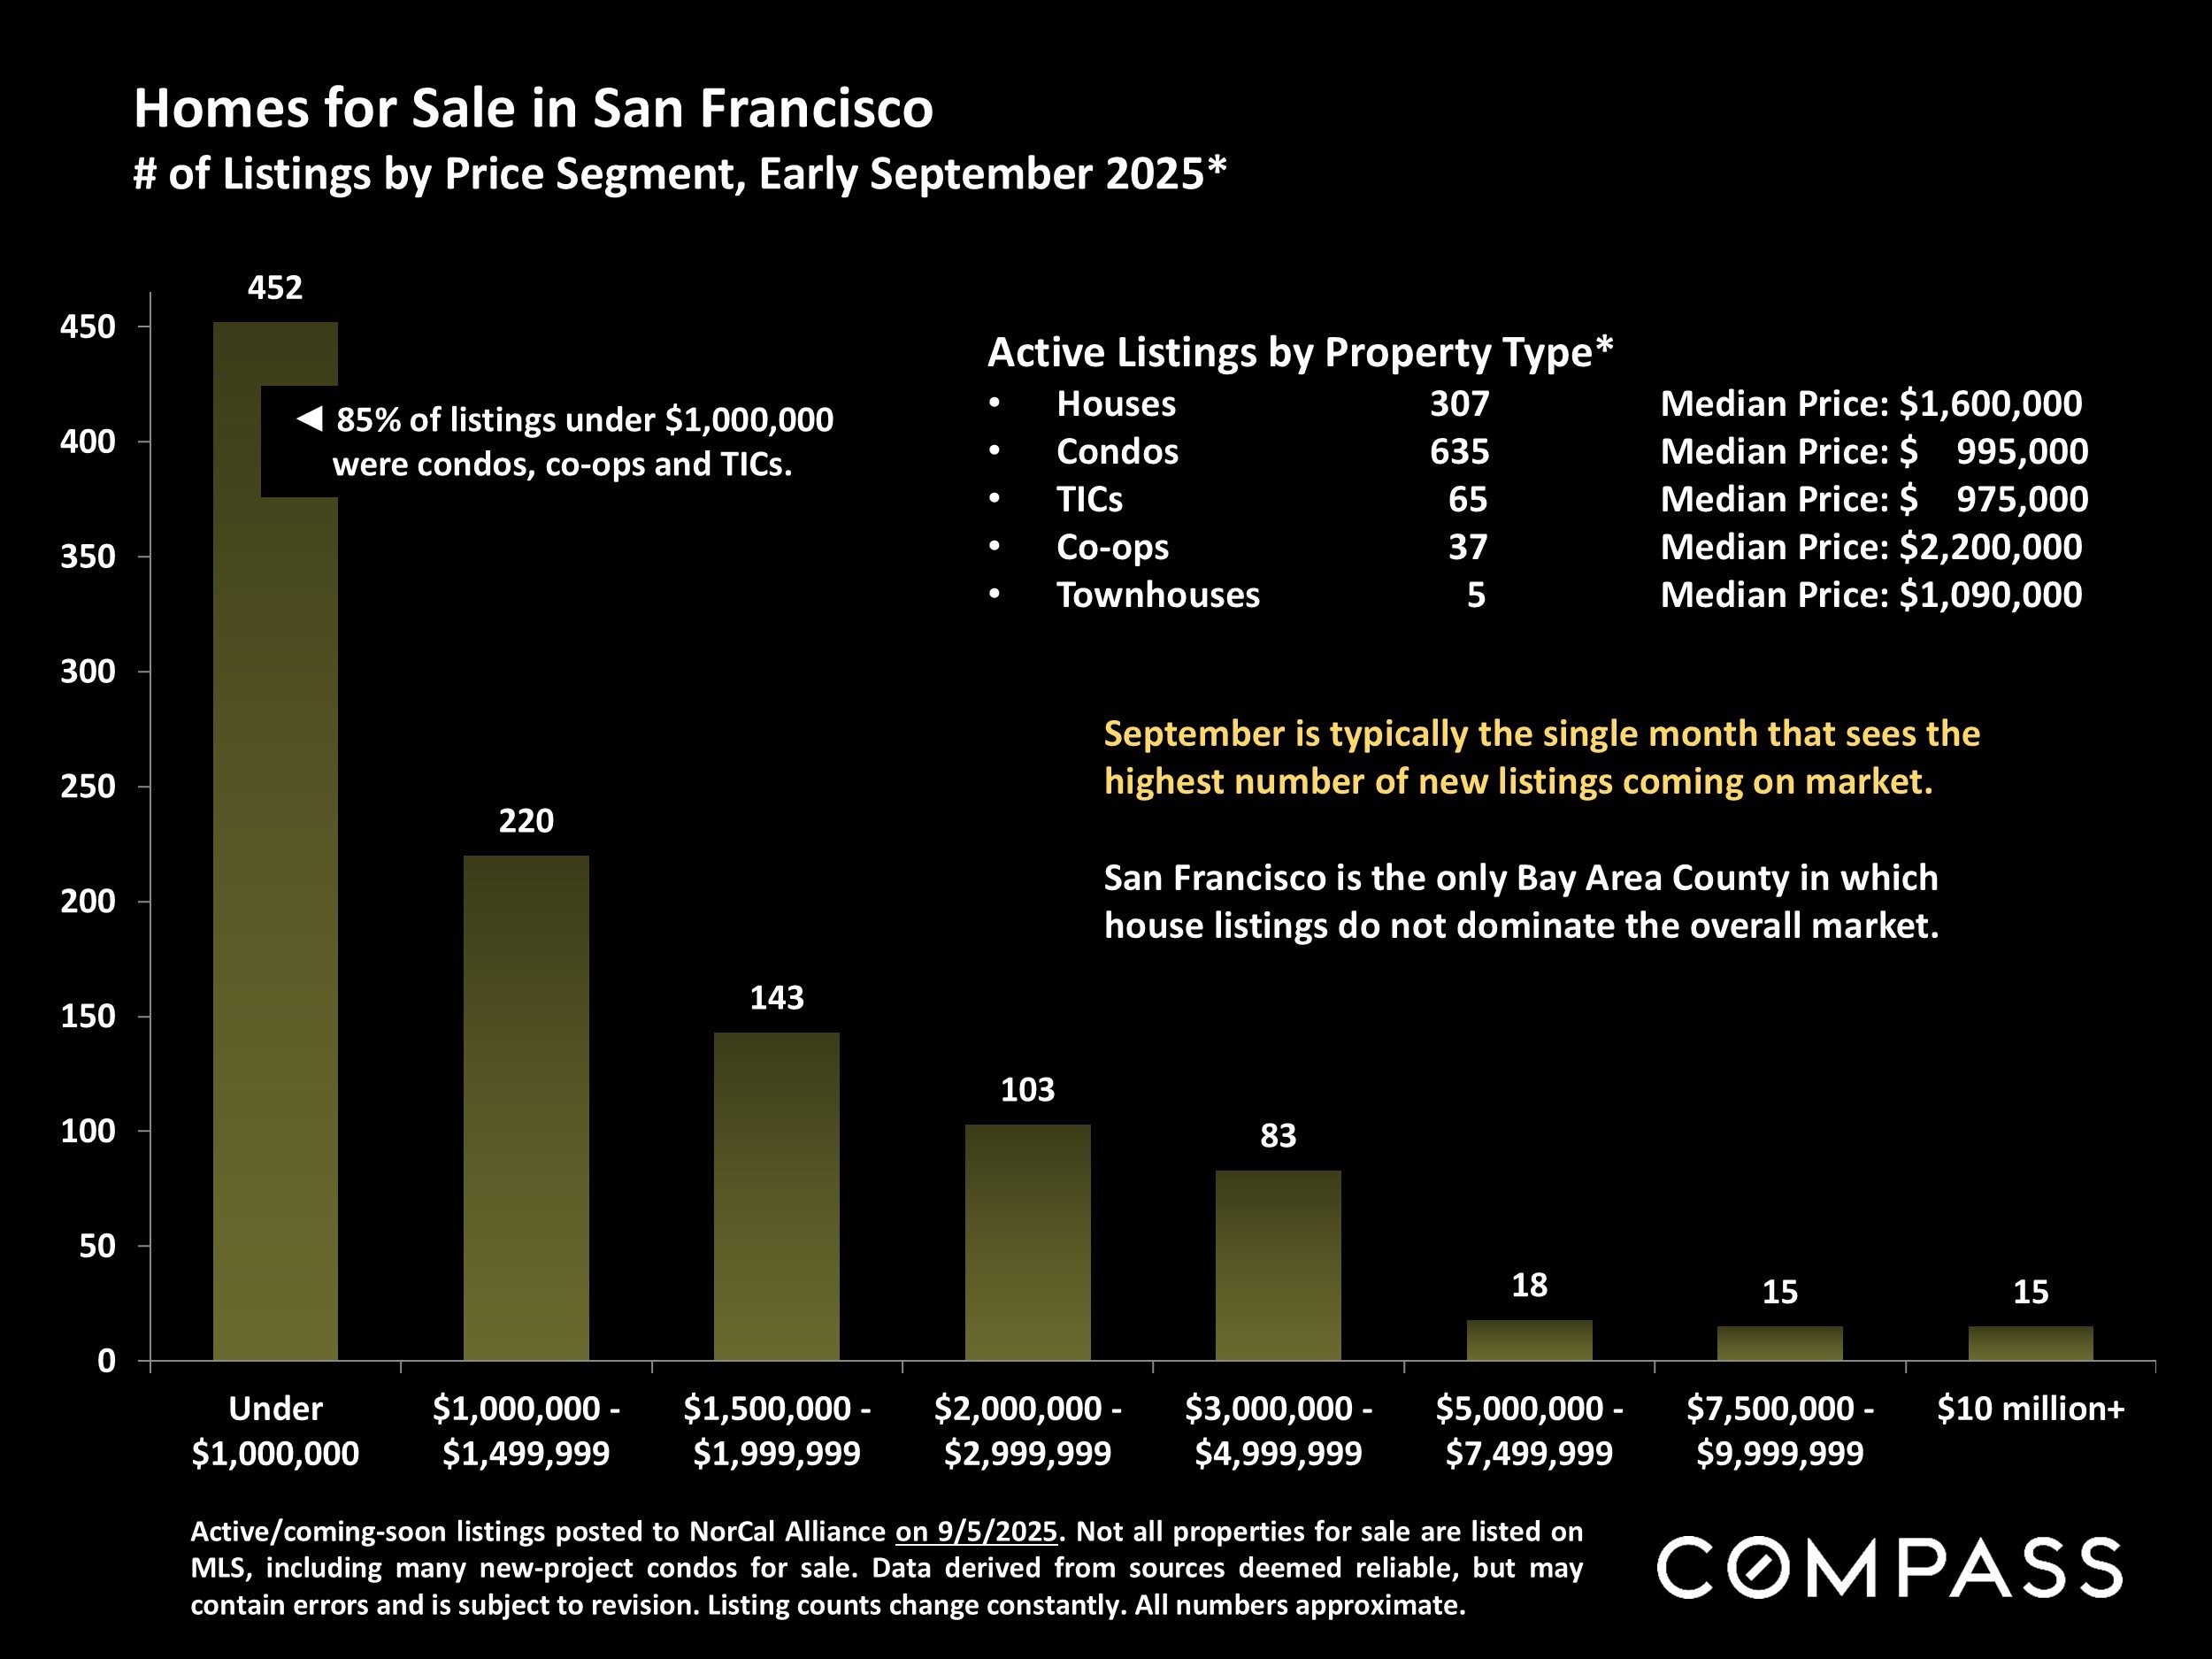
Active/coming-soon listings posted to NorCal Alliance on 9/5/2025. Not all properties for sale are listed on MLS, including many new-project condos for sale. Data derived from sources deemed reliable, but may contain errors and is subject to revision. Listing counts change constantly. All numbers approximate.
Active Listings by Property Type*
| # of properties | Median price | |
|---|---|---|
| Houses | 307 | $1,600,000 |
| Condos | 635 | $995,000 |
| TICs | 65 | $975,000 |
| Co-ops | 37 | $2,200,000 |
| Townhouses | 5 | $1,090,000 |
September is typically the single month that sees the highest number of new listings coming on market.
San Francisco is the only Bay Area County in which house listings do not dominate the overall market.
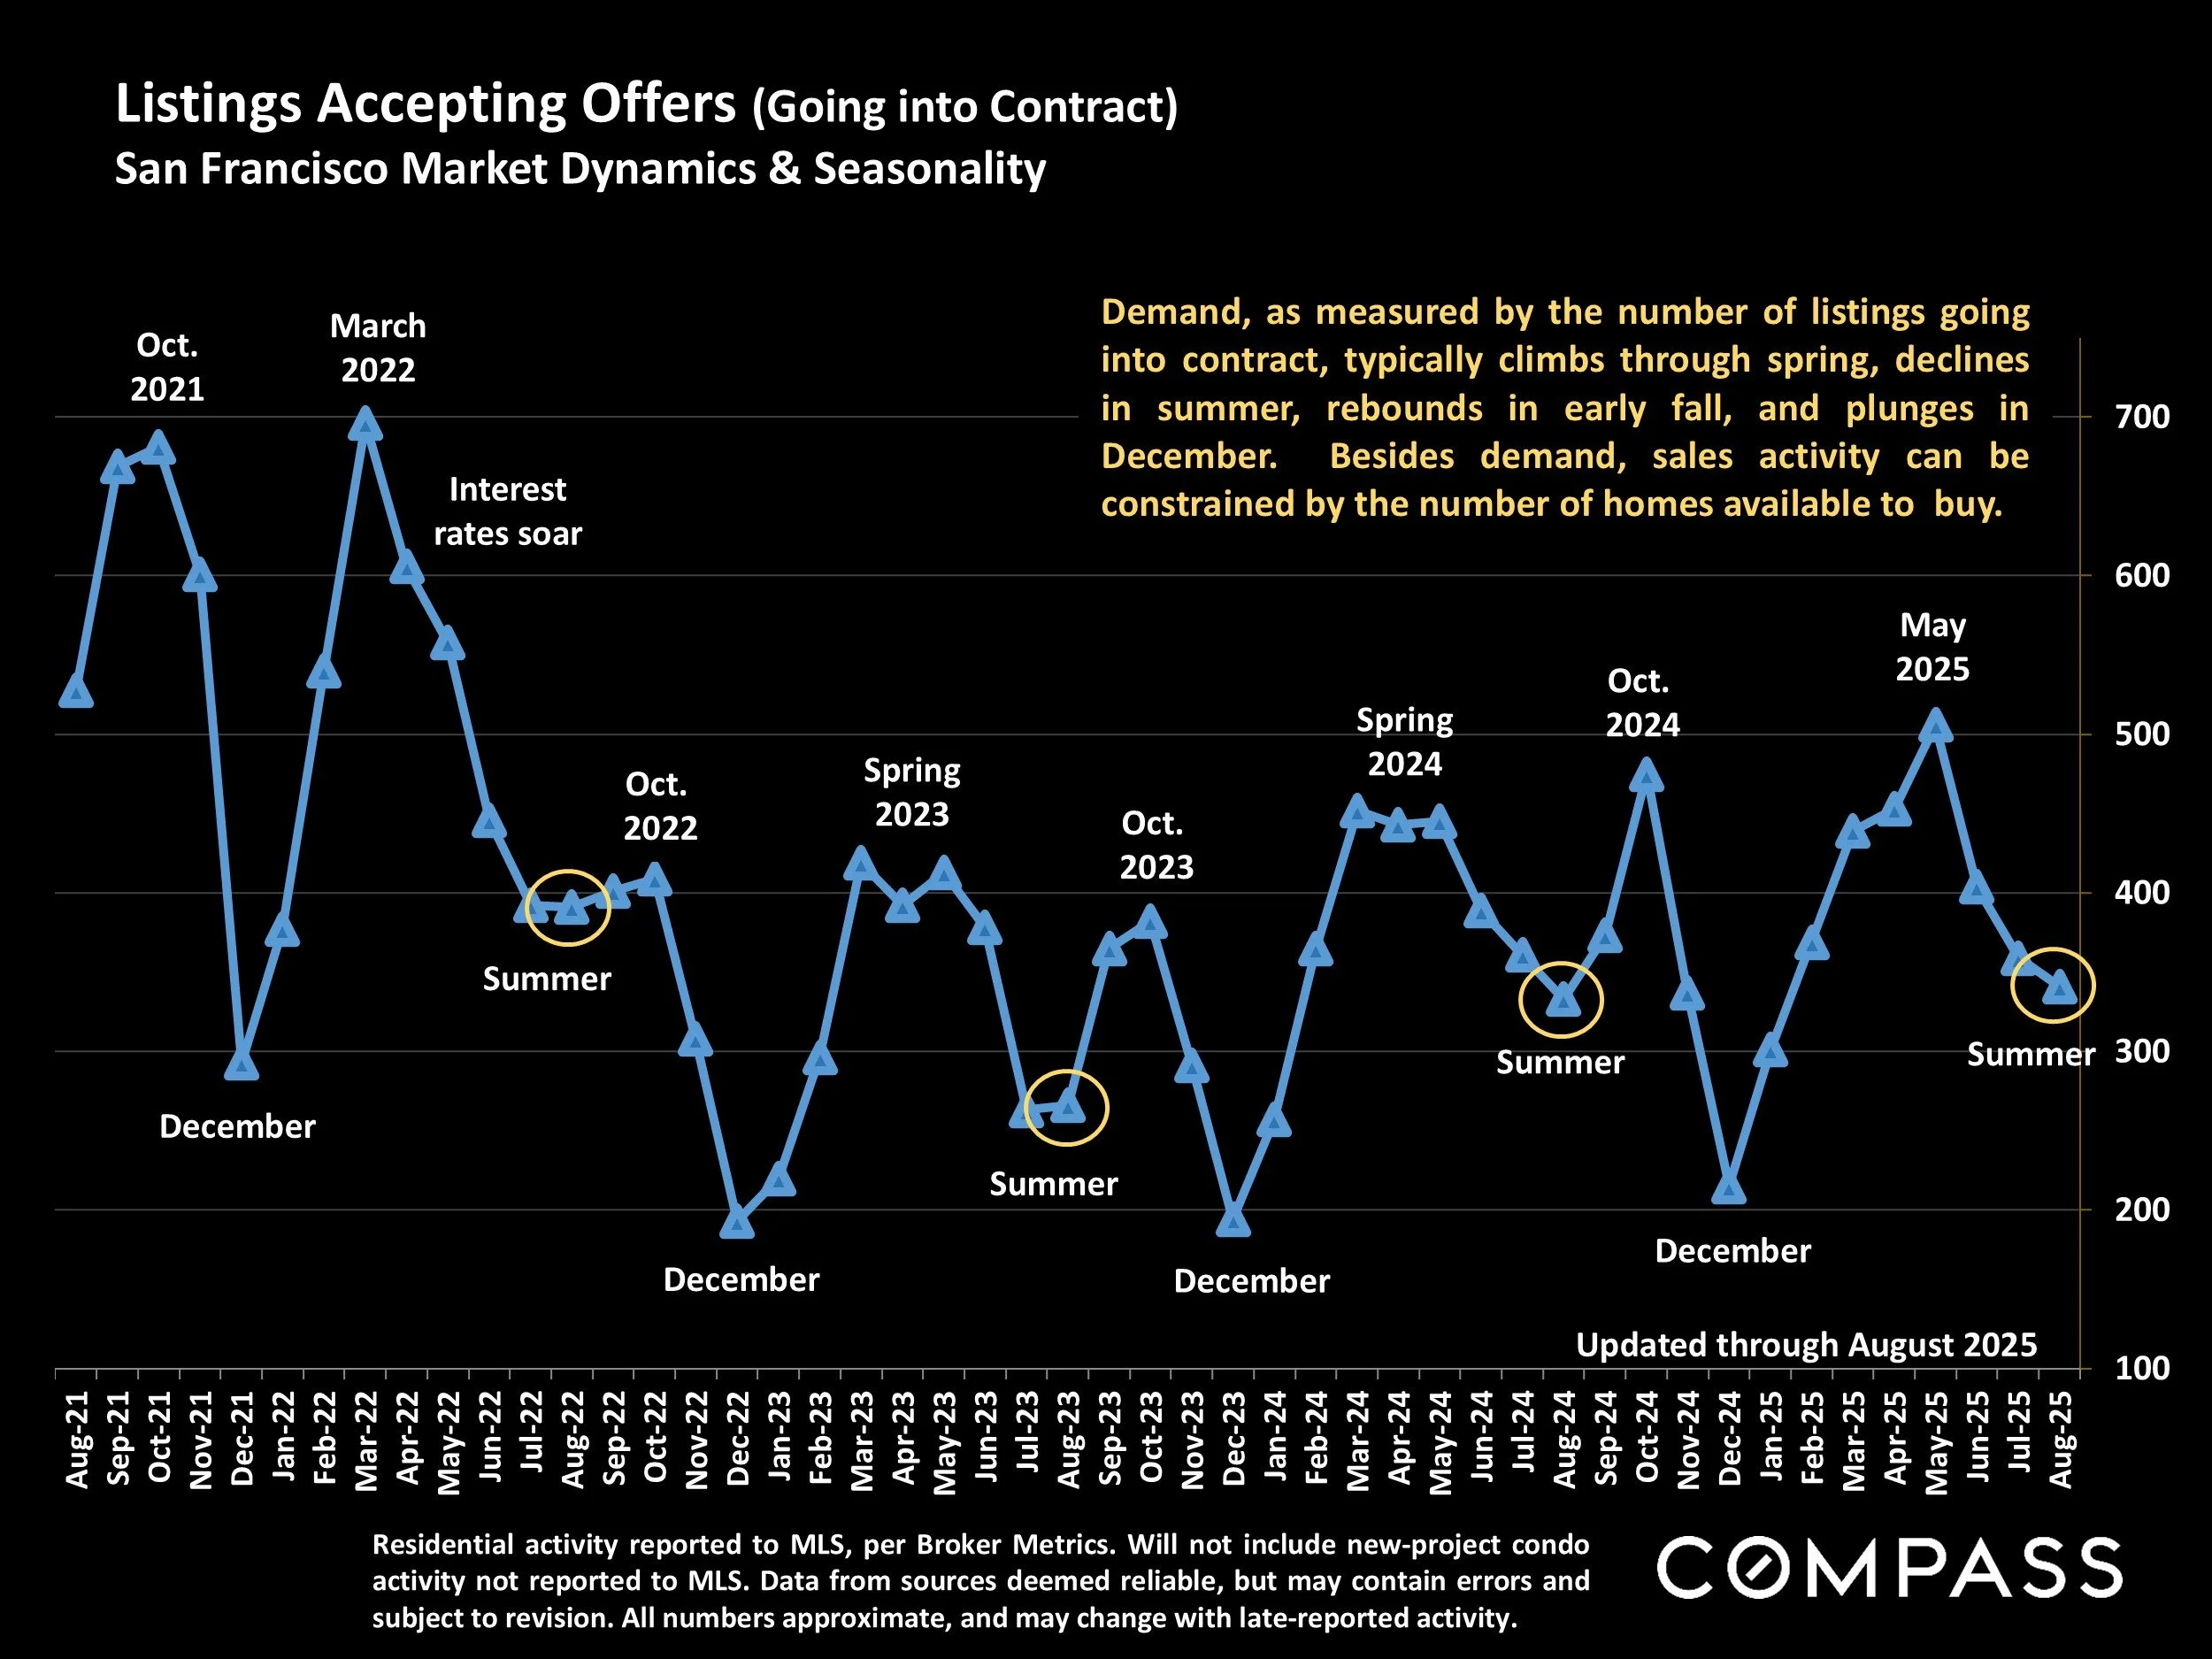
Listings Accepting Offers (Going into Contract)
San Francisco Market Dynamics & Seasonality

Residential activity reported to MLS, per Broker Metrics. Will not include new-project condo activity not reported to MLS. Data from sources deemed reliable, but may contain errors and subject to revision. All numbers approximate, and may change with late-reported activity.
Demand, as measured by the number of listings going into contract, typically climbs through spring, declines in summer, rebounds in early fall, and plunges in December. Besides demand, sales activity can be constrained by the number of homes available to buy.
Listings Accepting Offers
San Francisco Market Dynamics & Seasonality
Residential activity reported to MLS, per Broker Metrics. Will not include new-project condo activity not reported to MLS. Data from sources deemed reliable, but may contain errors and subject to revision. All numbers approximate, and may change with late-reported activity.
Demand, as measured by the number of listings going into contract, typically climbs through spring, declines in summer, rebounds in early fall, and plunges in December. Besides demand, sales activity can be constrained by the number of homes available to buy.
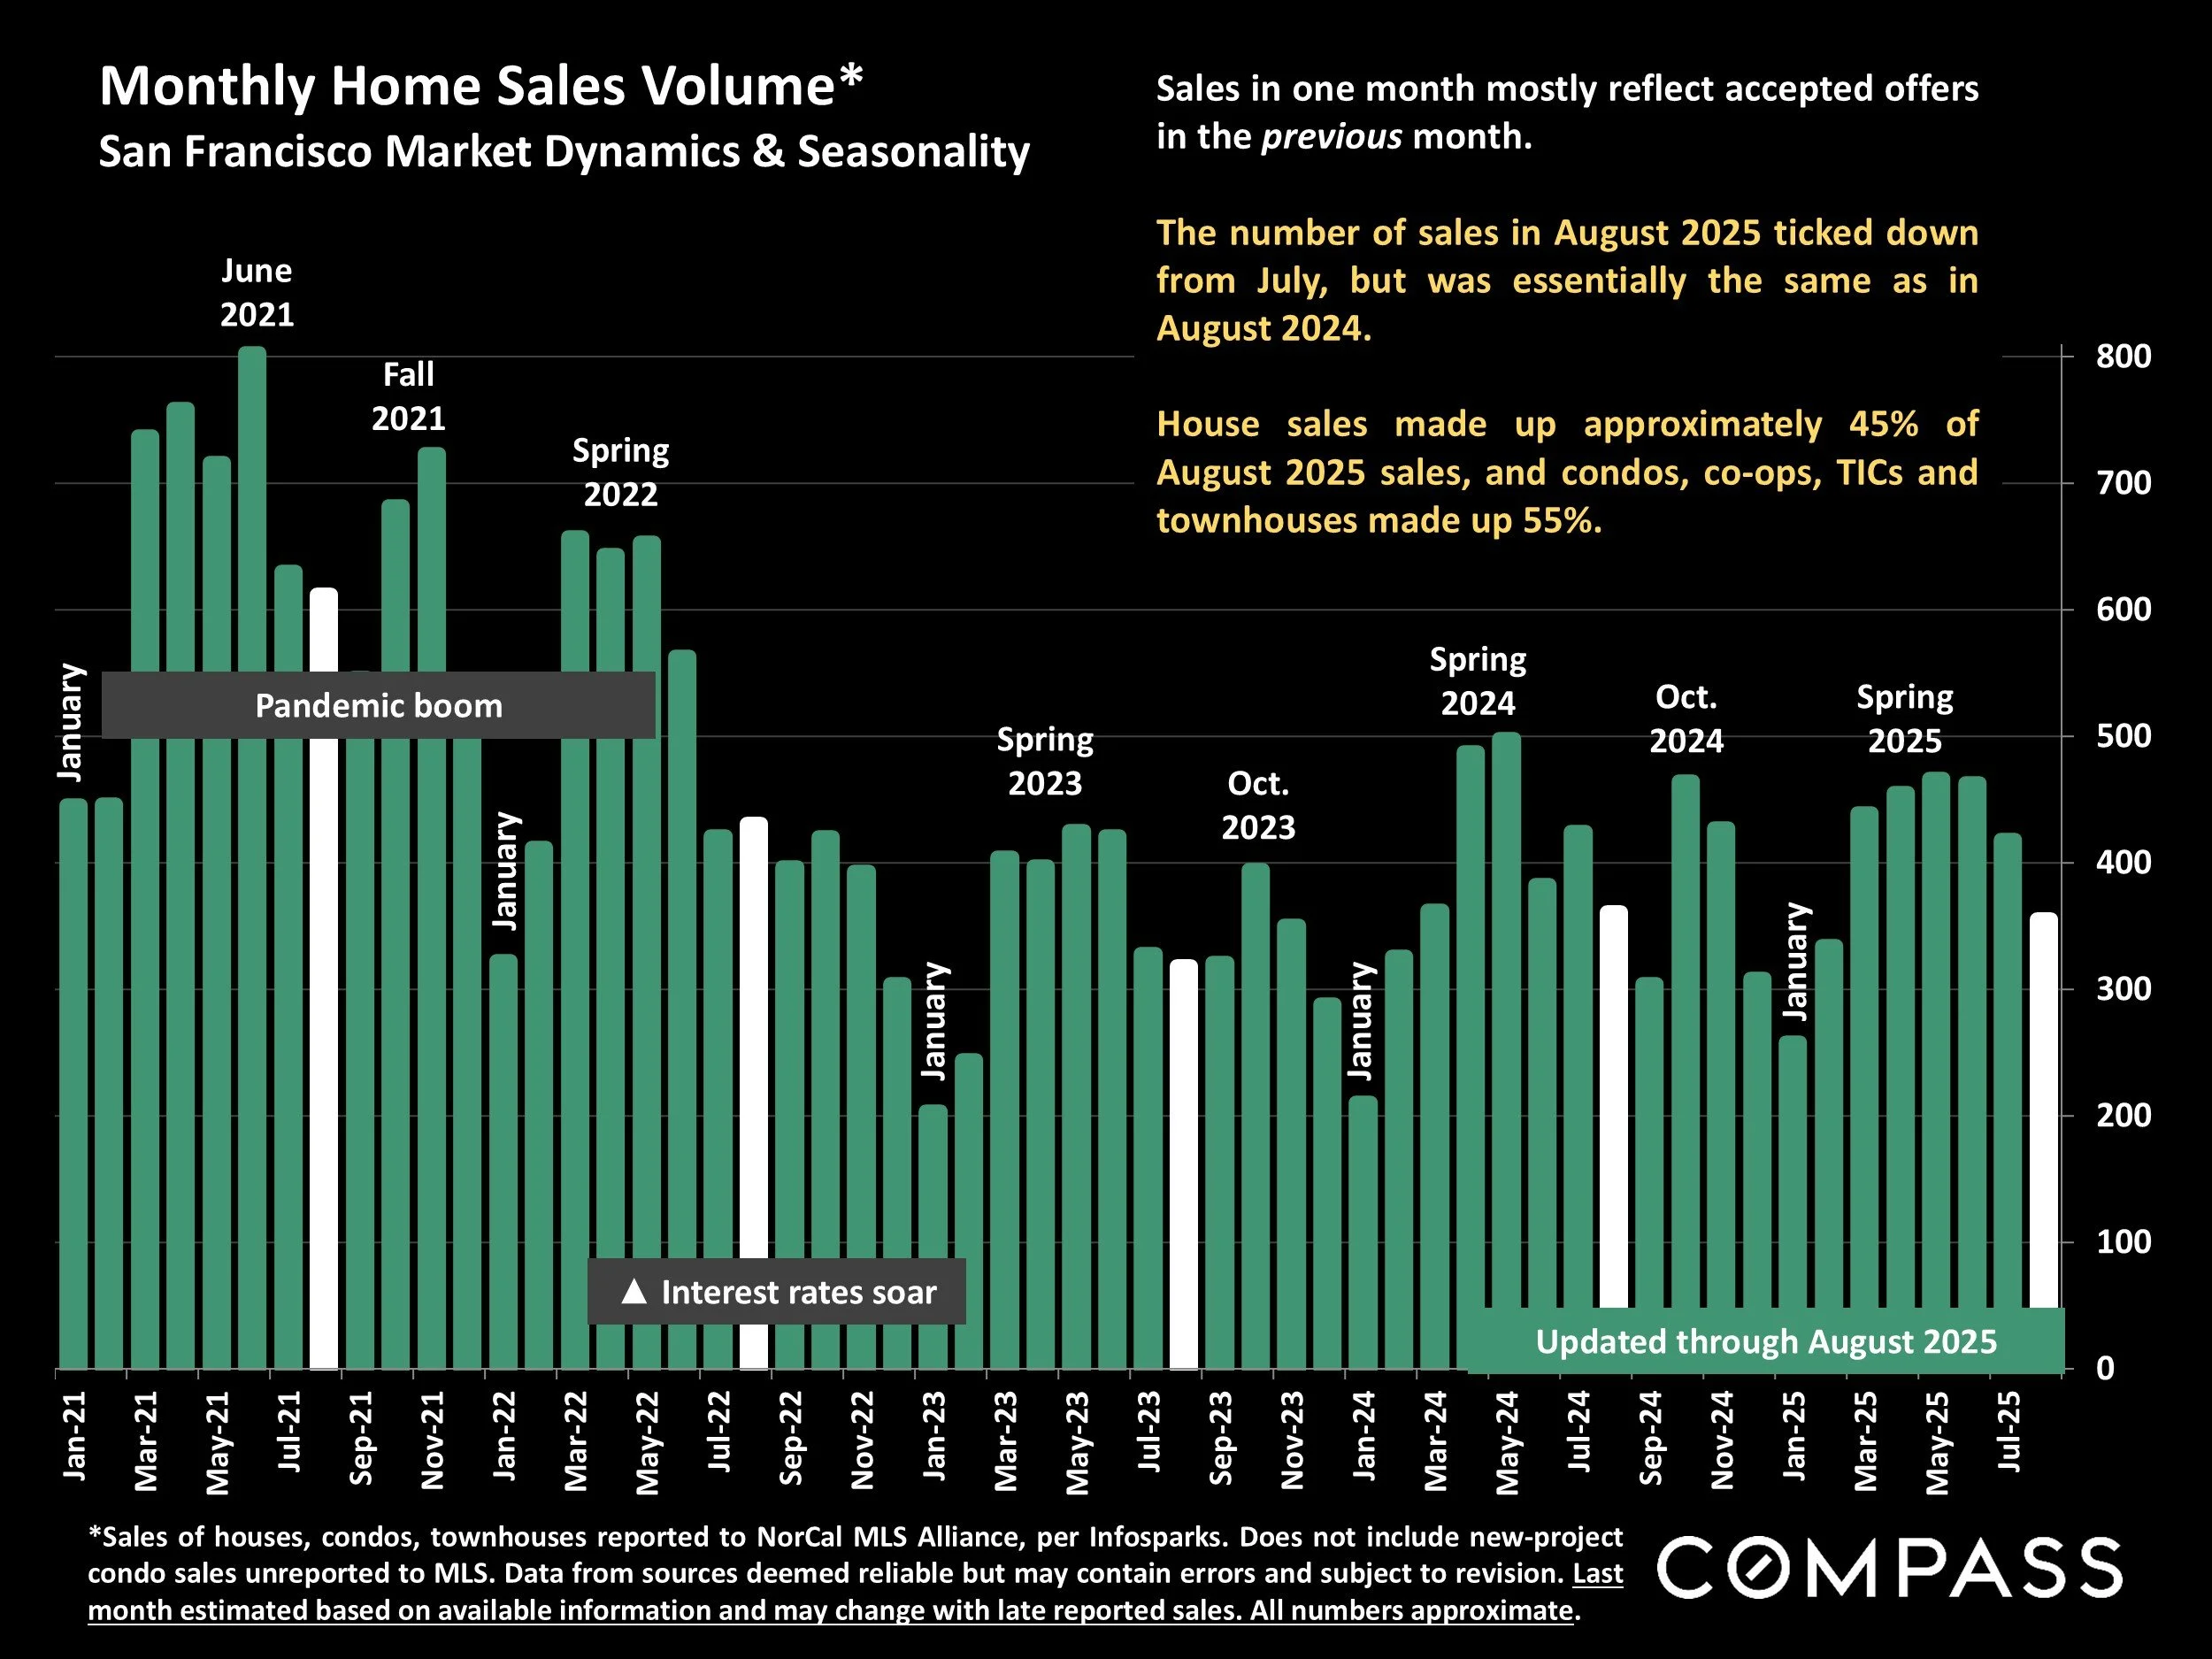
Monthly Home Sales Volume
Houses $5,000,000+ / Condos & Co-ops $3,000,000+
Sales reported to NorCal MLS Alliance, per Infosparks. “Condo/Co-op” sales include TICs and townhouses. Not all luxury home sales are reported. Data from sources deemed reliable, but subject to error and revision. All numbers approximate and may change with late-reported sales.
The number of sales in August 2025 ticked down from July, but was essentially the same as in August 2024.
House sales made up approximately 45% of August 2025 sales, and condos, co-ops, TICs and townhouses made up 55%.
Sales in one month mostly reflect accepted offers in the previous month.
San Francisco Luxury Home Sales
Houses $5,000,000+ / Condos & Co-ops $3,000,000+

Sales reported to NorCal MLS Alliance, per Infosparks. “Condo/Co-op” sales include TICs and townhouses. Not all luxury home sales are reported. Data from sources deemed reliable, but subject to error and revision. All numbers approximate and may change with late-reported sales.
After the usual summer slowdown, luxury home sales typically rebound dramatically in fall.
Sales in one month mostly reflect accepted offers in the previous month. The market for luxury homes fluctuates by season, with spring and fall typically the most active markets of the year.
Price Reductions on Active Listings
San Francisco Market Dynamics & Seasonality
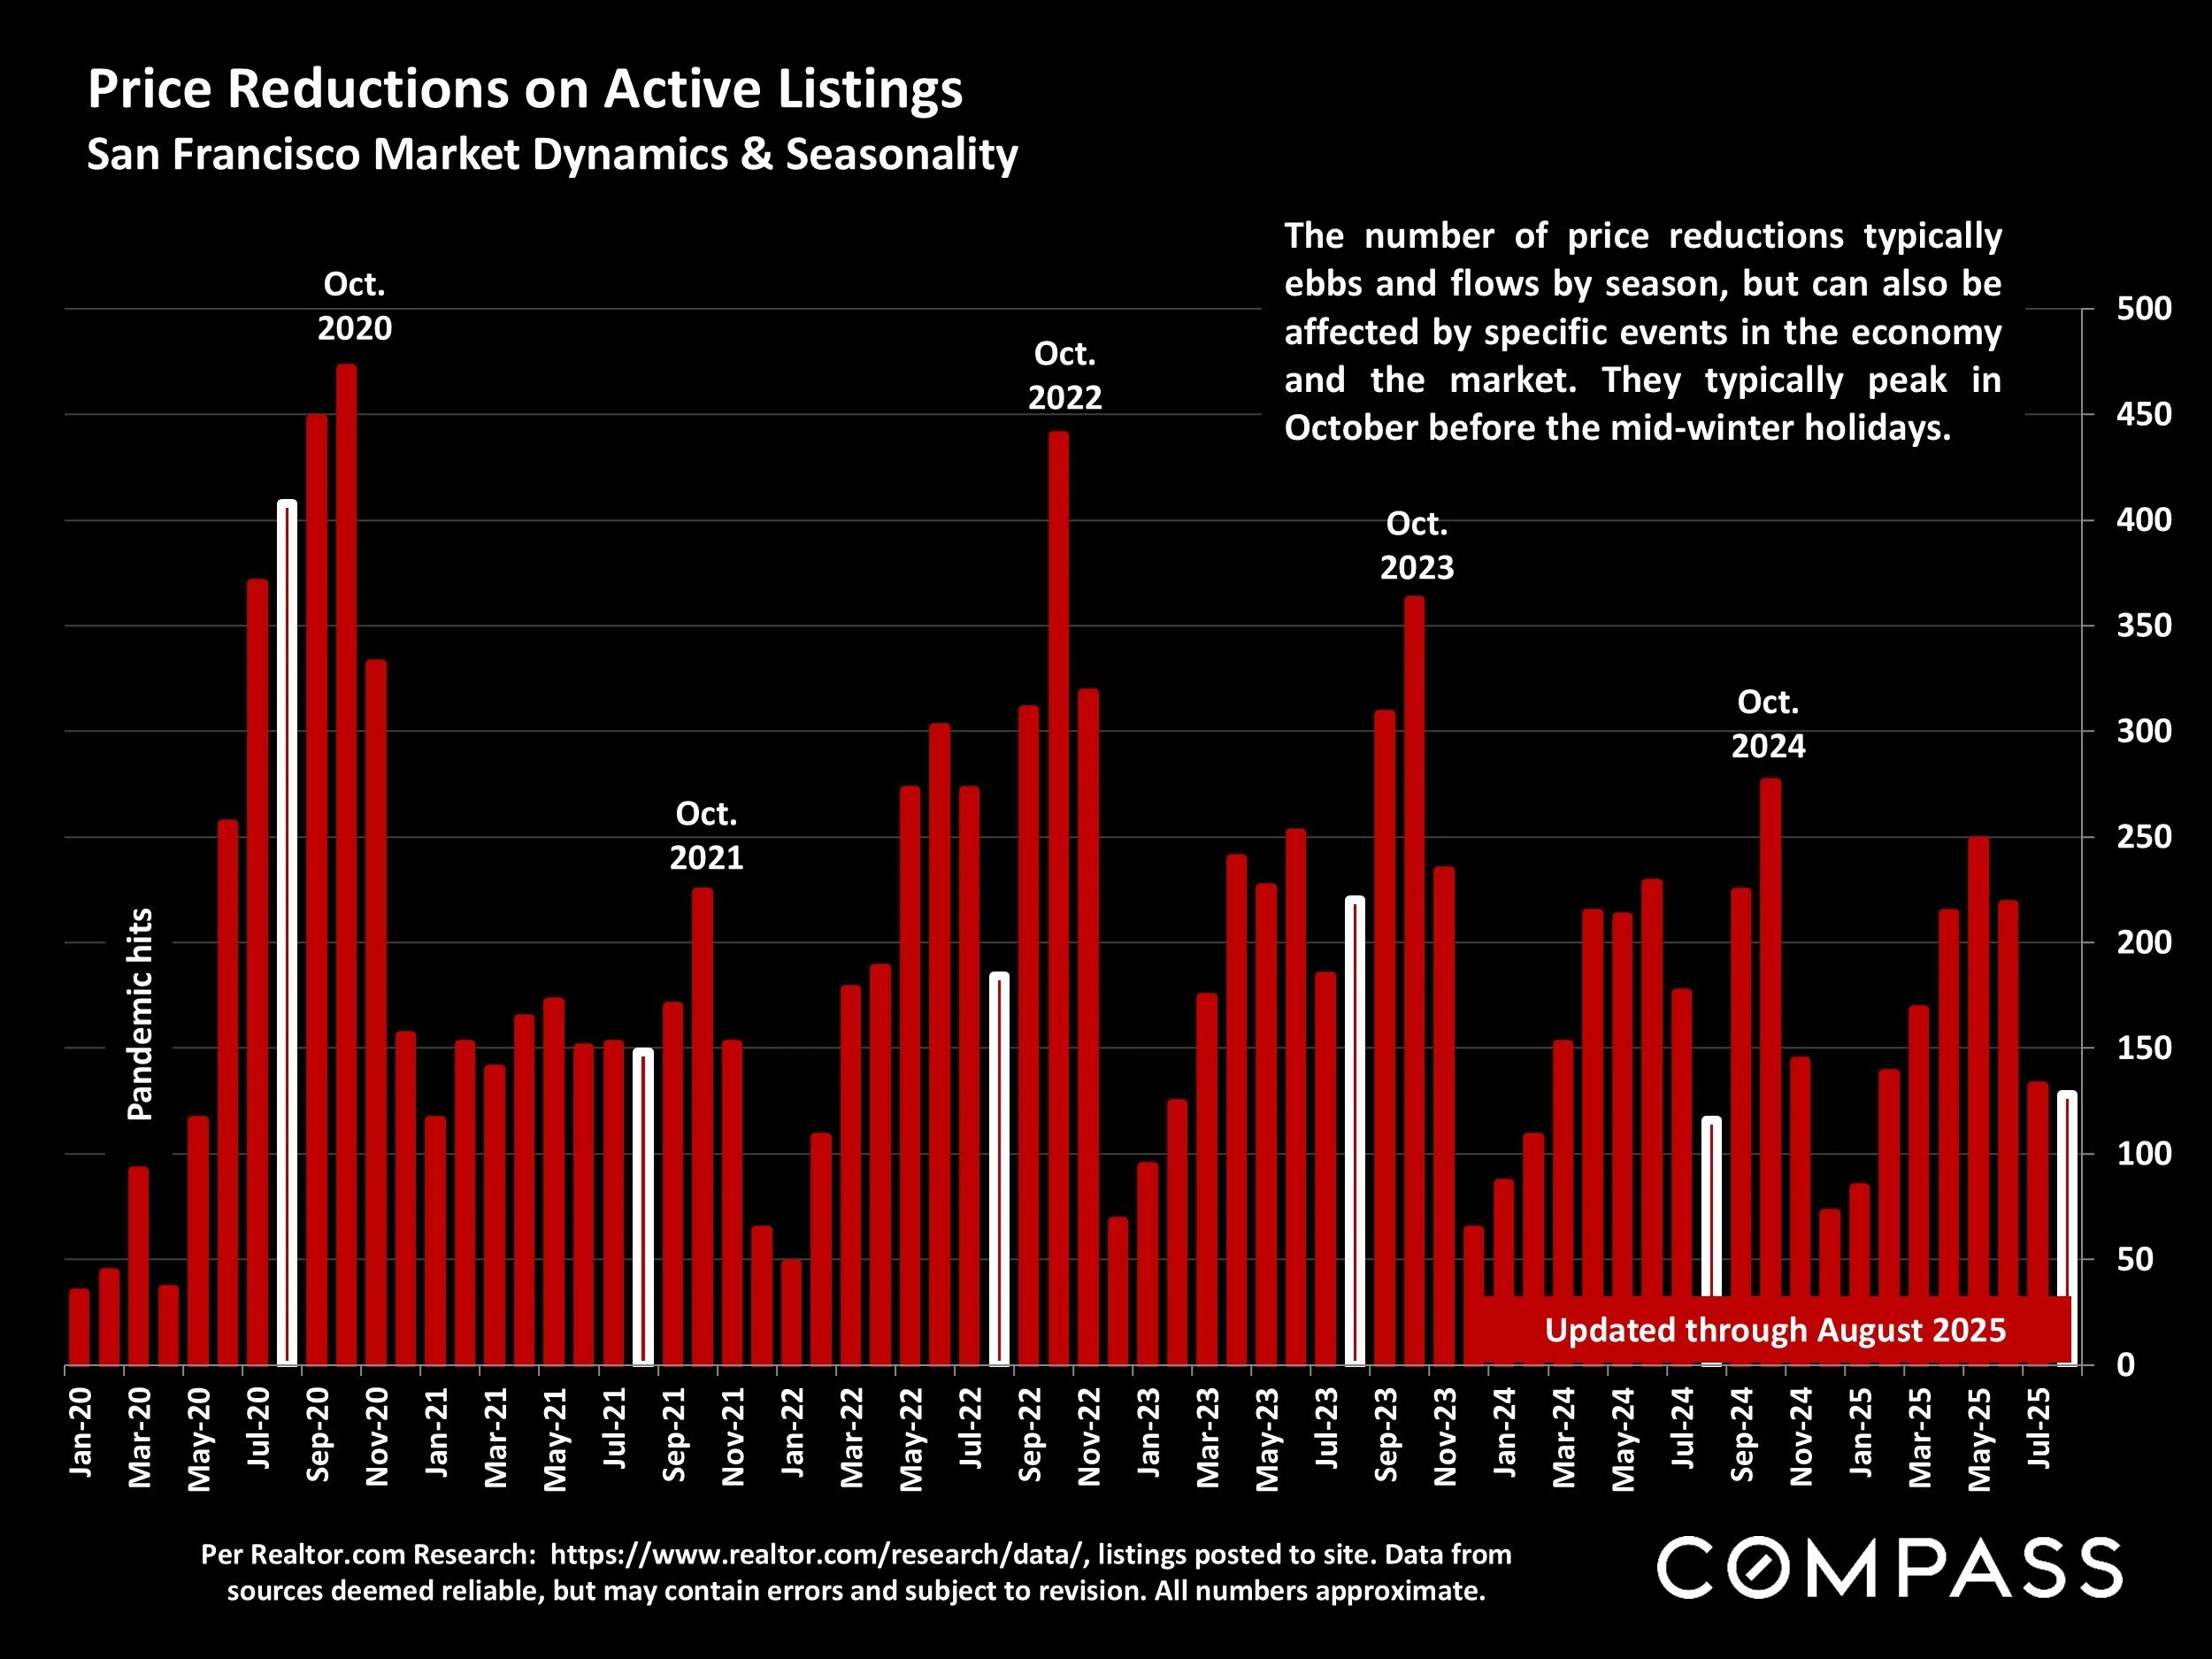
Per Realtor.com Research: https://www.realtor.com/research/data/, listings posted to site. Data from sources deemed reliable, but may contain errors and subject to revision. All numbers approximate.
The number of price reductions typically ebbs and flows by season, but can also be affected by specific events in the economy and the market. They typically peak in October before the mid-winter holidays.
Overbidding List Prices in San Francisco
Percentage of Home Sales Closing over List Price

Sales data reported to NORCAL MLS® ALLIANCE, per Infosparks. Reflecting the percentage of sales closing at sales prices over the final list prices. Data from sources deemed reliable, but may contain errors and subject to revision. All numbers are approximate, and may change with late-reported sales.
Overbidding is generally caused by buyer competition for new listings. The overall overbidding percentage in the latest month was 47% of sales, but for houses alone, it was 70%, and for condos, 25%.
This statistic fluctuates according to seasonal demand trends, and is a lagging indicator of market activity 3-6 weeks earlier.
Average Sales Price to Original List Price Percentage
San Francisco Over/Under Bidding: Market Dynamics & Seasonality

Sales reported to NorCal MLS Alliance, per Infosparks. Data derived from sources deemed reliable, but may contain errors and subject to revision. All numbers approximate, and may change with late-reported sales.
This chart illustrates the average Sales Price to Original List Price Percentage for all residential sales. But overbidding has been much more common and dramatic for house sales than for condo sales: For houses alone in August 2025, the average was 12% above list price, and for condos, 2.5% below list price.
This statistic can be distorted by strategic underpricing strategies by listing agents.
Average Days on Market – Speed of Sale
San Francisco Market Dynamics & Seasonality

Sales reported to NorCal MLS Alliance, per Infosparks. Data derived from sources deemed reliable, but may contain errors and subject to revision. All numbers approximate, and may change with late-reported sales.
This chart illustrates average days on market for all residential sales (45 days in August 2025). But for houses alone, the average was 34 days, and for condos, 73 days.
Measuring how long it takes for sold listings to accept offers. Homes usually sell fastest in spring and early autumn – with the rush of new listings – and slowest in mid-winter (when the inventory of listings is at its oldest). Houses, on average, sell much faster than condos, co-ops and TICs.
Statistics are generalities, essentially summaries of widely disparate data generated by dozens, hundreds or thousands of unique, individual sales occurring within different time periods. They are best seen not as precise measurements, but as broad, comparative indicators, with reasonable margins of error. Anomalous fluctuations in statistics are not uncommon, especially in smaller, expensive market segments. Last period data should be considered estimates that may change with late-reported data. Different analytics programs sometimes define statistics – such as “active listings,” “days on market,” and “months supply of inventory” – differently: what is most meaningful are not specific calculations but the trends they illustrate. Most listing and sales data derives from the local or regional multi-listing service (MLS) of the area specified in the analysis, but not all listings or sales are reported to MLS and these won’t be reflected in the data. “Homes” signifies real-property, single-household housing units: houses, condos, co-ops, townhouses, duets and TICs (but not mobile homes), as applicable to each market. City/town names refer specifically to the named cities and towns, unless otherwise delineated. Multi-county metro areas will be specified as such. Data from sources deemed reliable, but may contain errors and subject to revision. All numbers to be considered approximate.
Many aspects of value cannot be adequately reflected in median and average statistics: curb appeal, age, condition, amenities, views, lot size, quality of outdoor space, “bonus” rooms, additional parking, quality of location within the neighborhood, and so on. How any of these statistics apply to any particular home is unknown without a specific comparative market analysis.
Median Sales Price is that price at which half the properties sold for more and half for less. It may be affected by seasonality, “unusual” events, or changes in inventory and buying trends, as well as by changes in fair market value. The median sales price for an area will often conceal an enormous variety of sales prices in the underlying individual sales.
Dollar per Square Foot is based upon the home’s interior living space and does not include garages, unfinished attics and basements, rooms built without permit, patios, decks or yards (though all those can add value to a home). These figures are usually derived from appraisals or tax records, but are sometimes unreliable (especially for older homes) or unreported altogether. The calculation can only be made on those home sales that reported square footage.
Compass is a real estate broker licensed by the State of California, DRE 01527235. Equal Housing Opportunity. This report has been prepared solely for information purposes. The information herein is based on or derived from information generally available to the public and/or from sources believed to be reliable. No representation or warranty can be given with respect to the accuracy or completeness of the information. Compass disclaims any and all liability relating to this report, including without limitation any express or implied representations or warranties for statements contained in, and omissions from, the report. Nothing contained herein is intended to be or should be read as any regulatory, legal, tax, accounting or other advice and Compass does not provide such advice. All opinions are subject to change without notice. Compass makes no representation regarding the accuracy of any statements regarding any references to the laws, statutes or regulations of any state are those of the author(s). Past performance is no guarantee of future results.