
September 2026 San Francisco Market Report

Photo by Cedric Letsch on Unsplash
How’s the San Francisco market? HOT—and getting tighter. In August, single-family median prices rose YoY to $1.855M, while condos jumped 22% to $1.233M, and price per square foot increased 19% for both. Meanwhile, active listings plunged 35% YoY to just 570 properties, despite a 10% increase in new listings—the sharpest inventory decline in the region. The market tightened dramatically. Don’t interpret lower sales velocity as weak demand; it reflects a thin market with constrained supply, where fewer deals transact at higher prices.
August marked a broad seasonal cooling across the Bay Area. Closings declined year over year in 13 of 14 counties and month over month in 12, while months of supply increased from July in 13 counties. The shift reflects the typical late-summer slowdown as the market transitions from the spring/summer peak toward the fall market peak.
Competition remained stronger than a year ago. The share of sales closing above list increased year over year in all 14 counties, while average days on market improved in 11. Price reductions increased in 10 counties, consistent with the seasonal rise in listing adjustments as the market moves toward fall and winter.
Single-family homes continued to show stronger market conditions than condos. Single-family closings fell year over year in nine counties but increased in five, and days on market declined in 13. The share of sales closing above list increased across every county. By contrast, condo price reductions increased in 12 counties, while condo days on market rose in six — signaling a more uneven recovery.
Condo momentum appears to be moderating after a strong summer. The condo median increased year over year in six counties and declined in eight, while the share of condos selling above list rose in only eight. August is the first month of data following new condo lending regulations, so it is too early to determine whether the slowdown reflects the regulations or the normal late-summer seasonal pattern.
San Francisco remains the regional standout. Condo sales increased 11% year over year to 214, the condo median rose 22% to $1.23 million, and active condo listings fell 36%. San Francisco was the only county where condos showed both meaningful price and closed transaction growth.
September watch: The strongest appreciation outside San Francisco was concentrated north of the city, with Marin posting the region’s second-highest year-over-year gain. Condo sales and pricing will be closely watched to determine whether August’s slowdown is temporary or the beginning of a broader shift. The performance of smaller versus larger condo buildings will also be important, particularly as the impact of the new lending regulations becomes clearer. Atherton’s nearly $10 million increase in its median price, driven by a few high-value sales, will be another notable test of whether recent gains will be sustained.

How to Read This Report: County and Submarket Guidance
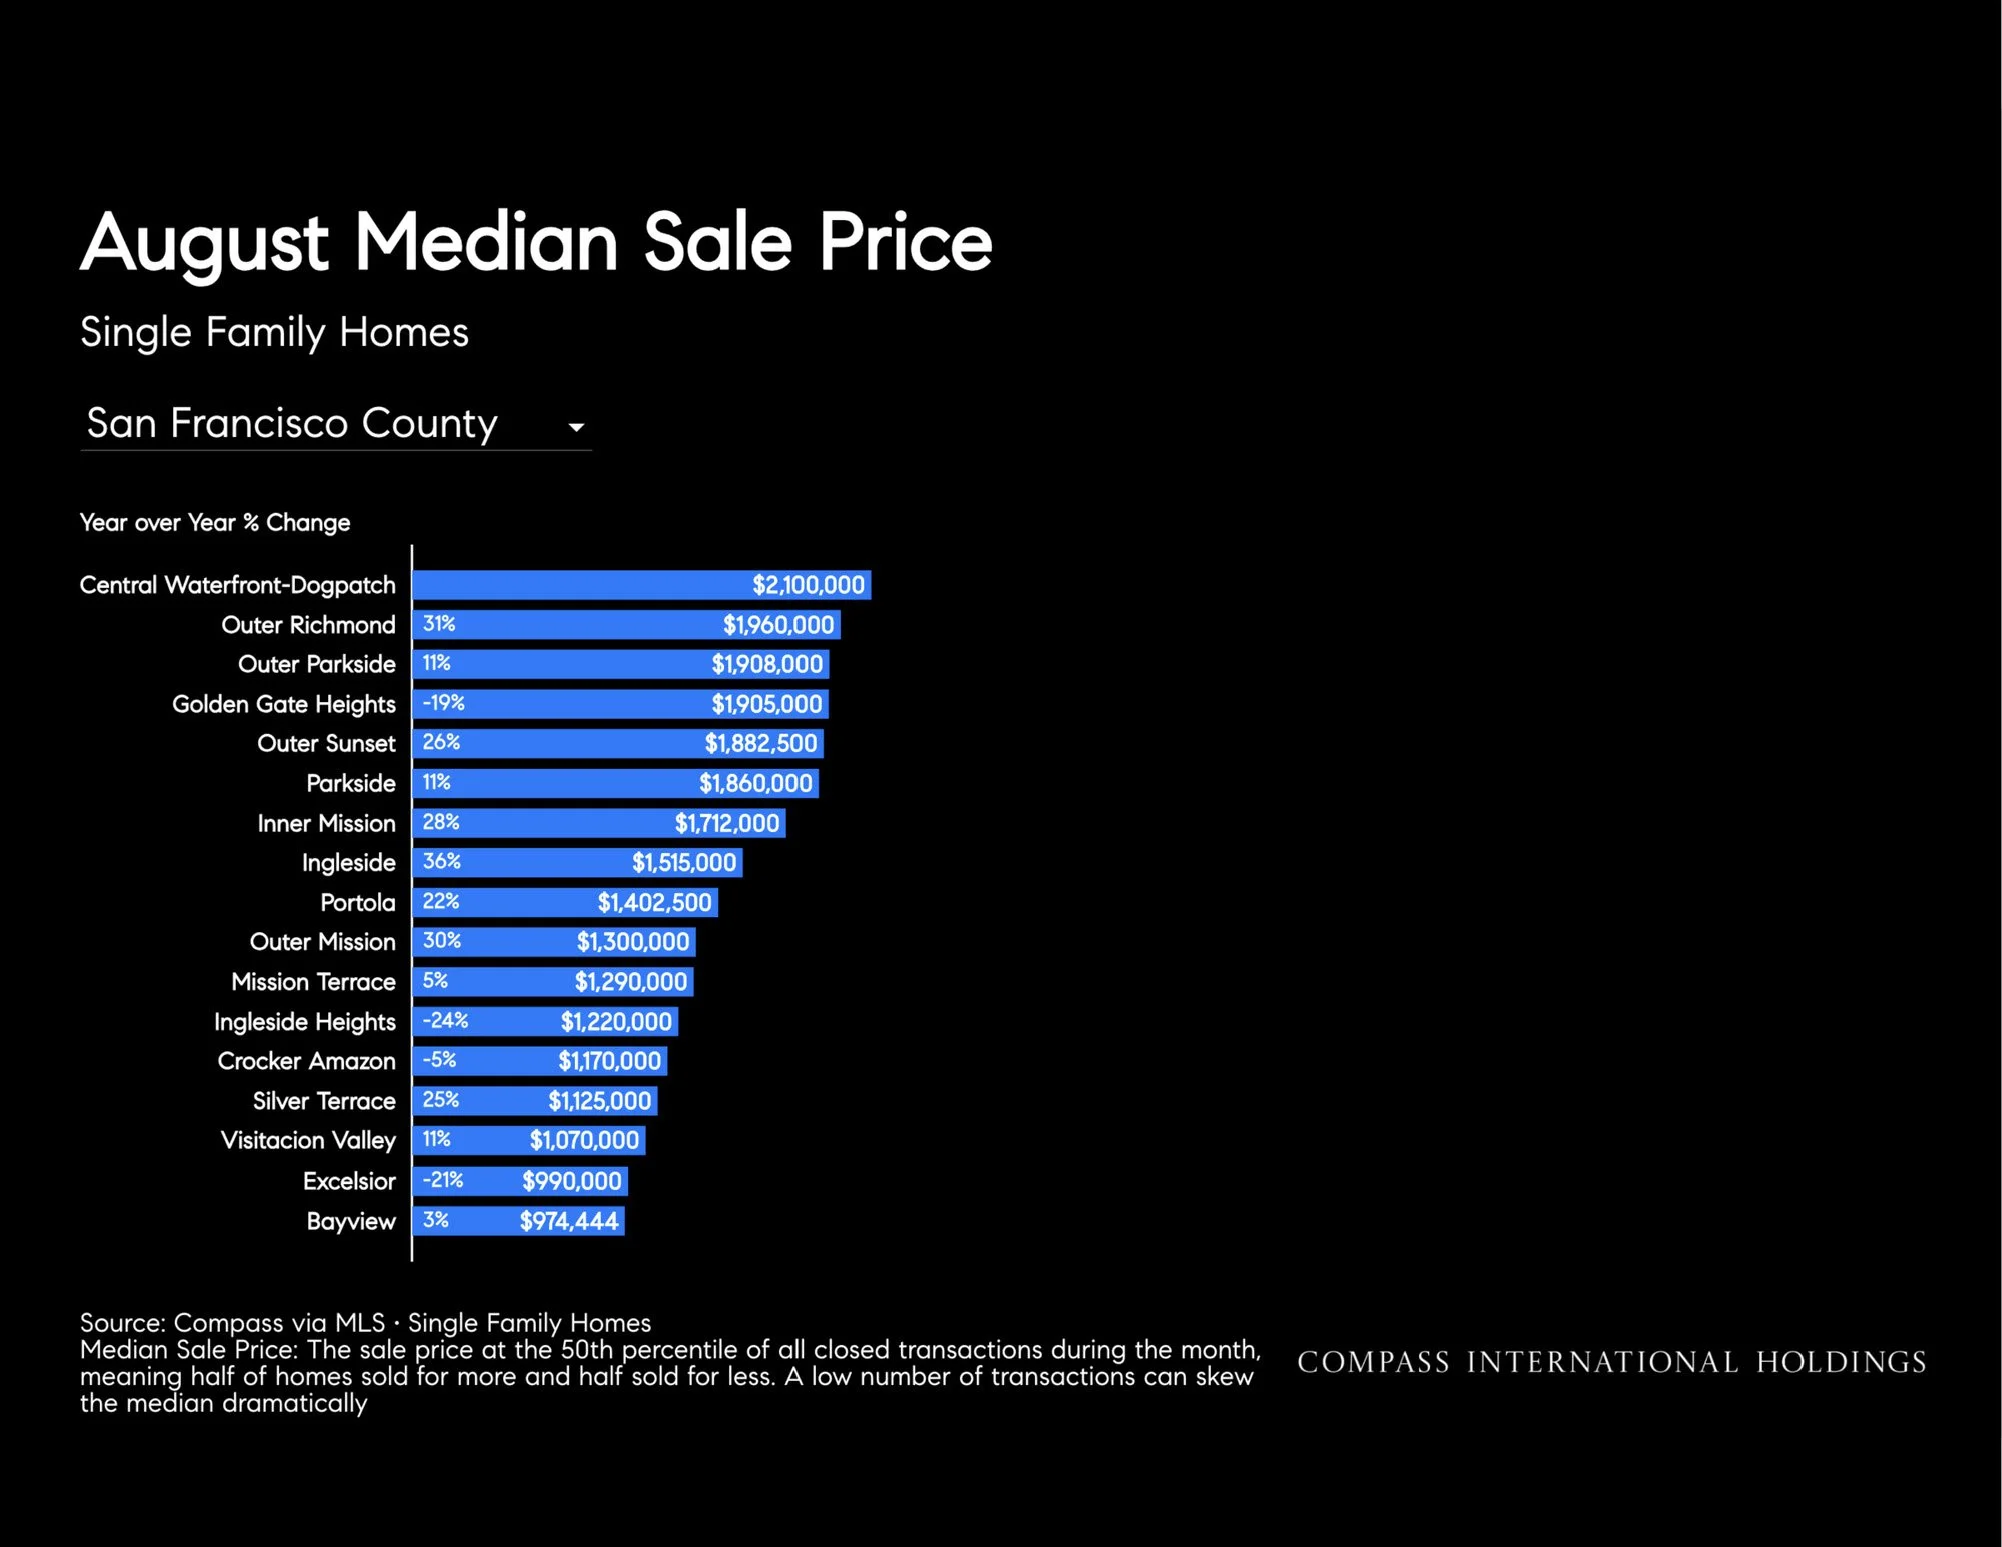
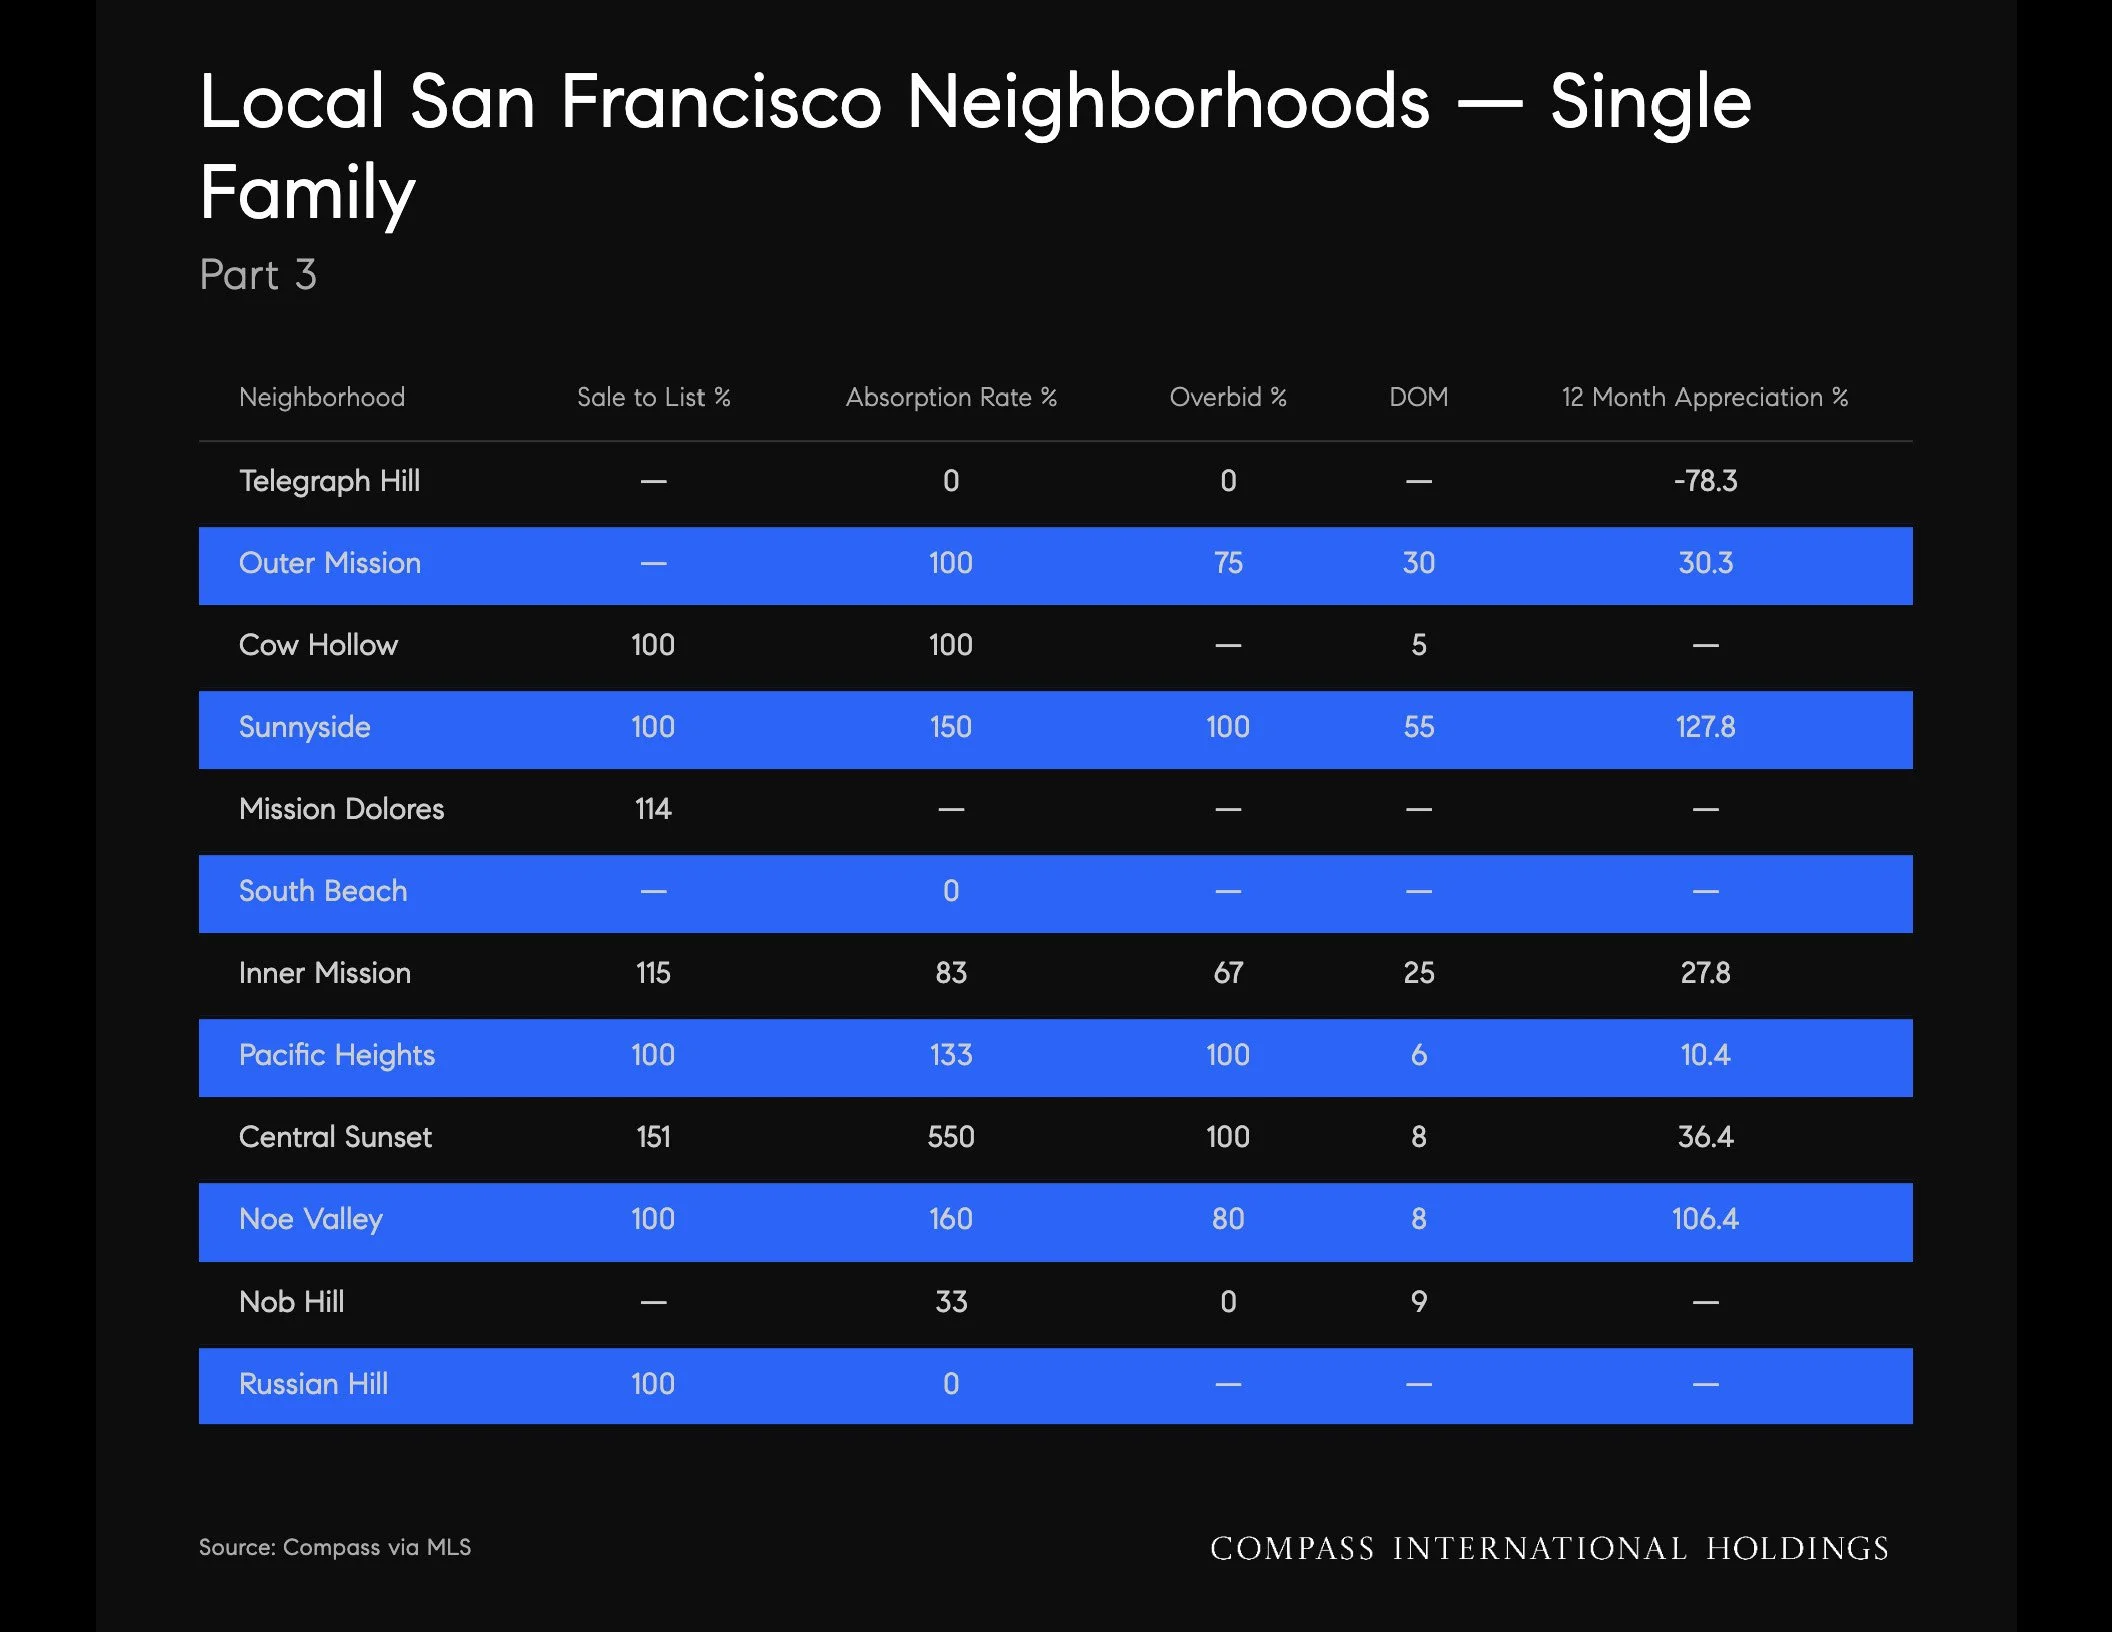
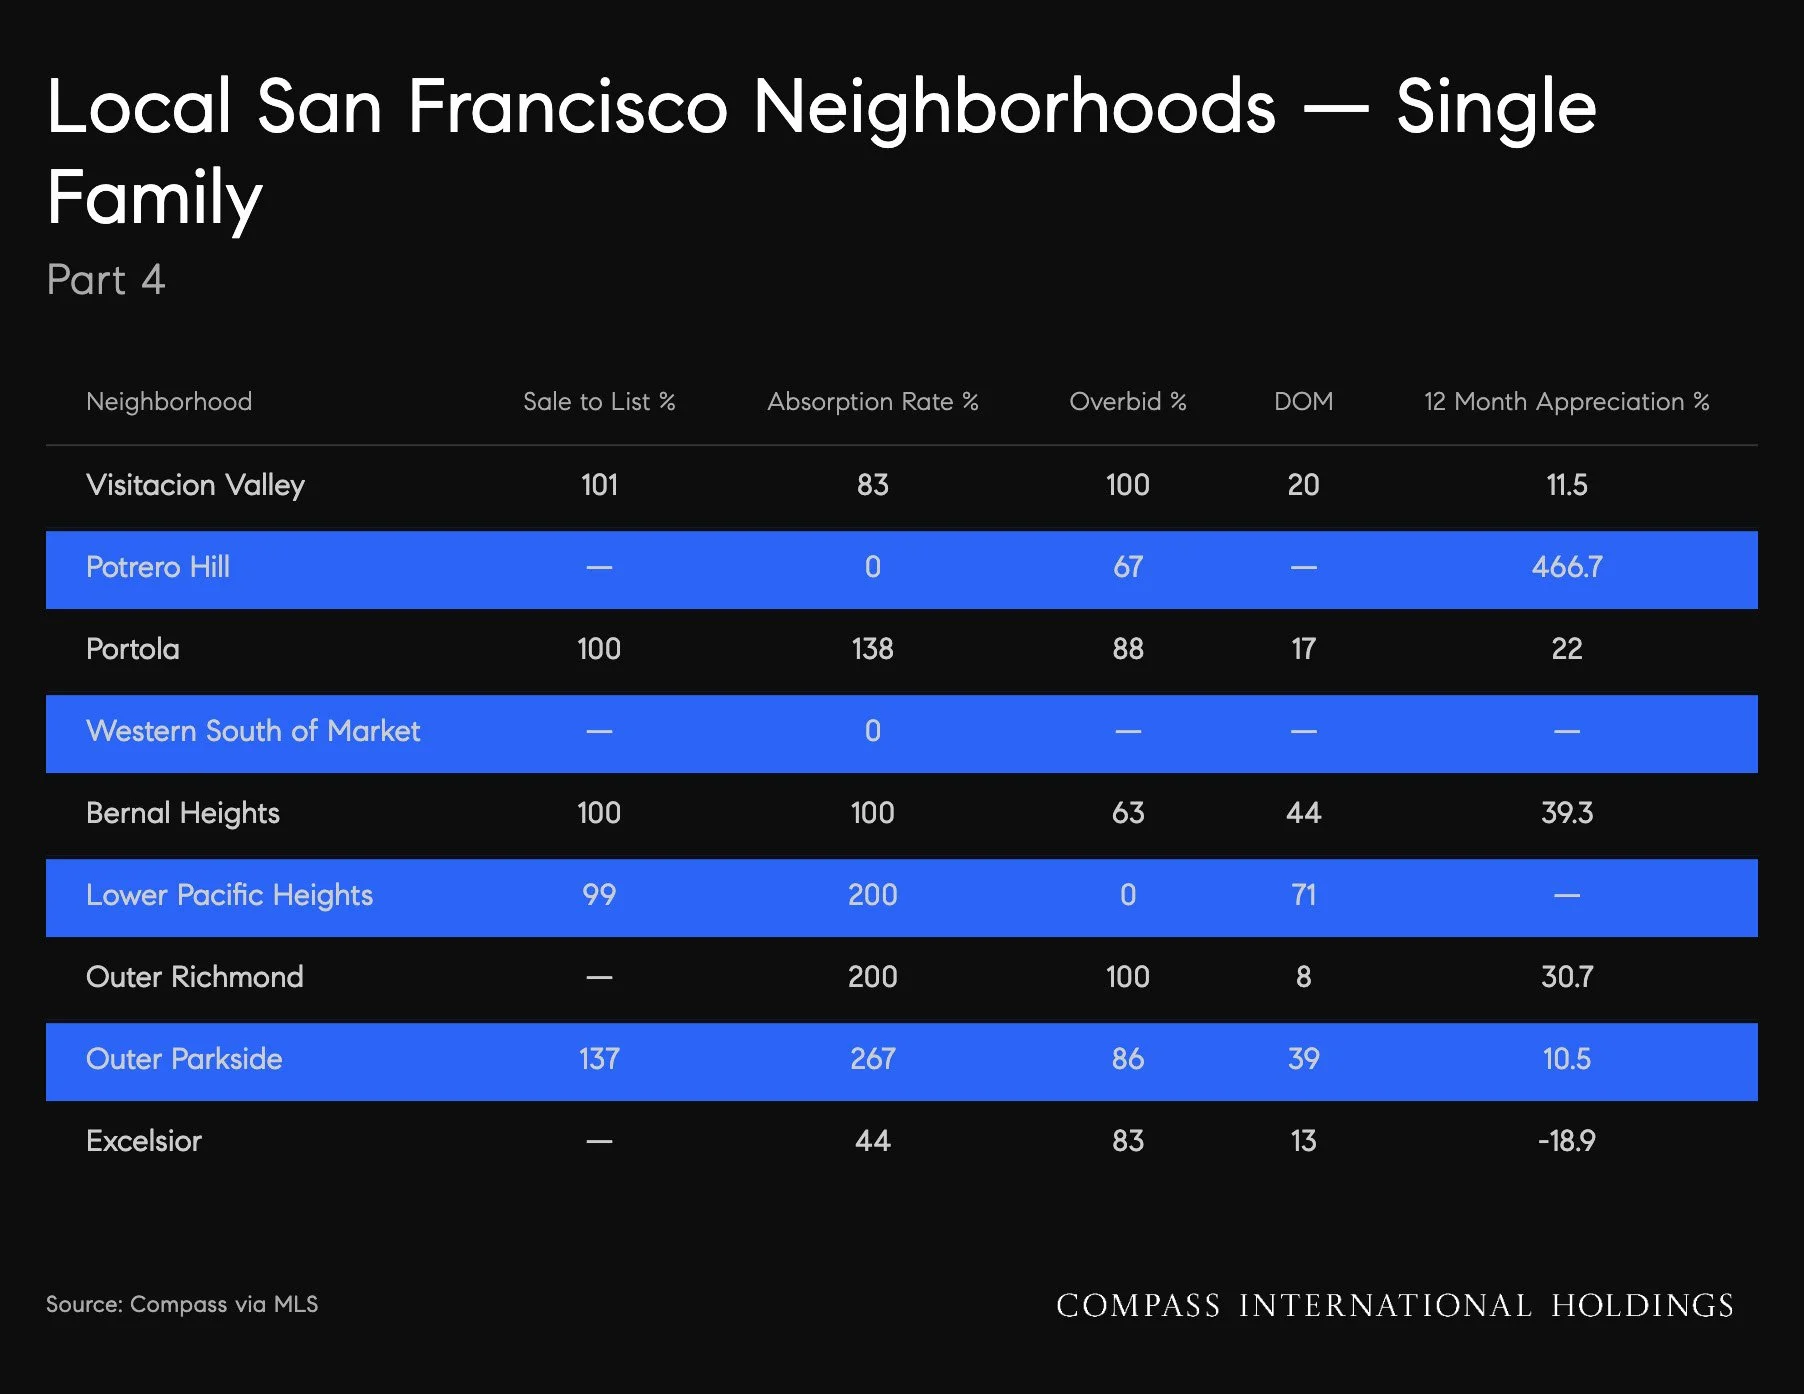
Data quality. San Francisco closed 150 single-family sales and 218 condo sales in August—strong bases for both cohorts. Single-family data are reliable. Condo data (218 closings) are robust for county-level analysis. However, the report notes that no single San Francisco neighborhood cleared ten single-family closings in both August 2026 and August 2025; neighborhood-level detail is condo-only and should not be read as a complete neighborhood market picture.
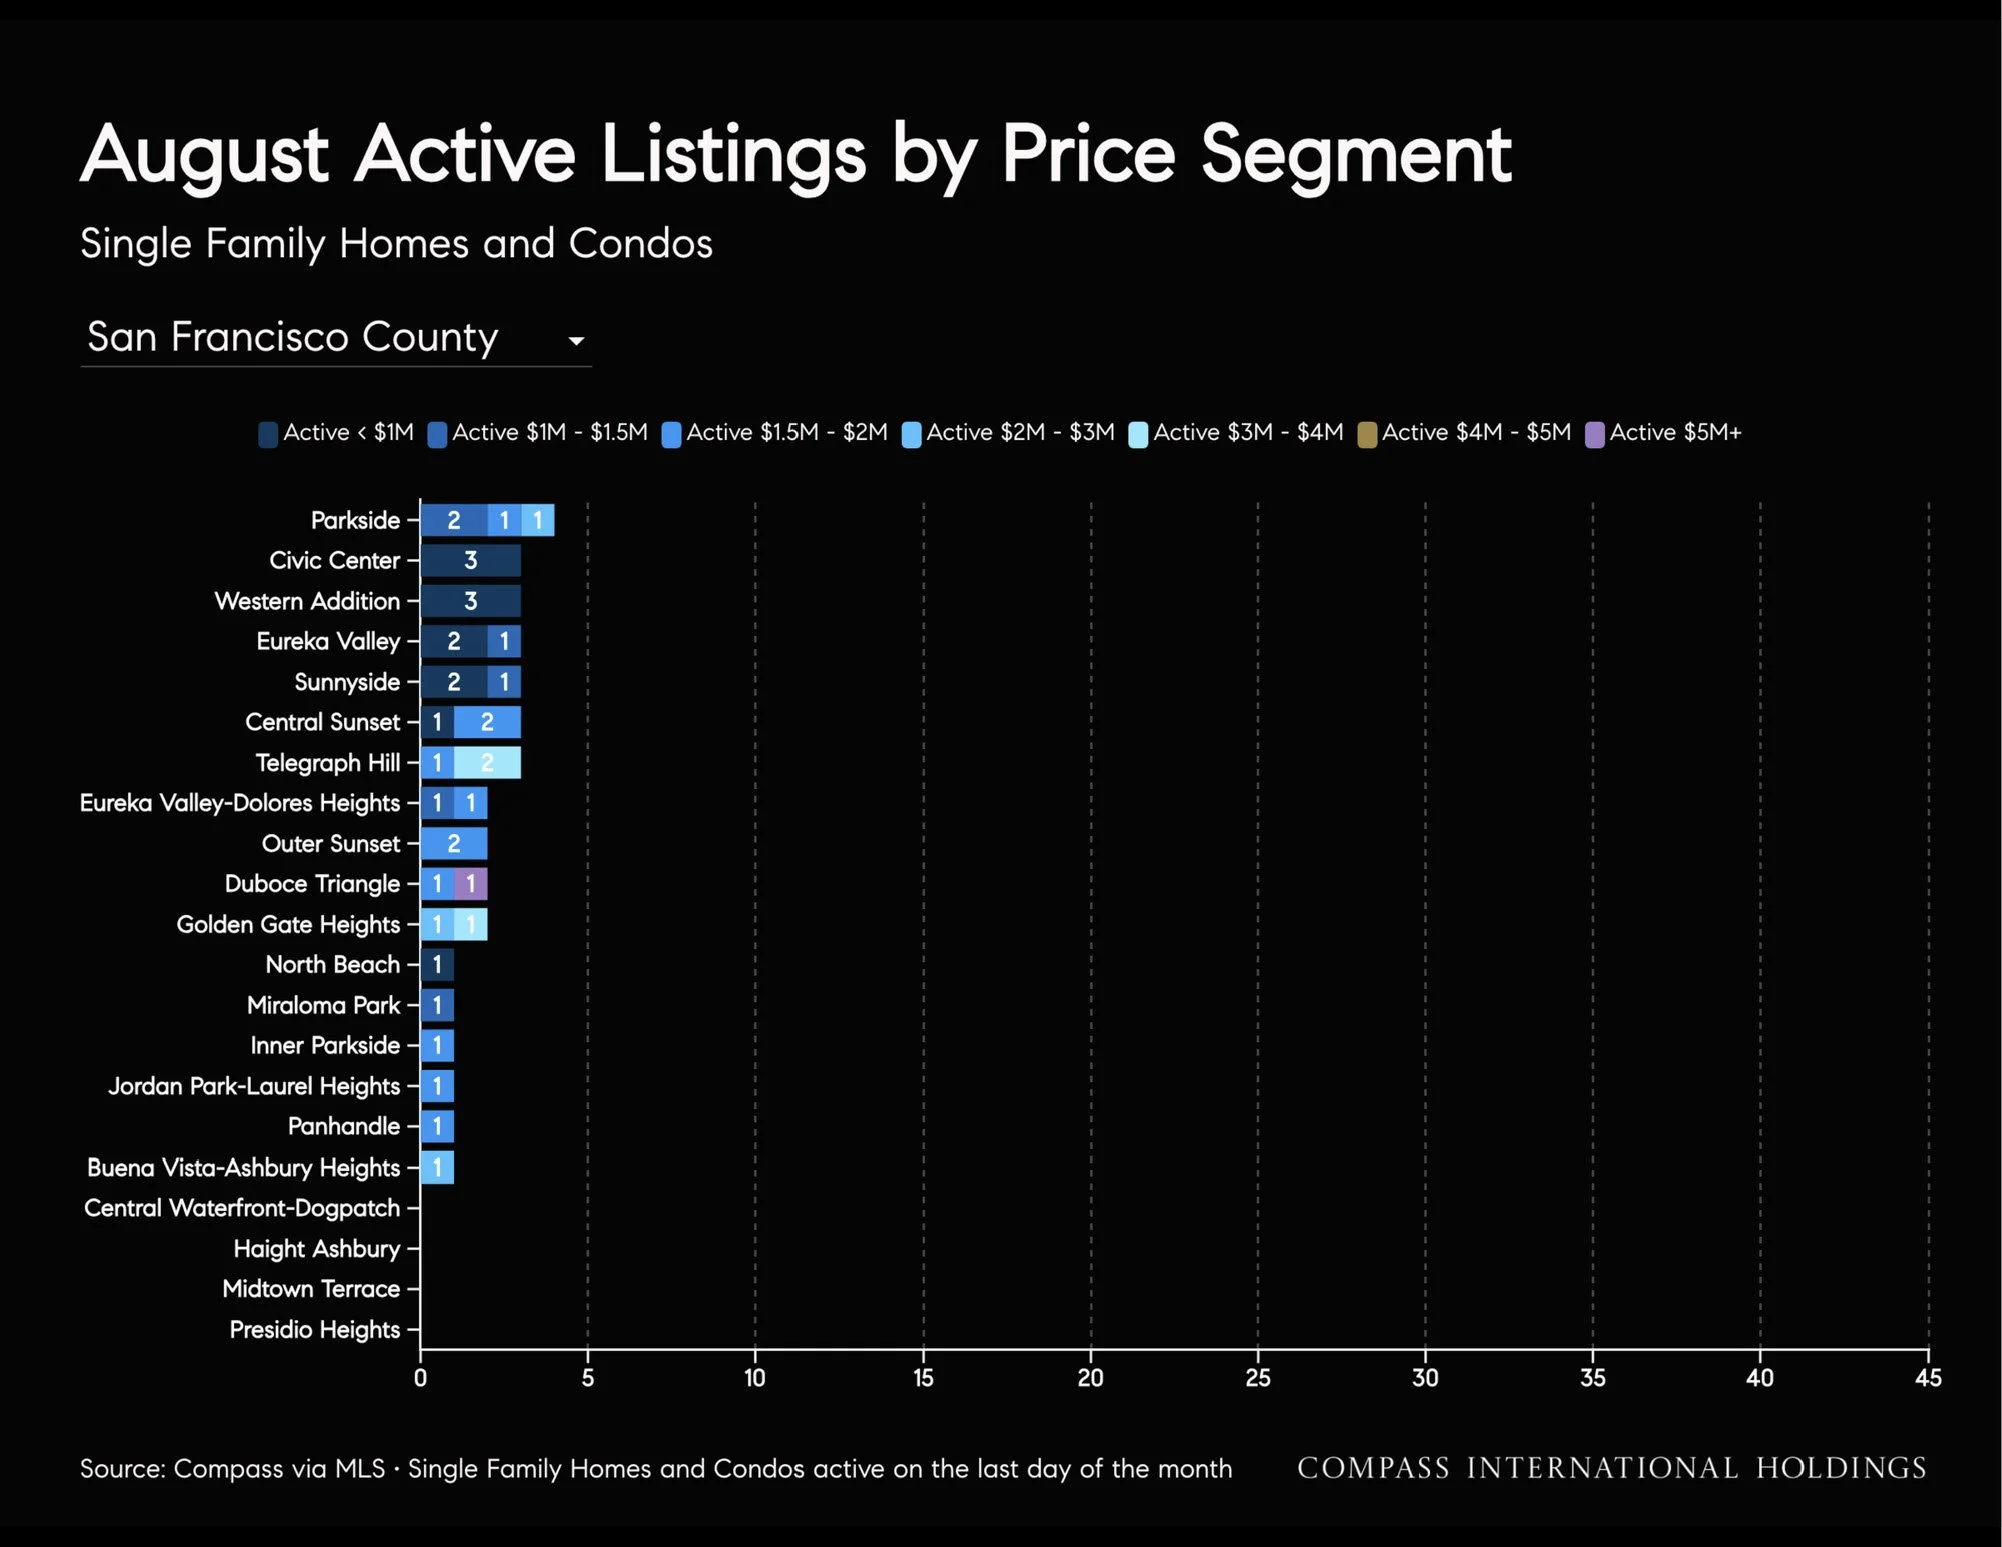
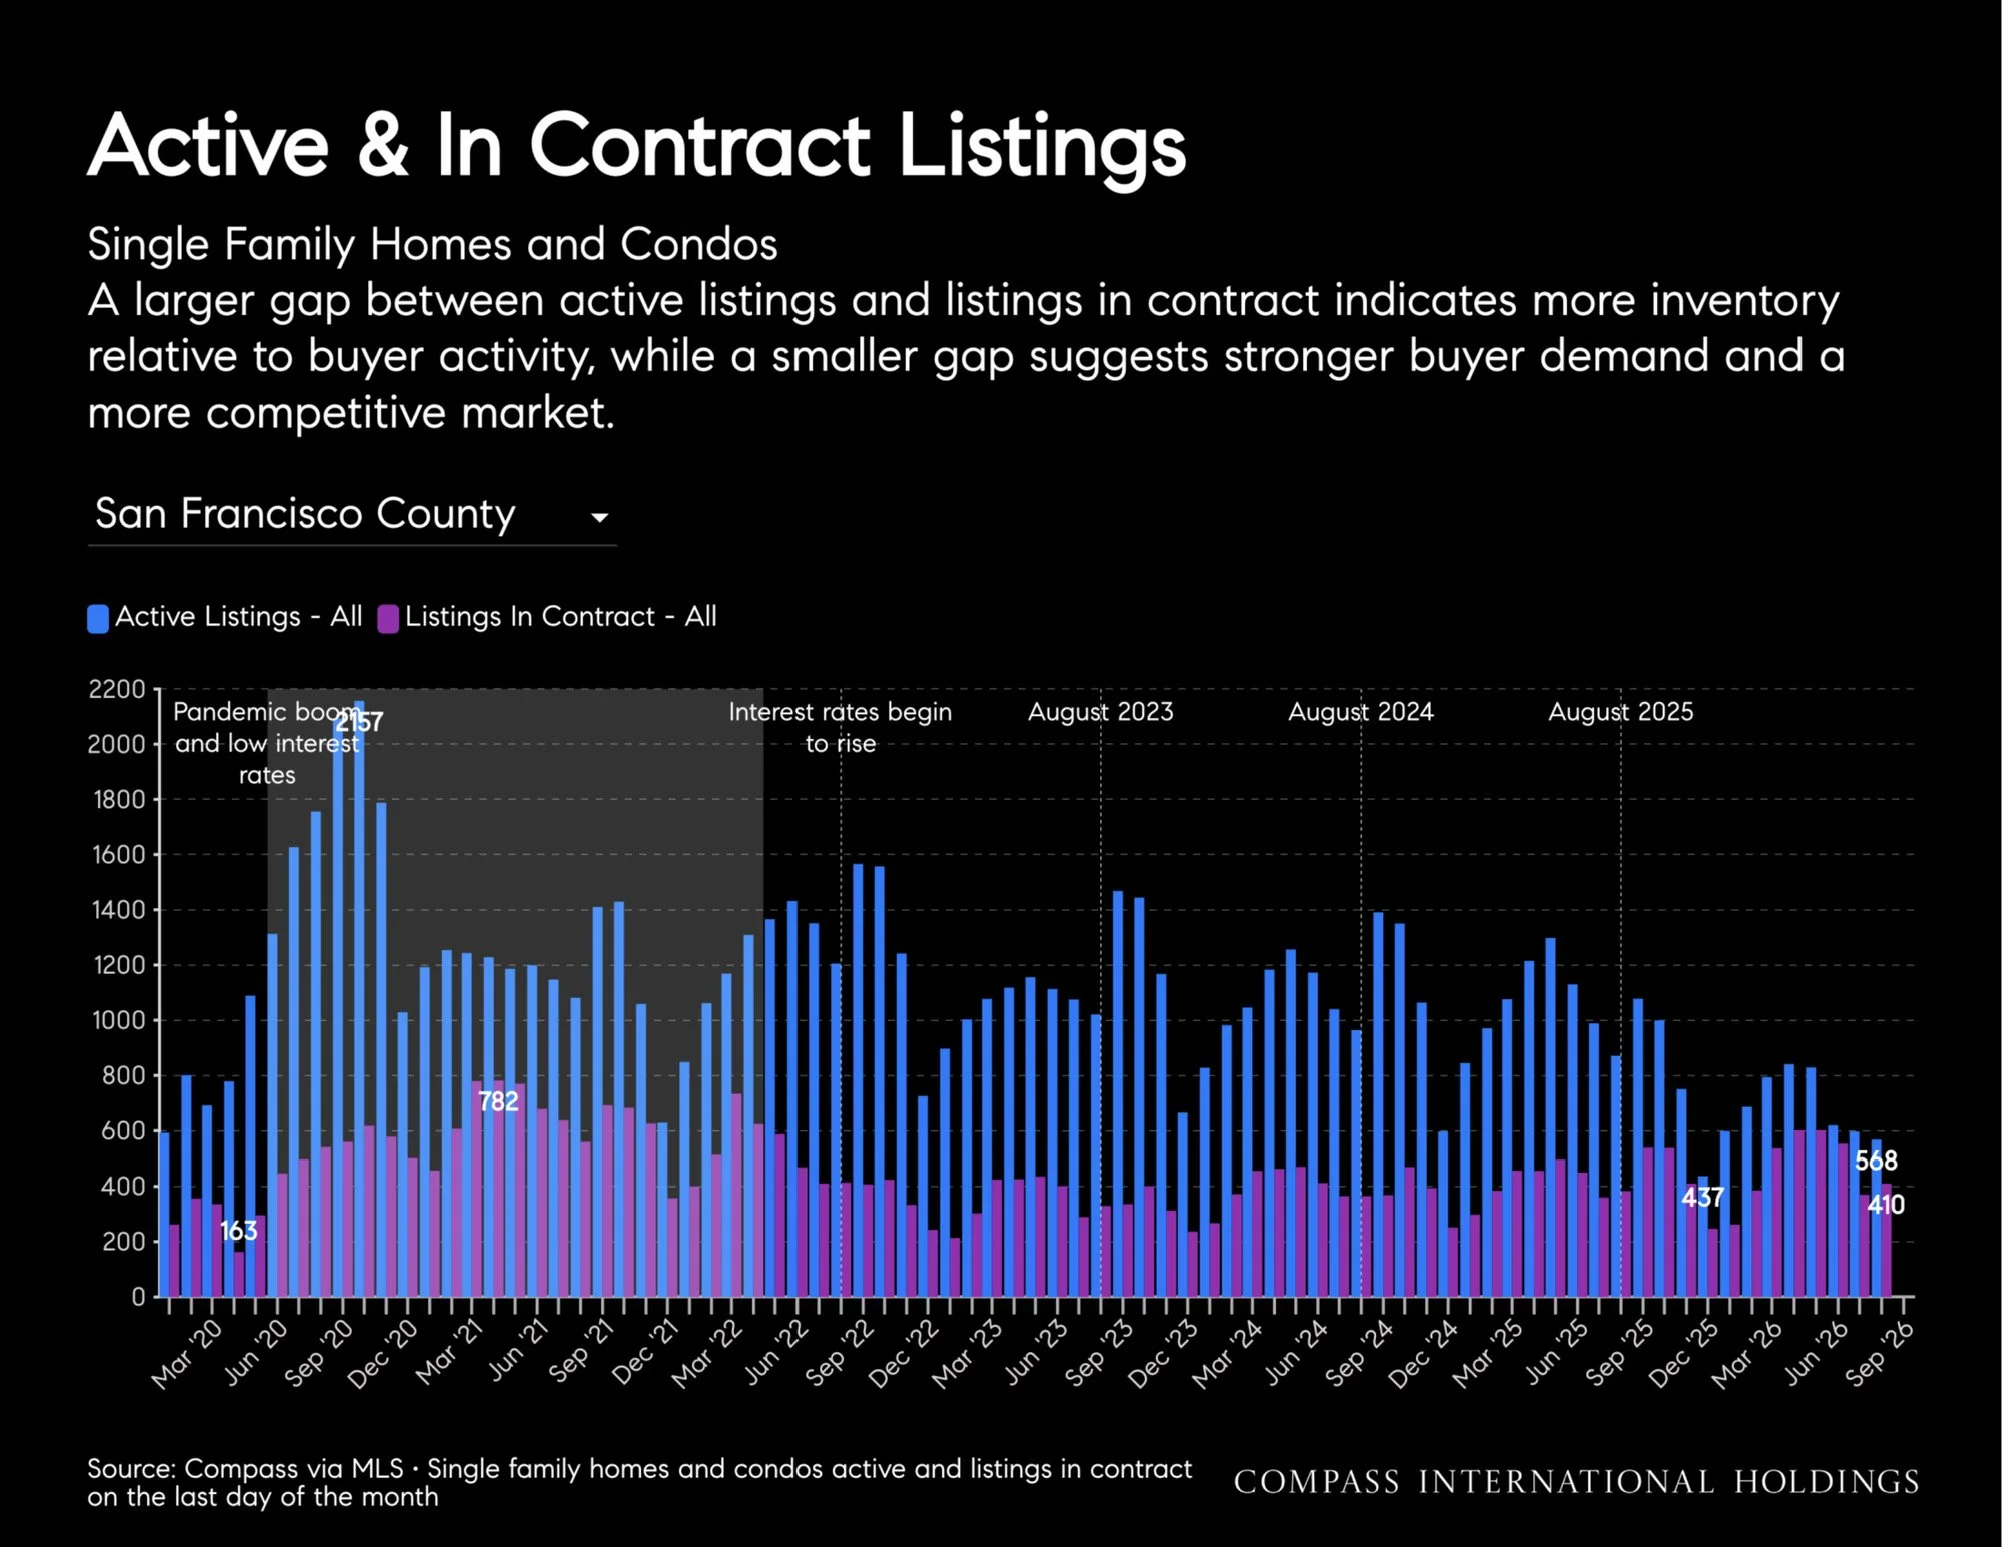
Inventory collapse. San Francisco's active inventory fell 35% year-over-year (570 combined listings) and 36% for condos (411 vs 642). This is the sharpest inventory decline in the region and is directional and real—the market tightened dramatically. The decline is consistent with the city's tight housing, high prices, and constrained supply.
Price strength amid tightness. The condo median rose 22.3% ($1.23M vs $1.01M)—one of the largest YoY gains in the region. This suggests that despite lower inventory and slower sales (-23.5% MoM), prices held firm and climbed, a pattern consistent with sustained demand overwhelming tight supply. Do not interpret lower sales velocity as weak demand; interpret it as a thin market where fewer deals transact at higher prices.
Single-family scarcity. Single-family closed sales fell 35% YoY (150 vs 232), and the median rose 4% to $1.755M. Days-on-market fell from 35 to 27 days—faster liquidity despite lower volume. This is consistent with a high-priced, low-volume market where scarcity and wealth concentrate demand.
Neighborhood complexity. San Francisco's 59 neighborhoods vary sharply in composition, price, and character. Aggregate metrics mask this dispersion. The condo-only neighborhood analysis is more reliable than county totals for understanding micro-markets.
Omissions. Single-family neighborhood analysis are avoided due to insufficient closings; only condo neighborhoods meet the 10 closing per month threshold. This reflects the city's composition: most single-family sales are custom/renovation properties, fewer in number but larger in price. Condo sales are higher-volume.
Guidance. San Francisco's tightening inventory and price strength are genuine. The sales velocity decline does not indicate weakness—it reflects a constrained market. Use the condo neighborhood data for granular analysis; treat the county single-family figures as indices of a small, expensive market.
San Francisco Recap
Sales: 150 single-family homes closed, down 9% YoY and 16% MoM. Condo closings rose 11% YoY to 214 but fell 25% from July.
Prices: Single-family median increased 24% YoY to $1.855M, while the condo median rose 22% to $1.233M. Price per square foot increased 19% for both.
Competition: 85% of single-family sales closed above list, up 18 points YoY—the largest gain in the report. Condo overbidding rose 31 points to 54%.
Speed: Single-family days on market fell from 30 to 21 days, while condos improved from 60 to 44 days.
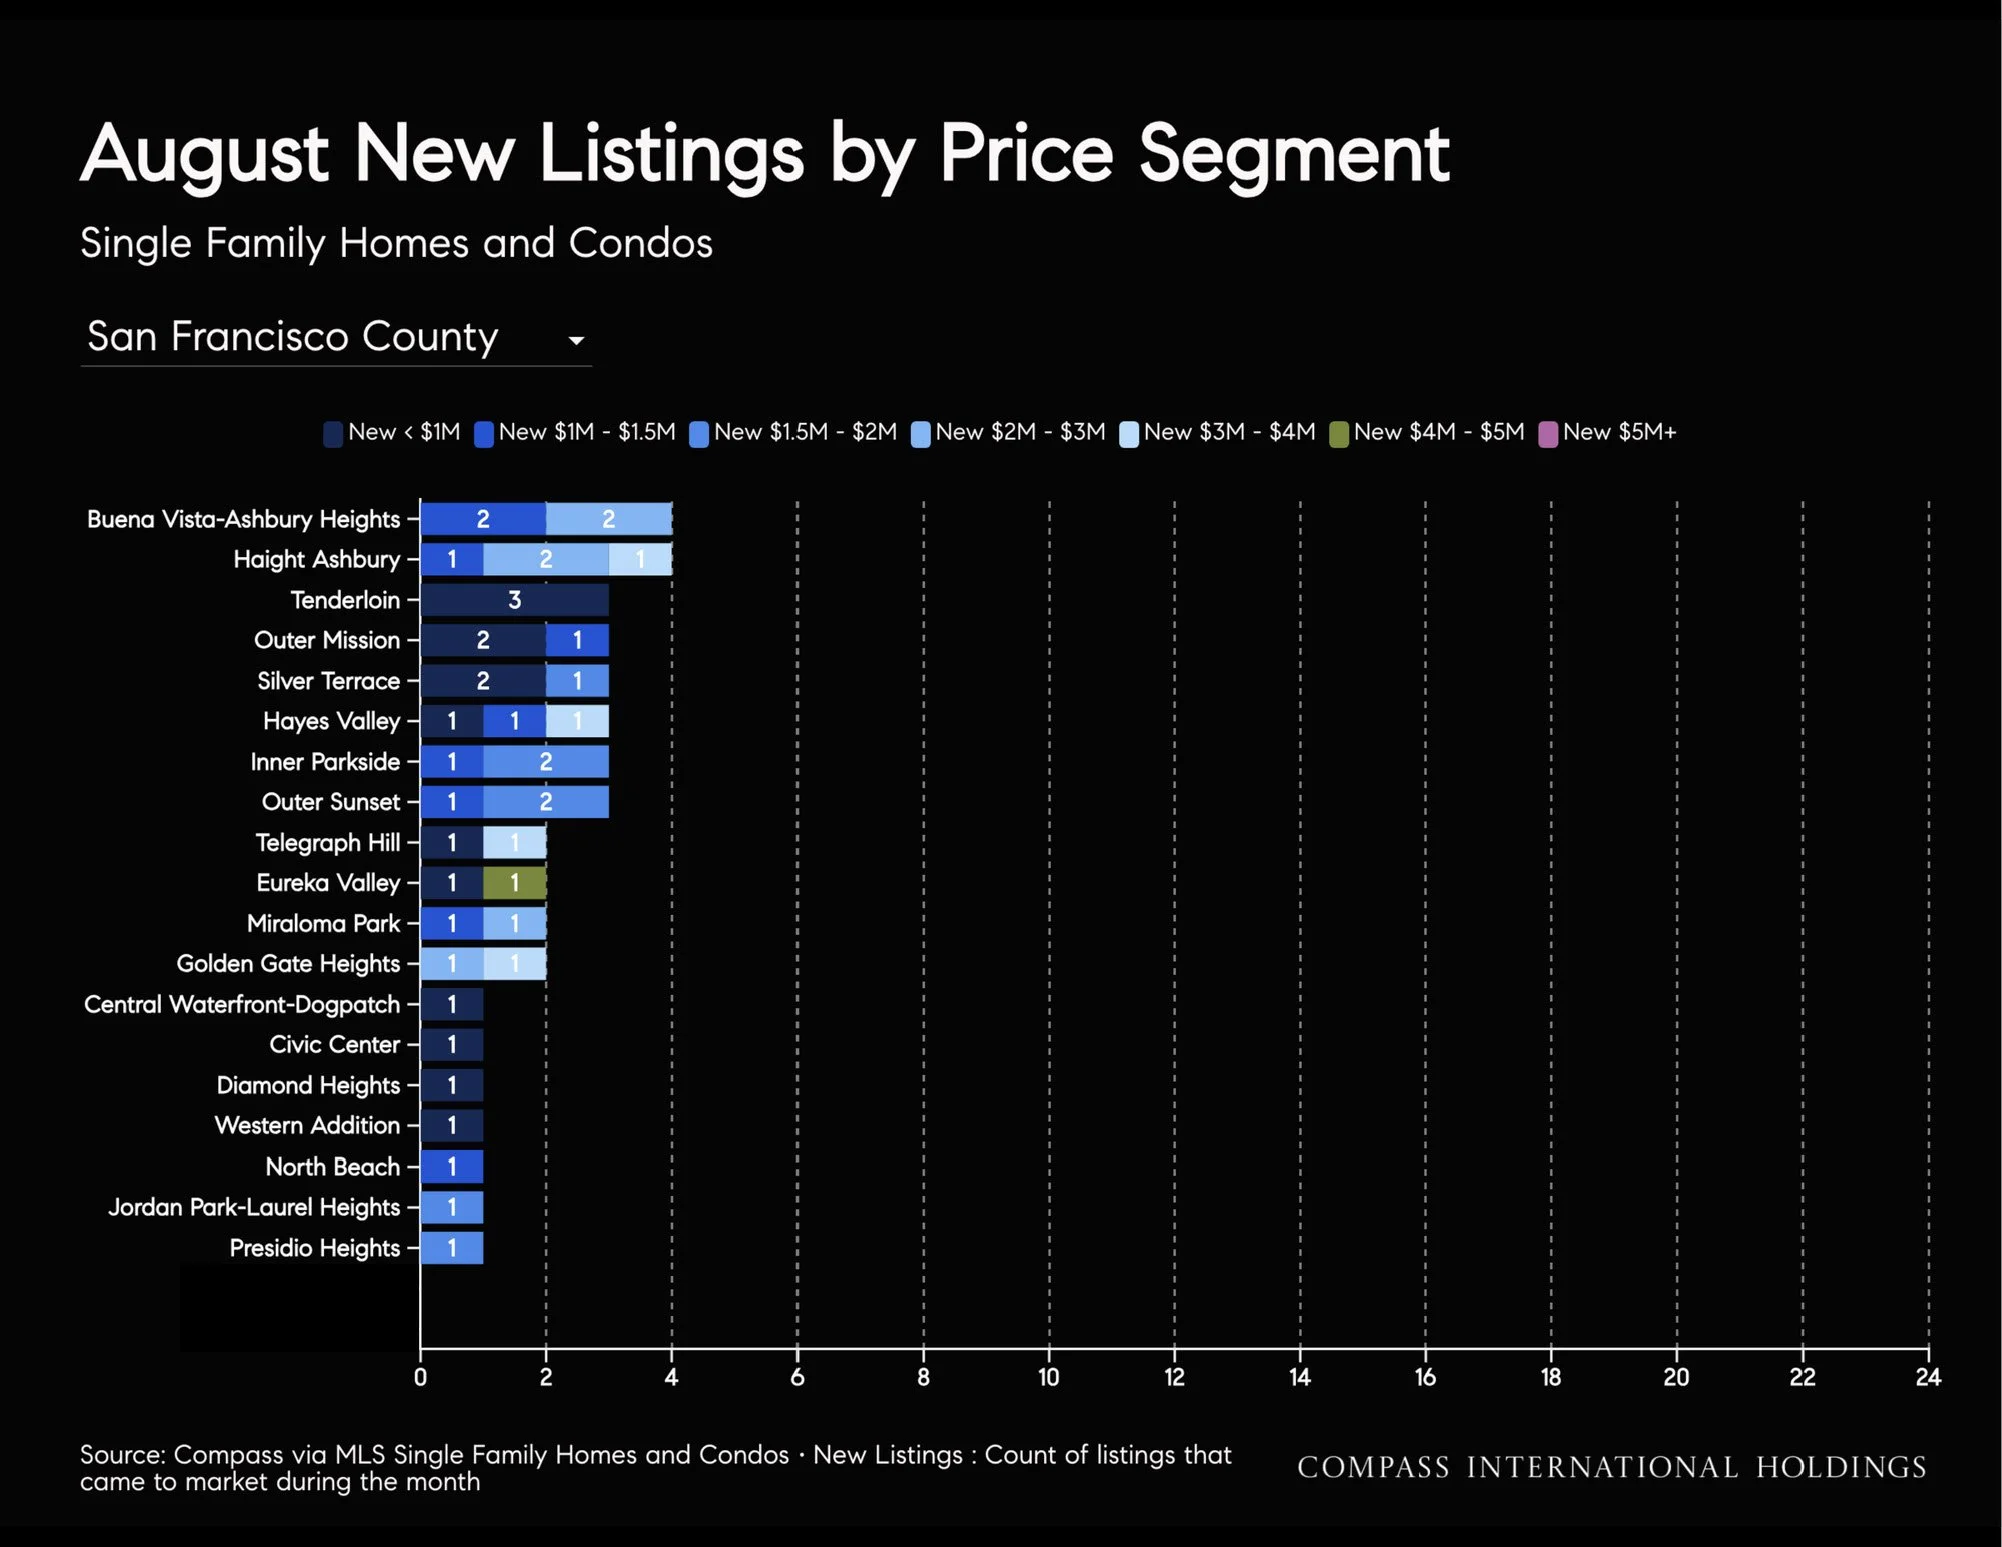
Inventory: Combined active listings plunged 35% YoY to 570 despite a 10% increase in new listings. Single-family actives fell 31% and condos 36%.
Single family: Listings in contract increased 6% to 169 versus only 157 active listings. Absorption reached 108%, while months of supply fell to just 1.0.
Condos: Absorption improved 21 points to 56%, and months of supply declined from 3.3 to 1.9.
MoM: Total closings fell 21%, the largest decline among the counties, but new listings rose 7% and contracts increased 8%. Single-family absorption jumped 17 points.
Bottom line: San Francisco remains the most competitive market in the group. Extremely limited inventory is constraining single-family sales despite strong demand, while condos have also tightened substantially year over year.


Single Family Homes






Condos


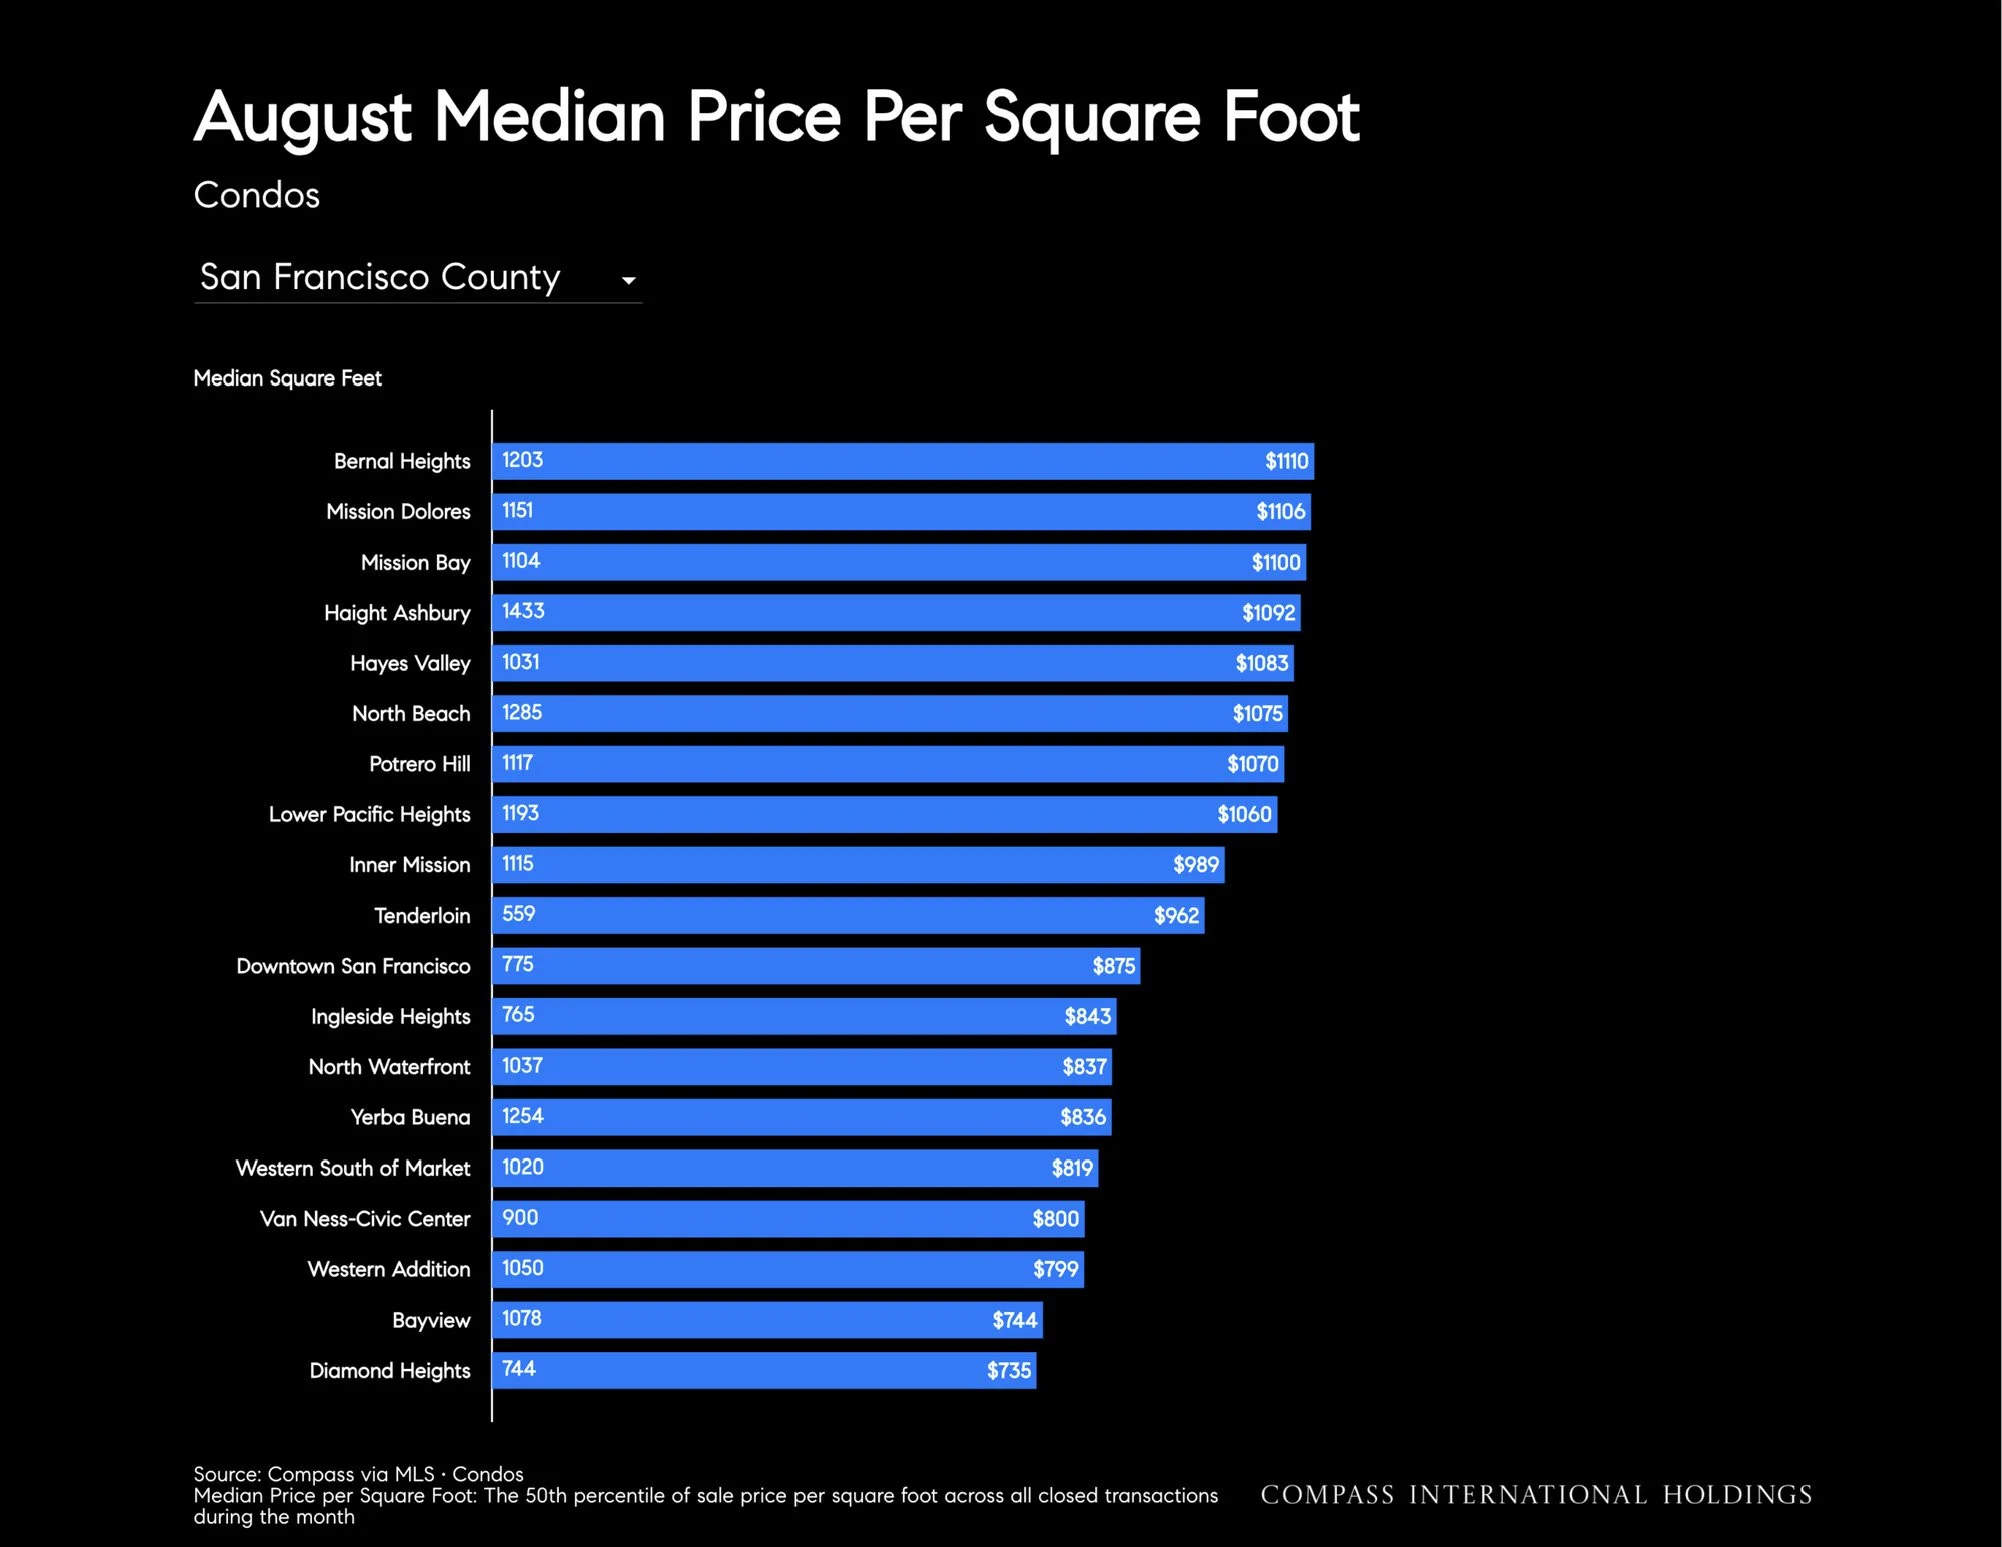

Single Family Homes and Condos




Housing Market Report
Mortgage rates remain stubbornly elevated at 6.8%, near a 15-month high, as government spending, geopolitical tension, and inflation fears keep bond markets on edge. Don't expect meaningful rate relief soon. Inflation, while easing for two straight months, is still running well above the Fed's 2% target. Locally, the story has flipped. Ater years of Bay Area inflation running below the national rate, home price appreciation has resumed.
The labor market sends mixed signals. Nationally, August jobs data showed surprising strength, averaging 80,000 new jobs a month in 2026. That’s good for homebuyer confidence, but also fuel for inflation and higher-for-longer rates. Locally, it's the opposite: the Bay Area has shed jobs five months running, and tech employment keeps contracting nationally. Low hiring rates continue to suppress relocation-driven demand, a key historical driver of home sales.
The bright spots: foreclosures remain near historic lows thanks to high homeowner equity, and Bay Area home prices are outperforming, up 3.3% year-over-year versus 1.5% nationally. Millennials (30-39) now account for the largest share of mortgage borrowers. Perhaps most notably for our market, inbound migration to the Bay Area has turned positive for the first time in years, with Seattle, Austin, and Manhattan feeding new arrivals.


