January 2024 Market Report

Photo by salvatore ventura on Unsplash
Dramatically Improving Economic Indicators Suggest
a Brighter 2024 Housing Market
In the last 2 months of 2023, the average, weekly, 30-year mortgage interest rate dropped from 7.79% to 6.61%. With the fall in inflation this past year, the Fed is widely expected to begin dropping its benchmark rate, probably in multiple steps, in 2024. The consensus forecast among analysts is for further declines in mortgage interest rates.
After its end-of-year rally, the S&P Index was up 25% and the Nasdaq up 45% in 2023 (though it has ticked down in early 2024). This plays a major role in Bay Area household wealth.
On an annual basis, the 2023 median house sales price was down 13% from 2022, while on a quarterly basis, the Q4 price was down less than 1% year-over-year.
The 2023 market was characterized by high interest rates, financial market uncertainty, negative media “doom-loop” narratives (terribly overdone), social/economic issues pertaining to the downtown district, and a low supply of new listings in most neighborhoods – generally much lower for houses than for condos. Total sales volume plunged, while for many prospective sellers, the motivation to move was reduced by the mortgage lock-in effect. With interest rates falling, media coverage turning more positive, AI companies expanding in downtown, and economic conditions and consumer confidence rebounding, the direction is trending positive for San Francisco real estate.
Note: As often seen in recent years, the complex economic, political and social factors affecting interest rates, inflation, consumer confidence, and housing and financial markets can change quickly in unexpected ways. Forecasts and predictions are best guesses based on the interpretation of recent economic data and trends.
“Inflation around the globe is slowing way faster than expected. If economists are right...next year [will see] inflation back to normal levels for the first time in three years.”
— Wall Street Journal, 12/24/23, “For Much of the World, Inflation Will Be Normal in 2024 – Finally”“Consumer sentiment...soared 14% in December [due to] substantial improvements in how consumers view the trajectory of inflation...All age, income, education, geographic, and political identification groups saw gains in sentiment...[2024] inflation expectations plunged from 4.5% last month to 3.1% this month.”
— University of Michigan, Consumer Sentiment Index, December 2023“Housing starts surged to a six-month high, sales of previously owned homes picked up from a 13-year low and builder optimism boosted by increased interest from prospective buyers. Meanwhile, Americans’ home-buying plans rose this month by the most in more than a year. The bounce back comes as mortgage rates have declined by...the biggest drop over a comparable period since 2009.”
— Bloomberg News, 12/20/23, “US Housing Market Shows Signs of Life After Mortgage Rates Fall”“The 30-year fixed-rate mortgage remained below 7%...after 17 consecutive weeks above. Lower rates are bringing potential homebuyers who were previously waiting on the sidelines back into the market...Heading into the new year, the economy remains on firm ground with solid growth, a tight labor market, decelerating inflation, and a nascent rebound in the housing market.”
— Freddie Mac, 12/21/23 & 12/28/23
Changes in economic indicators didn’t begin to affect market psychology until early-mid November, right before the big holiday slowdown, and the homebuying process takes 30 to 60 days from loan qualification and offer acceptance to closed sale. Significant effects on sales statistics will not begin to show up until early 2024 data starts to become available.
Mortgage Interest Rates in 2023
30-Year Conforming Fixed-Rate Loans, Weekly Average Readings*

*Freddie Mac (FHLMC), 30-Year Fixed Rate Mortgage Weekly Average: https://www.freddiemac.com/pmms. Data from sources deemed reliable. Different sources of mortgage data sometimes vary in their determinations of daily and weekly rates. Data from sources deemed reliable, but may contain errors. All numbers approximate.
Per Freddie Mac (FHLMC), on December 28, 2023, the weekly average, 30-year interest rate declined for the 9th week, to 6.61%.(For 15-year loans, the rate was 5.93%.)
San Francisco Median House Prices
Median House Sales Price by Year, 1993 – Present*
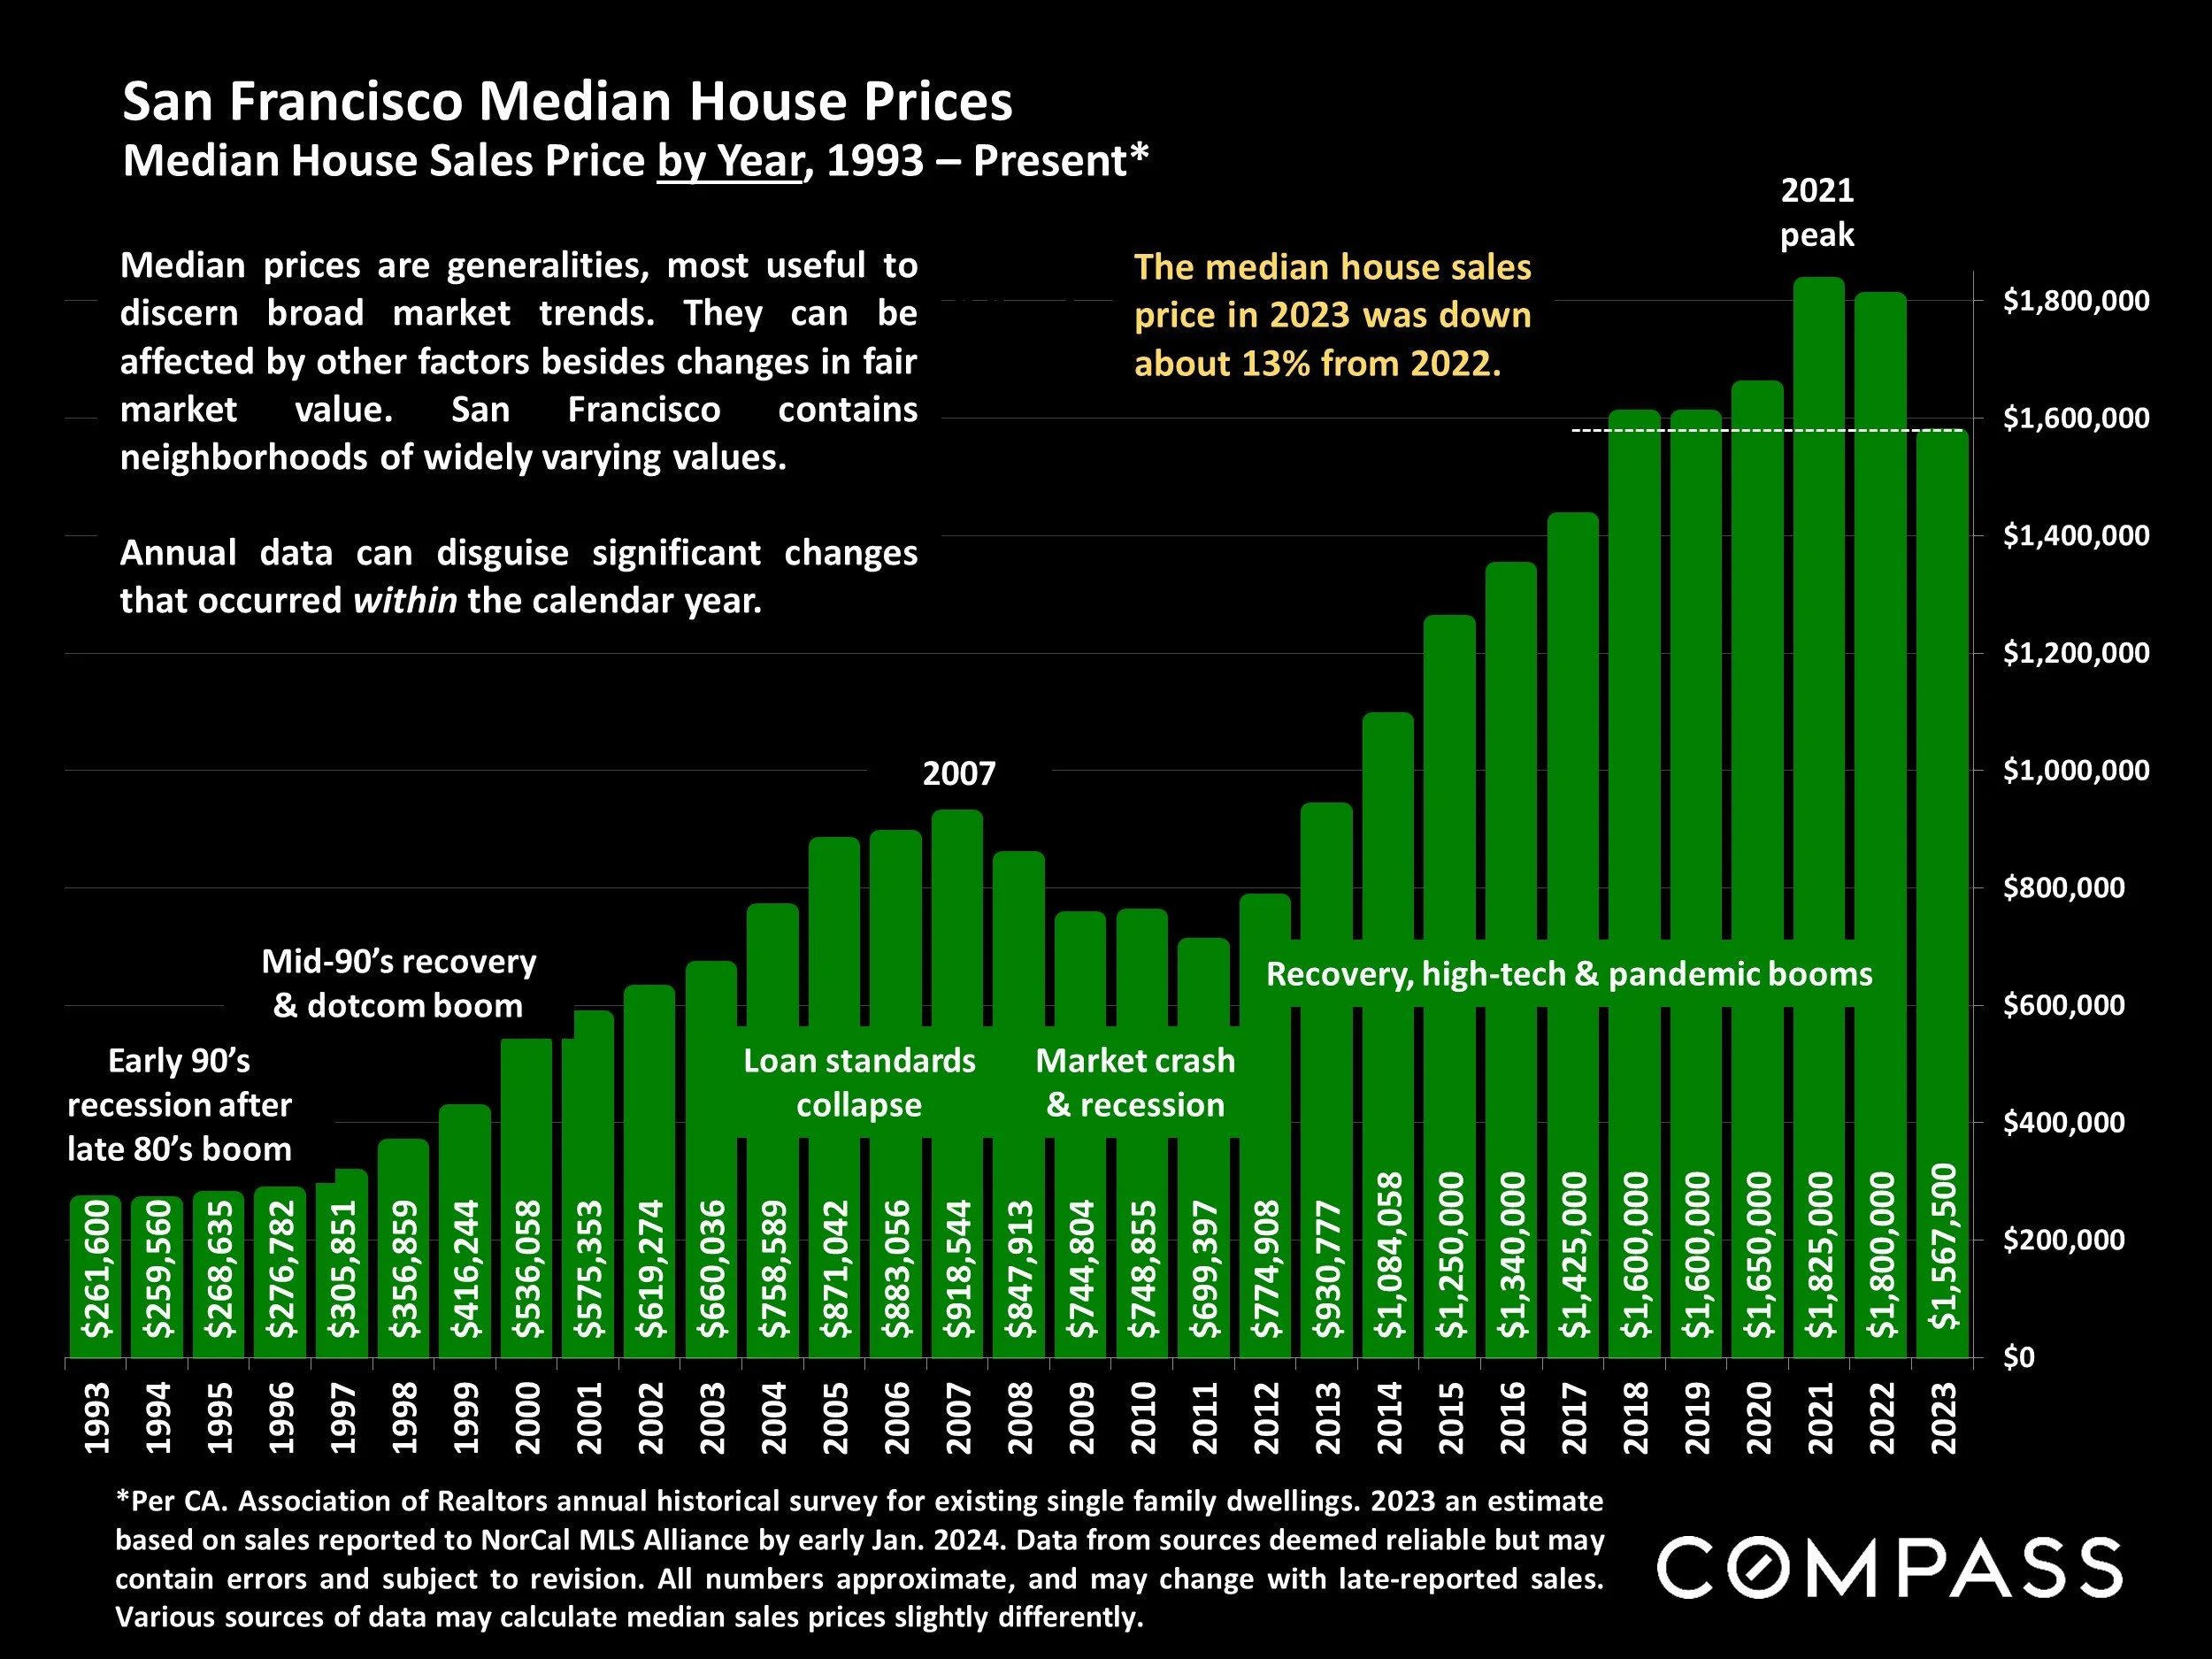
*Per CA. Association of Realtors annual historical survey for existing single family dwellings. 2023 an estimate based on sales reported to NorCal MLS Alliance by early Jan. 2024. Data from sources deemed reliable but may contain errors and subject to revision. All numbers approximate, and may change with late-reported sales. Various sources of data may calculate median sales prices slightly differently.
The median house sales price in 2023 was down about 13% from 2022.
Median prices are generalities, most useful to discern broad market trends. They can be affected by other factors besides changes in fair market value. San Francisco contains neighborhoods of widely varying values.
Annual data can disguise significant changes that occurred within the calendar year.
San Francisco House Price Trends
Median House Sales Prices, 2012 – Present, by Quarter

As reported to NORCAL MLS® ALLIANCE, per Broker Metrics or Infosparks. All numbers are approximate and subject to revision. Last quarter may change with late reported sales.
Year over year, the Q4 2023 median house sales price was down less than 1% from Q4 2022.
Median sales price is that price where half the homes sold for more and half for less. It is a very general statistic that disguises a wide range of prices in the underlying sales.
Seasonal fluctuations are common, and it’s not unusual for median sales prices to peak for the year in Q2.
San Francisco Median Condo Prices
Median Condo Sales Price by Year, 1993 – Present

Per sales reported to NorCal MLS Alliance by early January 2024. Median sales price is that price at which half the sales occurred for more and half for less. Data from sources deemed reliable but may contain errors and subject to revision. All numbers approximate, and may change with late-reported sales.
The 2023 median condo sales price was down about 6% from 2022.
Median prices are generalities, most useful to discern broad market trends. They can be affected by other factors besides changes in fair market value. The city contains condo projects and neighborhoods of widely varying values. Annual data can disguise significant changes that occur within the calendar year.
San Francisco Condo Price Appreciation
Median Condo Sales Prices, 2012 – Present, by Quarter

As reported to NORCAL MLS® ALLIANCE, per Broker Metrics/Infosparks. All numbers are approximate and subject to revision. Last quarter may change with late reported activity. Does not include new-project condo sales unreported to MLS.
Year over year, the Q4 2023 median condo sales price was down about 1% from Q4 2022.
Seasonal fluctuations are common. It is not unusual for median sales prices to peak for the calendar year in Q2. Different city districts have been see varying median price trends.
San Francisco Median Condo Prices
Median Sales Prices by Year since 2005

Per sales reported to NorCal MLS Alliance. Median sales price is that price at which half the sales occurred for more and half for less. Data from sources deemed reliable but may contain errors and subject to revision. All numbers approximate, and may change with late-reported sales.
Comparing median condo sales prices between the greater Downtown/South of Market/Civic Center district – hit hardest by negative pandemic economic/social effects – and the rest of San Francisco.
San Francisco Median Condo & TIC Prices
Median Sales Prices by Year, 2000 – Present
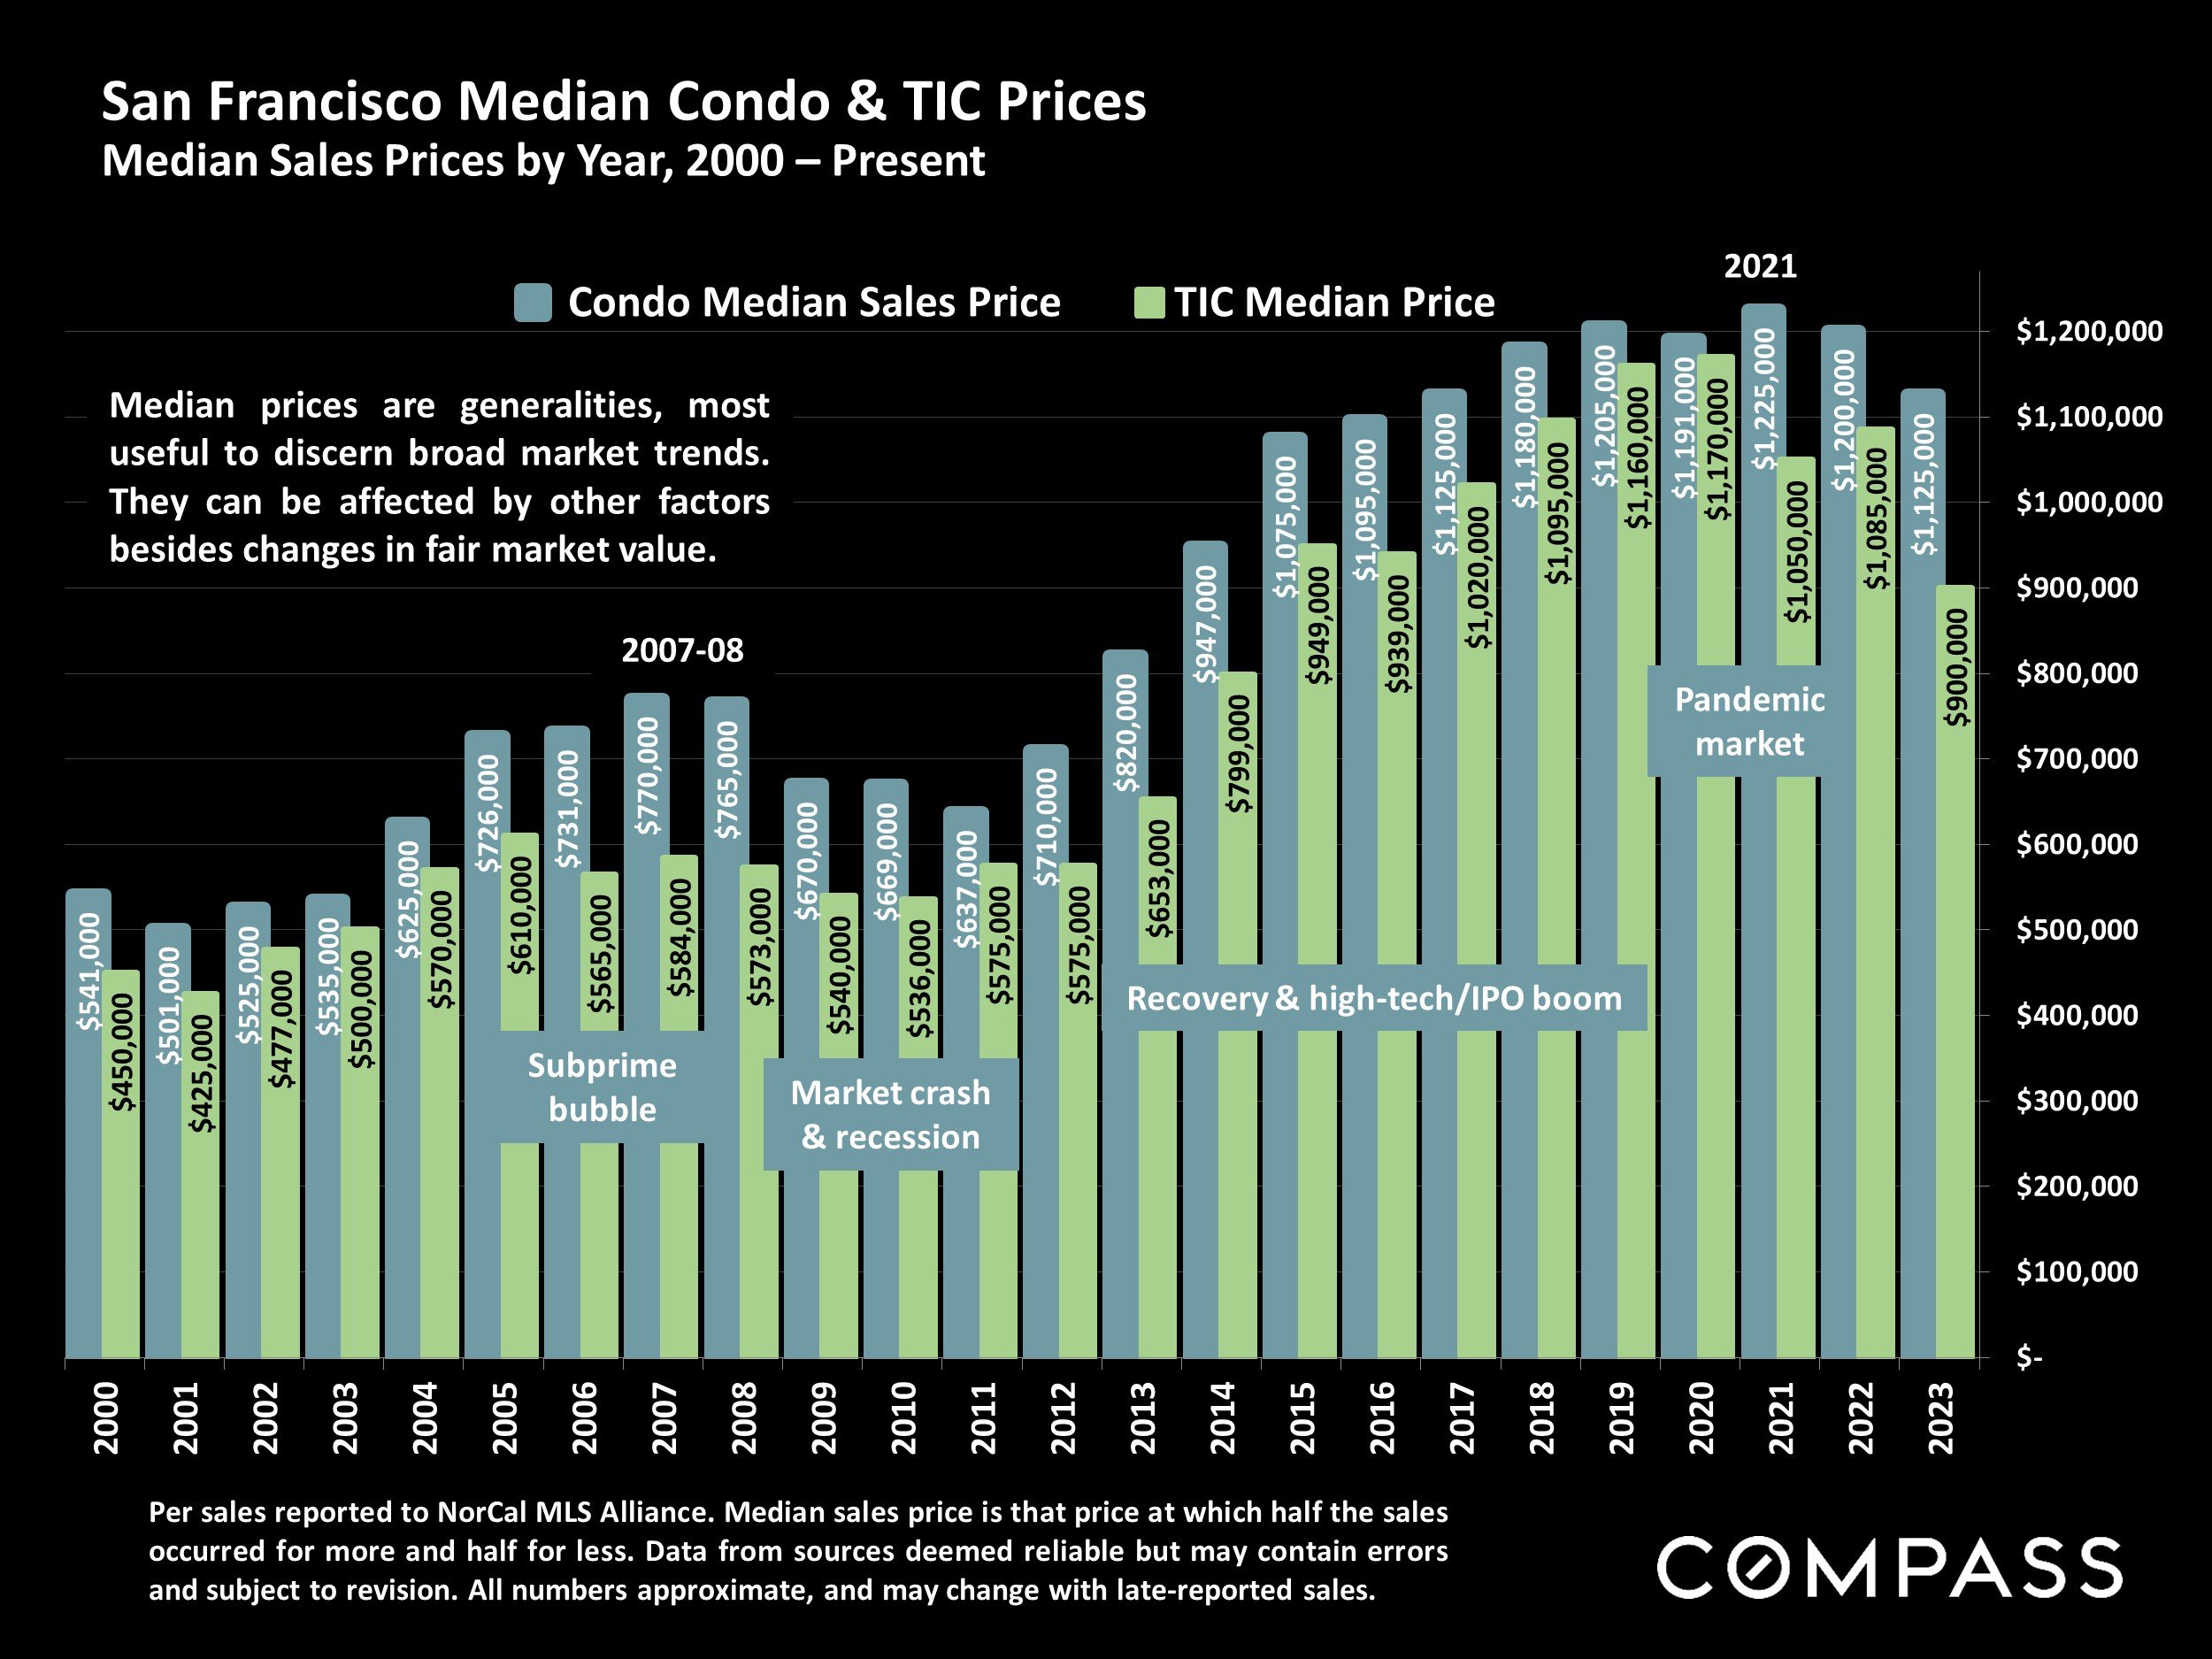
Per sales reported to NorCal MLS Alliance. Median sales price is that price at which half the sales occurred for more and half for less. Data from sources deemed reliable but may contain errors and subject to revision. All numbers approximate, and may change with late-reported sales.
Median prices are generalities, most useful to discern broad market trends. They can be affected by other factors besides changes in fair market value.
San Francisco Median $/Sq.Ft. Values
Median Home Values by Year since 2005*
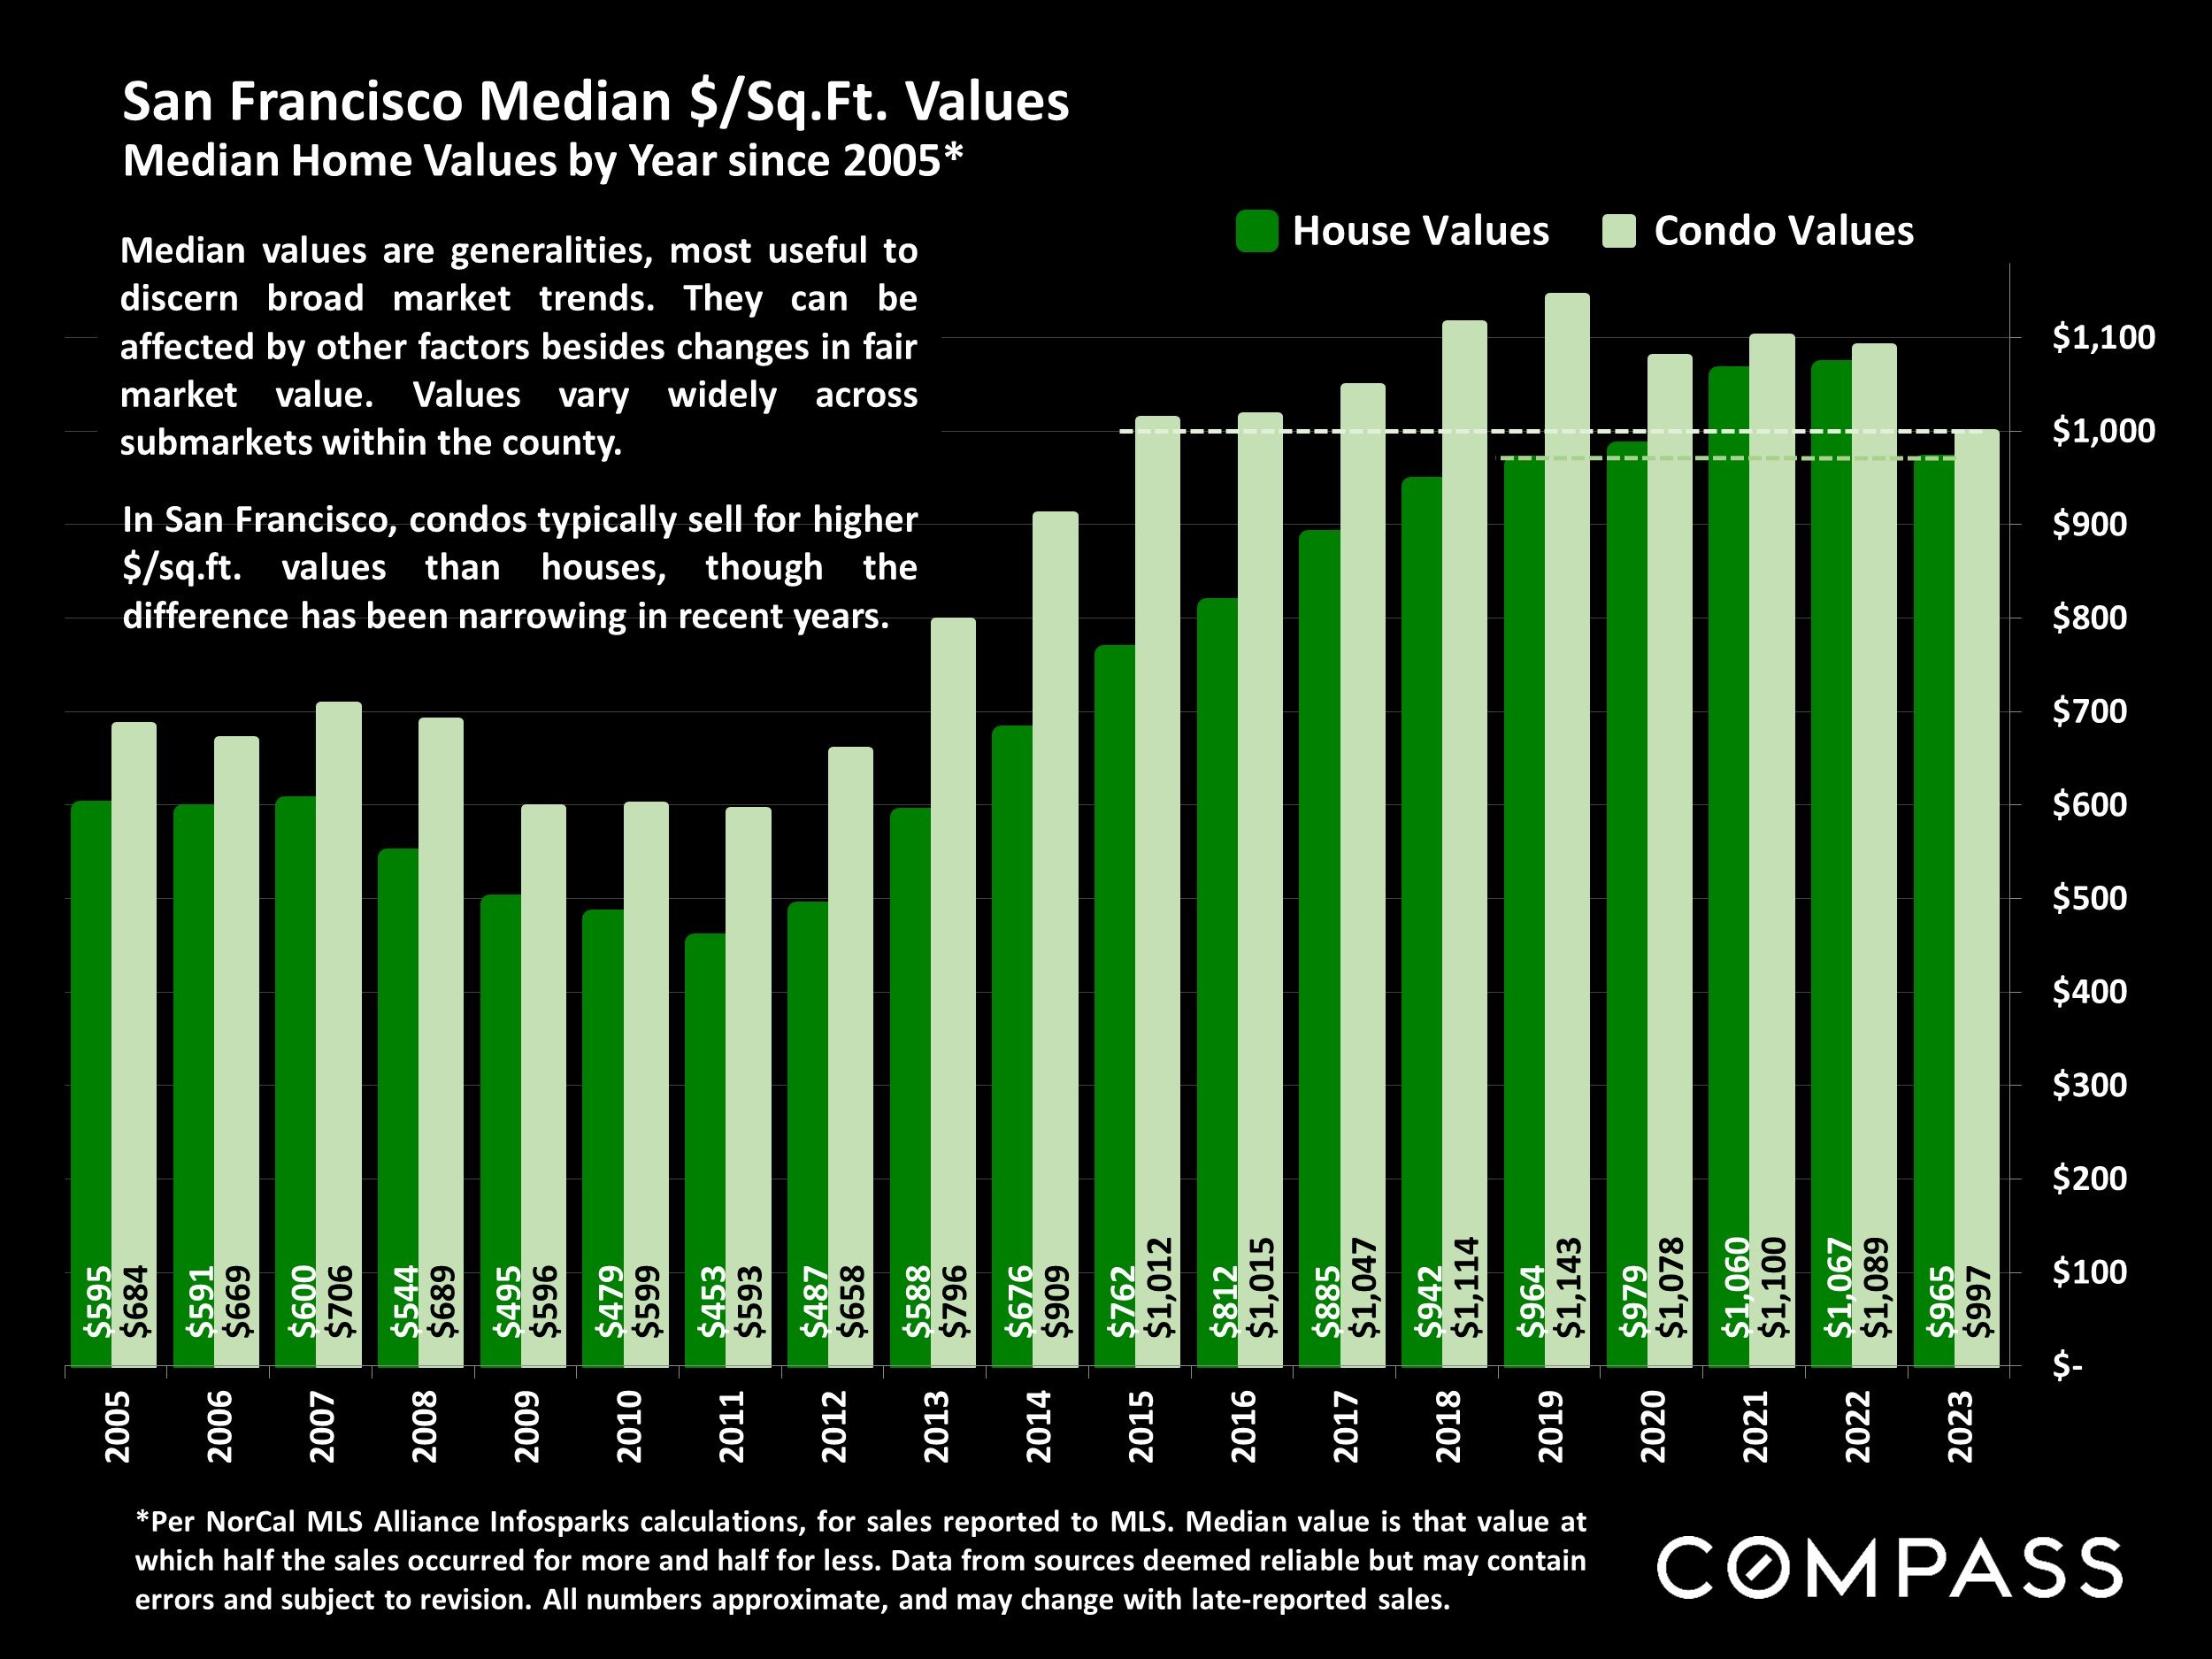
*Per NorCal MLS Alliance Infosparks calculations, for sales reported to MLS. Median value is that value at which half the sales occurred for more and half for less. Data from sources deemed reliable but may contain errors and subject to revision. All numbers approximate, and may change with late-reported sales.
Median values are generalities, most useful to discern broad market trends. They can be affected by other factors besides changes in fair market value. Values vary widely across submarkets within the county.
In San Francisco, condos typically sell for higher$/sq.ft. values than houses, though the difference has been narrowing in recent years.
San Francisco Annual New-Listing Volume
Number of New Listings Coming on Market by Year, since 2005*

*All attached and detached residential home listings posted to NorCal MLS Alliance per Infosparks calculations in early January 2024. Data from sources deemed reliable but may contain errors and subject to revision. All numbers approximate, and may change due to late-reported activity. Not all listings are posted to MLS. In San Francisco, many new-project condo sales are not posted.
The number of new listings in 2023 was the lowest in decades.
San Francisco Annual Sales Volume
Number of Home Sales by Year, since 2005*

*All attached and detached residential home sales reported to NorCal MLS Alliance per Infosparks calculations. Data from sources deemed reliable but may contain errors and subject to revision. All numbers approximate, with last year’s total estimated based on available data in early January, and may change due to late-reported sales. Not all sales are reported to MLS. In San Francisco, many new-project condo sales are not reported.
2023 sales volume was down about 27% from 2022.
Sales volume is affected by both buyer demAnnand aual nd theSalesnumber of listings available to purchase, which are deeply impacted by positive and negative economic conditions. Large shifts can occur within a single calendar year, as occurred in 2022.
San Francisco Residential Market
2023 Home Sales by Price Segment*
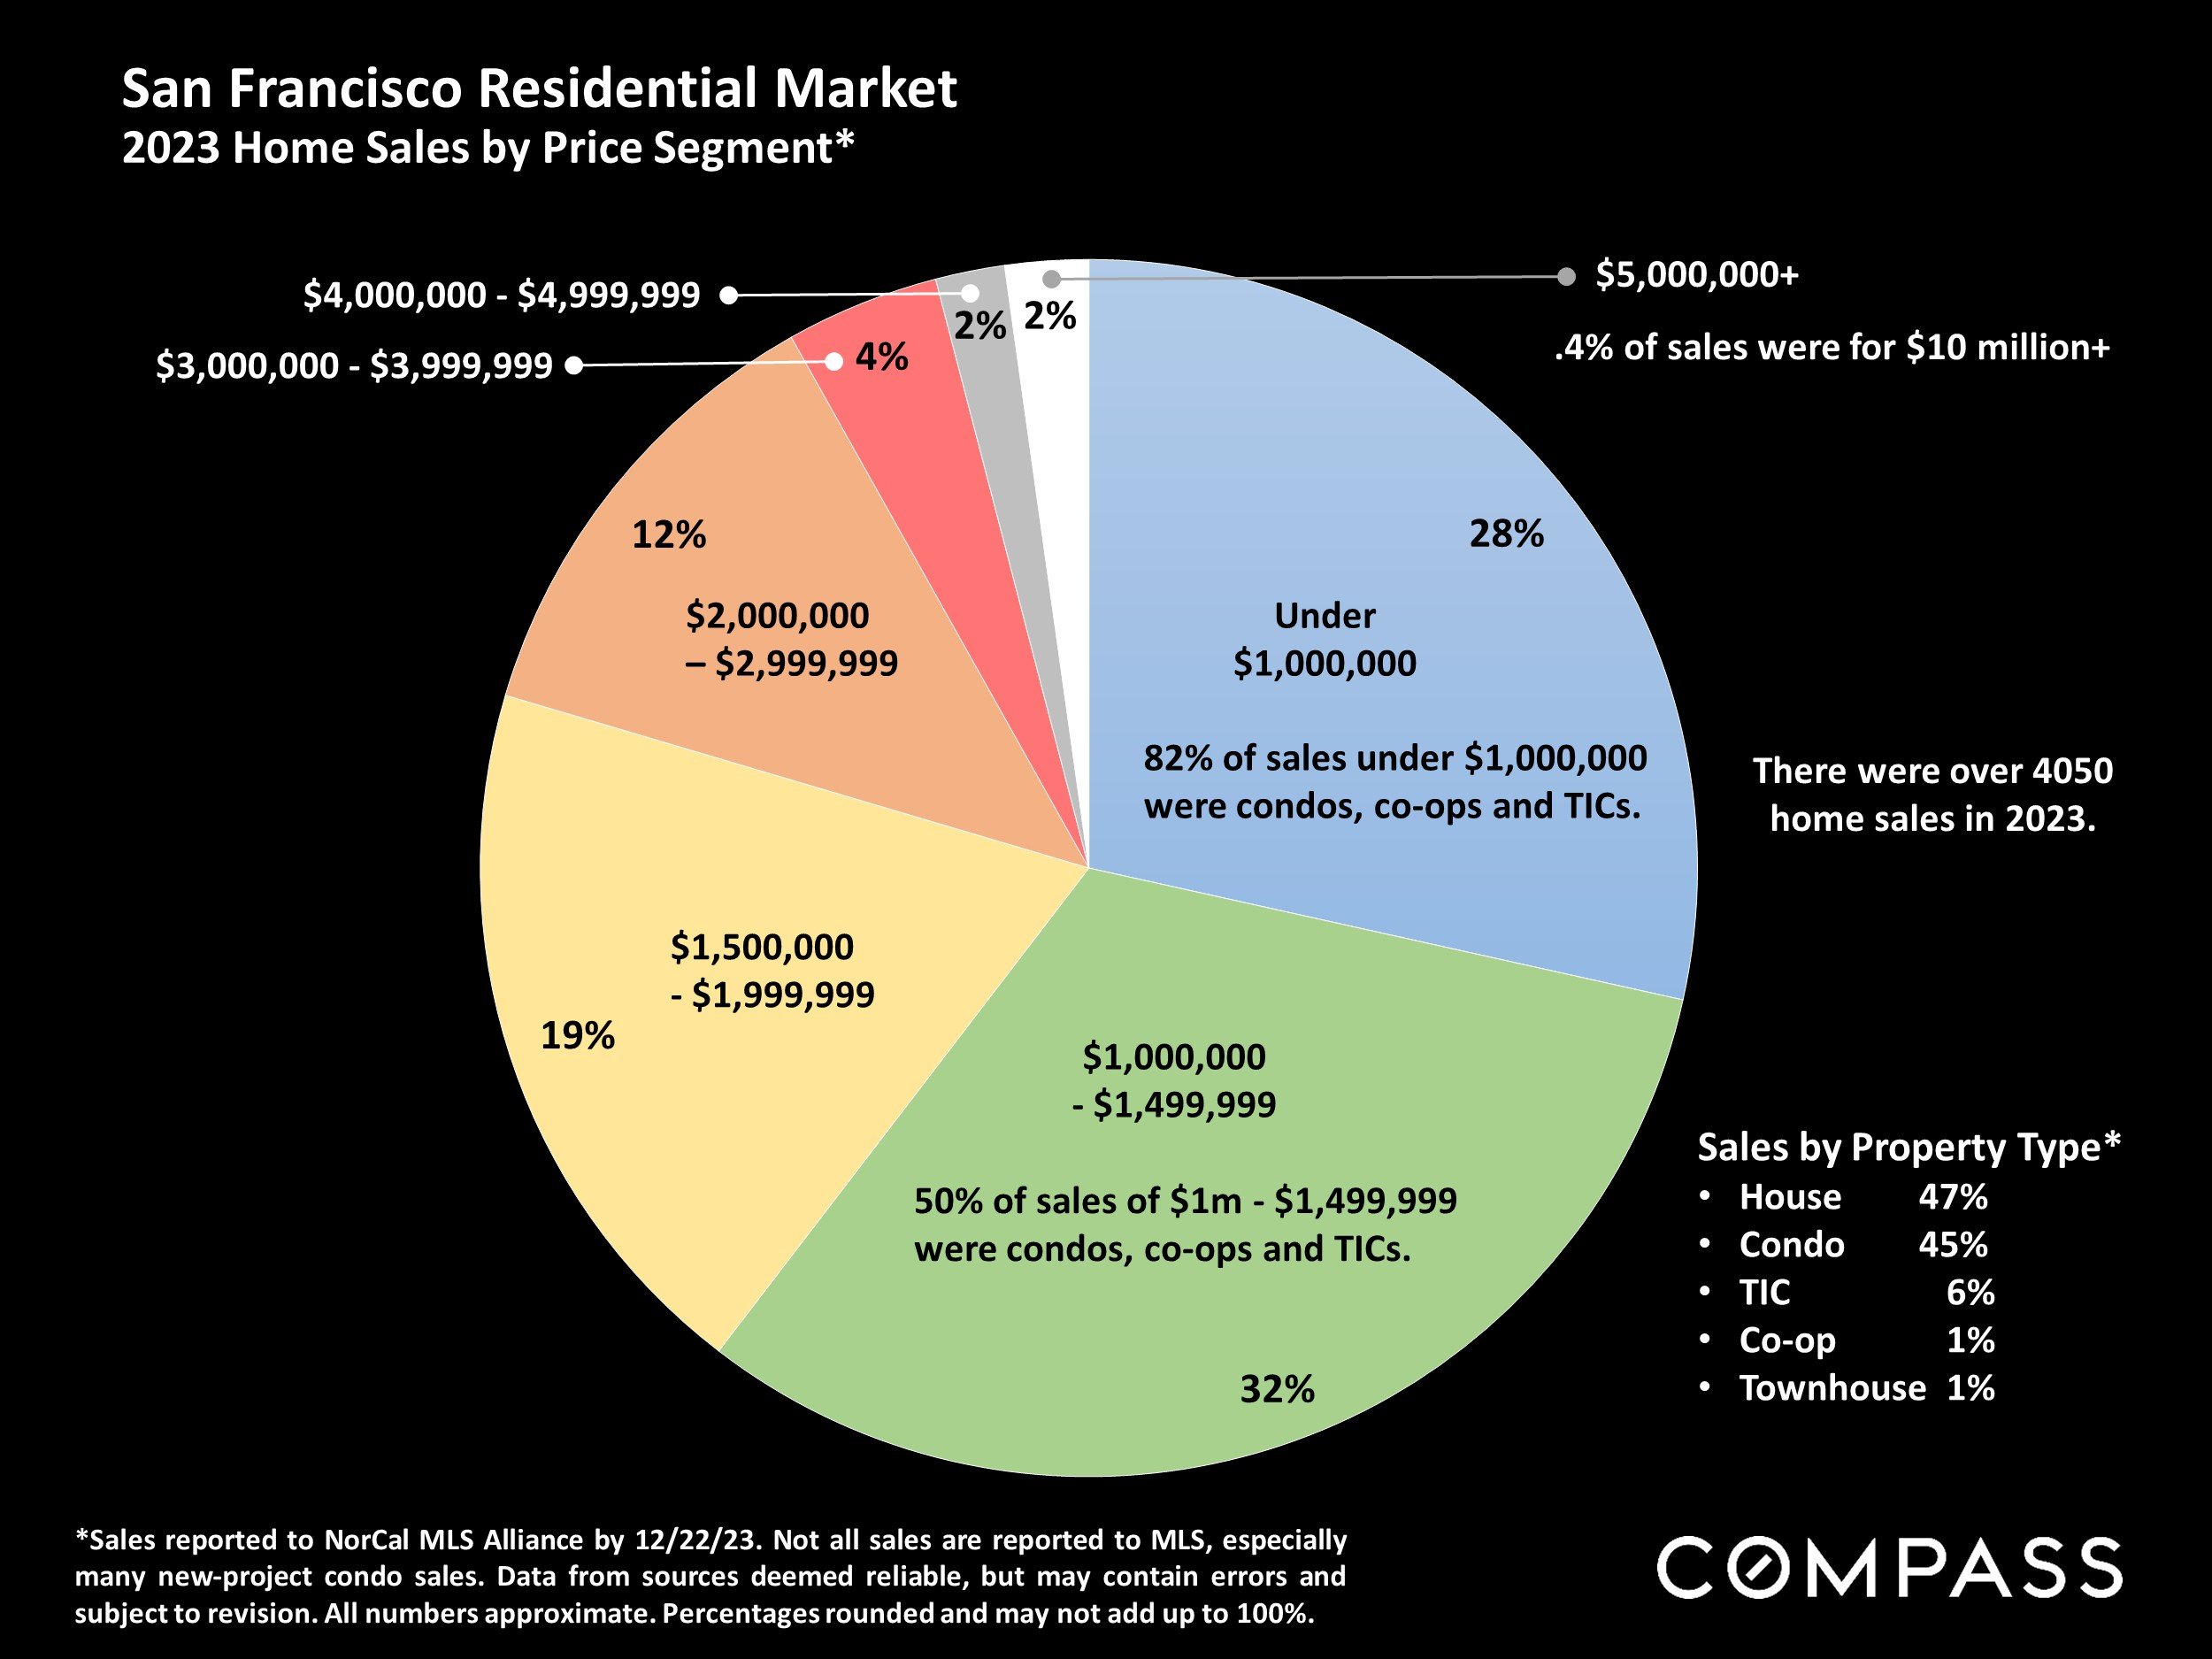
*Sales reported to NorCal MLS Alliance by 12/22/23. Not all sales are reported to MLS, especially many new-project condo sales. Data from sources deemed reliable, but may contain errors and subject to revision. All numbers approximate. Percentages rounded and may not add up to 100%.
There were over 4050 home sales in 2023.
Sales by Property Type*
House 47%
Condo 45%
TIC 6%
Co-op 1%
Townhouse 1%
0.4% of sales were for $10 million+. 82% of sales under $1,000,000 were condos, co-ops and TICs. 50% of sales of $1m - $1,499,999 were condos, co-ops and TICs.
San Francisco: 2023 Market Dynamics by Property Type & Price
Average Months-Supply-of-Inventory (MSI) Readings*

*An average of monthly MSI readings in 2023 through November: Sales reported to SFARMLS, per Broker Metrics. Outlier data adjusted when identified. Data from sources deemed reliable, but may contain errors and subject to revision. All numbers approximate.
MSI measures the number of months it would take to sell the listings on market at existing rates of sale: The lower the MSI reading, the stronger the demand as compared to the supply of listings for sale. In San Francisco, demand has been much stronger for houses than for condos, co-ops and TICs, and also stronger in lower compared to higher price segments.
San Francisco Annual Sales - $5,000,000+
Number of Luxury Home Sales by Year, since 2005*
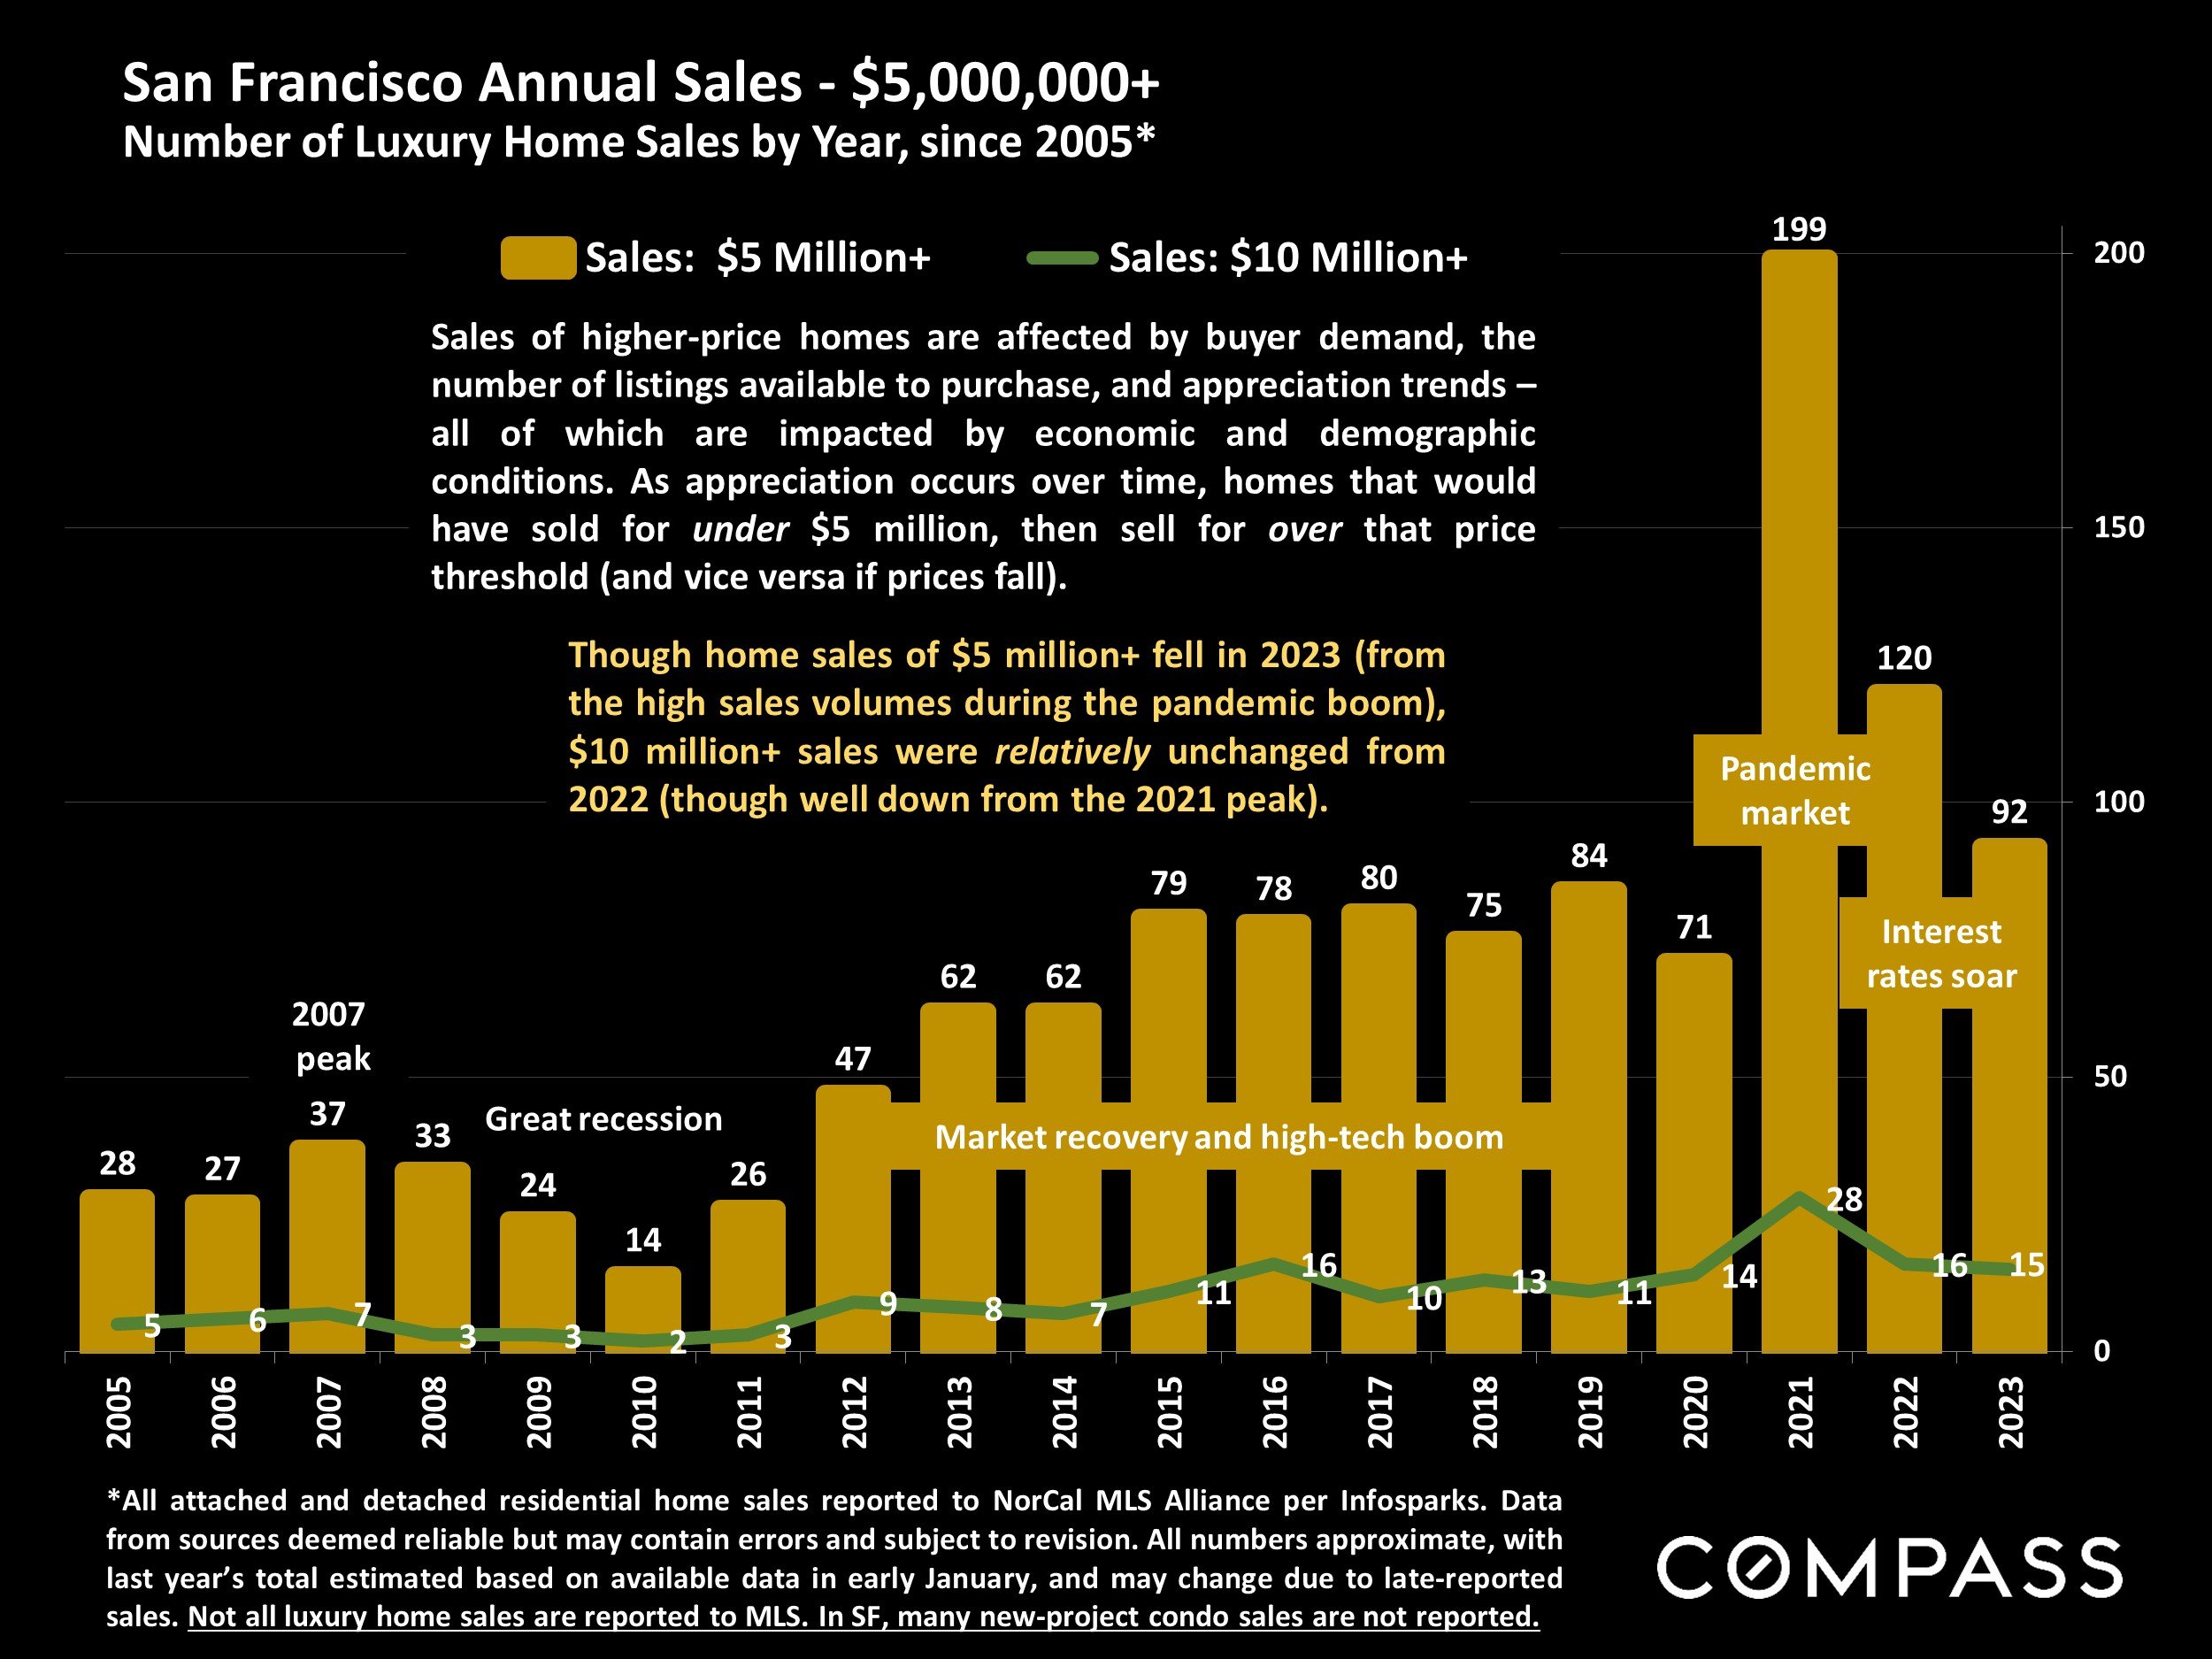
*All attached and detached residential home sales reported to NorCal MLS Alliance per Infosparks. Data from sources deemed reliable but may contain errors and subject to revision. All numbers approximate, with last year’s total estimated based on available data in early January, and may change due to late-reported sales. Not all luxury home sales are reported to MLS. In SF, many new-project condo sales are not reported.
Sales of higher-price homes are affected by buyer demand, the number of listings available to purchase, and appreciation trends –all of which are impacted by economic and demographic conditions. As appreciation occurs over time, homes that would have sold for under $5 million, then sell for over that price threshold (and vice versa if prices fall).
Though home sales of $5 million+ fell in 2023 (from the high sales volumes during the pandemic boom),$10 million+ sales were relatively unchanged from 2022 (though well down from the 2021 peak).
San Francisco Luxury HOUSE Market in 2023*
House Sales of $4,000,000+, by District, 12 Months Sales

*12 months sales and pending sales reported to NorCal MLS Alliance by 12/18/23. Not all luxury home sales are reported. Neighborhood groupings correspond to SF Realtor districts, which often include adjacent neighborhoods not listed. Data from sources deemed reliable but may contain errors and subject to revision. All numbers approximate.
There were 15 house sales of $10 million+ reported to MLS during the 12-month period and 2 listing currently pending sale. 3 sales were reported of $20 million+.*
San Francisco Luxury CONDO, CO-OP, TIC & TOWNHOUSE Market in 2023*
Sales Prices of $2.5 Million+, by District, 12 Months Sales

*12 months sales and pending sales reported to NorCal MLS Alliance by 12/18/23. Not all luxury home sales are reported. Neighborhood groupings correspond to SF Realtor districts, which often include adjacent neighborhoods not listed. Data from sources deemed reliable but may contain errors and subject to revision. All numbers approximate.
Some new-project luxury condo sales are not reported to MLS. These projects are mostly concentrated in the greater South Beach/Yerba Buena/SoMa area.
96 of these sales were condos, 9 were co-ops, 7 TICs and 2 townhouses.*
There were 2 sales of $10 million+ reported during the 12-month period.
San Francisco Luxury Home Market
10 Highest Home Sales in 2023*
| Neighborhood | Highest Home Sale* |
|---|---|
| Presidio Heights | $34,500,000 |
| Pacific Heights | $23,500,000 |
| Sea Cliff | $20,000,000 |
| Sea Cliff | $18,615,000 |
| Presidio Heights | $18,500,000 |
| Pacific Heights (condo) | $17,500,000 |
| Cow Hollow | $16,375,000 |
| Presidio Heights | $16,300,000 |
| Presidio Heights | $14,300,000 |
| Cow Hollow | $13,500,000 |
Most Expensive Active or Pending Listings*
| Neighborhood | Highest Priced Listing* |
|---|---|
| Pacific Heights | $32,000,000 |
| Pacific Heights | $32,000,000 |
| Presidio Heights | $29,000,000 |
| Sea Cliff | $25,000,000 |
| Pacific Heights | $19,950,000 |
| Pacific Heights (co-op) | $19,900,000 |
| Sea Cliff – pending sale | $16,500,000 |
| Pacific Heights | $15,900,000 |
| Yerba Buena (condo) | $15,500,000 |
| Pacific Heights | $14,500,000 |
Highest Sales in Other Selected Neighborhoods
| Neighborhood | Highest Sale |
|---|---|
| Clarendon Heights | $9,938,000 |
| Russian Hill | $8,000,000 |
| Yerba Buena (condo) | $7,750,000 |
| Potrero Hill | $7,675,000 |
| Buena Vista | $7,500,000 |
| Noe Valley | $7,000,000 |
| Jordan Park | $6,775,000 |
| Lake Street | $6,200,000 |
| Cole Valley | $6,144,000 |
| South Beach (condo) | $6,100,000 |
*2023 sales reported to, and active/coming soon/pending listings posted to, NorCal MLS Alliance as of 12/22/23. Data from sources deemed reliable, but may contain errors and subject to revision. New listings and sales are posted constantly. Not all luxury listings and sales are reported to MLS.
Active & Coming-Soon Listings on 1st of Month*
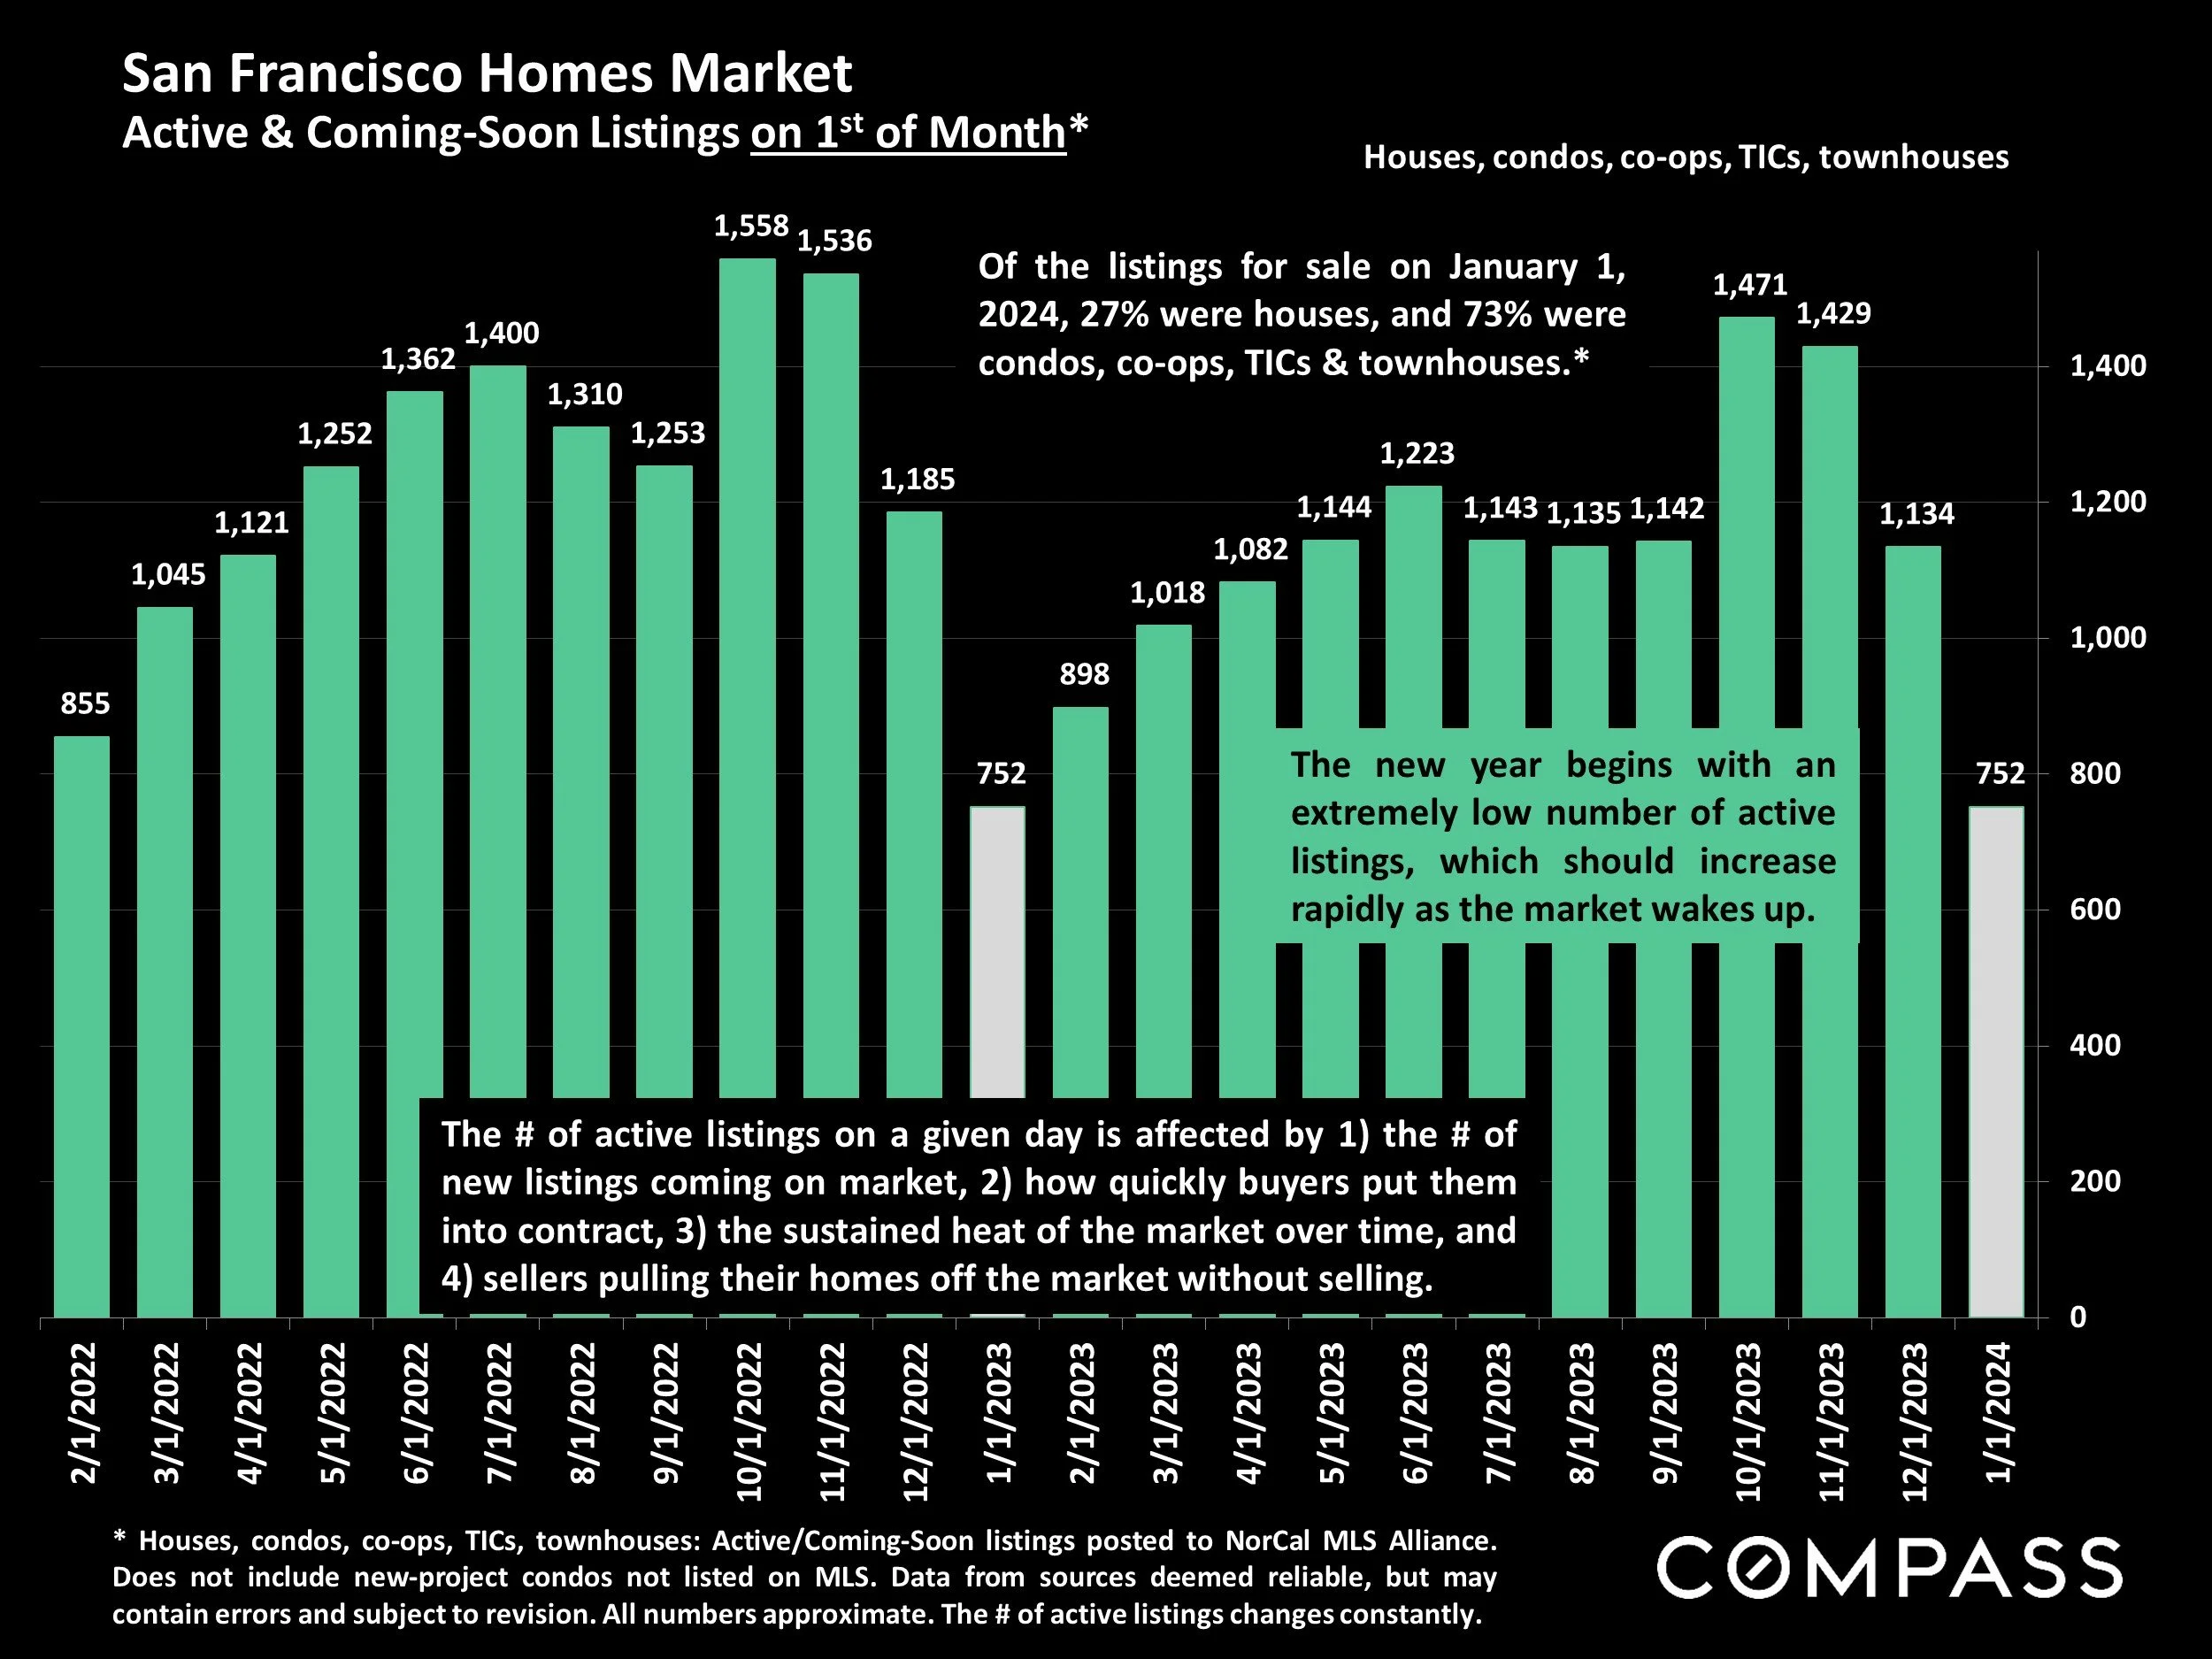
* Houses, condos, co-ops, TICs, townhouses: Active/Coming-Soon listings posted to NorCal MLS Alliance. Does not include new-project condos not listed on MLS. Data from sources deemed reliable, but may contain errors and subject to revision. All numbers approximate. The # of active listings changes constantly.
Of the listings for sale on January 1, 2024, 27% were houses, and 73% were condos, co-ops, TICs & townhouses.*
The new year begins with an extremely low number of active listings, which should increase rapidly as the market wakes up.
The # of active listings on a given day is affected by 1) the number of the new listings coming on market, 2) how quickly buyers put them into contract, 3) the sustained heat of the market over time, and 4) sellers pulling their homes off the market without selling.
Listings Accepting Offers (Going into Contract)
San Francisco Market Dynamics & Seasonality

House, condo, townhouse listings going into contract as reported to NorCal MLS Alliance, per Infosparks. Data from sources deemed reliable but may contain errors and subject to revision. All numbers approximate. Last month numbers estimated based on available data, and may change with late reported activity.
Monthly accepted-offer activity illustrates the enormous effect of seasonal supply and demand trends on the market. Activity picks up rapidly in the 1st quarter, to typically peak in spring.
San Francisco – Speed of Sale
Average Days on Market, Annual Readings by Year, since 2005*

*Average cumulative days on market: Sales reported to NorCal MLS Alliance per Infosparks calculations. Data from sources deemed reliable but may contain errors and subject to revision. All numbers approximate, and may change due to late-reported sales. Not all sales are reported to MLS.
This statistic is an indicator of the strength of buyer demand vs. the supply of homes for sale, measuring – for homes sold – the average time between a listing coming on market and offer acceptance. The market typically sees substantial seasonal variations in this metric, which do not appear in this annual trend chart.
San Francisco – Overbidding Asking Price
Percentage of Sales Over List Price, Annual Readings, since 2005*

*Sales over final list price: All attached and detached residential home sales reported to NorCal MLS Alliance per Infosparks calculations. Data from sources deemed reliable but may contain errors and subject to revision. All numbers approximate, and may change due to late-reported sales. Not all sales are reported to MLS.
Generally speaking, the stronger the demand as compared to the supply of homes for sale, the more buyers compete to win the sale by overbidding asking price. Especially since the pandemic, SF overbidding percentages for houses have been much higher than those for condos.
San Francisco: Overbidding & Underbidding
Sales Price to List Price Percentage, Annual Readings, since 2005*

*The ratio of sales price to the original list price: sales reported to NorCal MLS Alliance per Infosparks calculations. Data from sources deemed reliable but may contain errors and subject to revision. Percentages rounded. All numbers approximate, and may change due to late-reported sales. Not all sales are reported to MLS.
100% = an average sales price at the original asking price; 104% = an average sales price 4% above asking; 98% = an average sales price 2% below asking.
Houses typically see much higher overbidding percentages than condos, which sold, on average, slightly below asking price in 2023.
U.S. Percentage of All-Cash Buyers
National Market Dynamics since 2015, by Month*
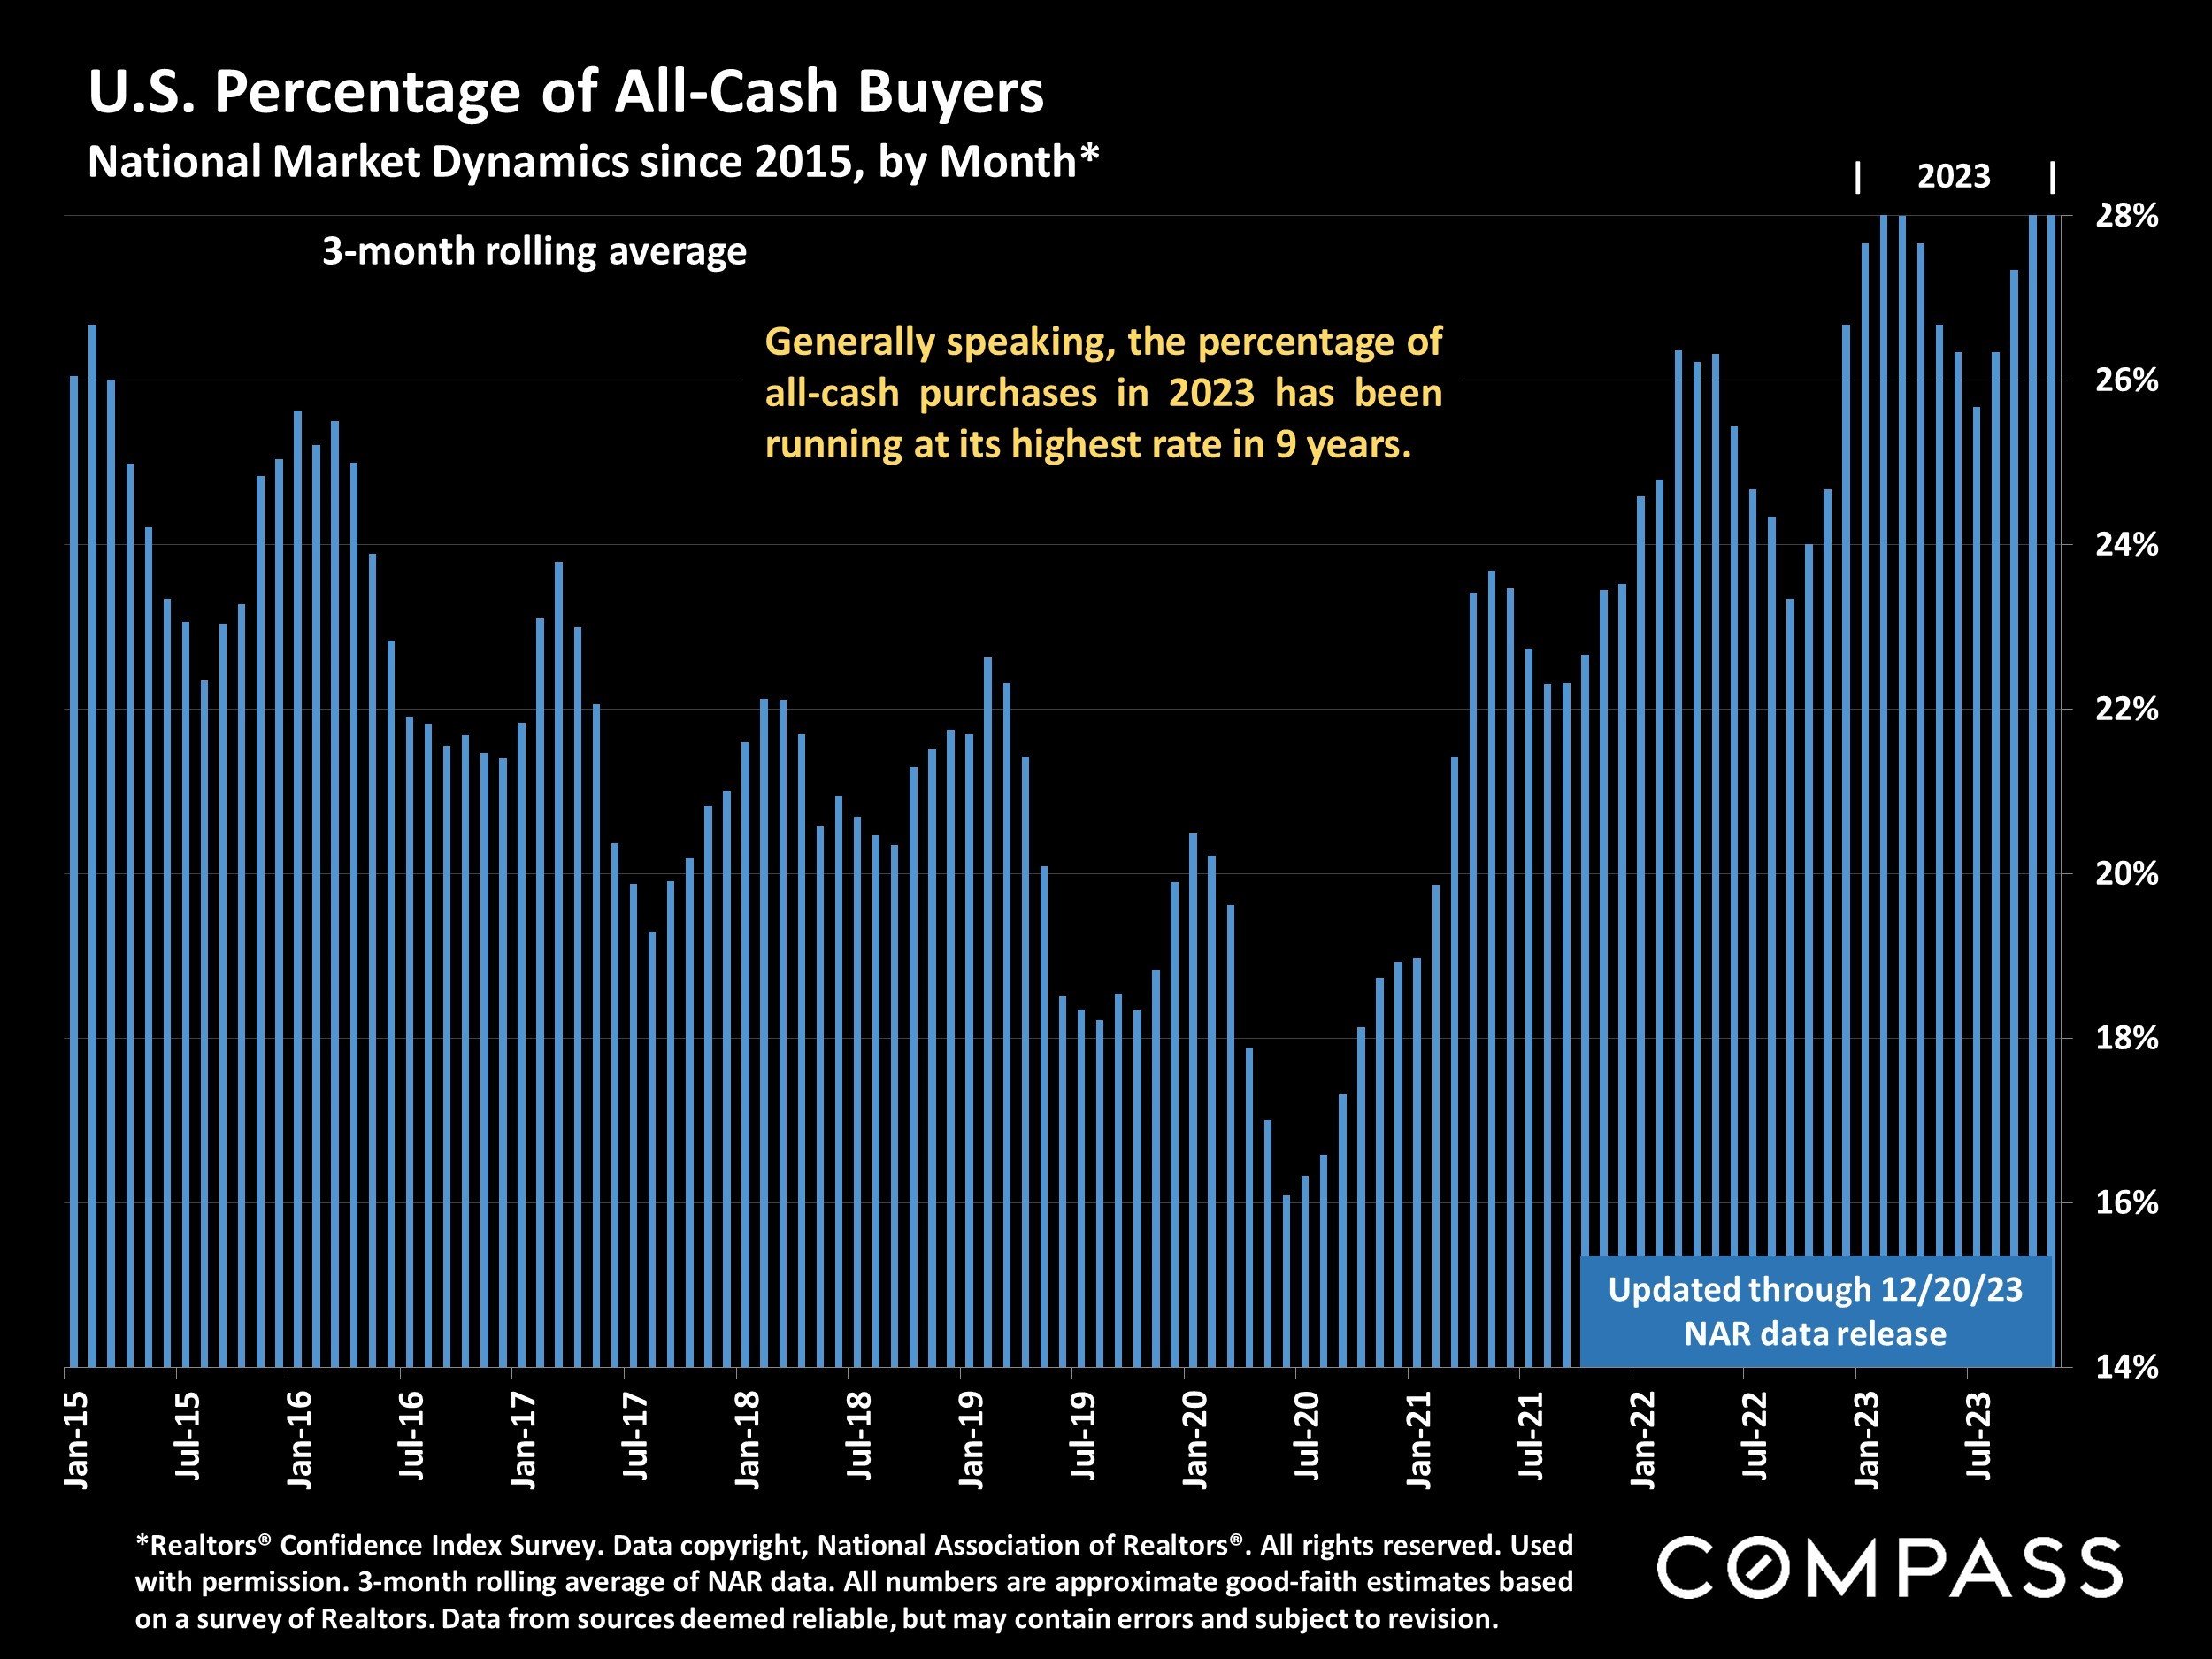
*Realtors® Confidence Index Survey. Data copyright, National Association of Realtors®. All rights reserved. Used with permission. 3-month rolling average of NAR data. All numbers are approximate good-faith estimates based on a survey of Realtors. Data from sources deemed reliable, but may contain errors and subject to revision.
Generally speaking, the percentage of all-cash purchases in 2023 has been running at its highest rate in 9 years.
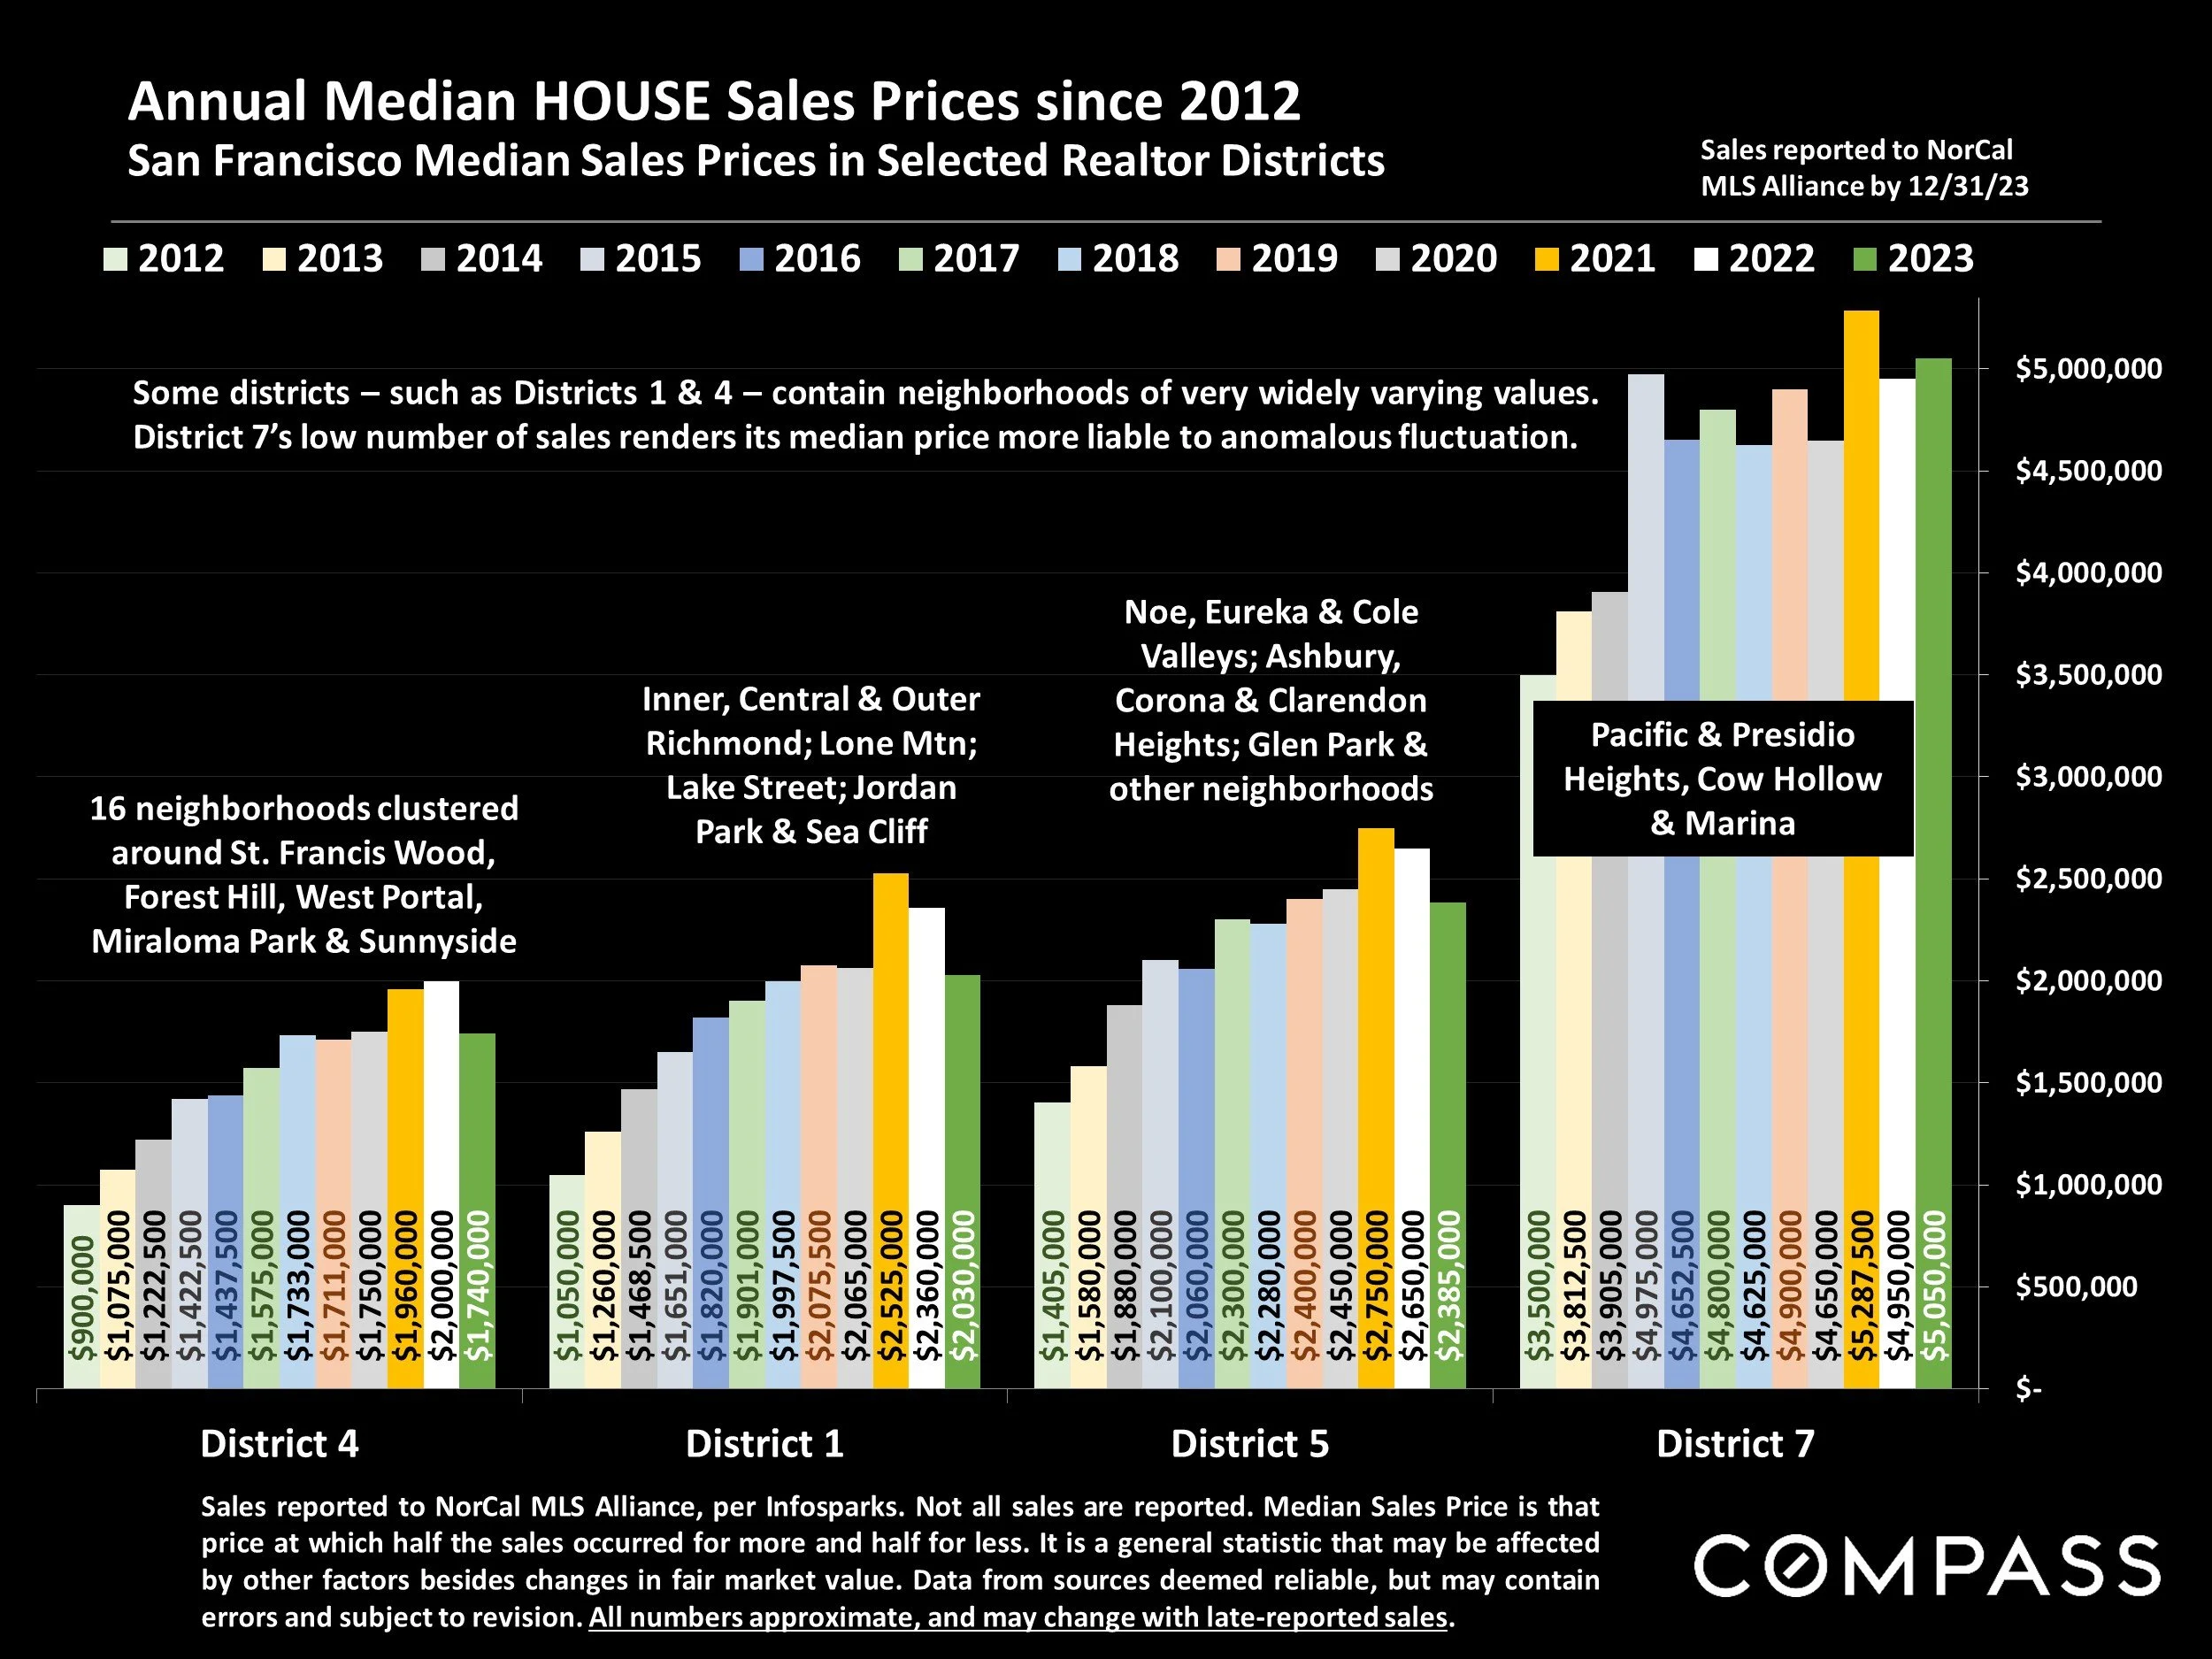
Annual Median HOUSE Sales Prices since 2012
San Francisco Median Sales Prices in Selected Realtor Districts

Sales reported to NorCal MLS Alliance, per Infosparks. Median Sales Price is that price at which half the sales occurred for more and half for less. It is a general statistic that may be affected by other factors besides changes in fair market value. Data from sources deemed reliable, but may contain errors and subject to revision. All numbers approximate, and may change with late-reported sales.
District 10: 12 southern neighborhoods clustered around Bayview, Portola, Excelsior, Crocker Amazon, Visitacion Valley
District 3: 9 neighborhoods including Lake Shore, Lakeside, Ingleside, Oceanview
District 2: Sunset & Parkside Districts, Golden Gate Heights
District 9: Bernal Heights, Potrero Hill, Inner Mission
Sales reported to NorCal MLS Alliance, per Infosparks. Median Sales Price is that price at which half the sales occurred for more and half for less. It is a general statistic that may be affected by other factors besides changes in fair market value. Data from sources deemed reliable, but may contain errors and subject to revision. All numbers approximate, and may change with late-reported sales.
District 4: 16 neighborhoods clustered around St. Francis Wood, Forest Hill, West Portal, Miraloma Park & Sunnyside
District 1: Inner, Central & Outer Richmond; Lone Mtn; Lake Street; Jordan Park & Sea Cliff
District 5: Noe, Eureka & Cole Valleys; Ashbury, Corona & Clarendon Heights; Glen Park & other neighborhoods
District 7: Pacific & Presidio Heights, Cow Hollow, & Marina
Some districts – such as Districts 1 & 4 – contain neighborhoods of very widely varying values. District 7’s low number of sales renders its median price more liable to anomalous fluctuation.
Annual Median CONDO Sales Prices since 2012
San Francisco Median Sales Prices in Selected Realtor Districts

Sales reported to NorCal MLS Alliance, per Infosparks. Many new-project condo sales are not reported. Median Sales Price is that price at which half the sales occurred for more and half for less. It is a general statistic that may be affected by other factors besides changes in fair market value. Data from sources deemed reliable, but may contain errors and subject to revision. All numbers approximate, and may change with late-reported sales.
District 9: South Beach, Mission Bay, SoMa, Potrero Hill, Inner Mission, Dogpatch, Bernal
District 6: Hayes Valley, NoPa, Alamo Square, Lower Pacific Heights, & Western Addition
District 8 North: Russian, Nob & Telegraph Hills; North Beach; & Financial District
District 5: Noe, Eureka & Cole Valleys; Ashbury, Corona & Clarendon Heights; Glen Park & other neighborhoods
District 7: Pacific & Presidio Heights, Cow Hollow, & Marina
In some districts, new condo construction makes year-over-year, apples-to-apples price comparisons difficult. Median sales prices are often affected by factors besides changes in fair market value.
Bay Area Median House Values by County
2nd Half 2023 Sales: By Bedroom/Bath Count*


Bay Area Median Condo & Townhouse Values by County
2nd Half 2023 Sales: By Property Type & Bedroom/Bath Count*
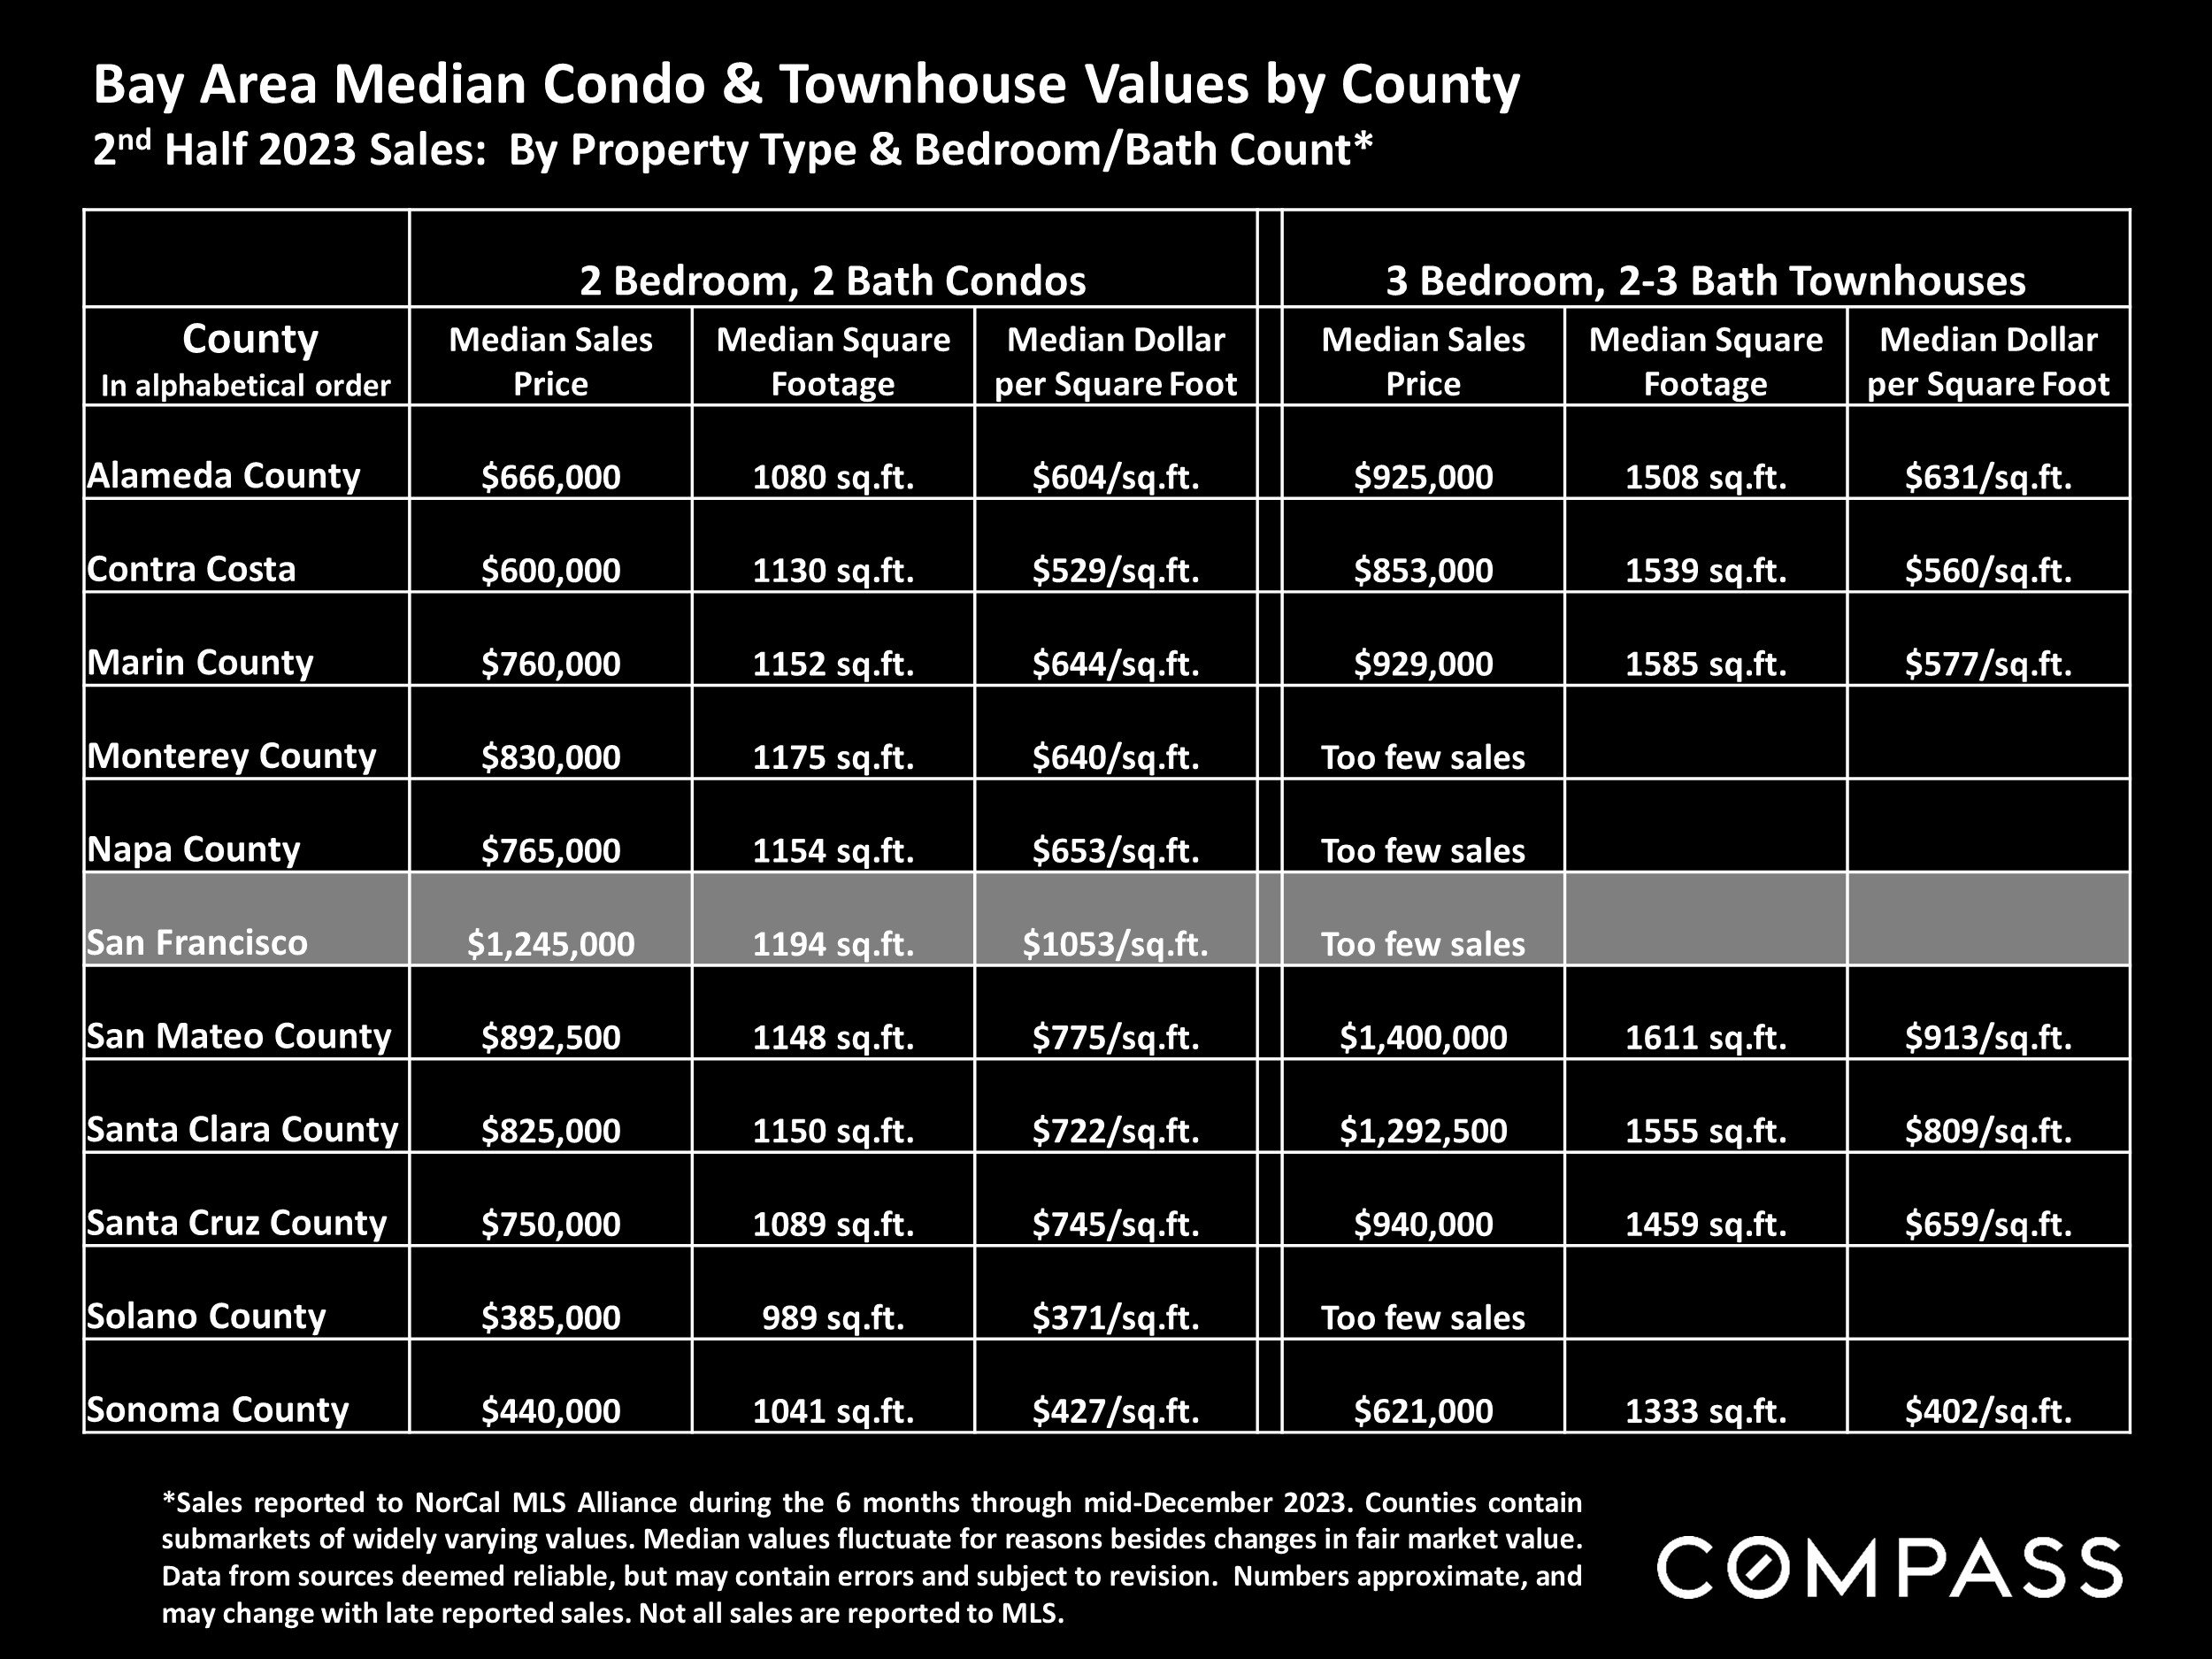
*Sales reported to NorCal MLS Alliance during the 6 months through mid-December 2023. Counties contain submarkets of widely varying values. Median values fluctuate for reasons besides changes in fair market value. Data from sources deemed reliable, but may contain errors and subject to revision. Numbers approximate, and may change with late reported sales. Not all sales are reported to MLS.
Federal Funds Interest Rate since 1981
& Economic Interventions by Federal Reserve Bank*

* Per Federal Reserve Bank of St. Louis and New York; https://fred.stlouisfed.org/series/FEDFUNDS; Last reading per https://www.newyorkfed.org/markets/reference-rates/effr. Other data referenced from sources deemed reliable, but may contain errors and subject to revision.
After 11 increases since March 2022, the Federal Reserve has kept the benchmark federal-funds rate unchanged since August. There are wide expectations among analysts that the rate will decline in multiple adjustments in 2024.
Timeline:
Early 1980's: Fed aggressively raises fed funds target rate to lower inflation rate
Early 1990's recession: Fed drops target interest rate 18 times, 1990-92
Dotcom crash, 9/11 attack: Fed drops fed fund rate 12 times, 2001-02
Subprime crash: Fed drops rate 10 times to effectively zero in 2007-08
2019, 2020, 2021: The Fed drops rate to effectively zero
2022/2023: Acting to counter inflation, Fed increases target rate 11 times
Statistics are generalities, essentially summaries of widely disparate data generated by dozens, hundreds or thousands of unique, individual sales occurring within different time periods. They are best seen not as precise measurements, but as broad, comparative indicators, with reasonable margins of error. Anomalous fluctuations in statistics are not uncommon, especially in smaller, expensive market segments. Last period data should be considered estimates that may change with late-reported data. Different analytics programs sometimes define statistics – such as “active listings,” “days on market,” and “months supply of inventory” – differently: what is most meaningful are not specific calculations but the trends they illustrate. Most listing and sales data derives from the local or regional multi-listing service (MLS) of the area specified in the analysis, but not all listings or sales are reported to MLS and these won’t be reflected in the data. “Homes” signifies real-property, single-household housing units: houses, condos, co-ops, townhouses, duets and TICs (but not mobile homes), as applicable to each market. City/town names refer specifically to the named cities and towns, unless otherwise delineated. Multi-county metro areas will be specified as such. Data from sources deemed reliable, but may contain errors and subject to revision. All numbers to be considered approximate.
Many aspects of value cannot be adequately reflected in median and average statistics: curb appeal, age, condition, amenities, views, lot size, quality of outdoor space, “bonus” rooms, additional parking, quality of location within the neighborhood, and so on. How any of these statistics apply to any particular home is unknown without a specific comparative market analysis.
Median Sales Price is that price at which half the properties sold for more and half for less. It may be affected by seasonality, “unusual” events, or changes in inventory and buying trends, as well as by changes in fair market value. The median sales price for an area will often conceal an enormous variety of sales prices in the underlying individual sales.
Dollar per Square Foot is based upon the home’s interior living space and does not include garages, unfinished attics and basements, rooms built without permit, patios, decks or yards (though all those can add value to a home). These figures are usually derived from appraisals or tax records, but are sometimes unreliable (especially for older homes) or unreported altogether. The calculation can only be made on those home sales that reported square footage.
Photo use under the Creative Commons License: https://creativecommons.org/licenses/by-sa/2.0/
Compass is a real estate broker licensed by the State of California, DRE 01527235. Equal Housing Opportunity. This report has been prepared solely for information purposes. The information herein is based on or derived from information generally available to the public and/or from sources believed to be reliable. No representation or warranty can be given with respect to the accuracy or completeness of the information. Compass disclaims any and all liability relating to this report, including without limitation any express or implied representations or warranties for statements contained in, and omissions from, the report. Nothing contained herein is intended to be or should be read as any regulatory, legal, tax, accounting or other advice and Compass does not provide such advice. All opinions are subject to change without notice. Compass makes no representation regarding the accuracy of any statements regarding any references to the laws, statutes or regulations of any state are those of the author(s). Past performance is no guarantee of future results.