March 2024 Market Report

Photo by Kellen Riggin on Unsplash
The Market Accelerates Rapidly Moving into Spring
There is a growing sense that in 2023 San Francisco hit its post-pandemic low – economically, socially, and certainly in media coverage – and that it has now begun a significant recovery on all those fronts. Most importantly, confidence is rebounding in San Francisco’s future as a financial and cultural center, as the heart, along with Silicon Valley, of the next big technology boom (AI), and simply as one of the great cities of the world.
Along with substantial macroeconomic improvements in interest rates (though they ticked up a little in February), financial markets – which recently hit all-time highs – and consumer confidence, these factors are also triggering a recovery in its housing market. This is now beginning to show up across a wide variety of indicators as we move into the spring selling season, typically the most active of the year.
Monthly Home Sales Volume
San Francisco Market Dynamics & Seasonality

Sales of houses, condos, townhouses reported to NorCal MLS Alliance, per Infosparks. Data from sources deemed reliable but may contain errors and subject to revision. Last month estimated based on available information and may change with late reported sales. All numbers approximate.
Year over year, the number of sales in February 2024 was up 32%. Sales volume will almost certainly continue to surge into the spring months.
Sales in one month mostly reflect accepted offers in the previous month.
San Francisco Higher-Price Home Sales*
Homes Selling for $3 Million+

*Houses, condos, co-ops, townhouses, TICs: Sales reported to NorCal MLS Alliance, per Infosparks. Does not include sales unreported to MLS. Data from sources deemed reliable but may contain errors and subject to revision. All numbers approximate, and may change with late-reported activity.
Home sales of $3 million+ in January-February 2024 were up 60% year over year.
The number of higher-price sales typically ebbs and flows dramatically by season, with spring usually the biggest selling season.
San Francisco HOUSE Price Trends since 1990
Monthly Median House Sales Prices, 3-Month Rolling

3-month rolling average of monthly median sales prices for “existing” houses, per CA Association of Realtors or 3-month rolling median per NorCal MLS Alliance. Analysis may contain errors and subject to revision. All numbers approximate, and may change with late-reported sales.
Year-over-year, the 3-month-rolling San Francisco median house sales price in February 2024 was up a little more than 2%. On a single-month basis (instead of 3-month rolling), it was up about 10%.
Median sales price is that price at which half the sales occurred for more and half for less. It is a very general statistic, disguising an enormous range of sales prices in the underlying sales. It is often affected by other factors besides changes in fair market value. Monthly and seasonal fluctuations are common, which explain many of the regular ups and downs in this chart. More often than not, median sales prices peak for the year in spring.of the regular ups and downs in this chart. More often than not, median sales prices peak for the year in spring.
San Francisco CONDO Price Trends since 2005
Median Condo Sales Price, 3-Month Rolling

3-month rolling median condo sales prices reported to NorCal MLS Alliance, per Infosparks. Analysis may contain errors and subject to revision. All numbers approximate, and may change with late-reported sales.
Year over year, the 3-month rolling SF median condo sales price in February 2024 was up about 5%.
Median sales price is that price at which half the sales occurred for more and half for less. It is a very general statistic, often affected by other factors besides changes in fair market value. Monthly and seasonal fluctuations are common, and longer-term trends are more meaningful than short-term changes.
San Francisco CONDO Prices: Downtown vs. Non-Downtown
3-Month-Rolling, Median Condo Sales Prices since 2005*
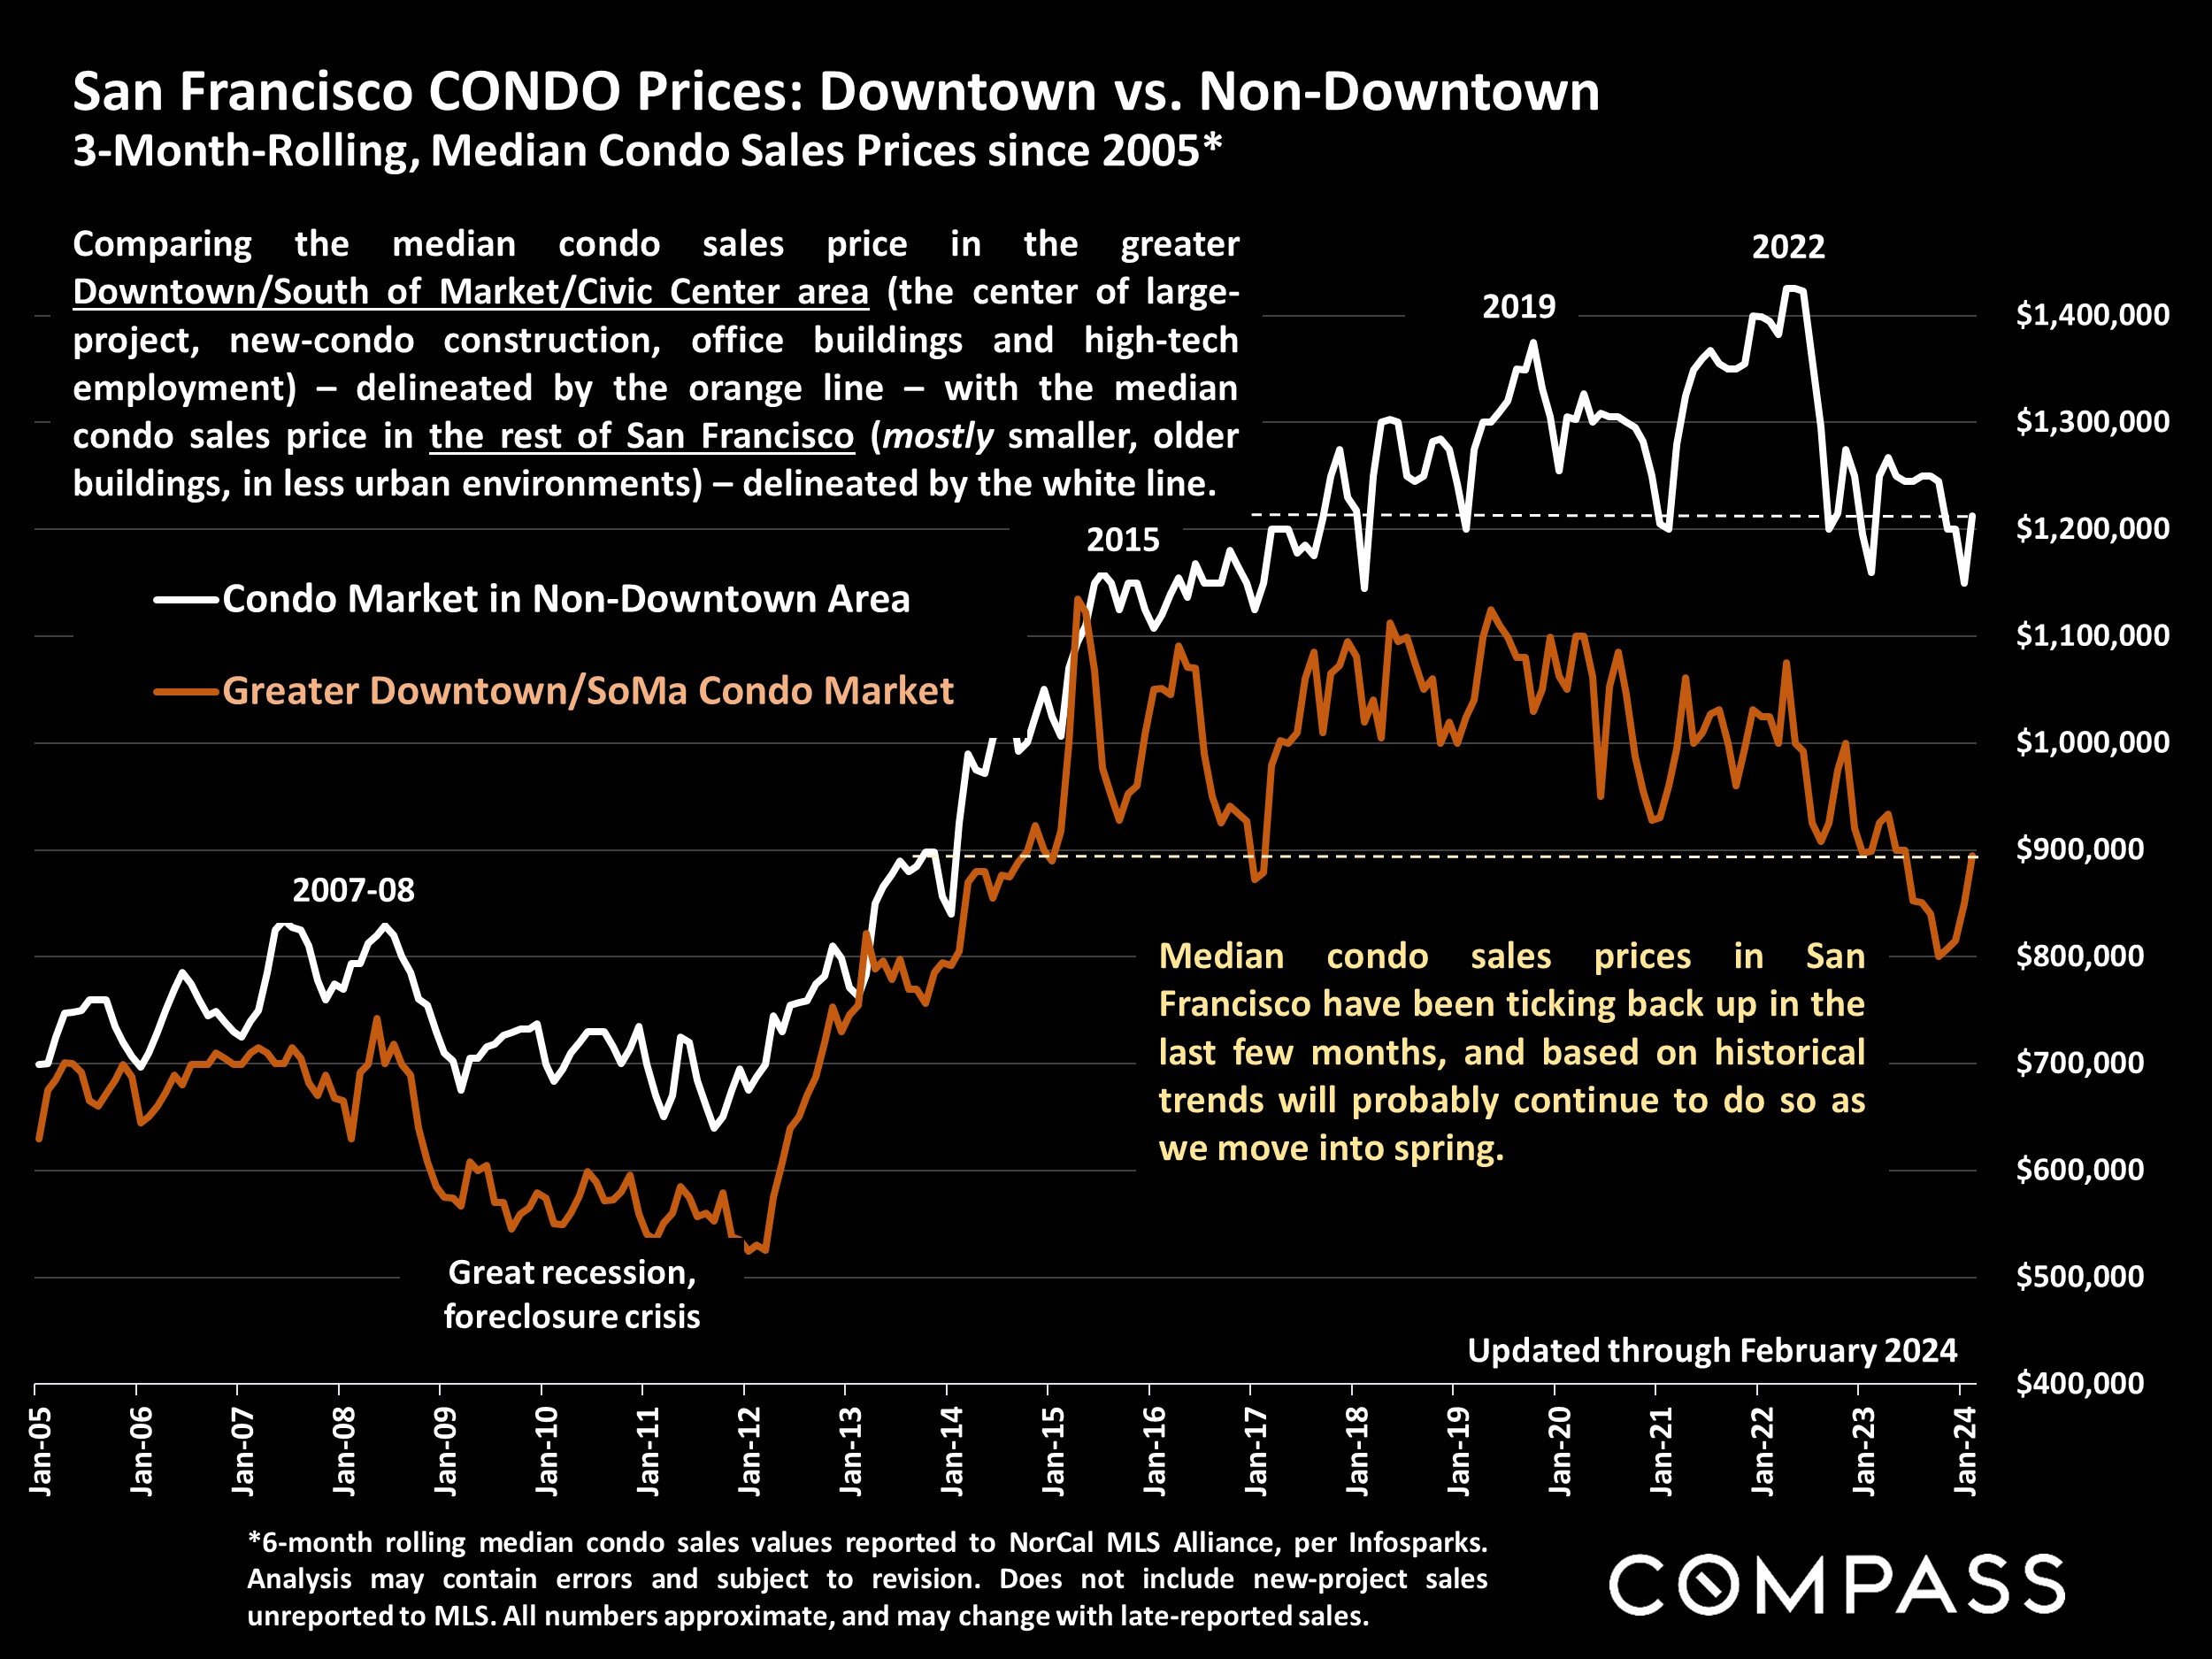
*6-month rolling median condo sales values reported to NorCal MLS Alliance, per Infosparks. Analysis may contain errors and subject to revision. Does not include new-project sales unreported to MLS. All numbers approximate, and may change with late-reported sales.
Comparing the median condo sales price in the greater Downtown/South of Market/Civic Center area (the center of large-project, new-condo construction, office buildings and high-tech employment) – delineated by the orange line – with the median condo sales price in the rest of San Francisco (mostly smaller, older buildings, in less urban environments) – delineated by the white line.
Median condo sales prices in San Francisco have been ticking back up in the last few months, and based on historical trends will probably continue to do so as we move into spring.
San Francisco: Homes for Sale
Active/Coming-Soon Listings*
Active & Coming-Soon Listings Posted to MLS on March 1, 2024, by Price Segment*
Under $1,000,000: 48 houses; 341 condos/co-ops/TICs
$1,000,000 - $1.499m: 67 houses; 183 condos/co-ops/TICs
$1,500,000 - $1.999m: 47 houses; 76 condos/co-ops/TICs
$2,000,000 - $2.999m: 41 houses; 74 condos/co-ops/TICs
$3,000,000 - $4.999m: 36 houses; 38 condos/co-ops/TICs
$5,000,000 - $9.999m: 24 houses; 22 condos/co-ops/TICs
$10,000,000 & above: 10 houses; 5 condos/co-ops
Includes 5 listings priced at $ 25,000,000+
Active/Coming-Soon Listings with Median List (Asking) Prices*
Houses – 279 listings - $1,795,000
Condos – 648 listings - $1,099,000
TICs – 66 listings - $995,000
Co-ops – 25 listings - $1,995,000
Townhouses – 9 listings - $1,100,000
Residential Income Properties:
2-Unit Buildings – 62 listings - $1,892,500
3-Unit Buildings – 35 listings - $2,300,000
4-Unit Buildings – 11 listings - $1,990,000
Median list prices typically disguise a wide range of prices in the underlying individual listings, and may not be representative of typical median sales values. Home sizes and values vary widely within and between neighborhoods.
Numbers do not include new-project condo listings not posted to MLS. Data above as of 3/1/24.
* Active/Coming Soon listings (no offer accepted) posted to NorCal MLS Alliance. Data from sources deemed reliable, but may contain errors and subject to revision. Not all listings are posted to MLS, including many new-project condos. All numbers approximate. Numbers of listings and median list prices change constantly.
San Francisco: Homes for Sale
Active/Coming-Soon Listings by Realtor District*
Realtor districts often contain adjacent neighborhoods to those listed. Neighborhoods within districts often feature different home characteristics and values.
Active & Coming-Soon Listings Posted to MLS on March 1, 2024*
| Realtor District | # House Listings | Median House LIST Price | null | # Condo Listings | Median Condo LIST Price |
|---|---|---|---|---|---|
| Richmond District, Lake St., Sea Cliff (D1) | 21 | $1,995,000 | 11 | $1,295,000 | |
| Sunset, Parkside, GG Heights (D2) | 42 | $1,599,500 | 5 | $1,150,000 | |
| Lakeside, Ingleside, Oceanview (D3) | 19 | $1,090,000 | 4 | $744,000 | |
| Miraloma Park, Sunnyside, St. Francis Wood, Forest Hill, West Portal (D4) | 23 | $1,850,000 | 6 | $582,000 (Diamond Heights) |
|
| Noe, Eureka & Cole Valleys (D5) | 45 | $2,795,000 | 41 | $1,248,000 | |
| Lower Pacific Heights, Hayes Valley, NoPa, Alamo Square (D6) | 8 | $2,547,500 | 47 | $1,195,000 | |
| Pacific & Presidio Heights, Cow Hollow, Marina (D7) | 33 | $7,750,000 | 55 | $1,750,000 | |
| Russian, Nob & Telegraph Hills; North Beach, Van Ness/Civic Center (D8) | 10 | $2,635,000 | 150 | North: $1,199,000 South: $645,000 |
|
| Potrero Hill, Bernal Heights, Mission, South Beach, SoMa, Mission Bay (D9) | 28 | $1,574,500 | 301 | $1,095,000 | |
| Bayview, Excelsior, Portola, Crocker Amazon, Visitacion Valley (D10) | 49 | $995,000 | 28 | $654,500 |
* Active/Coming Soon listings (no offer accepted) posted to NorCal MLS Alliance on 3/1/24. Data from sources deemed reliable, but may contain errors and subject to revision. All numbers approximate. Numbers of listings and median list prices change constantly.
New Listings Coming on Market
San Francisco Market Dynamics & Seasonality

Per Realtor.com Research: https://www.realtor.com/research/data/, listings posted on site. Data from sources deemed reliable, but may contain errors and subject to revision. May not include “coming-soon” listings. All numbers should be considered approximate.
After hitting its low point in December, new listing activity picks up rapidly in the new year.
Year over year, the number of new listings was up about 11% in February 2024.
Percentage of Listings Accepting Offers
San Francisco: Absorption Rate by Month

*SFARMLS reported data, per Broker Metrics. Not all new-condo project activity is reported to MLS. Last month’s data estimated using available data, may change with late reported activity. Data from sources deemed reliable but may contain errors and subject to revision. All numbers approximate.
Absorption rates saw dramatic jumps in February 2024 indicating a rapidly heating market. Absorption rate measures buyer demand vs. the supply of listings for sale: The higher the percentage, the more heated and competitive the market.
Overbidding List Prices in San Francisco
Percentage of Home Sales Closing over List Price

Sales data reported to NORCAL MLS® ALLIANCE, per Infosparks. Reflecting the percentage of sales closing at sales prices over the final list prices. Data from sources deemed reliable, but may contain errors and subject to revision. All numbers are approximate, and may change with late-reported sales.
The % of homes selling over list price surged in February 2024, and was up 28% year-over-year. This statistic fluctuates according to seasonal demand trends, and is a lagging indicator of market activity 3-6 weeks earlier.
Average Days on Market – Speed of Sale
San Francisco Market Dynamics & Seasonality

Sales reported to NorCal MLS Alliance, per Infosparks. Data derived from sources deemed reliable, but may contain errors and subject to revision. All numbers approximate, and may change with late-reported sales.
Days on market plunged in February 2024 as the market heated up. Homes are selling faster.
Measuring how long it takes for sold listings to accept offers. Houses (green line) have significantly lower average days-on-market readings than condos (blue line).
Average Sales Price to Original List Price Percentage
San Francisco Over/Under Bidding: Market Dynamics & Seasonality

Sales reported to NorCal MLS Alliance, per Infosparks. Data derived from sources deemed reliable, but may contain errors and subject to revision. All numbers approximate, and may change with late-reported sales.
Overbidding has been much more common in house sales than condo sales.
Sales price to list price percentages rebounded in February 2024, and were well up year-over-year.
Active & Coming-Soon Listings on 1st of Month*
San Francisco Homes Market

* Houses, condos, co-ops, TICs, townhouses: Active/Coming-Soon listings posted to NorCal MLS Alliance. Does not include new-project condos not listed on MLS. Data from sources deemed reliable, but may contain errors and subject to revision. All numbers approximate. The # of active listings changes constantly.
The # of active listings on a given day is affected by 1) the # of new listings coming on market, 2) how quickly buyers put them into contract, 3) the sustained heat of the market over time, and 4) sellers pulling their homes off the market without selling. Of the listings for sale on March 1, 2024, 27% were houses, and 73% were condos, co-ops, TICs & townhouses.*
Listings Pending Sale (in Contract, Offer Accepted)
San Francisco Market Dynamics & Seasonality

Per Realtor.com Research: https://www.realtor.com/research/data/, house and condo listings posted on site. Data from sources deemed reliable, but may contain errors and subject to revision. All numbers are approximate.
February 2024 saw a large rebound in accepted-offer activity – a typical seasonal trend – and should see further increases moving into spring.
This is a snapshot measure of how many pending listings can be expected on any given day of the specified month. The # of listings going into contract measures buyer demand, but is also deeply impacted by the supply of new listings available to buy.
Price Reductions on Active Listings
San Francisco Market Dynamics & Seasonality
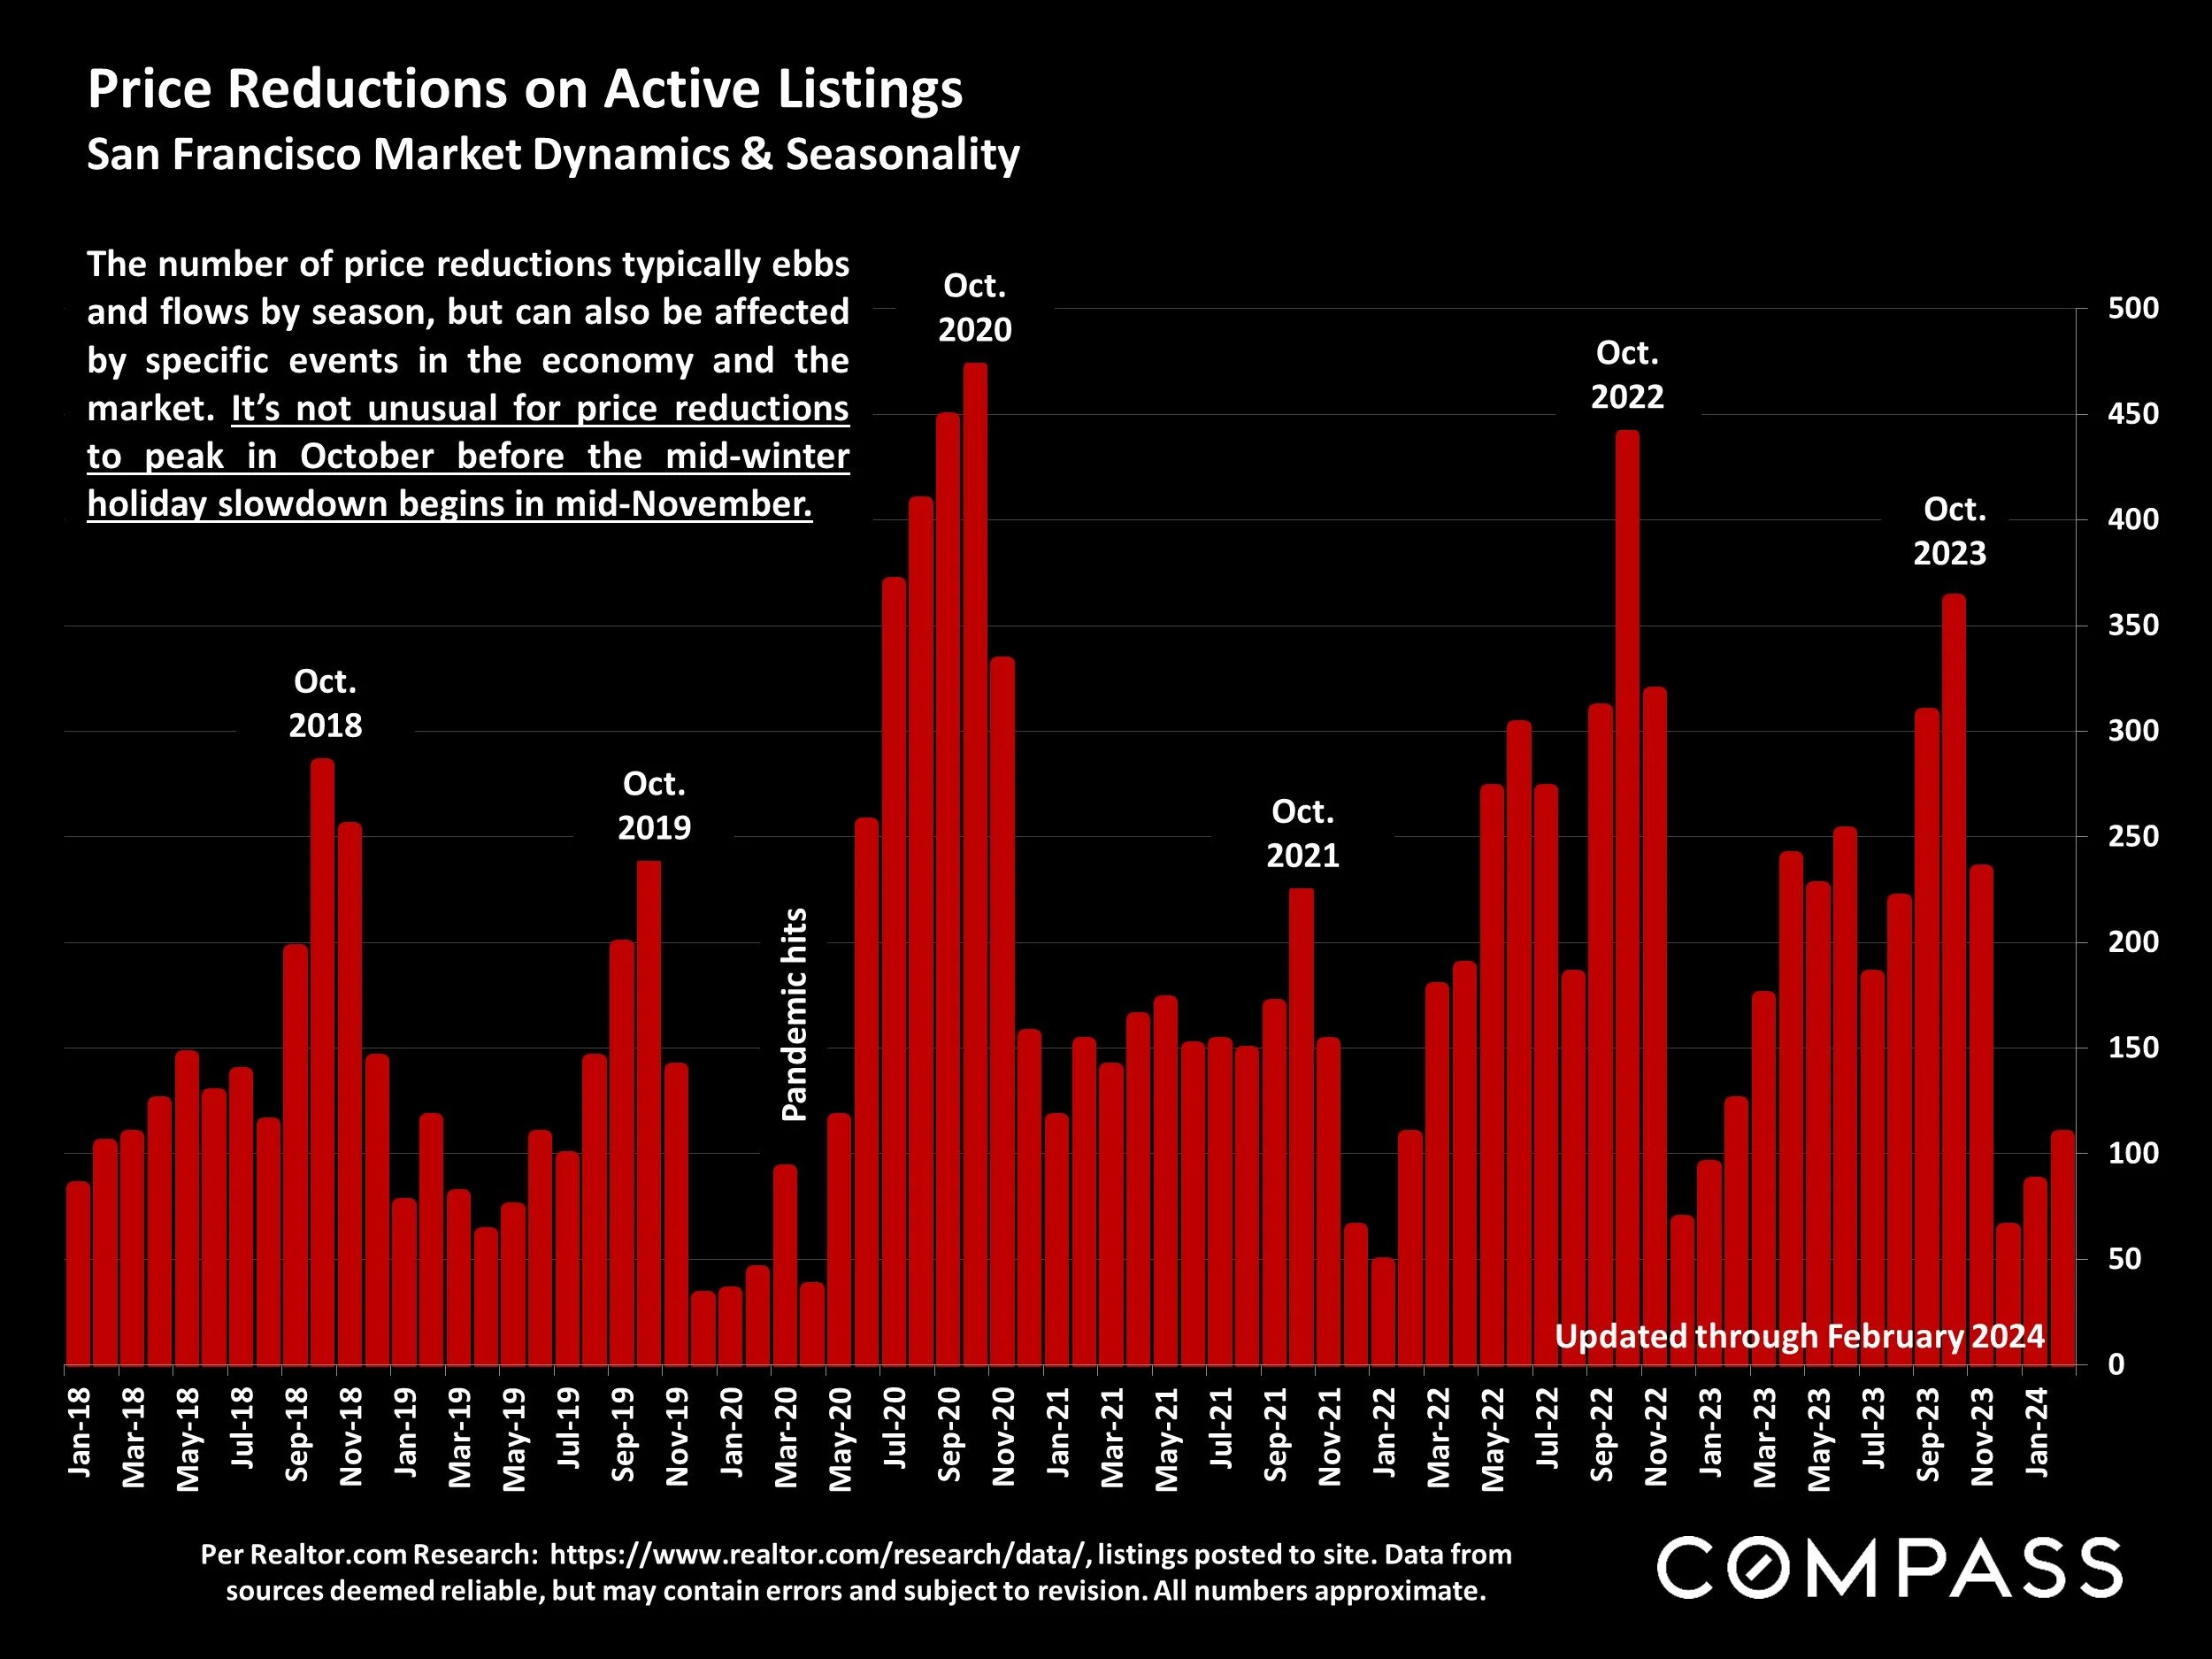
Per Realtor.com Research: https://www.realtor.com/research/data/, listings posted to site. Data from sources deemed reliable, but may contain errors and subject to revision. All numbers approximate.
The number of price reductions typically ebbs and flows by season, but can also be affected by specific events in the economy and the market. It’s not unusual for price reductions to peak in October before the mid-winter holiday slowdown begins in mid-November.
Mortgage Interest Rates in 2023-2024
30-Year Conforming Fixed-Rate Loans, Weekly Average Readings*

*Freddie Mac (FHLMC), 30-Year Fixed Rate Mortgage Weekly Average: https://www.freddiemac.com/pmms. Data from sources deemed reliable. Different sources of mortgage data sometimes vary in their determinations of daily and weekly rates. Data from sources deemed reliable, but may contain errors. All numbers approximate.
Per Freddie Mac (FHLMC), on March 7, 2024, the weekly average, 30-year interest rate ticked down to 6.88%. (For 15-year loans, the rate ticked down to 6.22%.) Rates can vary widely between lenders.
Statistics are generalities, essentially summaries of widely disparate data generated by dozens, hundreds or thousands of unique, individual sales occurring within different time periods. They are best seen not as precise measurements, but as broad, comparative indicators, with reasonable margins of error. Anomalous fluctuations in statistics are not uncommon, especially in smaller, expensive market segments. Last period data should be considered estimates that may change with late-reported data. Different analytics programs sometimes define statistics – such as “active listings,” “days on market,” and “months supply of inventory” – differently: what is most meaningful are not specific calculations but the trends they illustrate. Most listing and sales data derives from the local or regional multi-listing service (MLS) of the area specified in the analysis, but not all listings or sales are reported to MLS and these won’t be reflected in the data. “Homes” signifies real-property, single-household housing units: houses, condos, co-ops, townhouses, duets and TICs (but not mobile homes), as applicable to each market. City/town names refer specifically to the named cities and towns, unless otherwise delineated. Multi-county metro areas will be specified as such. Data from sources deemed reliable, but may contain errors and subject to revision. All numbers to be considered approximate.
Many aspects of value cannot be adequately reflected in median and average statistics: curb appeal, age, condition, amenities, views, lot size, quality of outdoor space, “bonus” rooms, additional parking, quality of location within the neighborhood, and so on. How any of these statistics apply to any particular home is unknown without a specific comparative market analysis.
Median Sales Price is that price at which half the properties sold for more and half for less. It may be affected by seasonality, “unusual” events, or changes in inventory and buying trends, as well as by changes in fair market value. The median sales price for an area will often conceal an enormous variety of sales prices in the underlying individual sales.
Dollar per Square Foot is based upon the home’s interior living space and does not include garages, unfinished attics and basements, rooms built without permit, patios, decks or yards (though all those can add value to a home). These figures are usually derived from appraisals or tax records, but are sometimes unreliable (especially for older homes) or unreported altogether. The calculation can only be made on those home sales that reported square footage.
Compass is a real estate broker licensed by the State of California, DRE 01527235. Equal Housing Opportunity. This report has been prepared solely for information purposes. The information herein is based on or derived from information generally available to the public and/or from sources believed to be reliable. No representation or warranty can be given with respect to the accuracy or completeness of the information. Compass disclaims any and all liability relating to this report, including without limitation any express or implied representations or warranties for statements contained in, and omissions from, the report. Nothing contained herein is intended to be or should be read as any regulatory, legal, tax, accounting or other advice and Compass does not provide such advice. All opinions are subject to change without notice. Compass makes no representation regarding the accuracy of any statements regarding any references to the laws, statutes or regulations of any state are those of the author(s). Past performance is no guarantee of future results.