Why Has Housing Inventory Been So Low?

Economic, Demographic & Market Factors Behind the Historic Decline in Listings for Sale
The plunge in the supply of homes on the market available for purchase by owner-occupier homebuyers has been the single greatest factor in market dynamics since the great recession.
Compass Report, March 2024
Market conditions are always determined by the balance between the intensity of buyer demand and the supply of homes for sale. Since 2000, and especially since the 2008 financial and housing markets crash and foreclosure crisis, factors such as population growth, interest rate changes, the aging of homeowners and homebuyers, investor homebuying, tax law, inadequate new home construction, declining affordability, an increase in the speed at which listings sell, and the pandemic have combined to cause an unprecedented imbalance between supply and demand.
Buyer competition for an inadequate supply of listings has become the dominant reality of the national real estate market.
Soaring interest rates in 2022 led to the “mortgage lock-in” effect, with homeowners holding off from selling, being reluctant to trade their current, very low interest rate for a much higher rate on a new home purchase. Also, as rents increased, and the tax benefits of owning rental real estate multiplied (with 2017 tax law changes) more would-be sellers began renting out their homes instead of selling.
But even before 2022’s increase in interest rates caused the historic plunge in new listings, listing activity had already been declining for years, even as demand increased.
Over 54% of homeowners are now aged 55 years and above, and as people age, they typically move much less often and sell their homes much less frequently. And as homes have become more expensive, far outpacing inflation, the median age of homebuyers has, over the past 20 years, jumped 10 years to 49: Older households are typically more affluent and more able to afford the higher prices. The percentage of 1st time buyers, who trend younger and move more often with life changes, has dropped – and the median age of 1st time buyers has jumped to 36. Due to these factors, the median duration of homeownership has more than doubled since 2005, and this has severely impacted the supply of listings available to buy at any given time.
Another factor in declining turnover in more expensive markets, and with long-term owners in particular, is capital gains taxes on the huge appreciation in home values that has occurred since tax law changed in 1997 from being able to roll-over your principal residence into another without capital gains taxes, to the $250,000/$500,000 capital-gains exclusion. In 1997, the $250k/$500k exclusion covered the vast majority of sales, even in very affluent markets, but that is no longer true. Some owners are now staying put due to advantageous “stepped up basis” rules under inheritance law.
Demand fluctuates due to a number of factors but as population increases, so does the number of people who wish to own homes. The U.S. population increased by 53.5 million since 2000. Over the same period, the average monthly number of active, existing-home listings declined by 45%. When an increased number of buyers compete for a reduced supply of listings, overbidding jumps and homes sell faster at higher prices. Higher prices lead to older, more affluent buyers who move less often.
Since the foreclosure crisis (when hundreds of thousands of homes sold to institutional investors at fire-sale prices), as well as the advent of Airbnb, an improvement of rental-property tax law, and the effects of the pandemic, investors, large and small, and second-home buyers have made up a much greater proportion of sales, recently averaging 14% to 17% of all home sales (including condos and co-ops), and up to 27% of single-family-home sales. This has profoundly intensified demand, and the competition for listings for the typical, owner-occupier buyer, especially in a low-inventory environment. (Investor single-family-home purchases have been most concentrated in more affordable markets with strong population growth, such as in the south and southwest.)
New home construction has trailed far below population growth, with the gap between household formations and new homes built numbering in the multi-millions over the last 10 years – and here too, investors are buying a significant percentage of units. (The quantity of new construction varies widely by state, with some states – mostly in the south and southwest – building much more than others. However, construction lags population growth virtually everywhere.)
The balance between supply and demand is continually shifting – sometimes subtly and sometimes very dramatically – due to a wide range of changing economic and demographic conditions, but, generally speaking, since the market recovery in 2012-2013, demand has increasingly and severely outpaced supply. Even after interest rates rose in 2022, significantly depressing buyer demand, by 2023, the supply of listings unexpectedly declined as much or more, renewing upward pressure on national home prices.
National data is a generalization of the varying conditions in thousands of individual markets. Data from a number of sources deemed reliable – including the National Association of Realtors, U.S. Census data, the Federal Reserve Bank, Realtor.com, CoreLogic, the Joint Center for Housing Studies at Harvard & the National Home Builders Association – but may contain errors and subject to revision. Real estate agents are not qualified to advise on tax law. All numbers approximate.
National Population Trends since 1910*
U.S. Census Estimates, by Decade, Updated through 7/1/2023
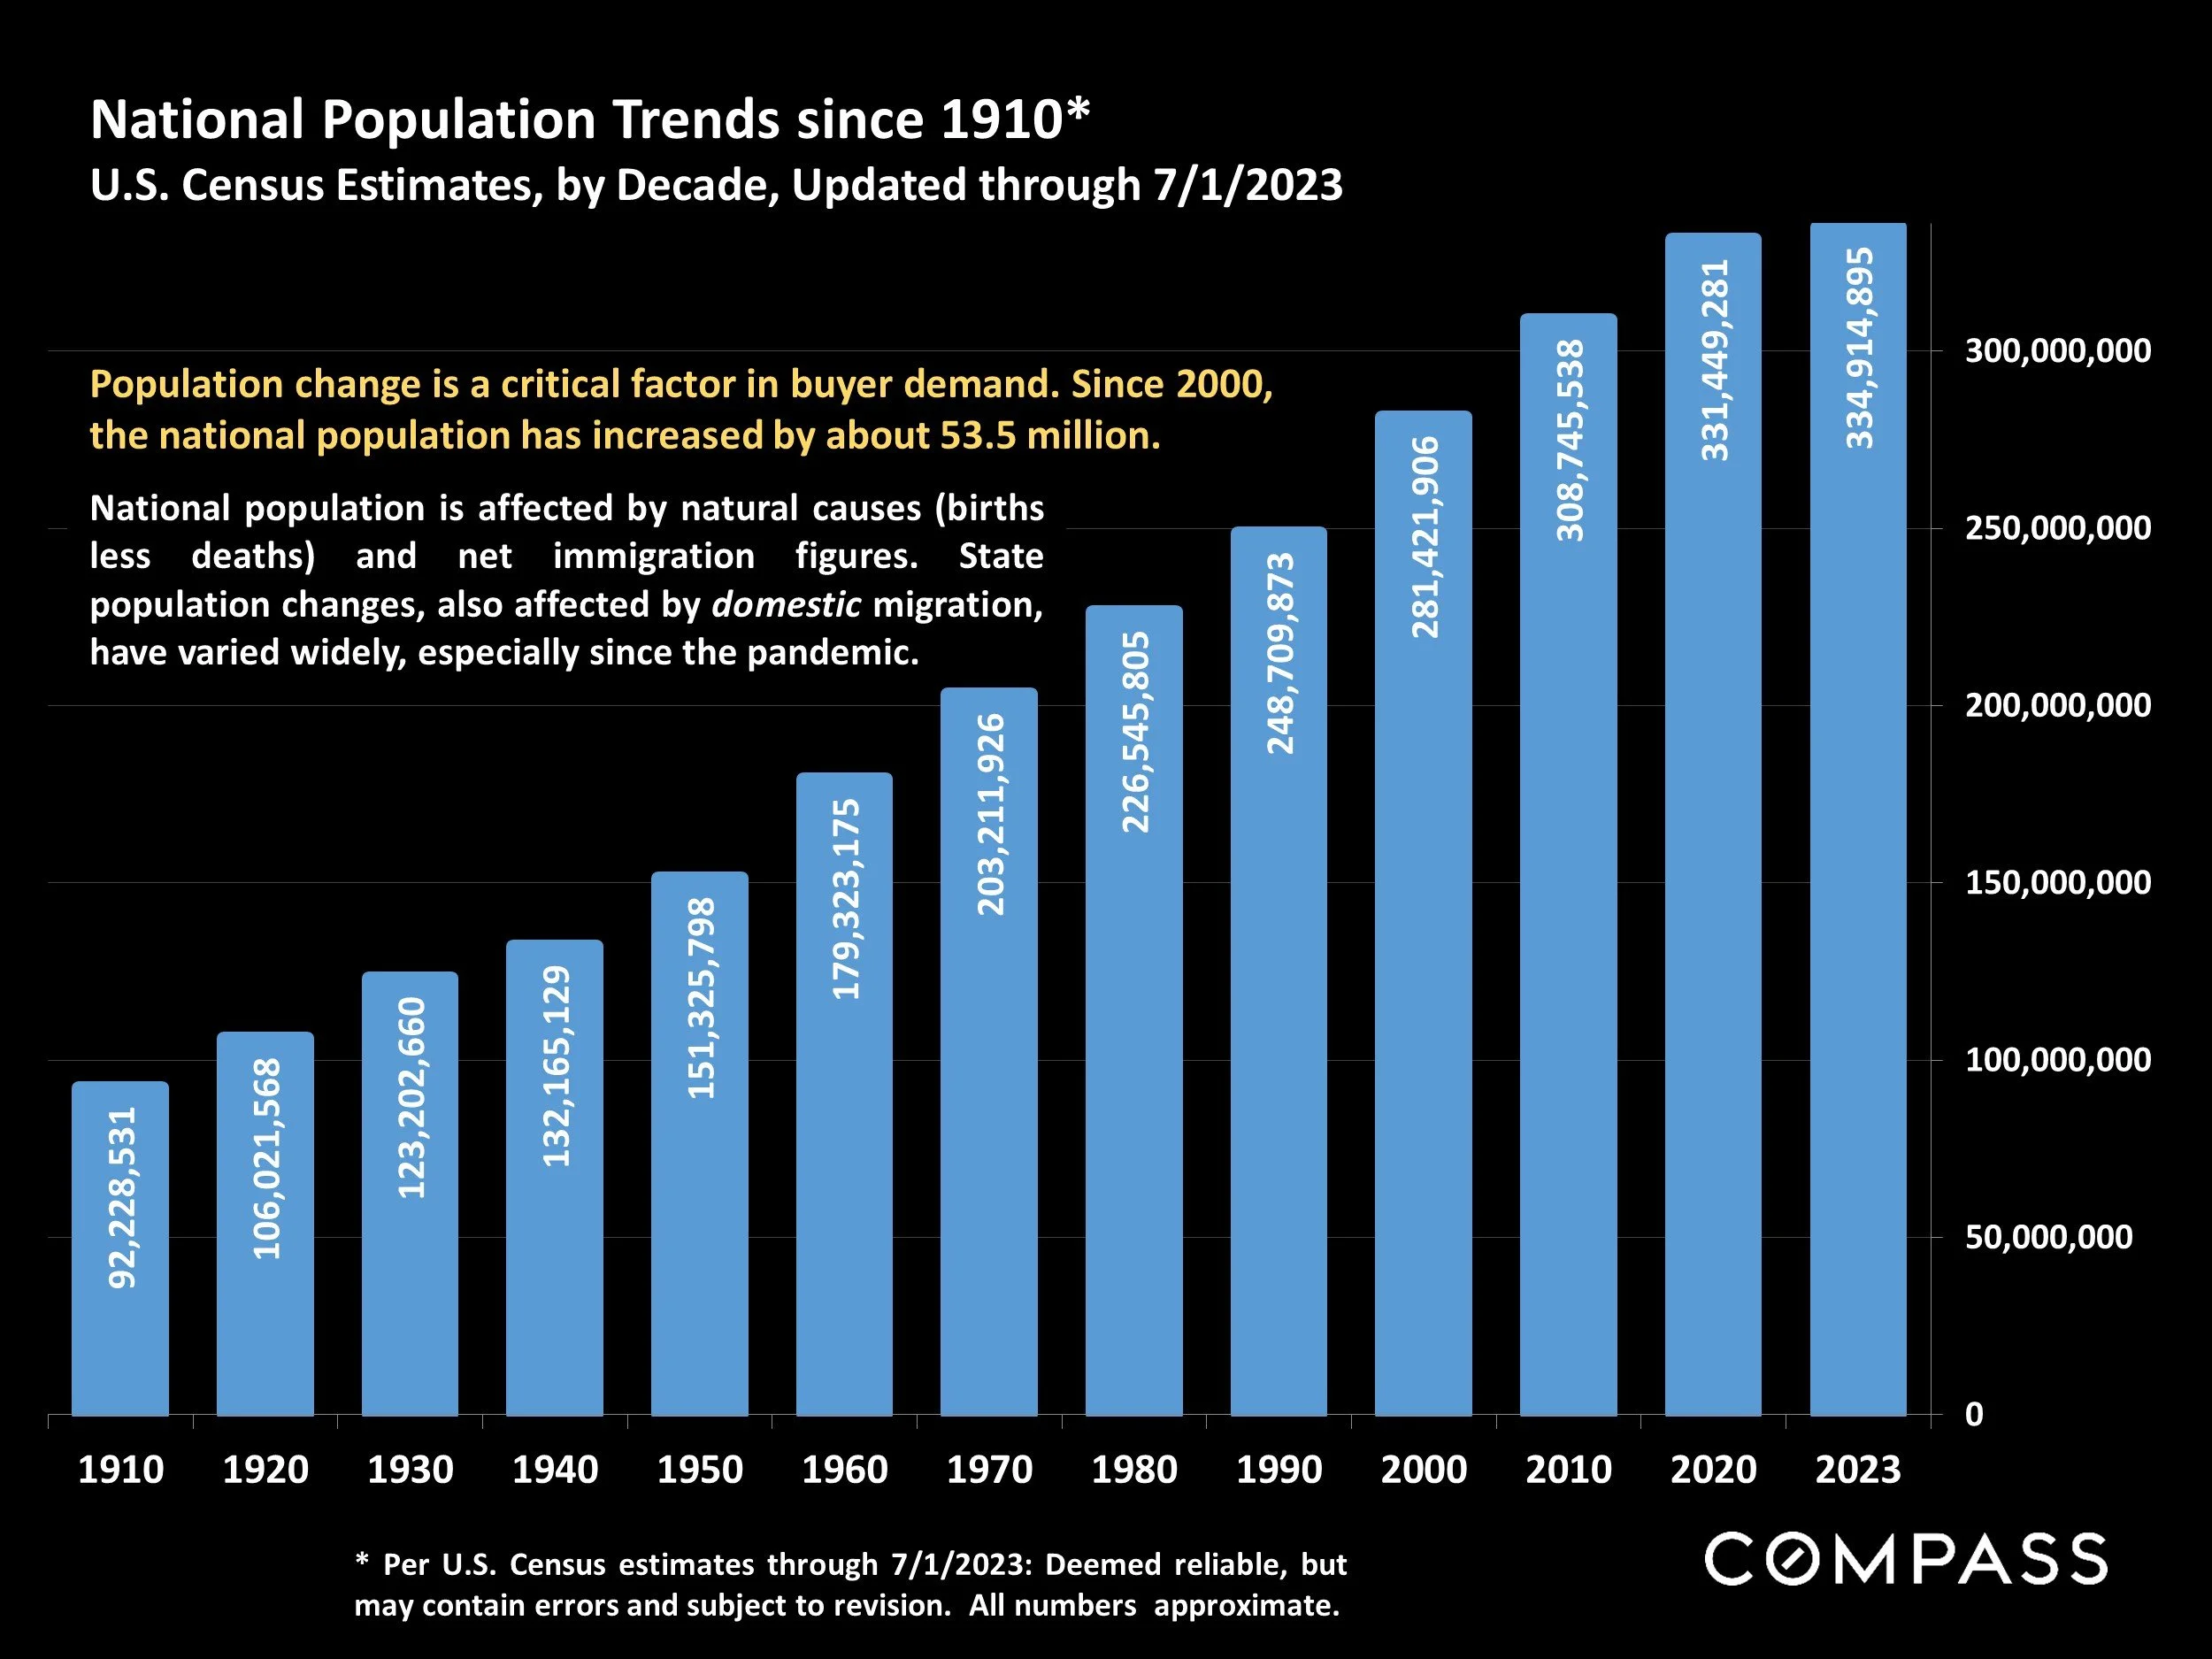
* Per U.S. Census estimates through 7/1/2023: Deemed reliable, but may contain errors and subject to revision. All numbers approximate.
Population change is a critical factor in buyer demand. Since 2000, the national population has increased by about 53.5 million.
National population is affected by natural causes (births less deaths) and net immigration figures. State population changes, also affected by domestic migration, have varied widely, especially since the pandemic.
U.S. Number of Active Listings on Market
Annual Monthly Average since 2000*
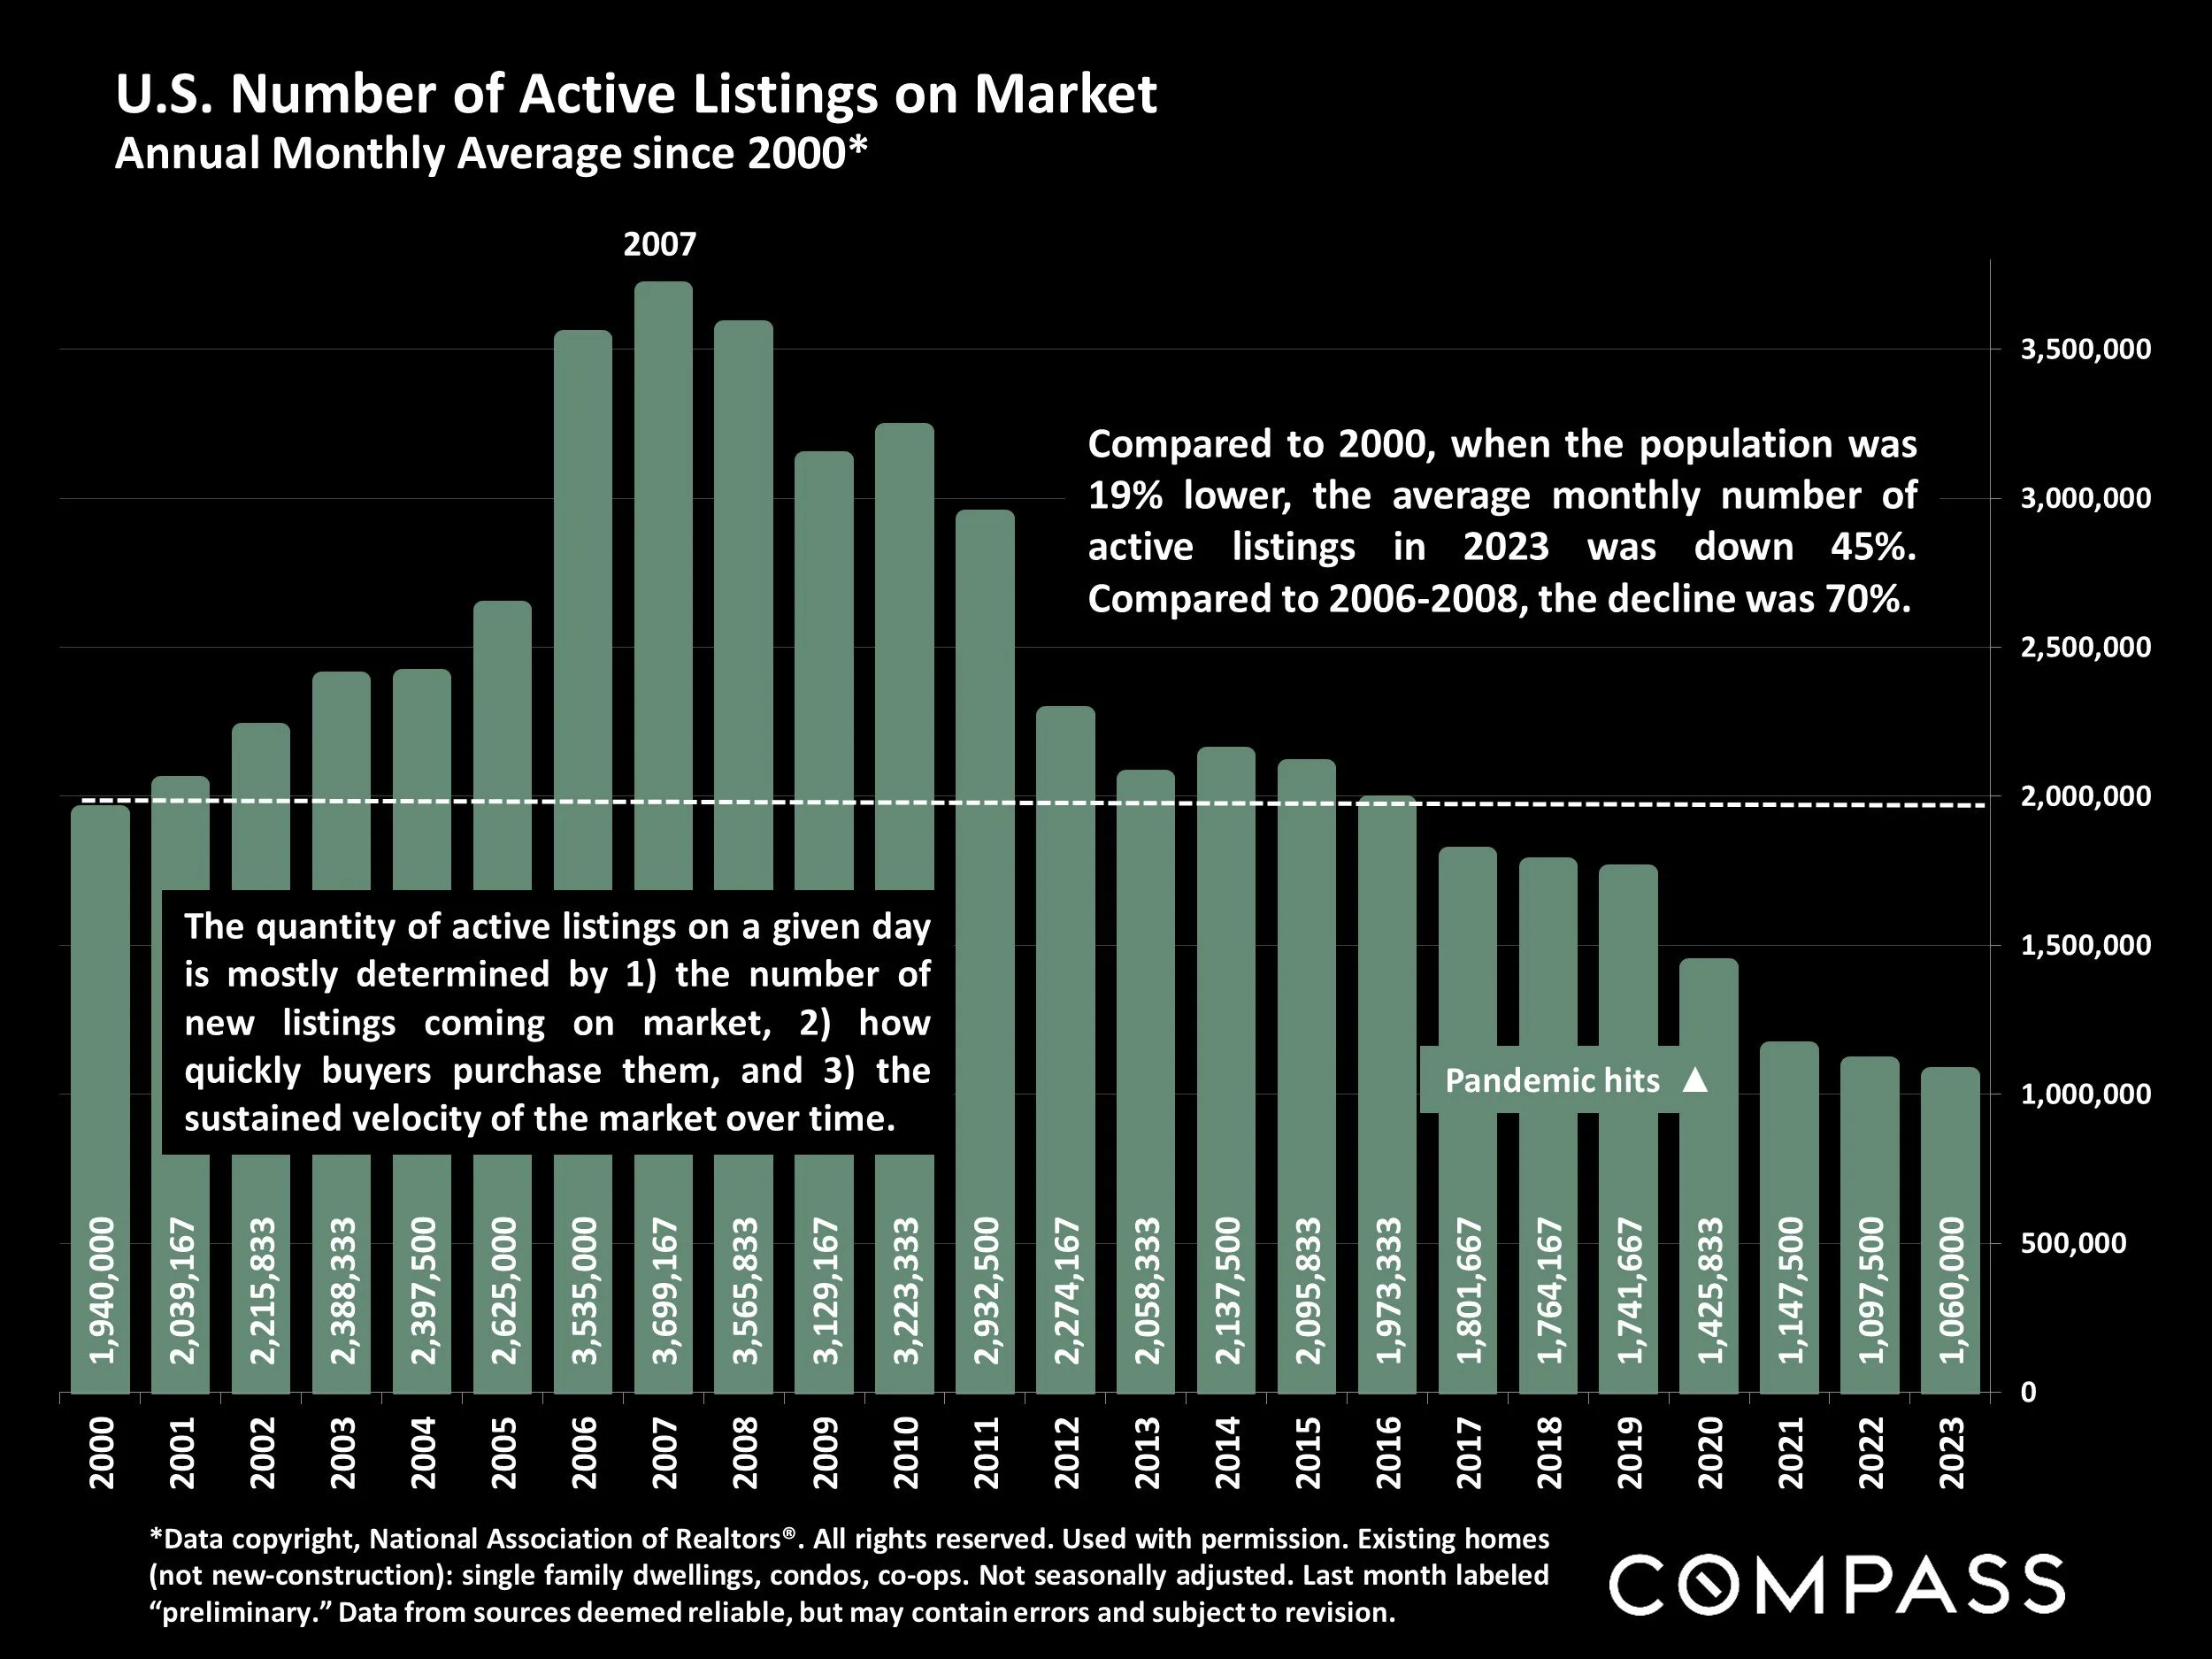
*Data copyright, National Association of Realtors®. All rights reserved. Used with permission. Existing homes (not new-construction): single family dwellings, condos, co-ops. Not seasonally adjusted. Last month labeled “preliminary.” Data from sources deemed reliable, but may contain errors and subject to revision.
Compared to 2000, when the population was 19% lower, the average monthly number of active listings in 2023 was down 45%. Compared to 2006-2008, the decline was 70%.
The quantity of active listings on a given day is mostly determined by 1) the number of new listings coming on market, 2) how quickly buyers purchase them, and 3) the sustained velocity of the market over time.
Annual New-Listing Volume (Sample Illustration)
Number of New Listings Coming on Market by Year, since 2005*
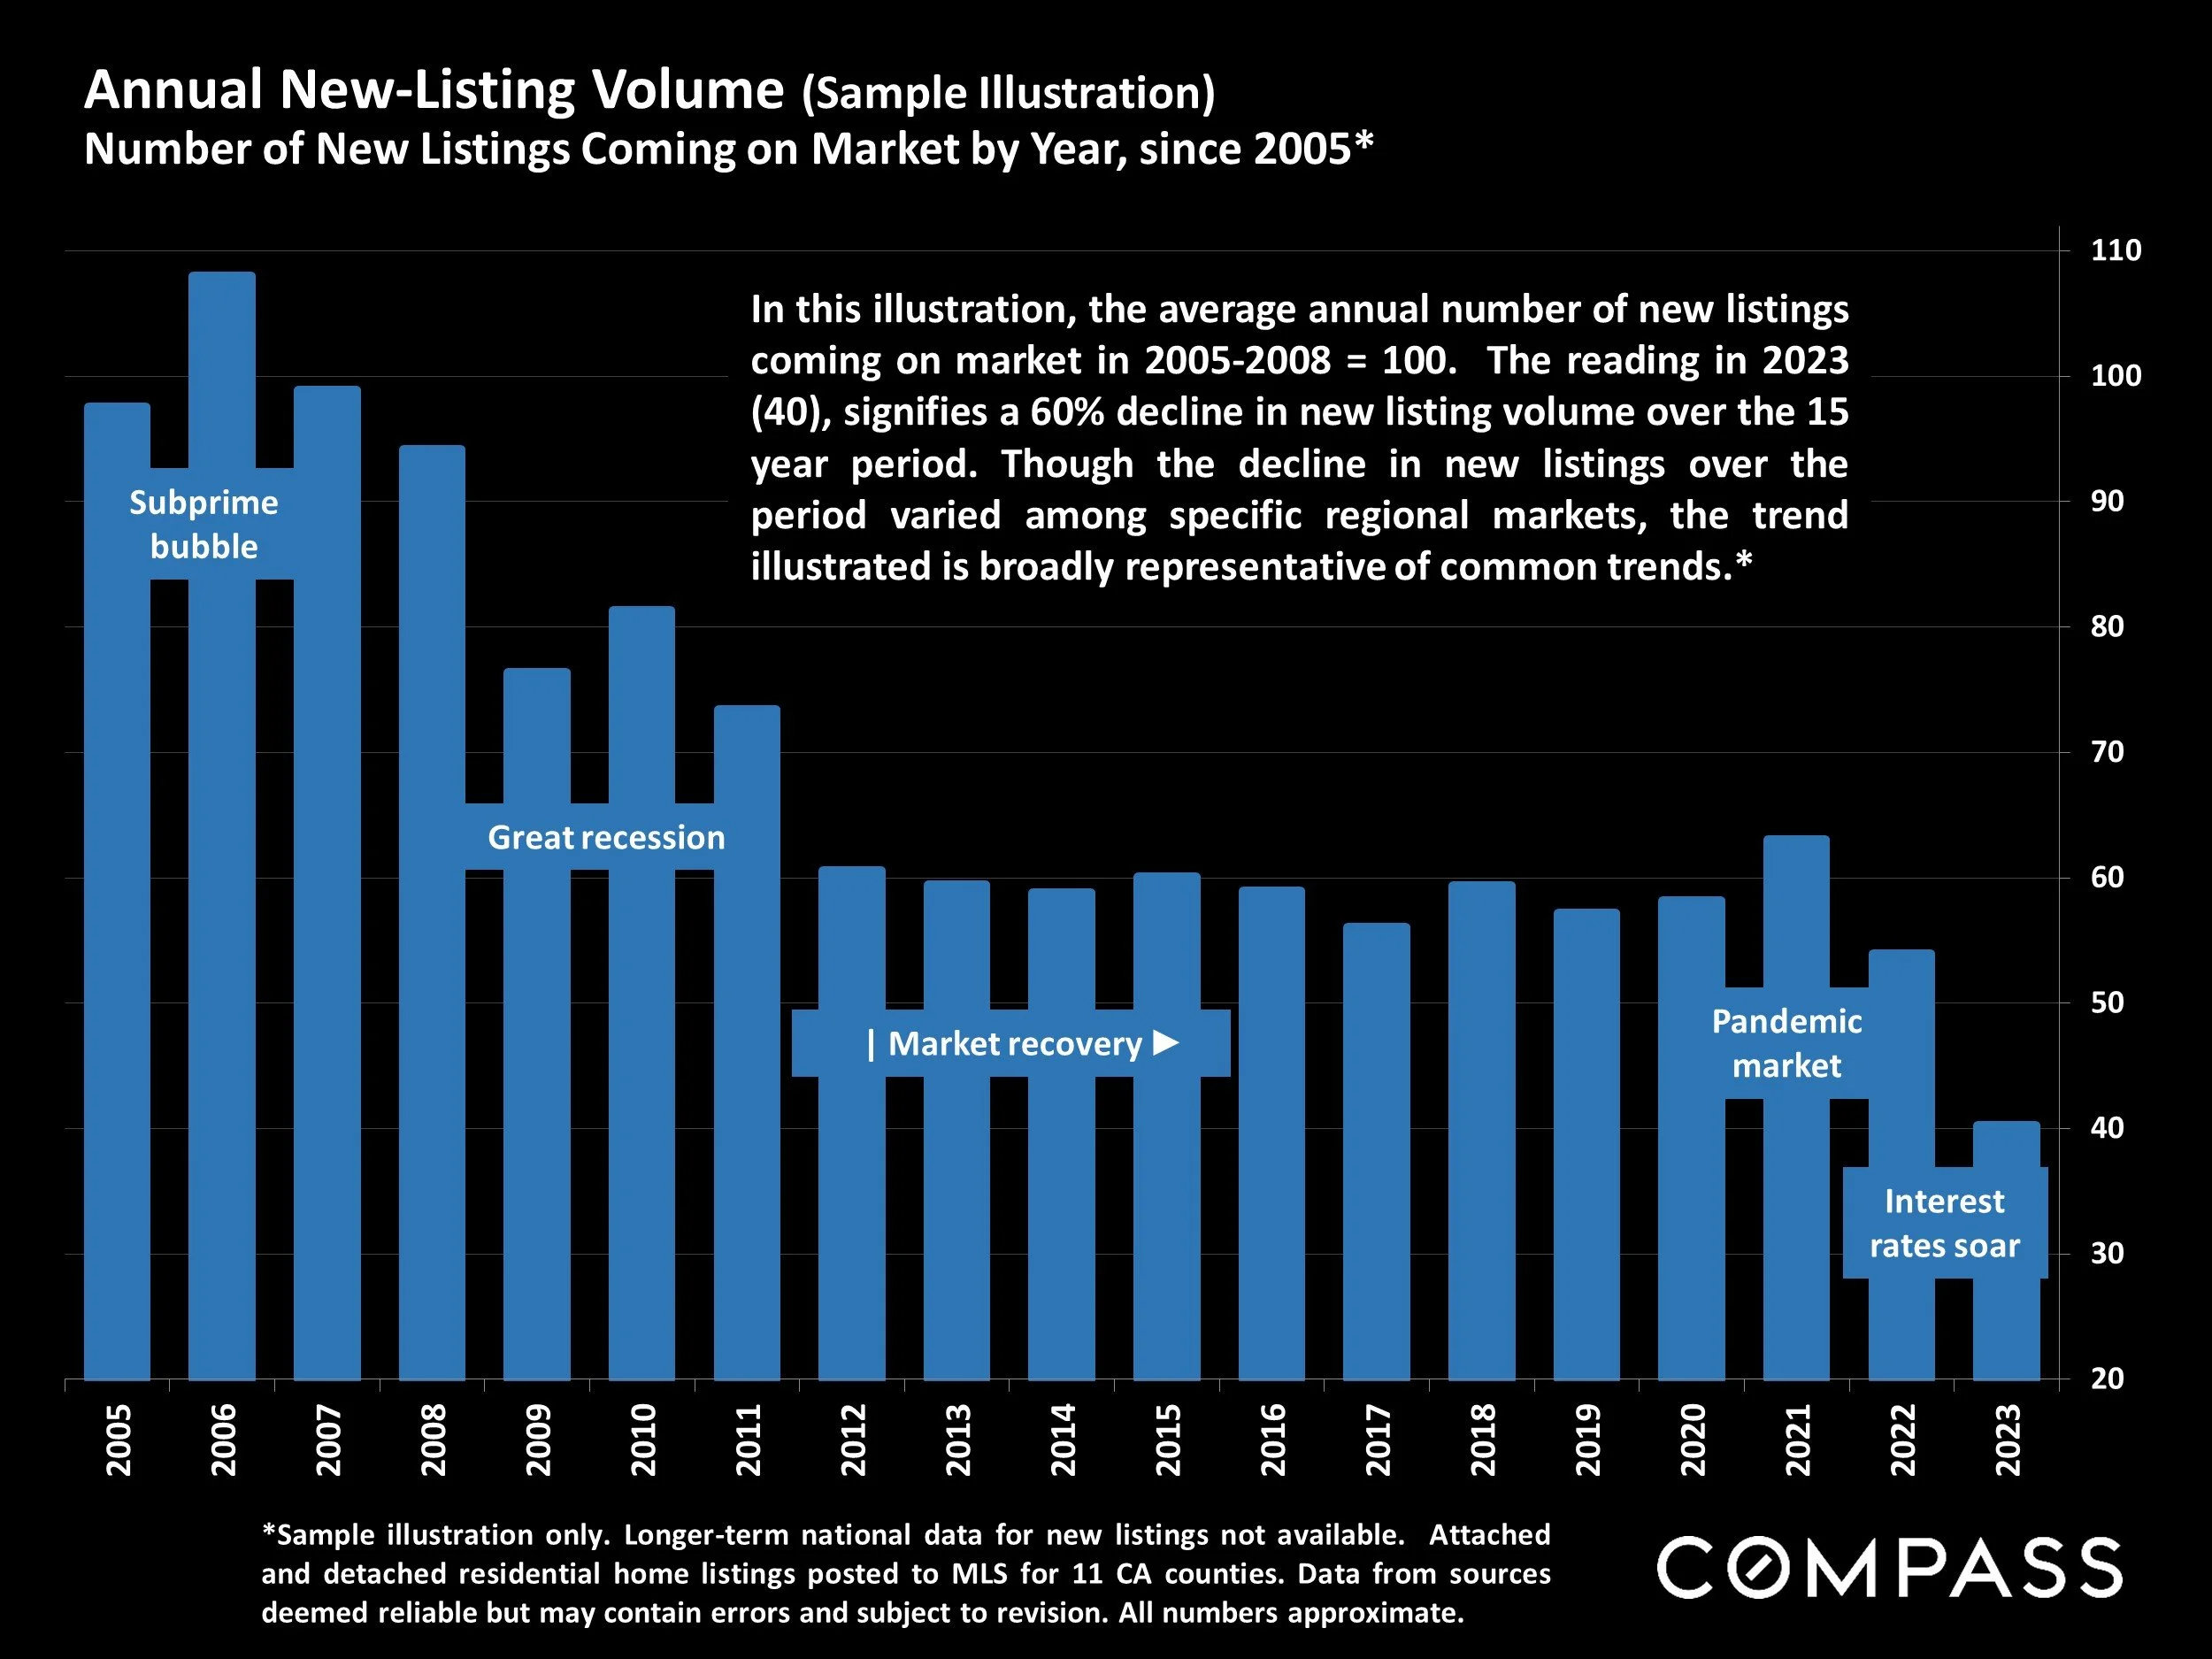
*Sample illustration only. Longer-term national data for new listings not available. Attached and detached residential home listings posted to MLS for 11 CA counties. Data from sources deemed reliable but may contain errors and subject to revision. All numbers approximate.
In this illustration, the average annual number of new listings coming on market in 2005-2008 = 100. The reading in 2023 (40), signifies a 60% decline in new listing volume over the 15 year period. Though the decline in new listings over the period varied among specific regional markets, the trend illustrated is broadly representative of common trends.*
U.S. Months Supply of Inventory (MSI)
12-Month-Rolling Average since 2000*
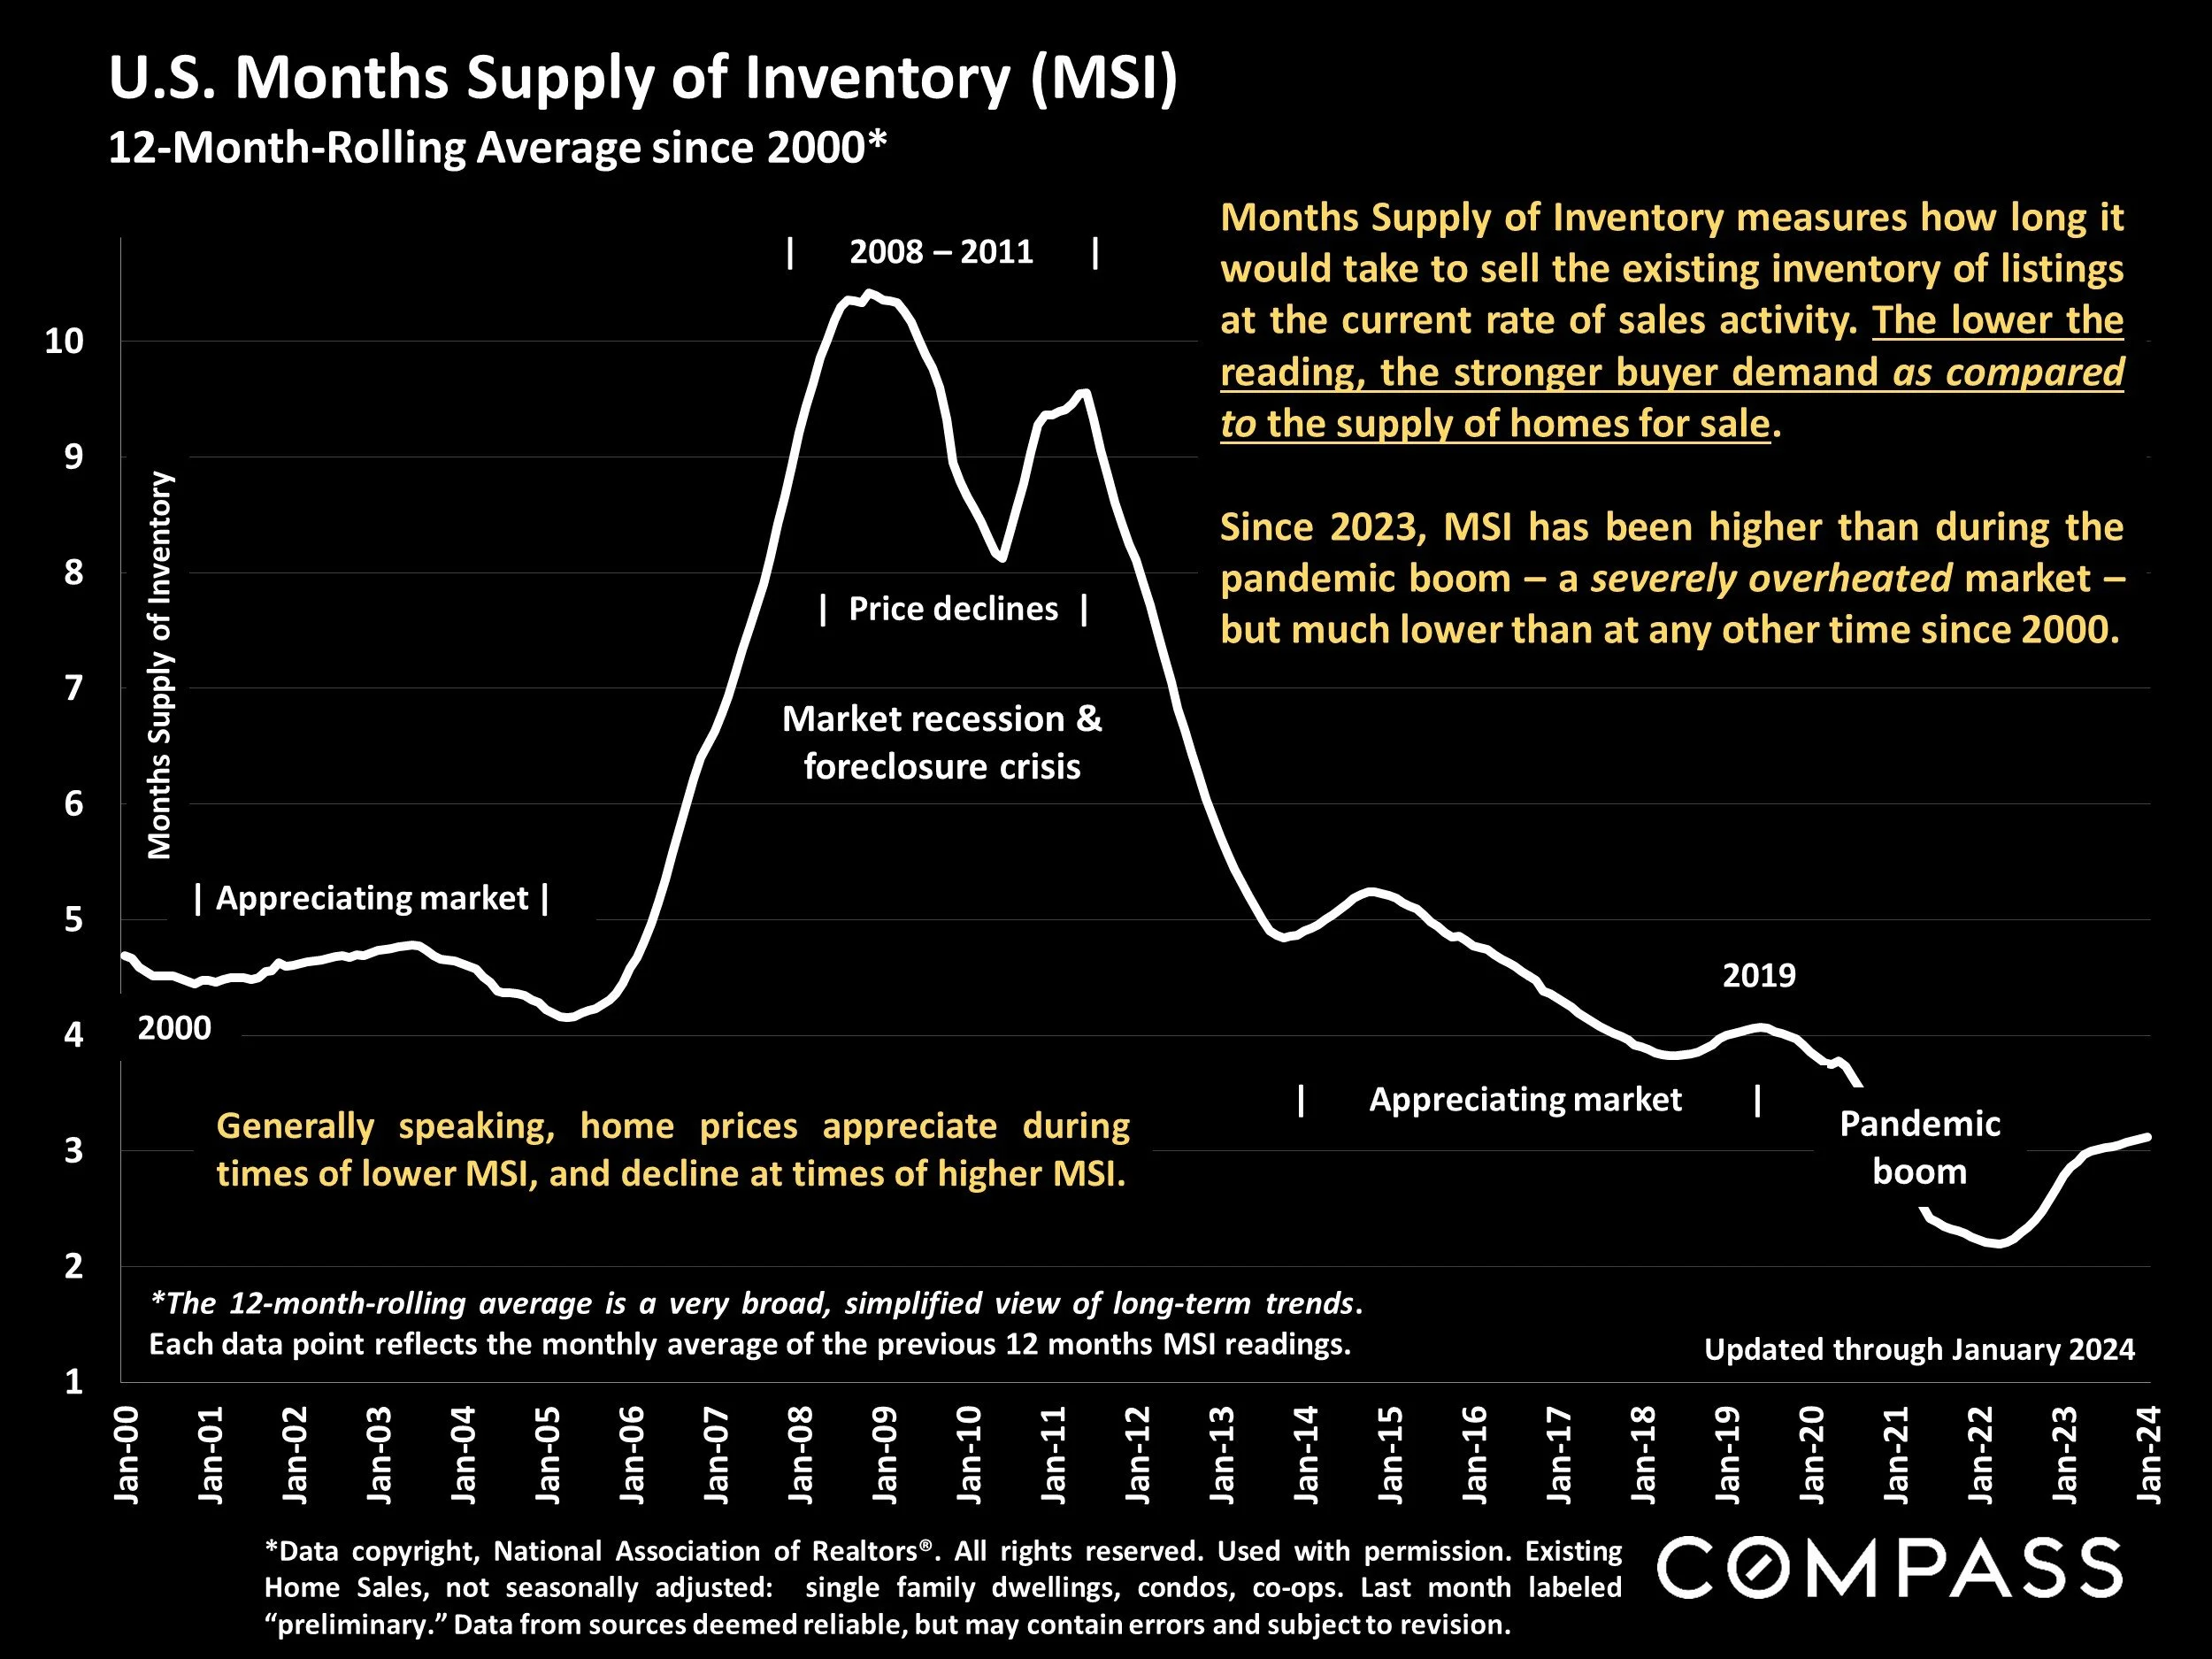
*Data copyright, National Association of Realtors®. All rights reserved. Used with permission. Existing Home Sales, not seasonally adjusted: single family dwellings, condos, co-ops. Last month labeled “preliminary.” Data from sources deemed reliable, but may contain errors and subject to revision.
Months Supply of Inventory measures how long it would take to sell the existing inventory of listings at the current rate of sales activity. The lower the reading, the stronger buyer demand as compared to the supply of homes for sale.
Since 2023, MSI has been higher than during the pandemic boom – a severely overheated market –but much lower than at any other time since 2000.
Generally speaking, home prices appreciate during times of lower MSI, and decline at times of higher MSI.
U.S. Median Days on Market – Speed of Sale
National Market Dynamics since 2011*
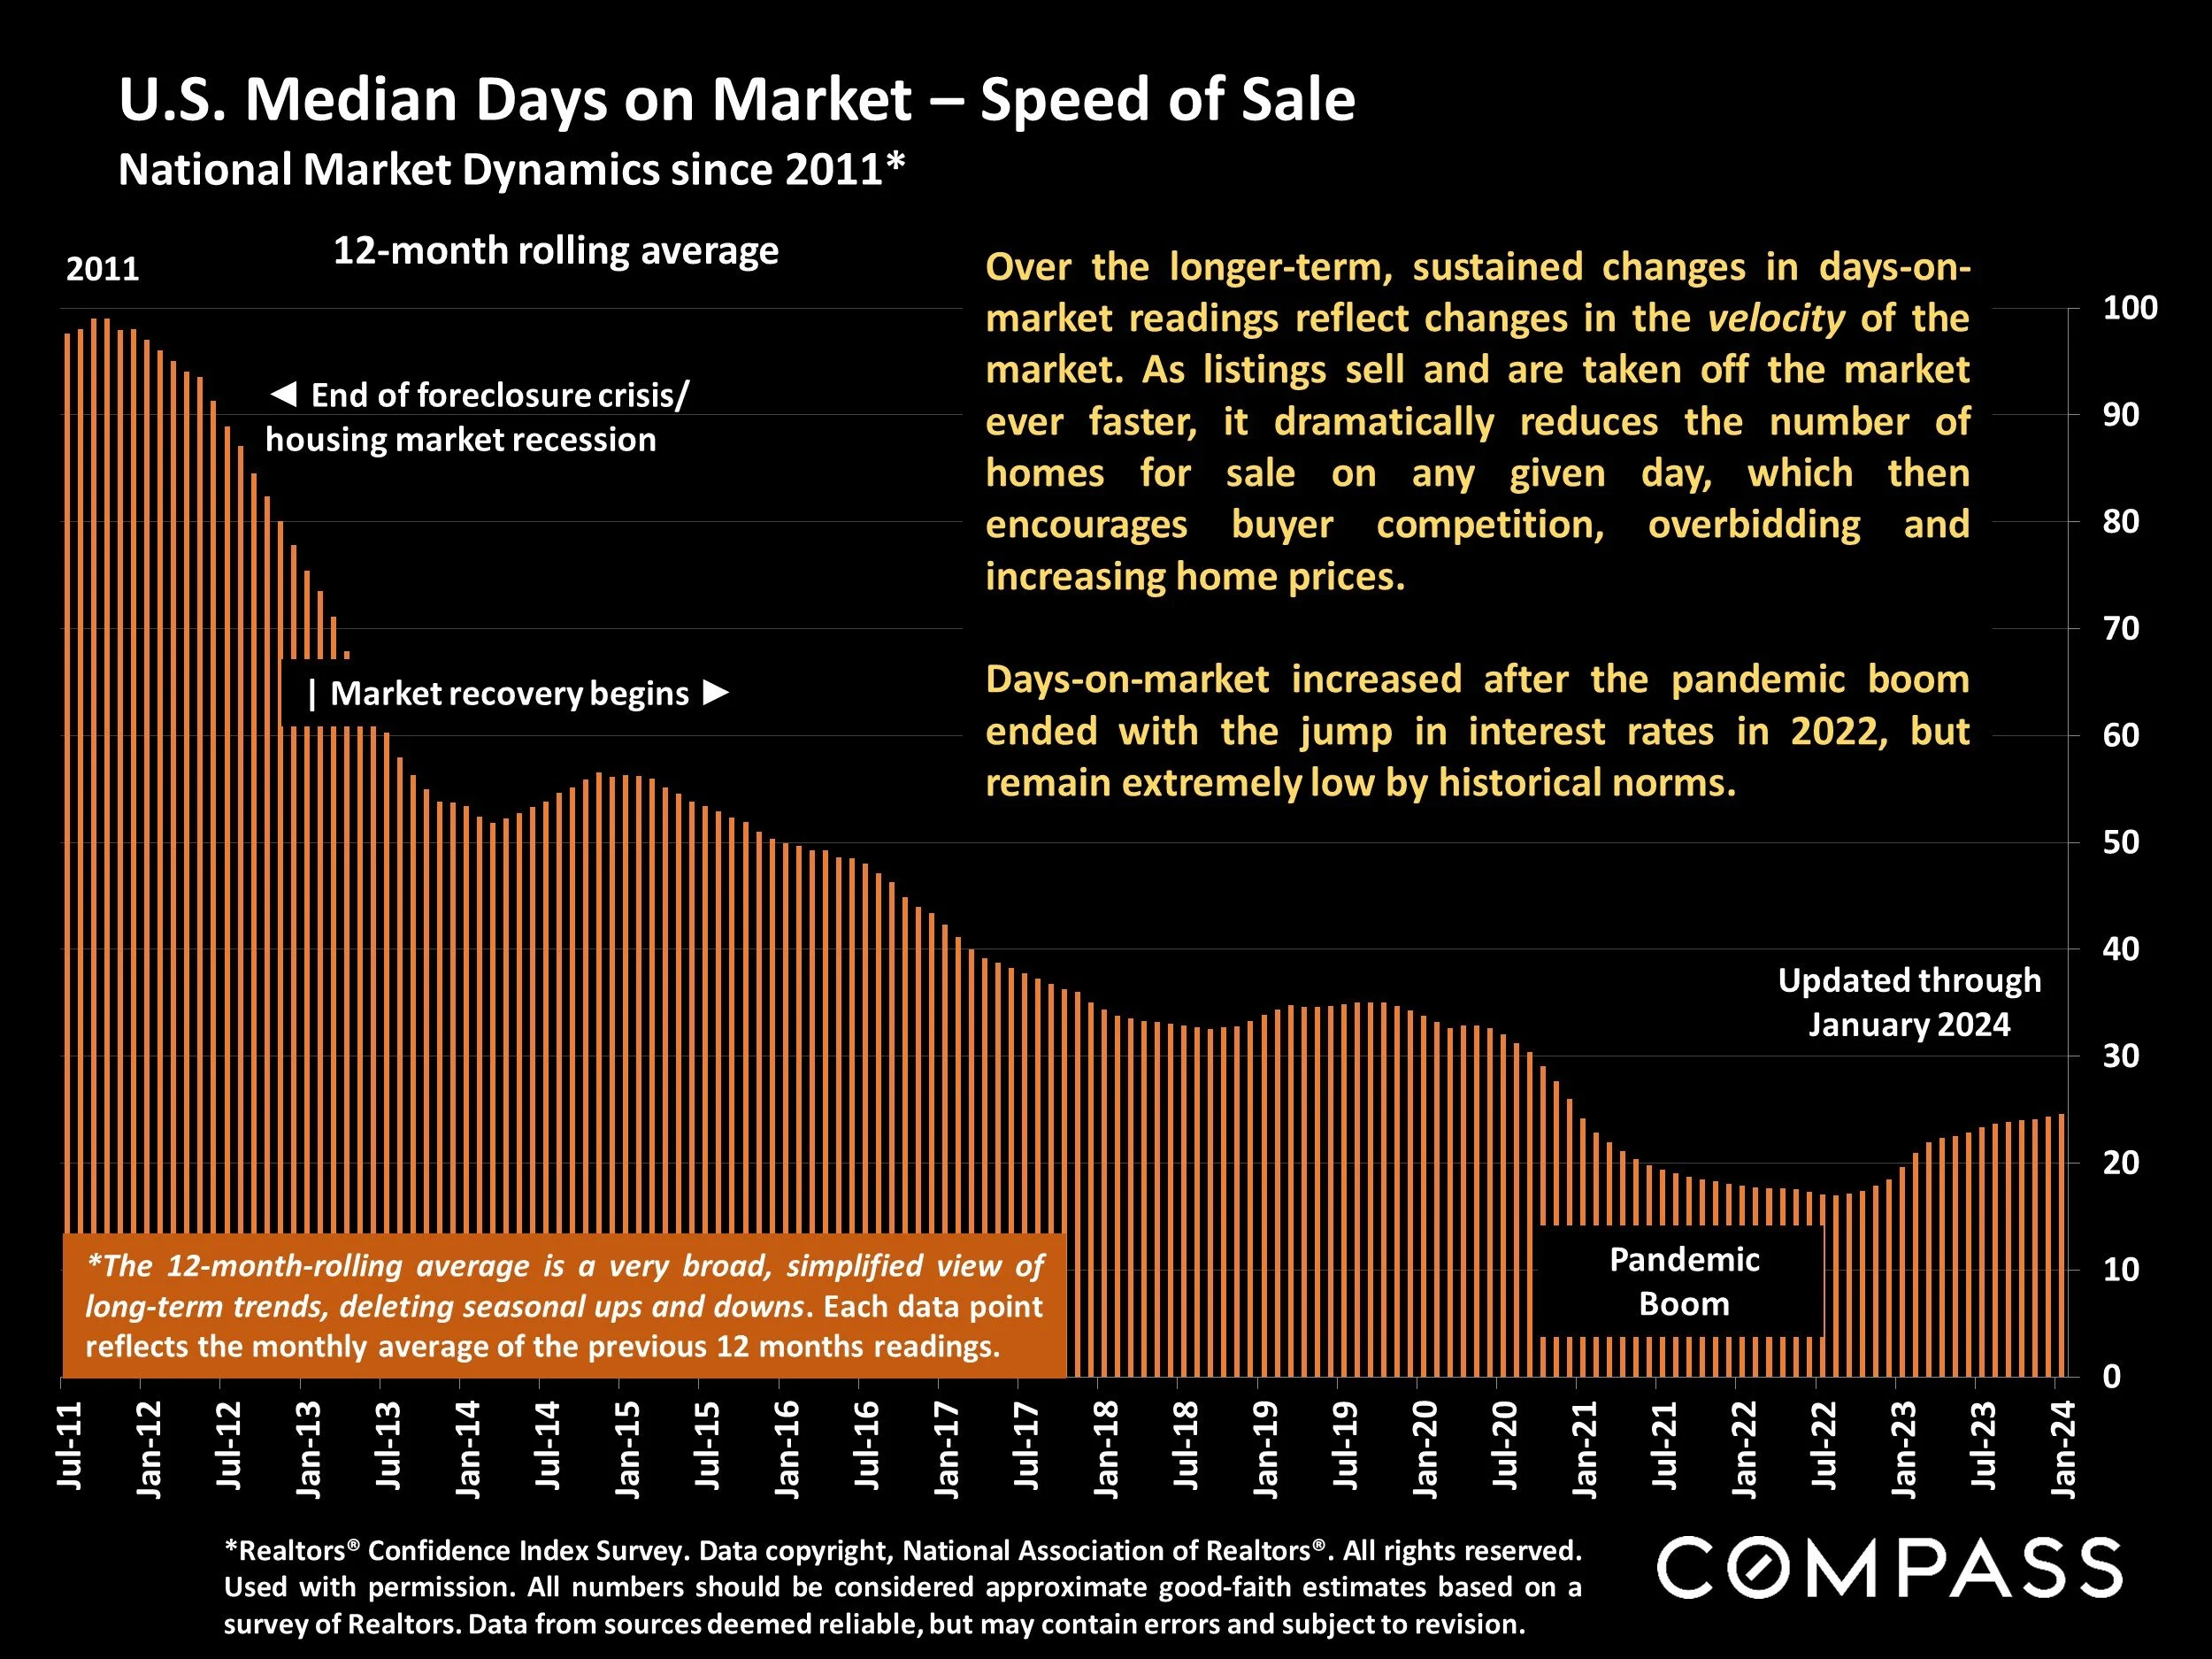
*Realtors® Confidence Index Survey. Data copyright, National Association of Realtors®. All rights reserved. Used with permission. All numbers should be considered approximate good-faith estimates based on a survey of Realtors. Data from sources deemed reliable, but may contain errors and subject to revision.
Over the longer-term, sustained changes in days-on-market readings reflect changes in the velocity of the market. As listings sell and are taken off the market ever faster, it dramatically reduces the number of homes for sale on any given day, which then encourages buyer competition, overbidding and increasing home prices.
Days-on-market increased after the pandemic boom ended with the jump in interest rates in 2022, but remain extremely low by historical norms.
Percentage of Homeowners by Age
U.S. Census Estimates, 2022*
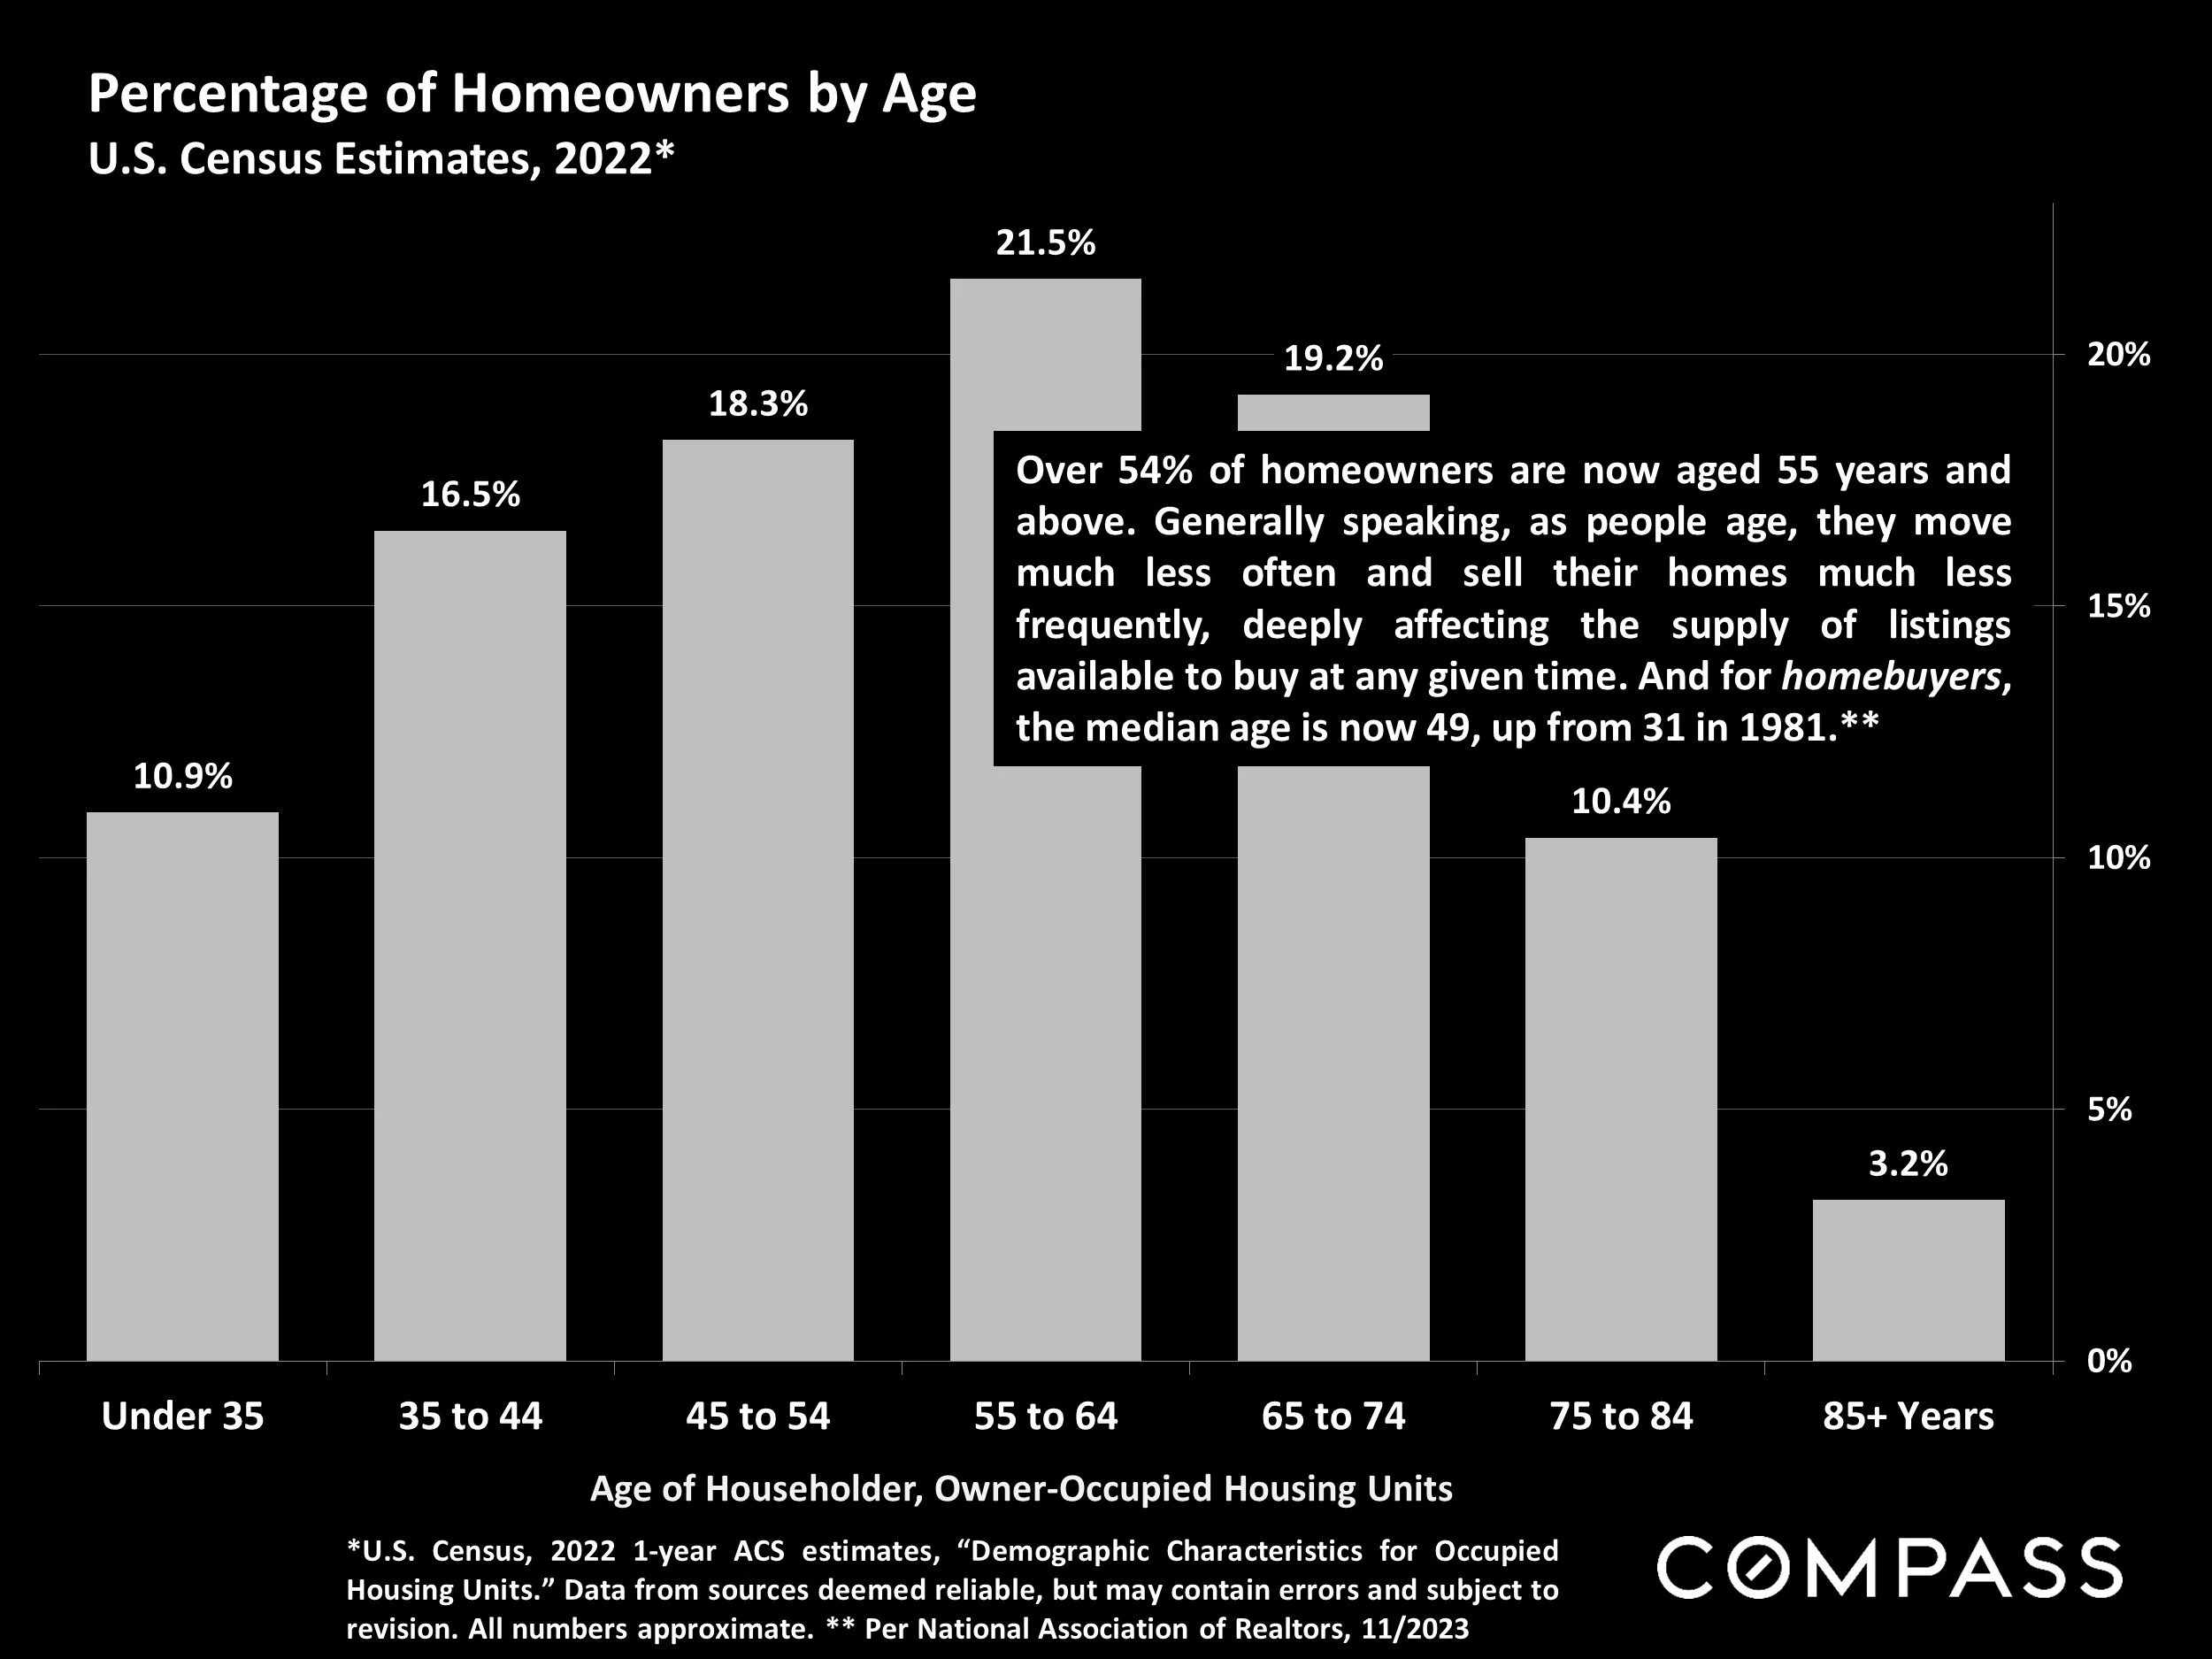
*U.S. Census, 2022 1-year ACS estimates, “Demographic Characteristics for Occupied Housing Units.” Data from sources deemed reliable, but may contain errors and subject to revision. All numbers approximate. ** Per National Association of Realtors, 11/2023
Over 54% of homeowners are now aged 55 years and above. Generally speaking, as people age, they move much less often and sell their homes much less frequently, deeply affecting the supply of listings available to buy at any given time. And for homebuyers, the median age is now 49, up from 31 in 1981.**
Period of Homeownership before Selling
National Data, in Years, since 1985*
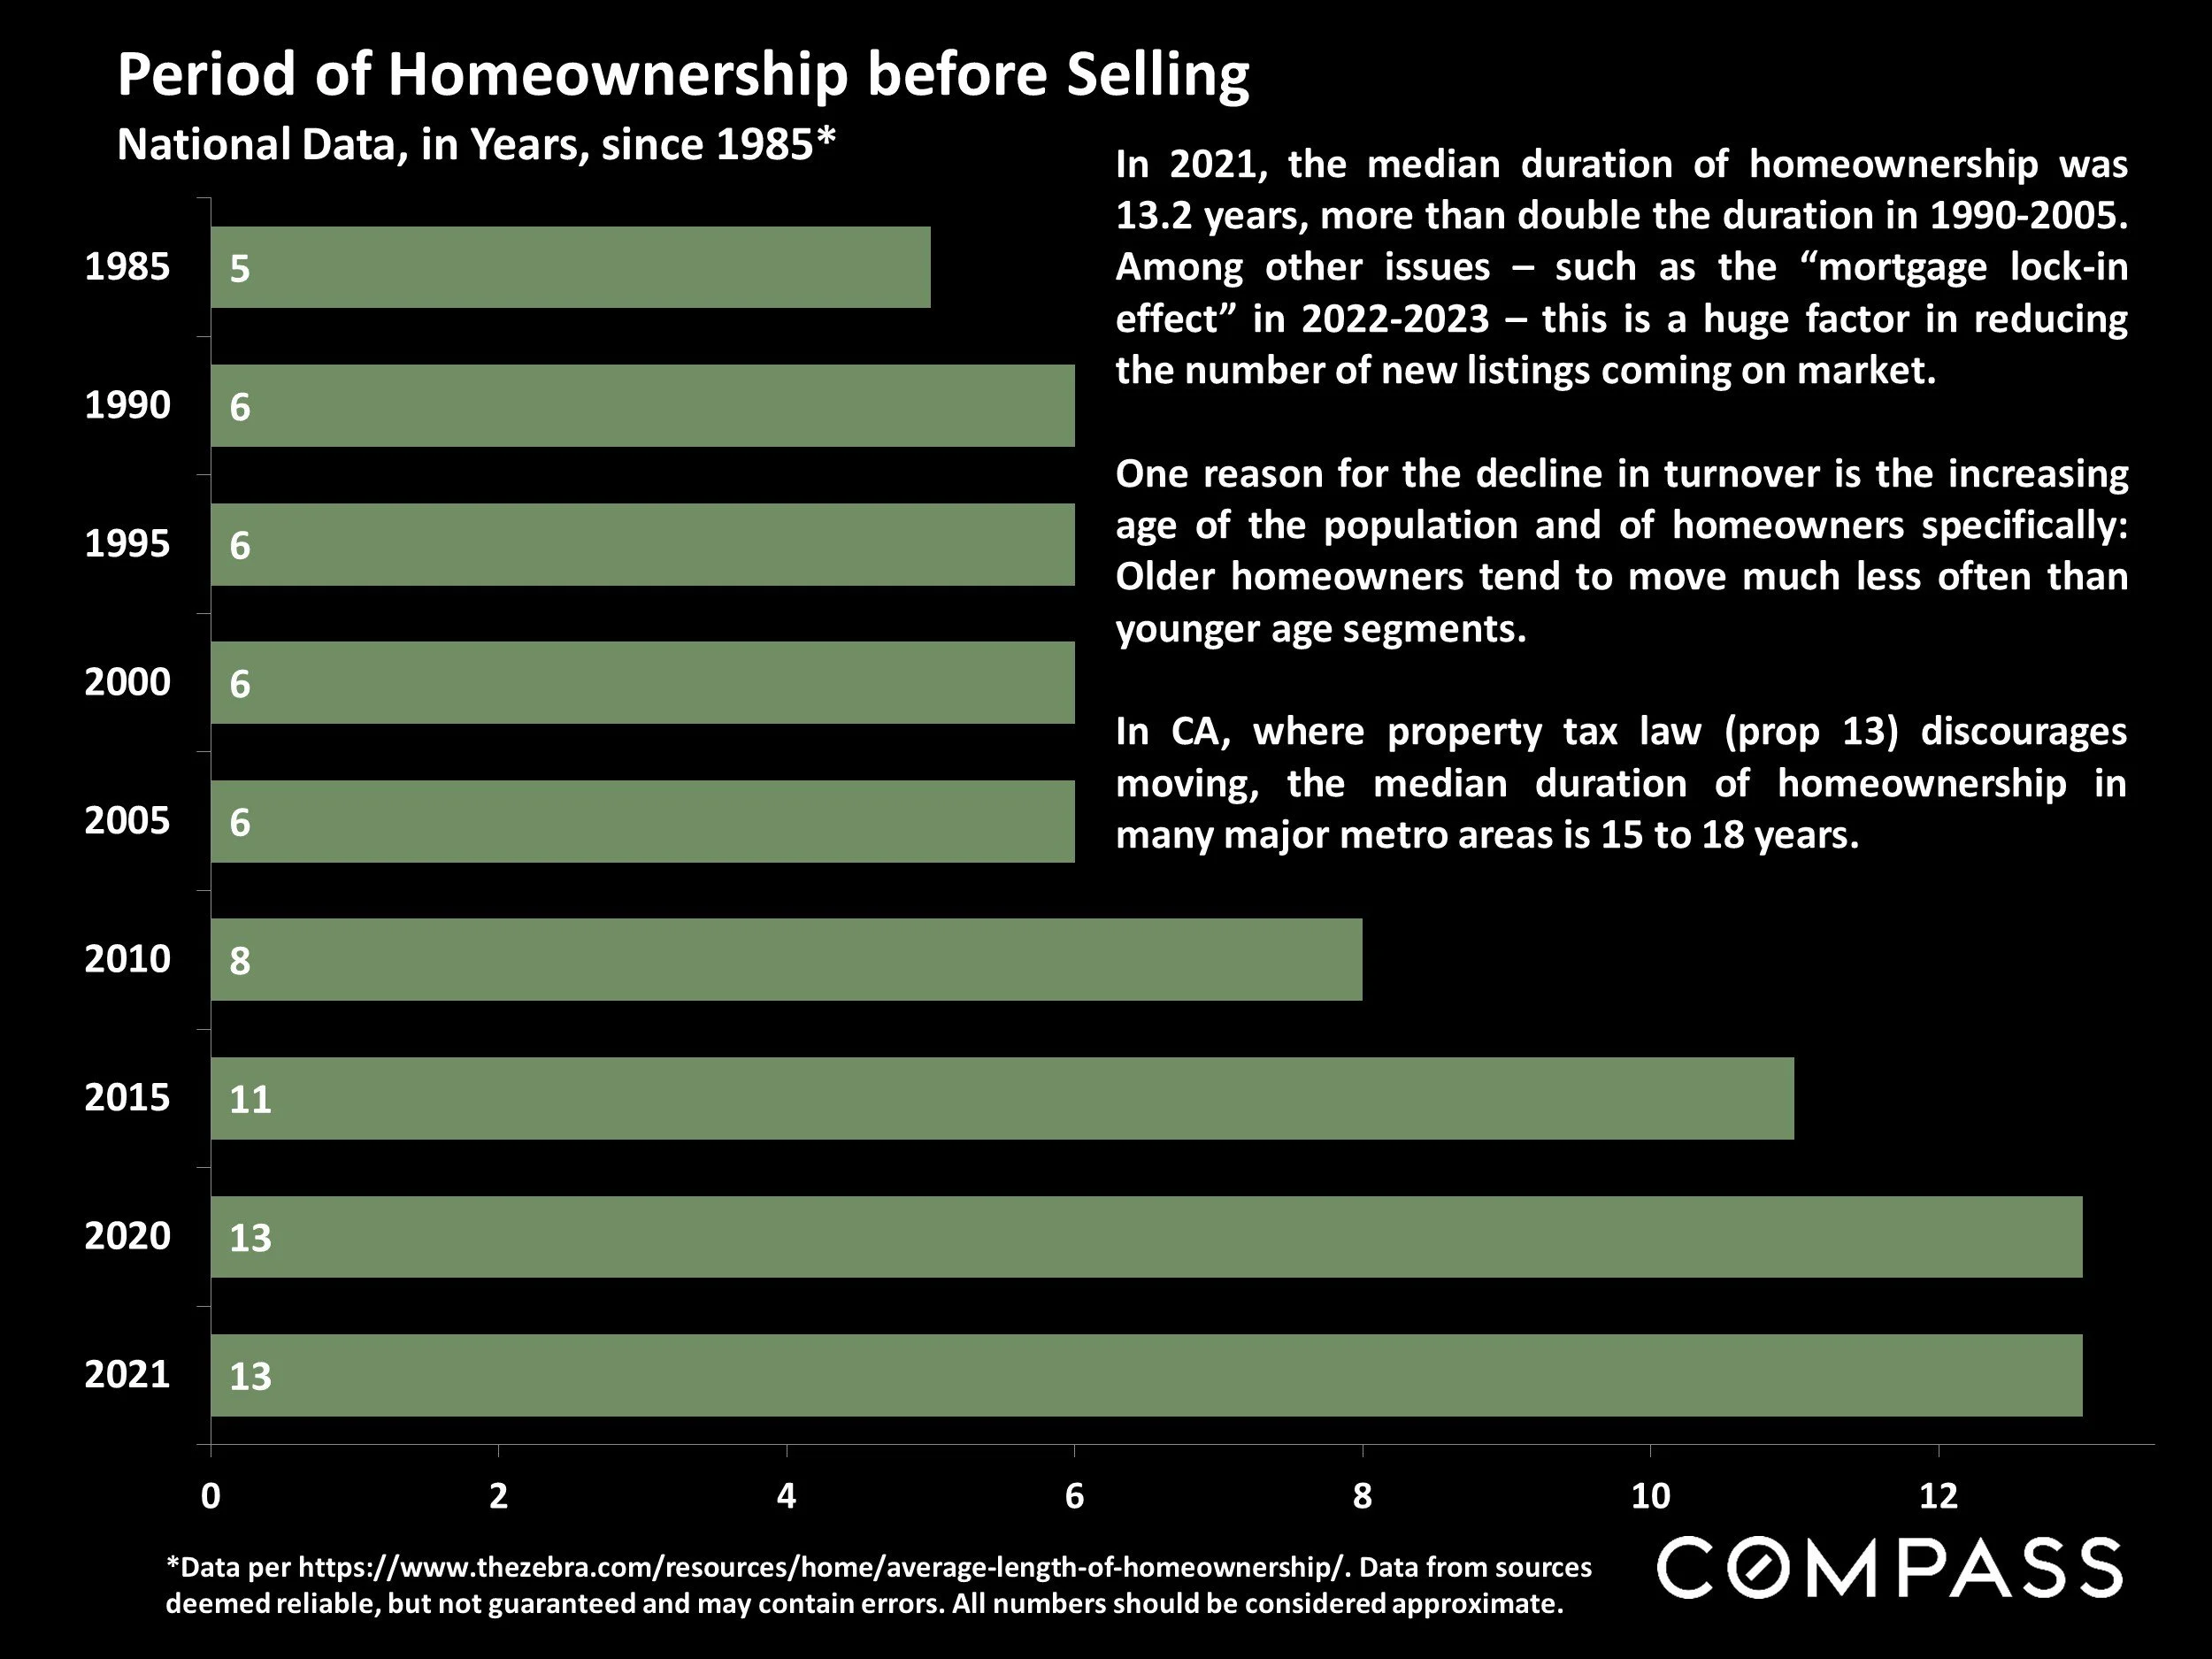
*Data per https://www.thezebra.com/resources/home/average-length-of-homeownership/. Data from sources deemed reliable, but not guaranteed and may contain errors. All numbers should be considered approximate.
In 2021, the median duration of homeownership was 13.2 years, more than double the duration in 1990-2005. Among other issues – such as the “mortgage lock-in effect” in 2022-2023 – this is a huge factor in reducing the number of new listings coming on market.
One reason for the decline in turnover is the increasing age of the population and of homeowners specifically: Older homeowners tend to move much less often than younger age segments.
In CA, where property tax law (prop 13) discourages moving, the median duration of homeownership in many major metro areas is 15 to 18 years.
Percentage of Buyers: Non-Primary Residence*
National Market Dynamics since 2016, Broad Trend Survey
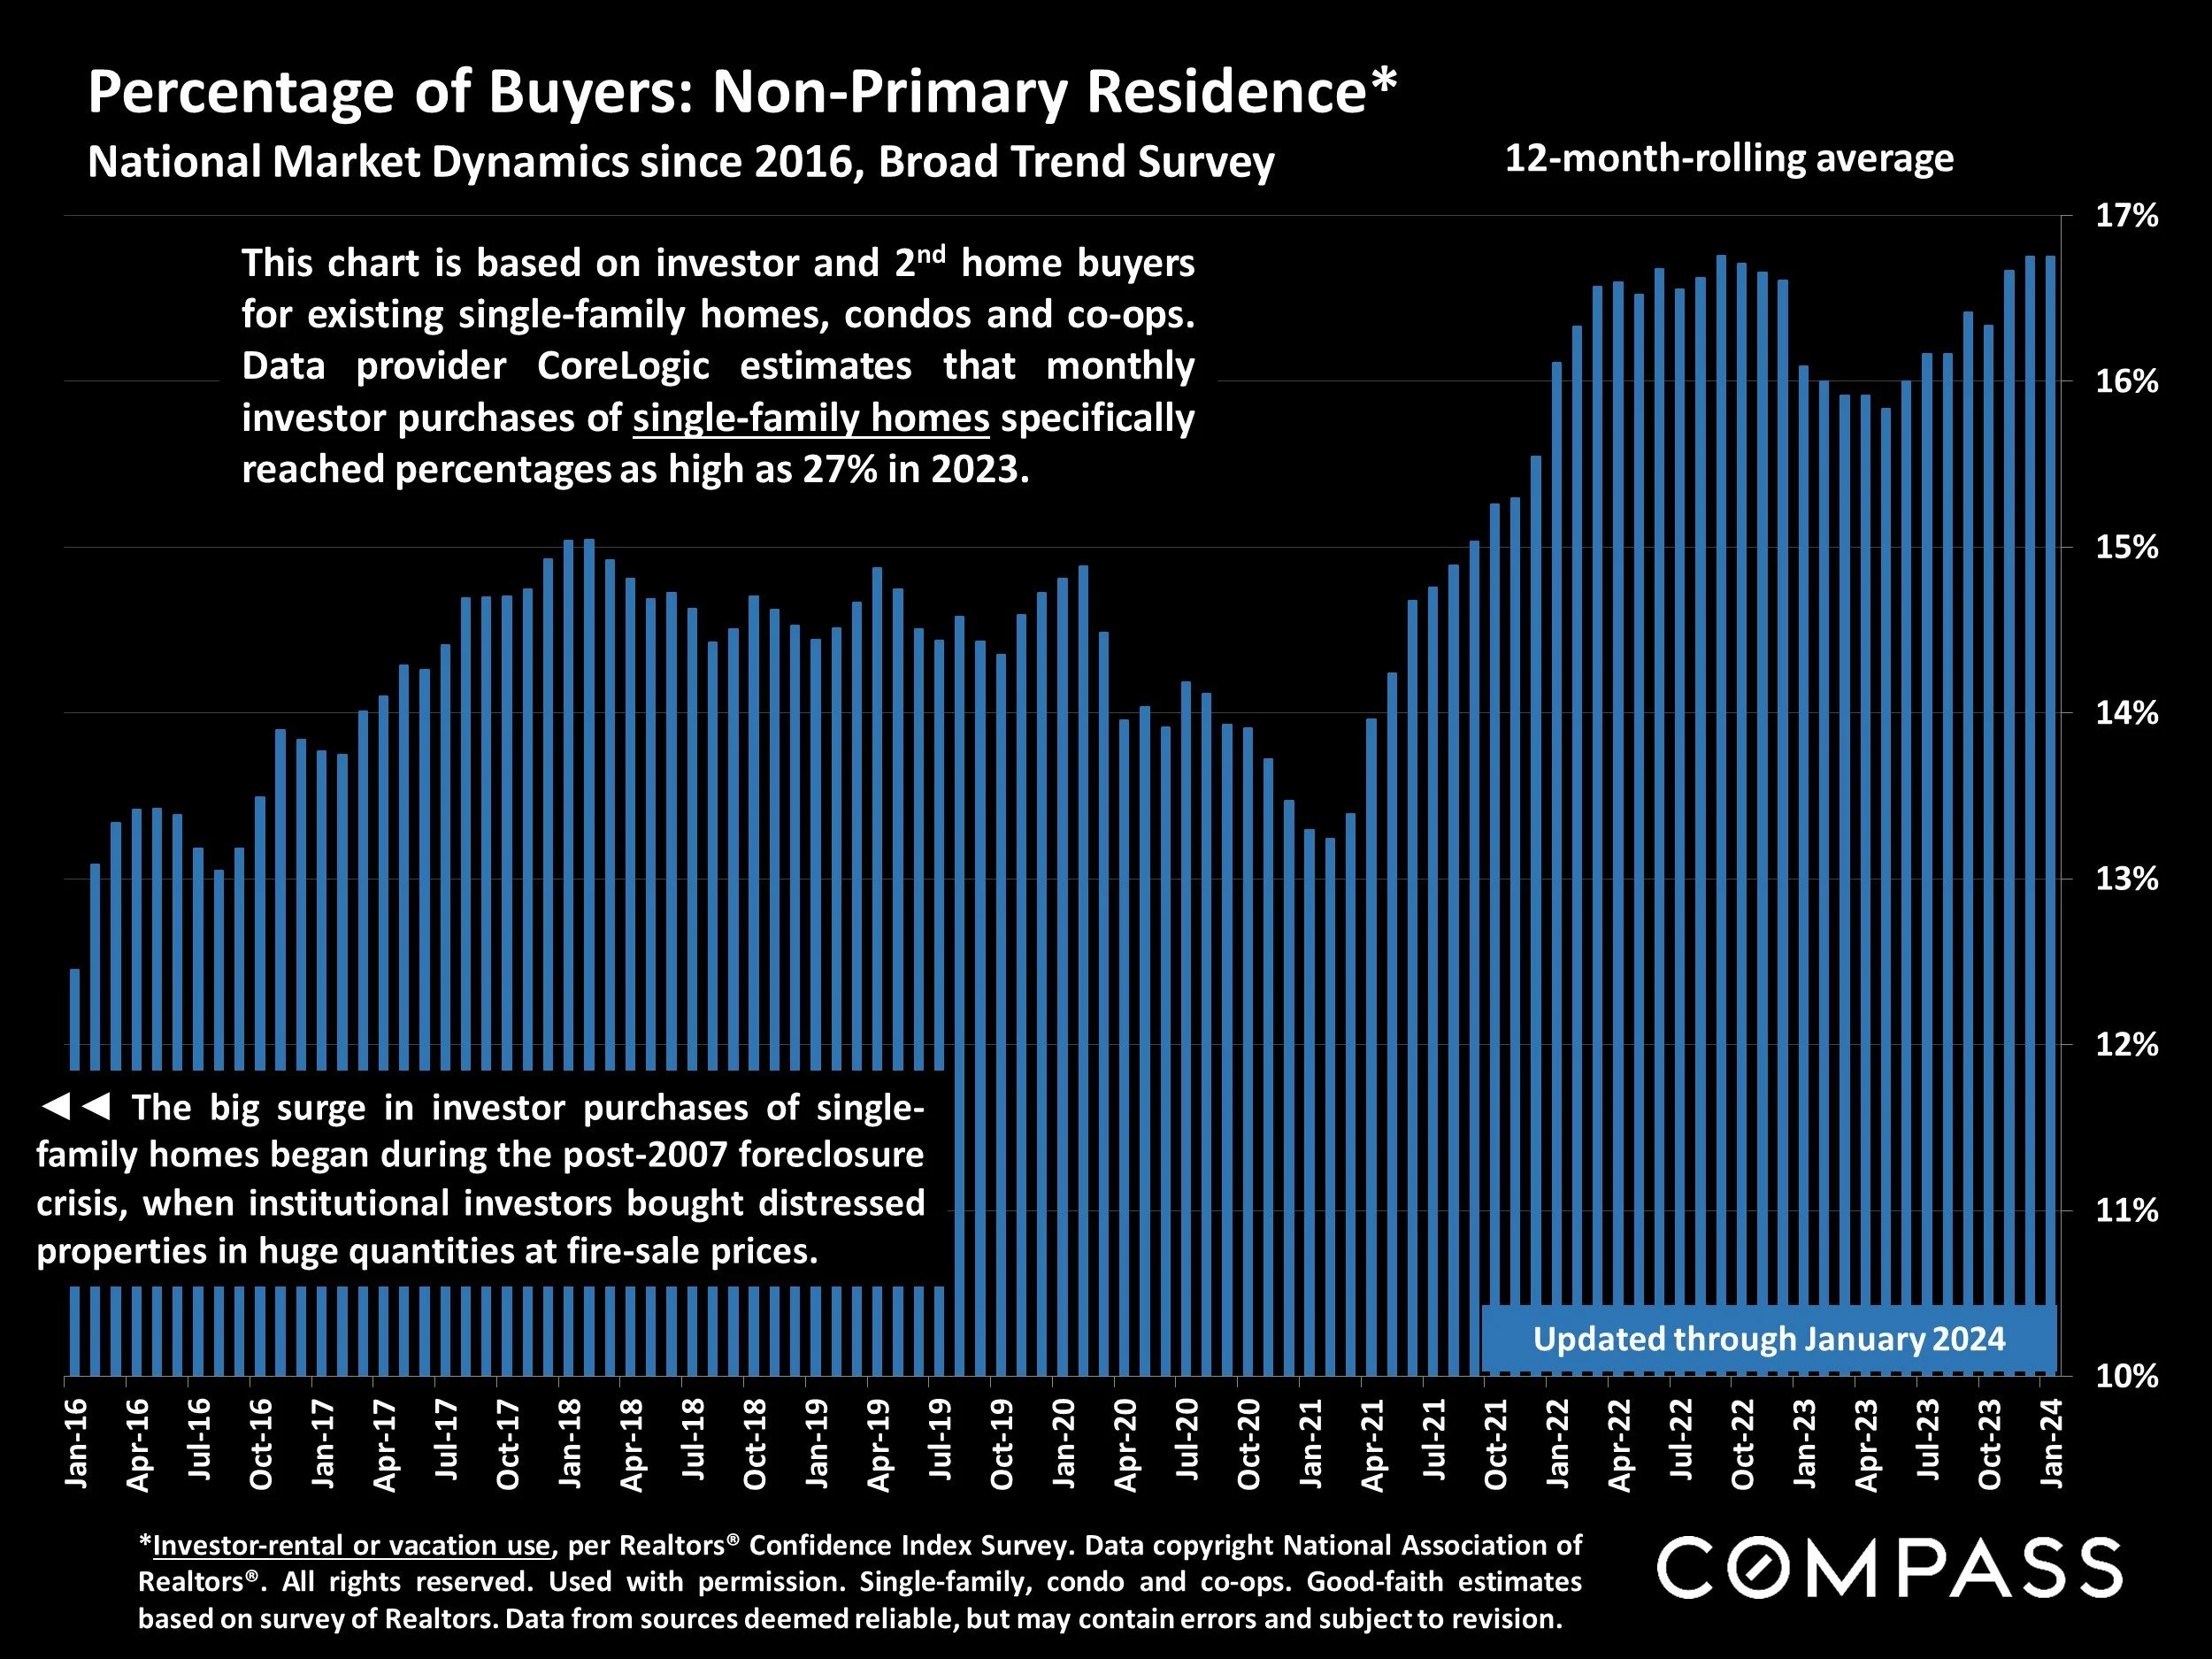
*Investor-rental or vacation use, per Realtors® Confidence Index Survey. Data copyright National Association of Realtors®. All rights reserved. Used with permission. Single-family, condo and co-ops. Good-faith estimates based on survey of Realtors. Data from sources deemed reliable, but may contain errors and subject to revision.
This chart is based on investor and 2nd home buyers for existing single-family homes, condos and co-ops. Data provider CoreLogic estimates that monthly investor purchases of single-family homes specifically reached percentages as high as 27% in 2023.
The bug surge in investor purchase of single-family homes began during. the post-2007 foreclosure crisis, when institutional investors bought distressed properties in huge quantities at fire sale prices.
U.S. Percentage of All-Cash Buyers
National Market Dynamics since 2015, by Month*

*Realtors® Confidence Index Survey. Data copyright, National Association of Realtors®. All rights reserved. Used with permission. 3-month rolling average of NAR data. All numbers are approximate good-faith estimates based on a survey of Realtors. Data from sources deemed reliable, but may contain errors and subject to revision.
*Realtors® Confidence Index Survey. Data copyright, National Association of Realtors®. All rights reserved. Used with permission. 3-month rolling average of NAR data. All numbers are approximate good-faith estimates based on a survey of Realtors. Data from sources deemed reliable, but may contain errors and subject to revision.
The percentage of all-cash purchases in the last year hit its highest point in almost 10 years.
All-cash buyers are concentrated among investors and older, more affluent households, who then typically sell much less frequently than long-term historical norms, which then reduces new listing numbers.
Percentage of Sales with First-Time Buyers
National Market Dynamics since 2010**
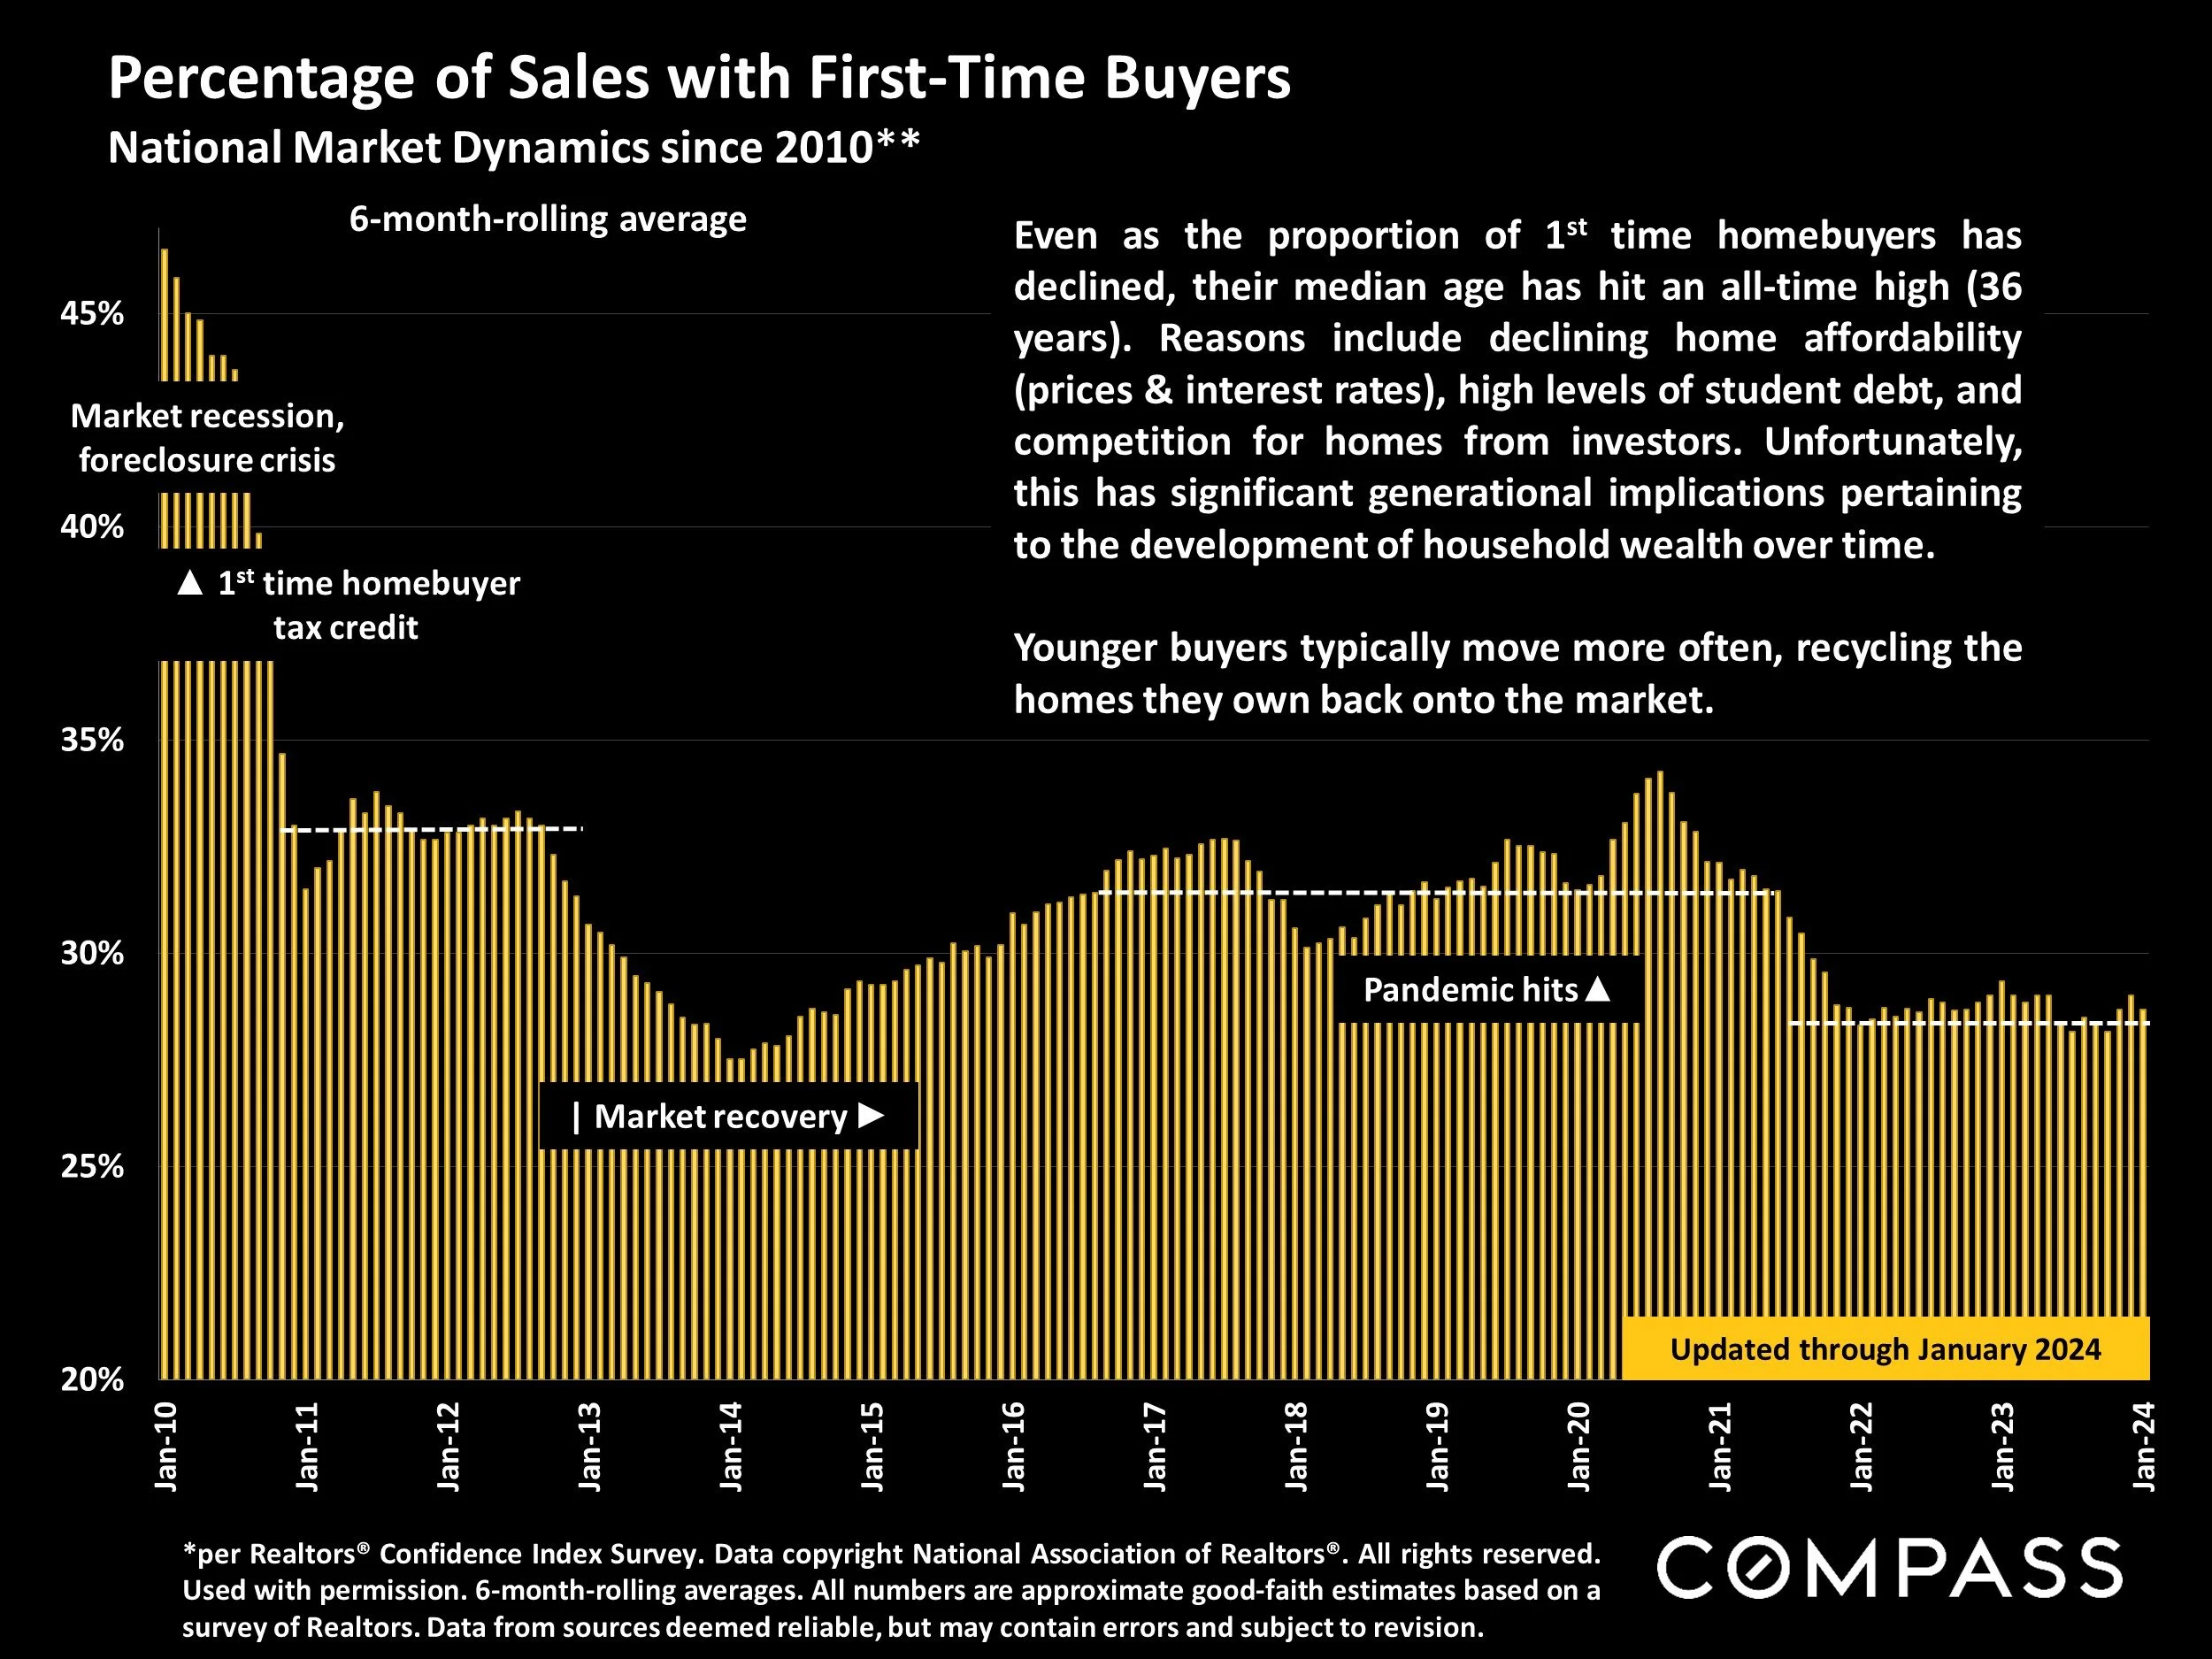
*per Realtors® Confidence Index Survey. Data copyright National Association of Realtors®. All rights reserved. Used with permission. 6-month-rolling averages. All numbers are approximate good-faith estimates based on a survey of Realtors. Data from sources deemed reliable, but may contain errors and subject to revision.
Even as the proportion of 1st time homebuyers has declined, their median age has hit an all-time high (36 years). Reasons include declining home affordability (prices & interest rates), high levels of student debt, and competition for homes from investors. Unfortunately, this has significant generational implications pertaining to the development of household wealth over time.
Younger buyers typically move more often, recycling the homes they own back onto the market.
U.S. New-Construction Single-Family Homes For Sale
By Month, in Thousands of Units, since 2000*
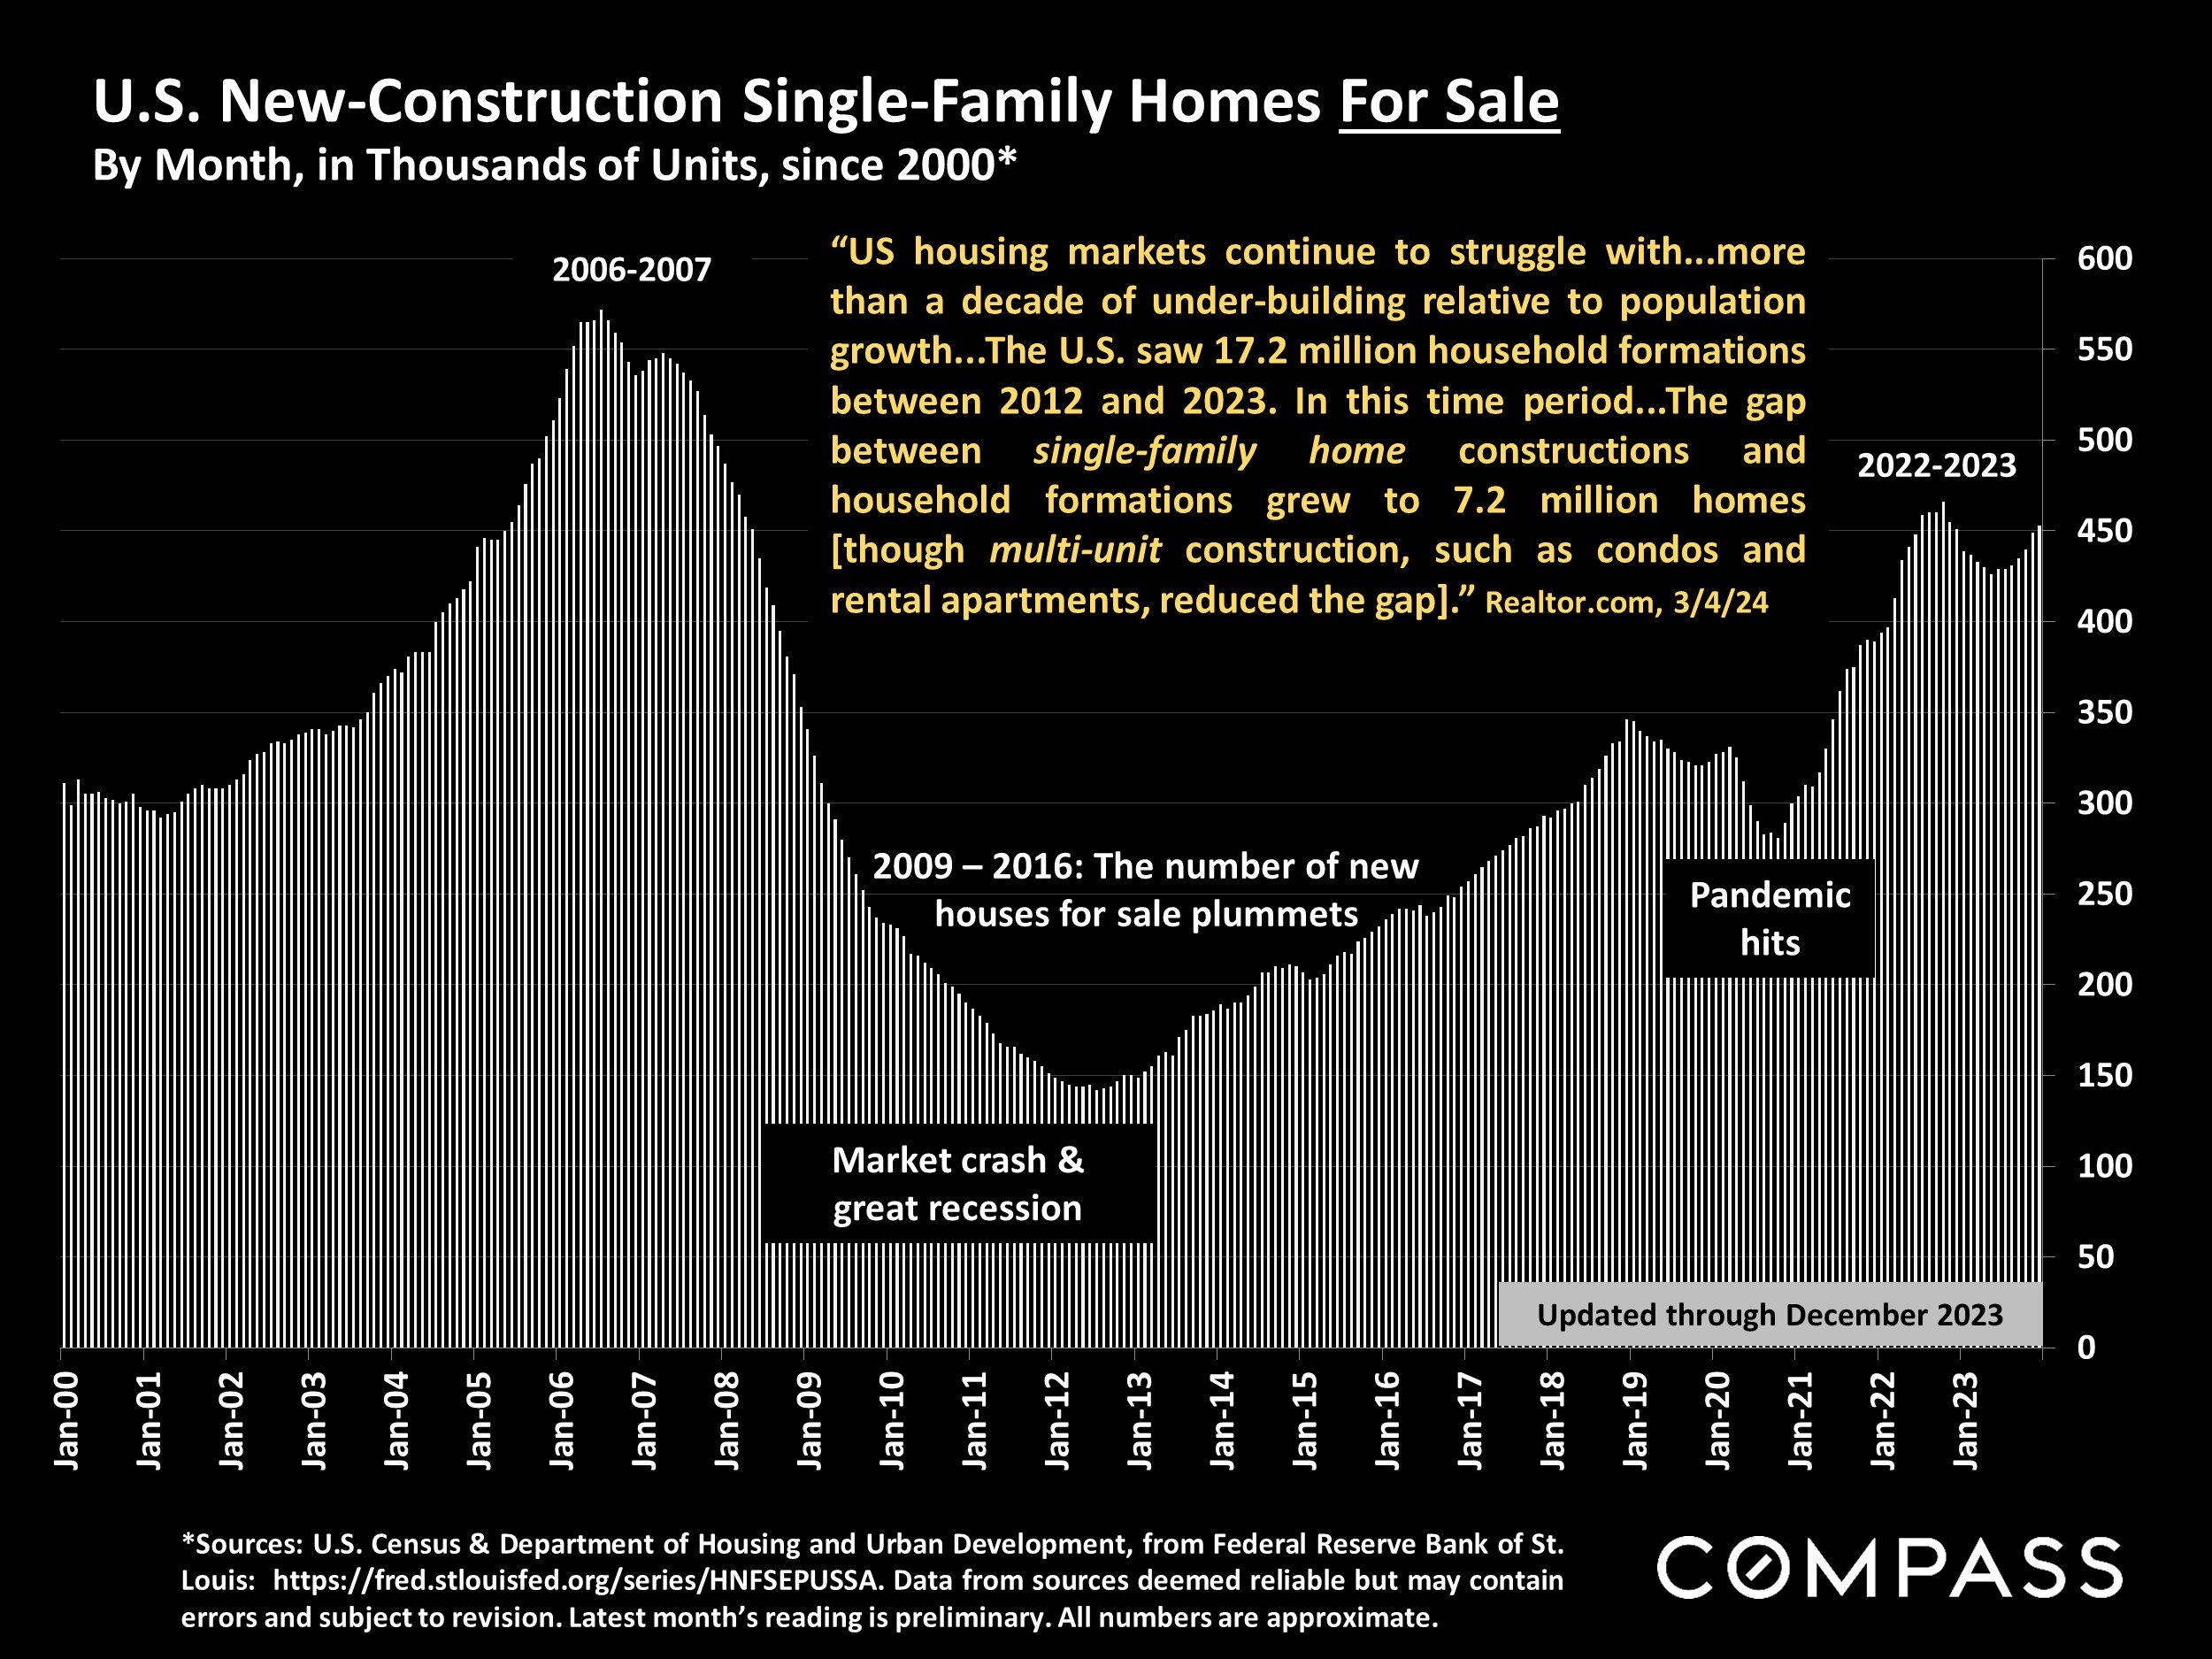
*Sources: U.S. Census & Department of Housing and Urban Development, from Federal Reserve Bank of St. Louis: https://fred.stlouisfed.org/series/HNFSEPUSSA. Data from sources deemed reliable but may contain errors and subject to revision. Latest month’s reading is preliminary. All numbers are approximate.
“US housing markets continue to struggle with...more than a decade of under-building relative to population growth...The U.S. saw 17.2 million household formations between 2012 and 2023. In this time period...The gap between single-family home constructions and household formations grew to 7.2 million homes [though multi-unit construction, such as condos and rental apartments, reduced the gap].”
— Realtor.com, 3/4/24
New Construction by State
Housing Units Permitted, by Month, per 100,000 Residents*
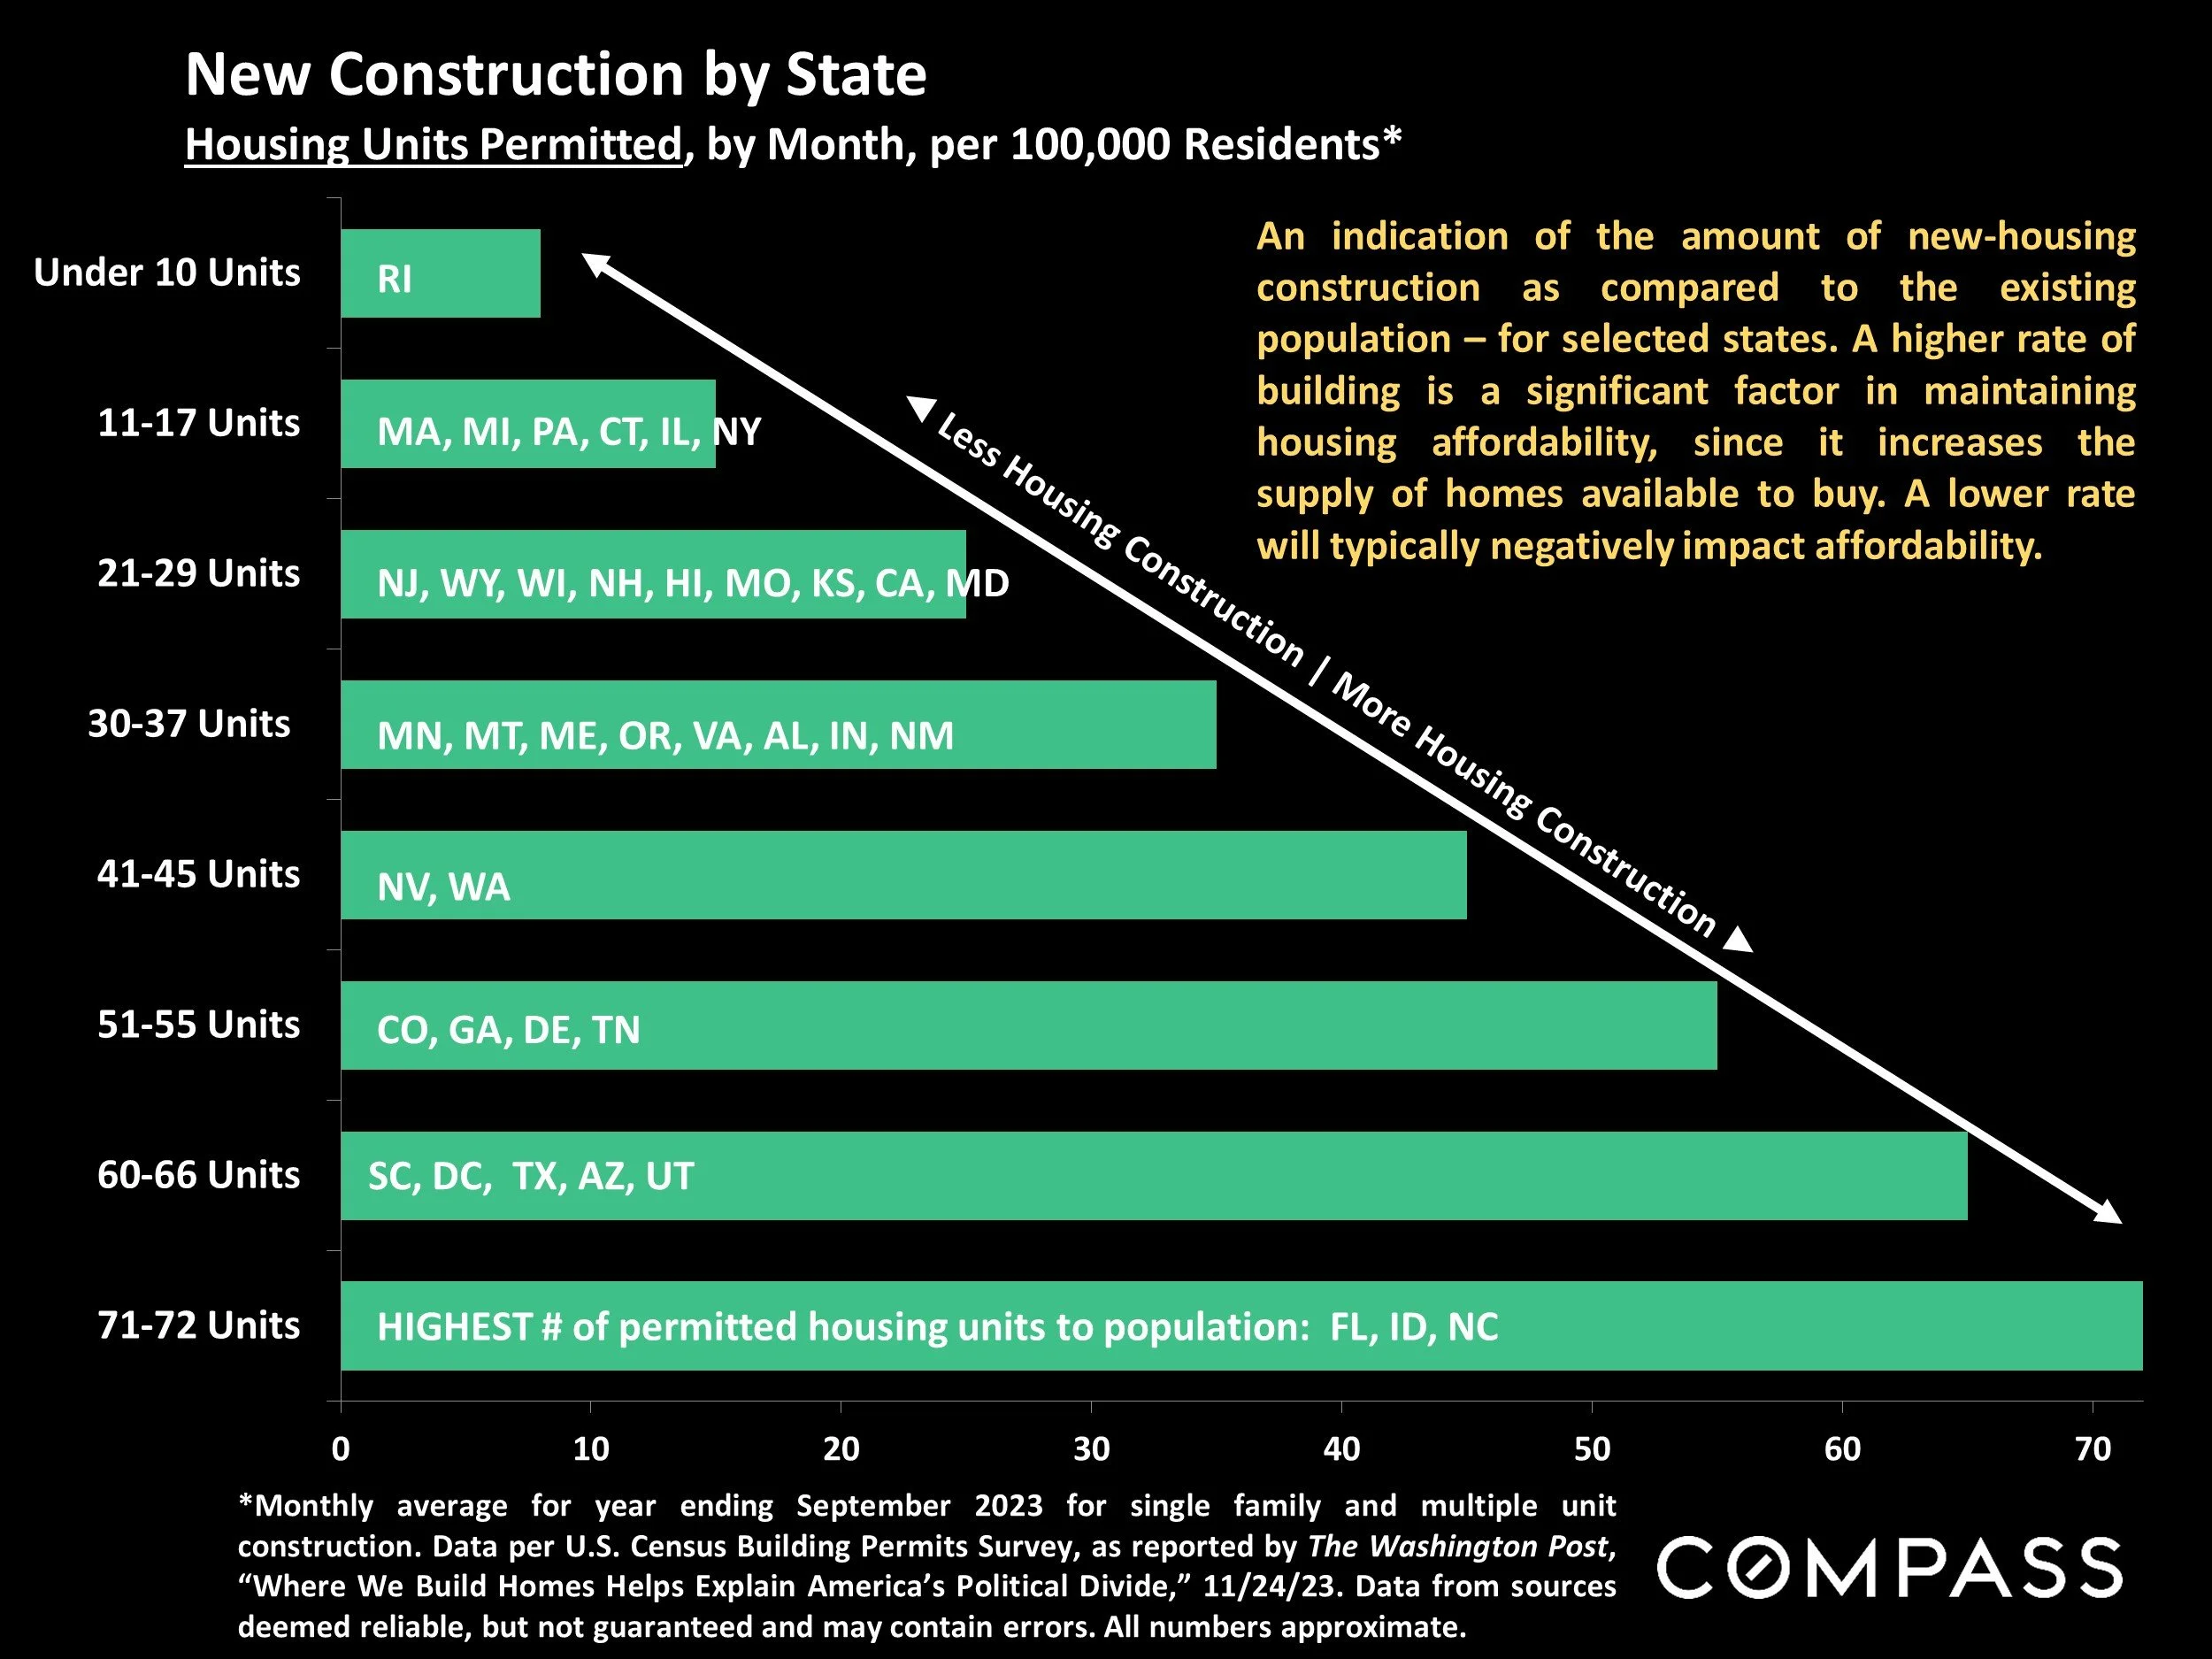
*Monthly average for year ending September 2023 for single family and multiple unit construction. Data per U.S. Census Building Permits Survey, as reported by The Washington Post, “Where We Build Homes Helps Explain America’s Political Divide,” 11/24/23. Data from sources deemed reliable, but not guaranteed and may contain errors. All numbers approximate.
An indication of the amount of new-housing construction as compared to the existing population – for selected states. A higher rate of building is a significant factor in maintaining housing affordability, since it increases the supply of homes available to buy. A lower rate will typically negatively impact affordability.
How Much Do Zoning Regulations Add to Land Cost?
Added Cost per Quarter Acre Lot, For Selected U.S. Metro Areas*
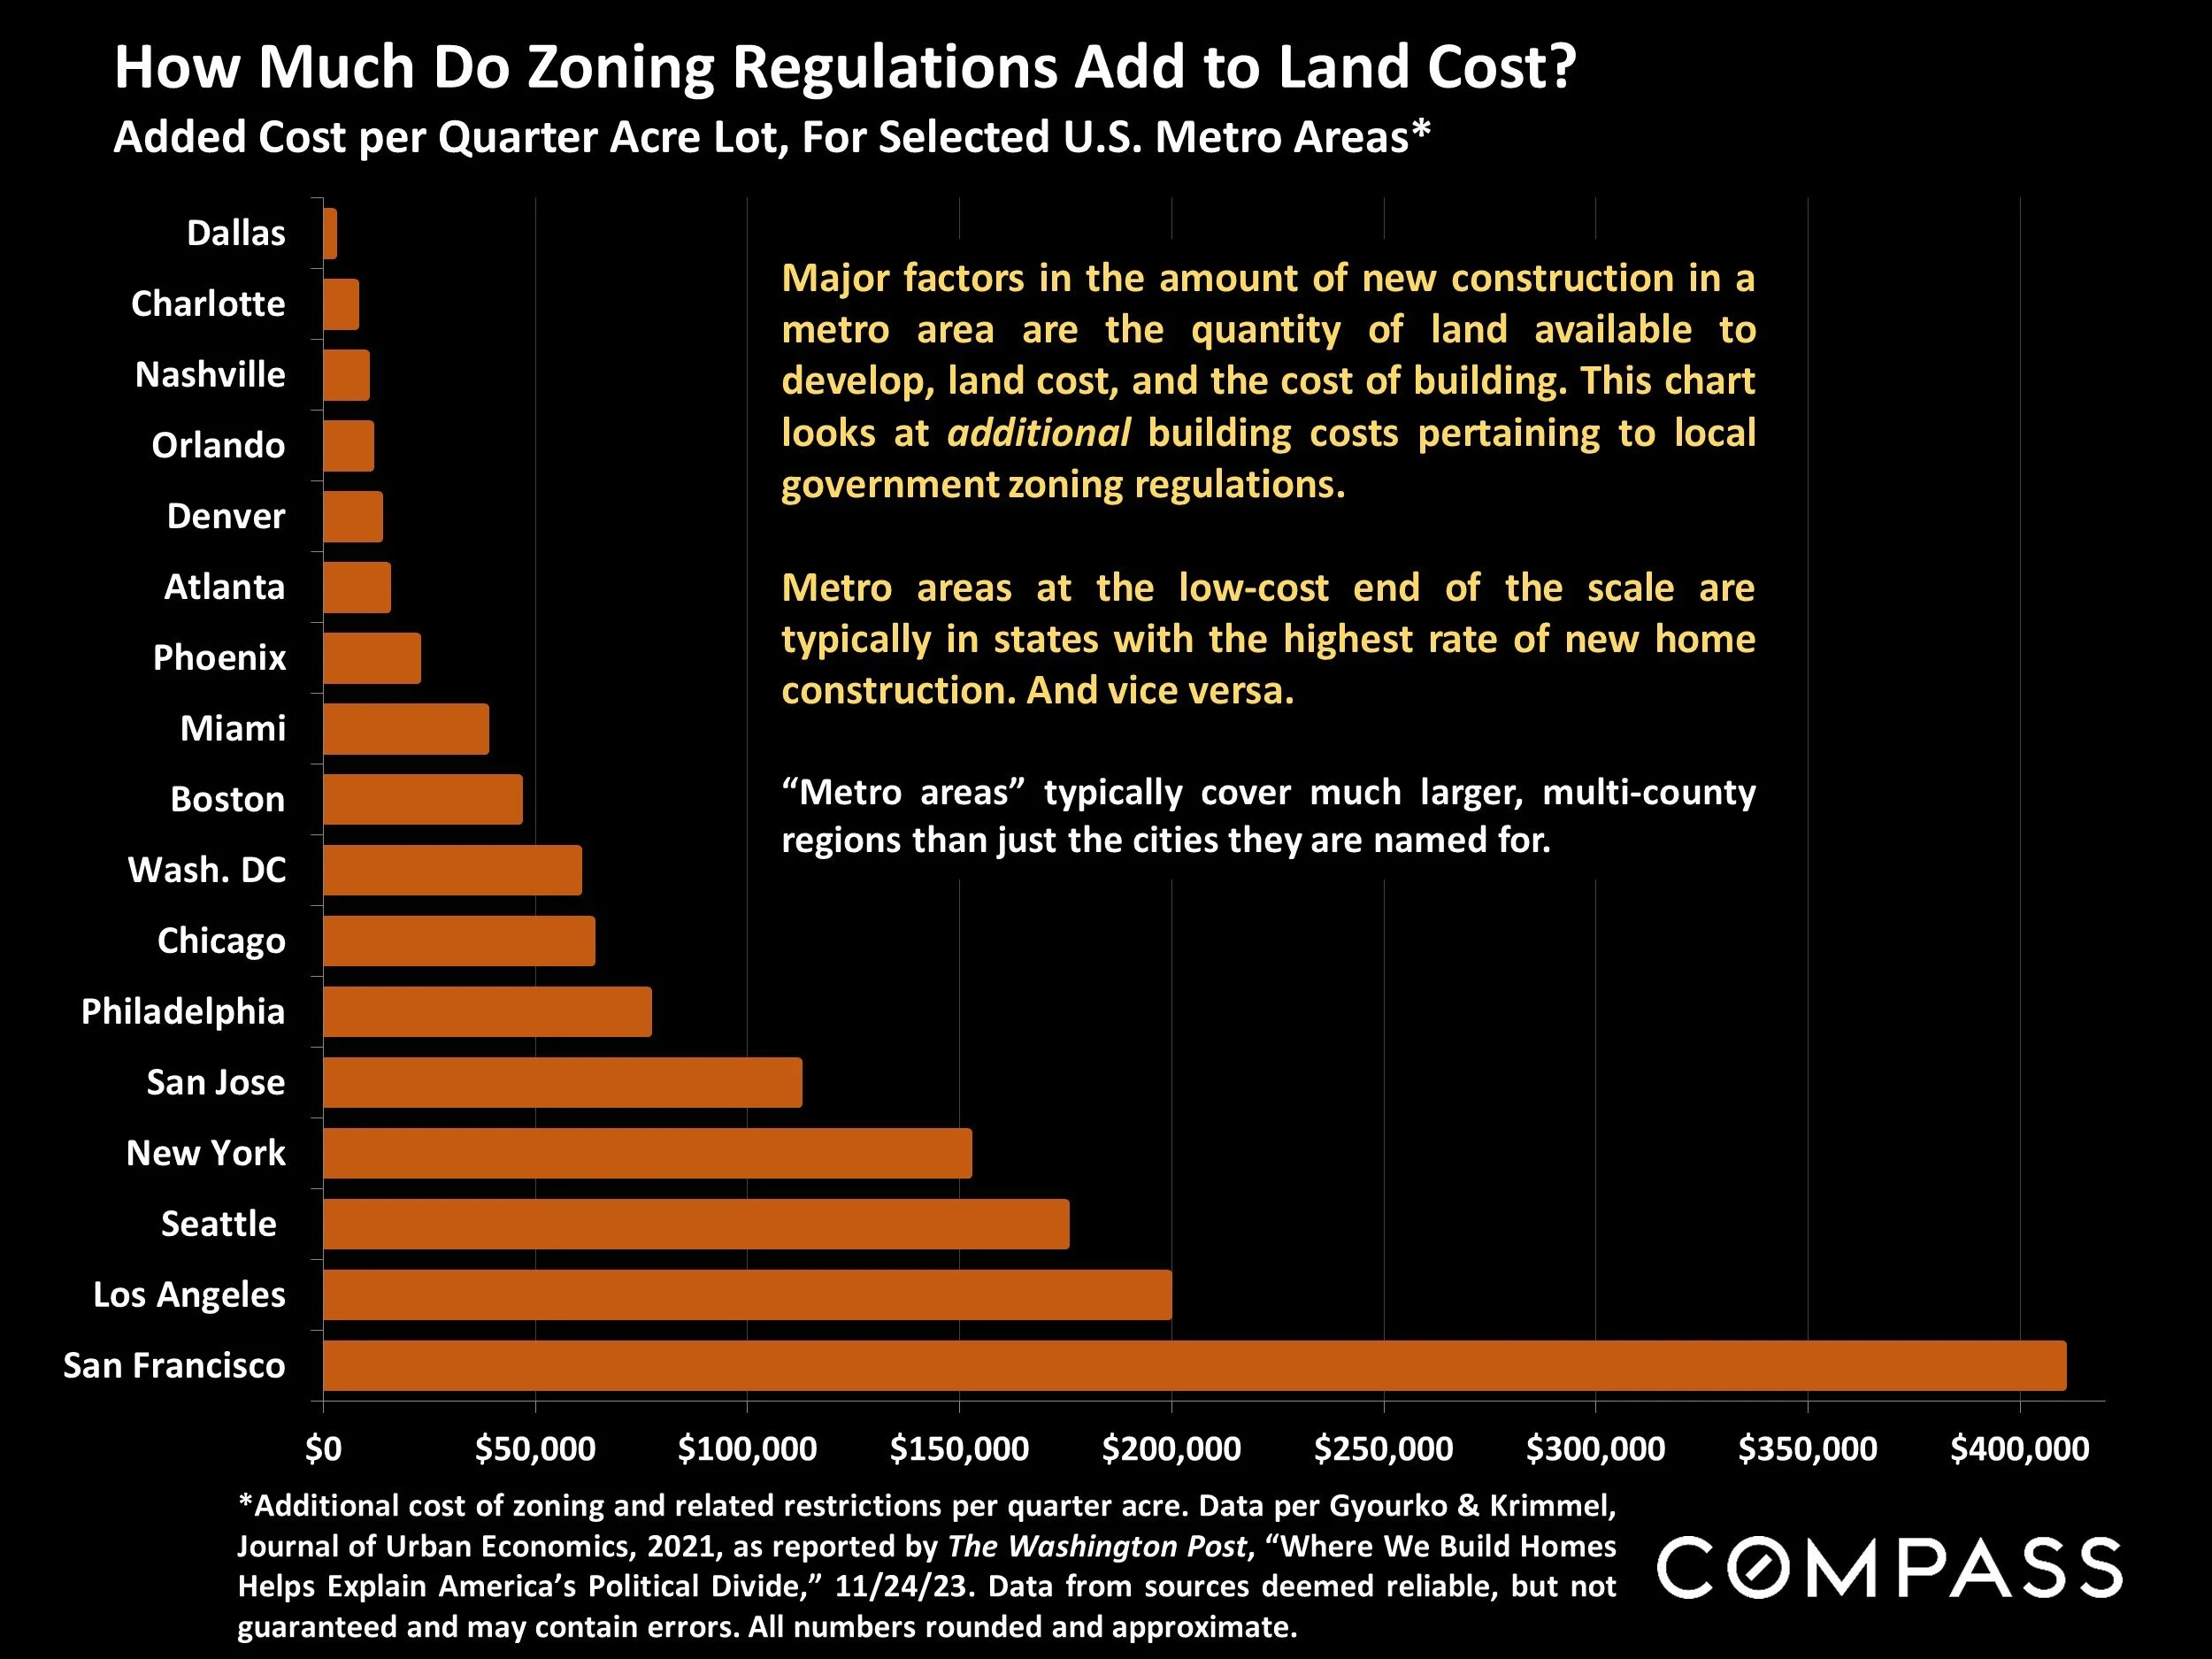
*Additional cost of zoning and related restrictions per quarter acre. Data per Gyourko & Krimmel, Journal of Urban Economics, 2021, as reported by The Washington Post, “Where We Build Homes Helps Explain America’s Political Divide,” 11/24/23. Data from sources deemed reliable, but not guaranteed and may contain errors. All numbers rounded and approximate.
*Additional cost of zoning and related restrictions per quarter acre. Data per Gyourko & Krimmel, Journal of Urban Economics, 2021, as reported by The Washington Post, “Where We Build Homes Helps Explain America’s Political Divide,” 11/24/23. Data from sources deemed reliable, but not guaranteed and may contain errors. All numbers rounded and approximate.
Major factors in the amount of new construction in a metro area are the quantity of land available to develop, land cost, and the cost of building. This chart looks at additional building costs pertaining to local government zoning regulations.
Metro areas at the low-cost end of the scale are typically in states with the highest rate of new home construction. And vice versa.
“Metro areas” typically cover much larger, multi-county regions than just the cities they are named for.
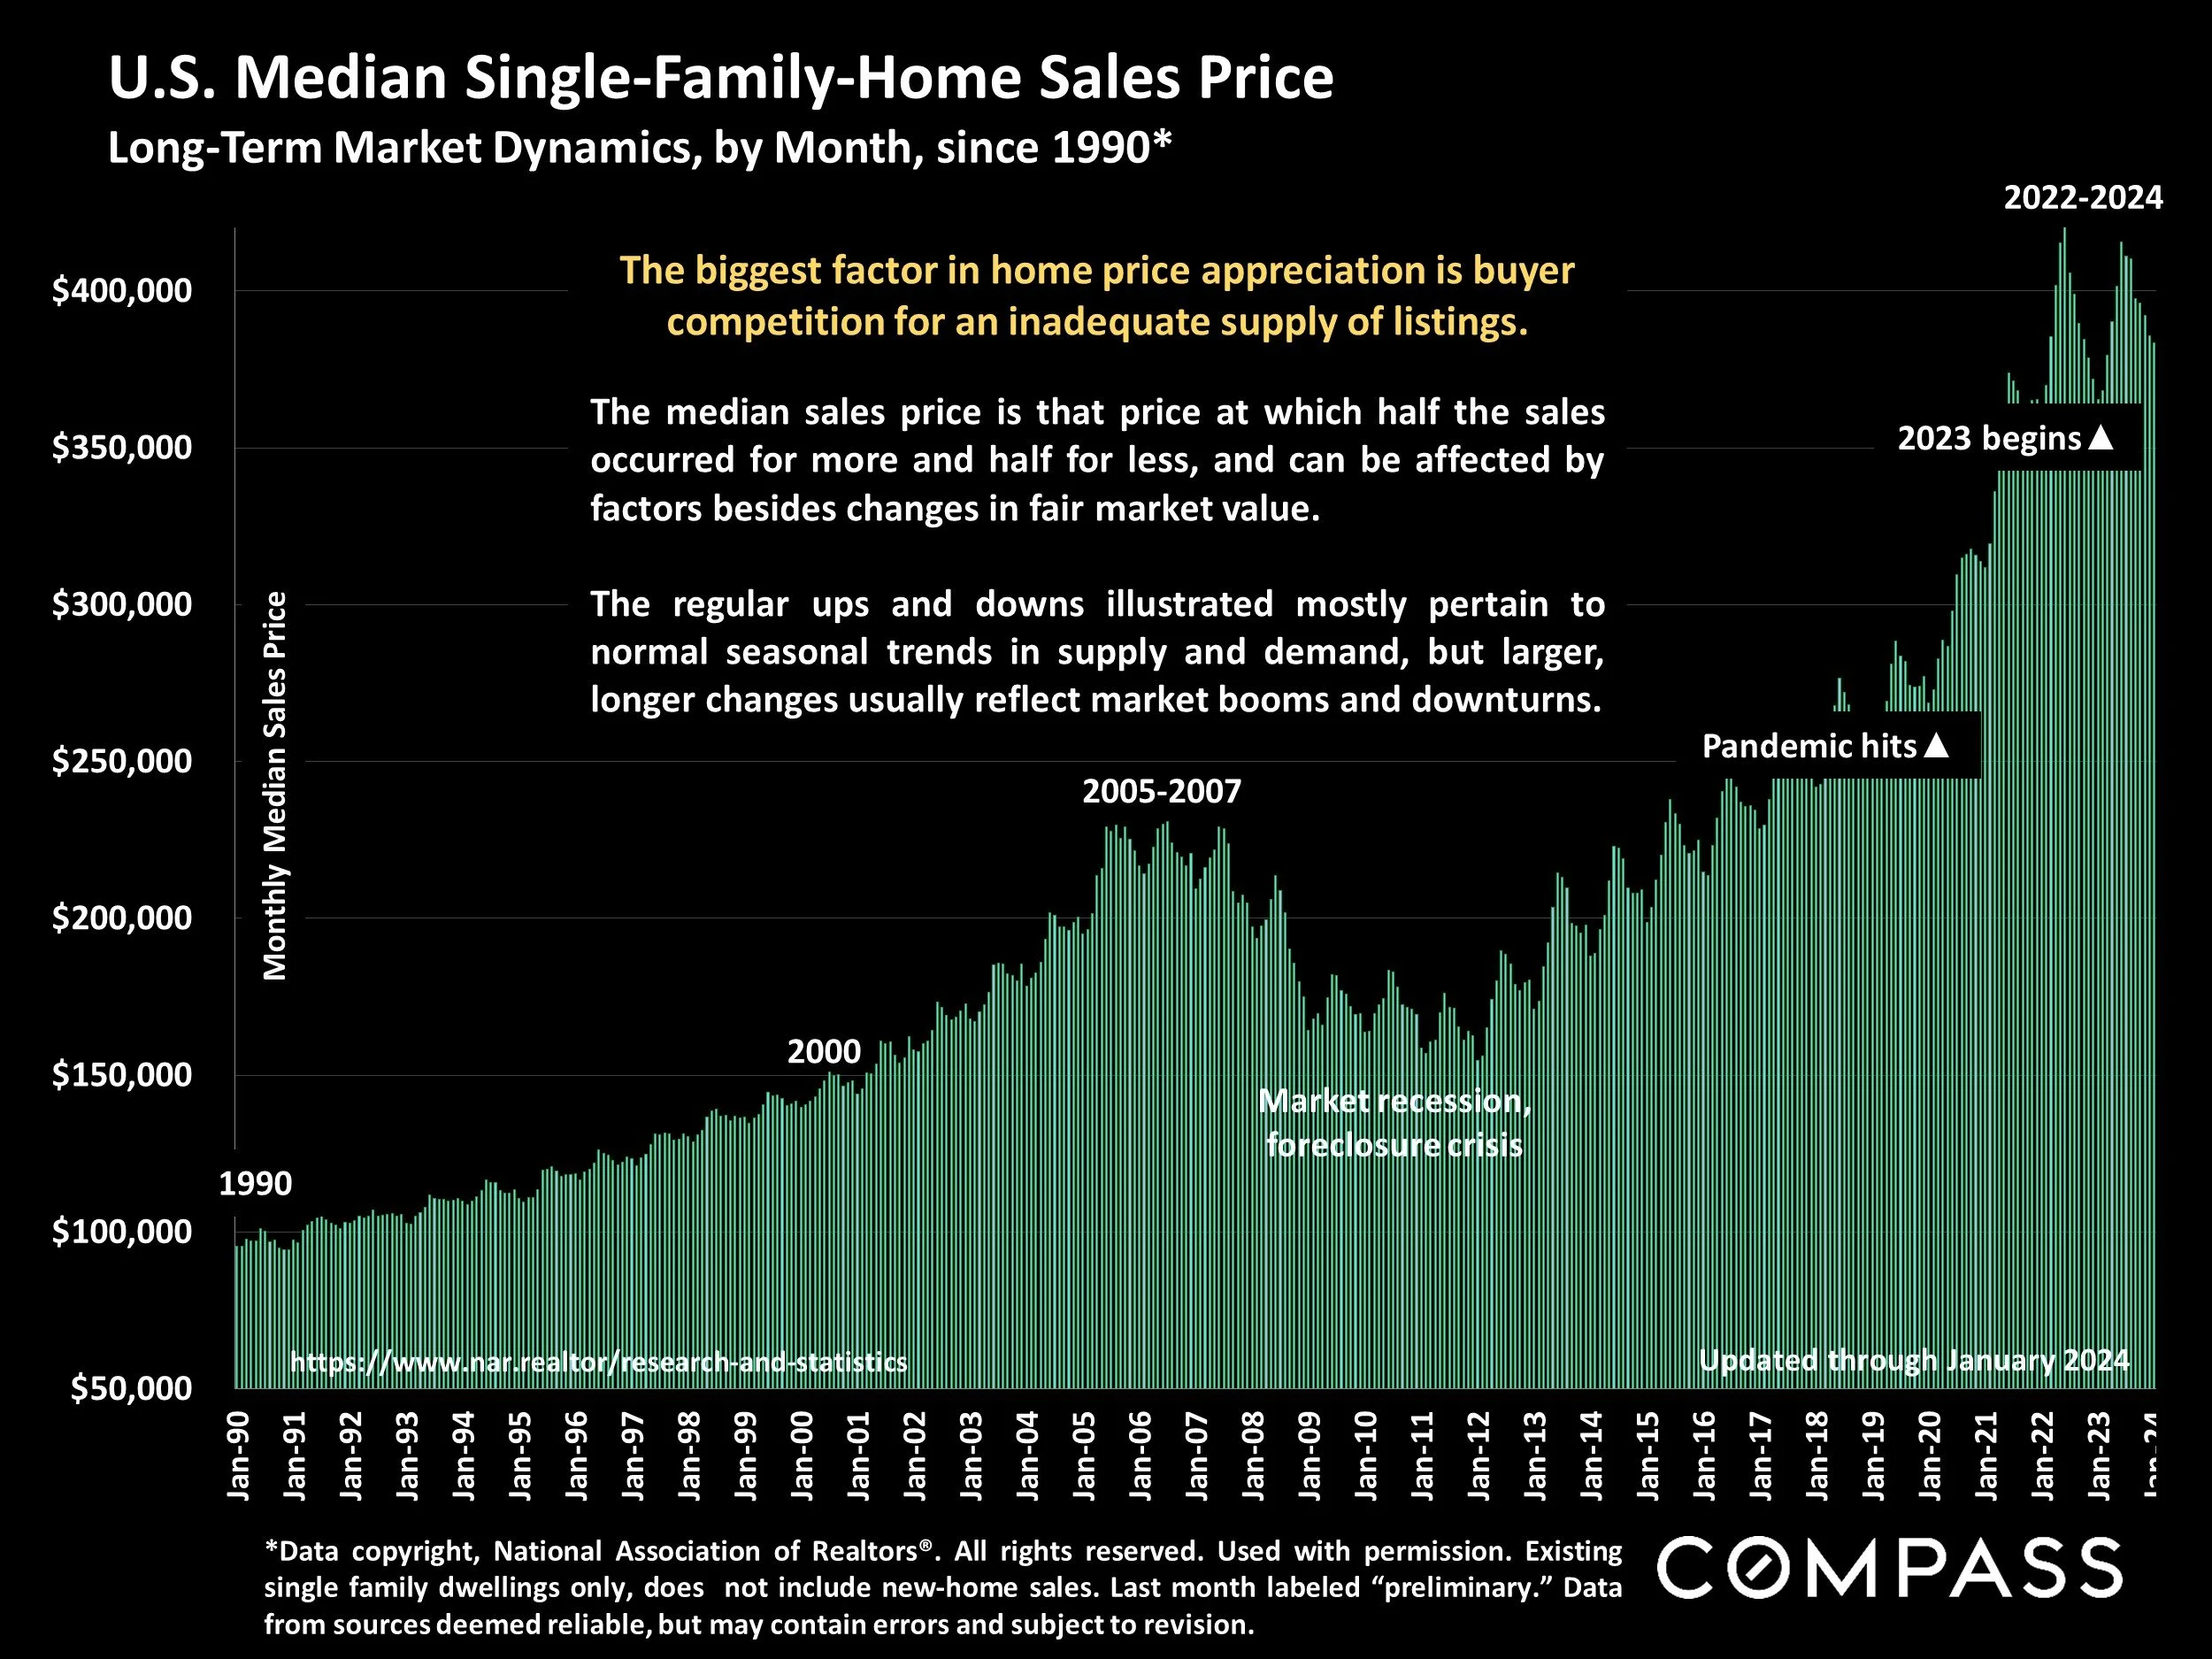
U.S. Median Single-Family-Home Sales Price
Long-Term Market Dynamics, by Month, since 1990*
*Data copyright, National Association of Realtors®. All rights reserved. Used with permission. Existing single family dwellings only, does not include new-home sales. Last month labeled “preliminary.” Data from sources deemed reliable, but may contain errors and subject to revision.
The biggest factor in home price appreciation is buyer competition for an inadequate supply of listings.
The median sales price is that price at which half the sales occurred for more and half for less, and can be affected by factors besides changes in fair market value.
The regular ups and downs illustrated mostly pertain to normal seasonal trends in supply and demand, but larger, longer changes usually reflect market booms and downturns.
Mortgage Interest Rates, Long-Term Trends since 2000
30-Year Conforming Fixed-Rate Loans, Weekly Average Readings

Freddie Mac, 30-Year Fixed Rate Mortgage Average in the United States, retrieved from Federal Reserve Bank of St. Louis; https://fred.stlouisfed.org/series/MORTGAGE30US. FHLMC: https://www.freddiemac.com/pmms. Data from sources deemed reliable but not guaranteed. All numbers approximate.
Interest rates play an enormous role in housing affordability, which is usually calculated using 3 criteria: Prevailing loan rates, median home prices, and median household income.
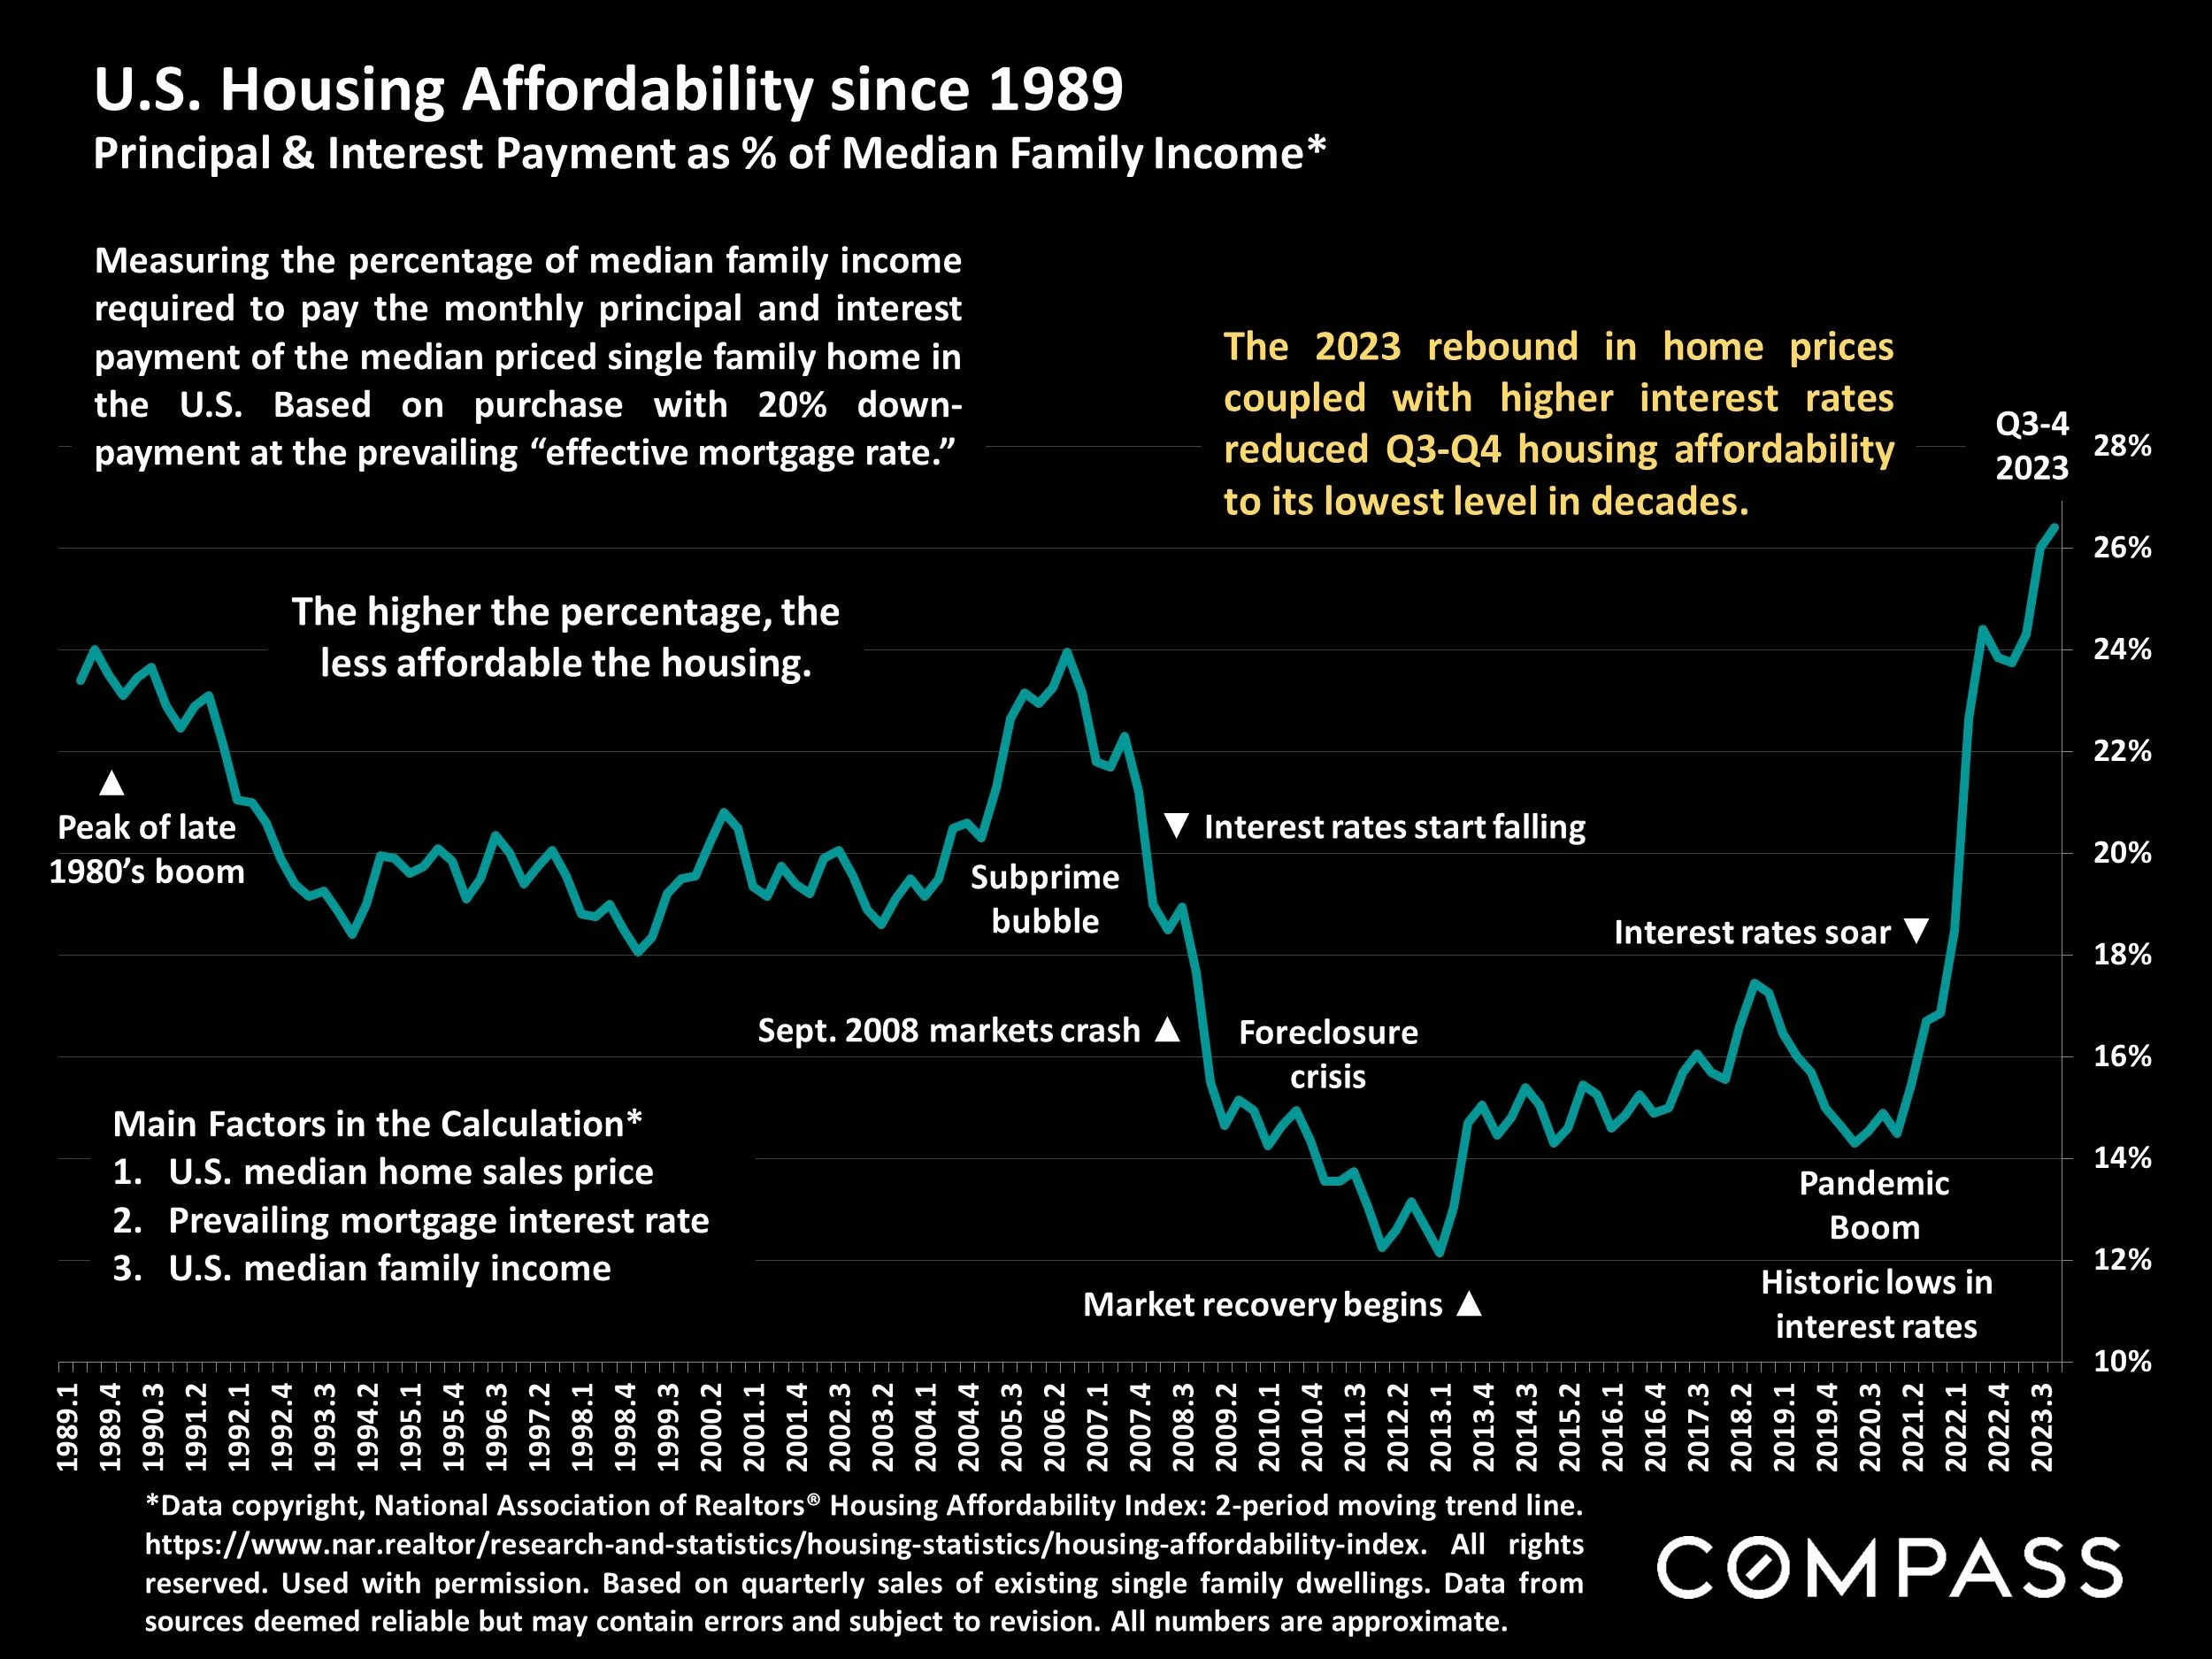
U.S. Housing Affordability since 1989
Principal & Interest Payment as % of Median Family Income*
*Data copyright, National Association of Realtors® Housing Affordability Index: 2-period moving trend line. https://www.nar.realtor/research-and-statistics/housing-statistics/housing-affordability-index. All rights reserved. Used with permission. Based on quarterly sales of existing single family dwellings. Data from sources deemed reliable but may contain errors and subject to revision. All numbers are approximate.
Measuring the percentage of median family income required to pay the monthly principal and interest payment of the median priced single family home in the U.S. Based on purchase with 20% down-payment at the prevailing “effective mortgage rate.” The higher the percentage, the less affordable the housing.
The 2023 rebound in home prices coupled with higher interest rates reduced Q3-Q4 housing affordability to its lowest level in decades.
Main Factors in the Calculation*
U.S. median home sales price
Prevailing mortgage interest rate
U.S. median family income
National data is an enormous generalization of the varying conditions in thousands of individual markets. Data from a number of sources deemed reliable – including the National Association of Realtors, U.S. Census data, the Federal Reserve Bank, CoreLogic, Realtor.com, the Joint Center for Housing Studies at Harvard & the National Home Builders Association – but may contain errors and subject to revision. All numbers approximate.
National statistics are generalities, essentially summaries of widely disparate data generated by thousands of unique, individual sales across an enormous variety of different markets, occurring within different time periods. They are best seen not as precise measurements, but as broad, comparative indicators, with reasonable margins of error. Most listing and sales data derives from regional multi-listing services (MLS), but not all listings or sales are reported to MLS and these won’t be reflected in the data. “Homes” signifies real-property as delineated in each analysis: single-household housing units, condos, co-ops, townhouses, new-construction homes, and so on. Data from sources deemed reliable, but may contain errors and subject to revision. All numbers to be considered approximate.
Compass is a real estate broker licensed within each of the states in which it practices. This report has been prepared solely for information purposes. The information herein is based on or derived from information generally available to the public and/or from sources believed to be reliable. No representation or warranty can be given with respect to the accuracy or completeness of the information. Compass disclaims any and all liability relating to this report, including without limitation any express or implied representations or warranties for statements contained in, and omissions from, the report. Nothing contained herein is intended to be or should be read as any regulatory, legal, tax, accounting or other advice and Compass does not provide such advice. All opinions are subject to change without notice. Compass makes no representation regarding the accuracy of any statements regarding any references to the laws, statutes or regulations of any state are those of the author(s). Past performance is no guarantee of future results.